the biggest-ever study of the countries and …
TRANSCRIPT

UNIVERSUM GLOBAL WORKFORCE HAPPINESS INDEX | 2016 1
Universum Global Workforce Happiness Index | 2016THE BIGGEST-EVER STUDY OF THE COUNTRIES AND INDUSTRIES WITH THE MOST SATISFIED, LOYAL WORKERS.

UNIVERSUM GLOBAL WORKFORCE HAPPINESS INDEX | 2016 2
Tracking employee happiness is a barometer of your organization’s overall health – as important to forecasting future innovation and growth as traditional financial metrics. Universum surveyed 250,000 professionals in 55 markets to set country-level and industry-level benchmarks.
HOW DOES YOUR COMPANY COMPARE TO ITS PEERS?It’s time to take a data-driven approach to attracting and retaining top talent.
HOME
INTRODUCTION
WHY HAPPINESS?
WORKER HAPPINESS AS A BAROMETER OF ENTERPRISE HEALTH
GLOBAL WORKFORCE HAPPINESS QUADRANT
RECOMMENDATIONS FOR EMPLOYERS
HOW HAPPY ARE YOUR EMPLOYEES?
UNIVERSUM GLOBAL WORKFORCE HAPPINESS INDEX | 2016 3
What is the Global Workforce Happiness Index?
A scoring system that combines worker satisfaction, a worker’s willingness to recommend their current employer, and their likelihood of switching jobs in the near future. Altogether, it is a measure of a worker’s happiness in their job and career.
Why measure workforce happiness?
Your ability to retain top talent depends not simply on your employees’ level of satisfaction, but how it compares to peers in other organizations. A negative gap may signal your employees are ripe for poaching. Tracking employee happiness is a barometer of your organization’s overall heath – as important to forecasting future growth as financial metrics (e.g. cost of capital) or sales metrics (e.g. rate of new customer acquisition).
Closing the Happiness Gap
Use the Happiness Index to measure how your organization compares to talent competitors; then analyze the specific drivers that push open that gap. Which can you control? How quickly can you do so?
HOME
INTRODUCTION
WHY HAPPINESS?
WORKER HAPPINESS AS A BAROMETER OF ENTERPRISE HEALTH
GLOBAL WORKFORCE HAPPINESS QUADRANT
RECOMMENDATIONS FOR EMPLOYERS
HOW HAPPY ARE YOUR EMPLOYEES?
UNIVERSUM GLOBAL WORKFORCE HAPPINESS INDEX | 2016
UNIVERSUM GLOBAL WORKFORCE HAPPINESS INDEX | 2016 4
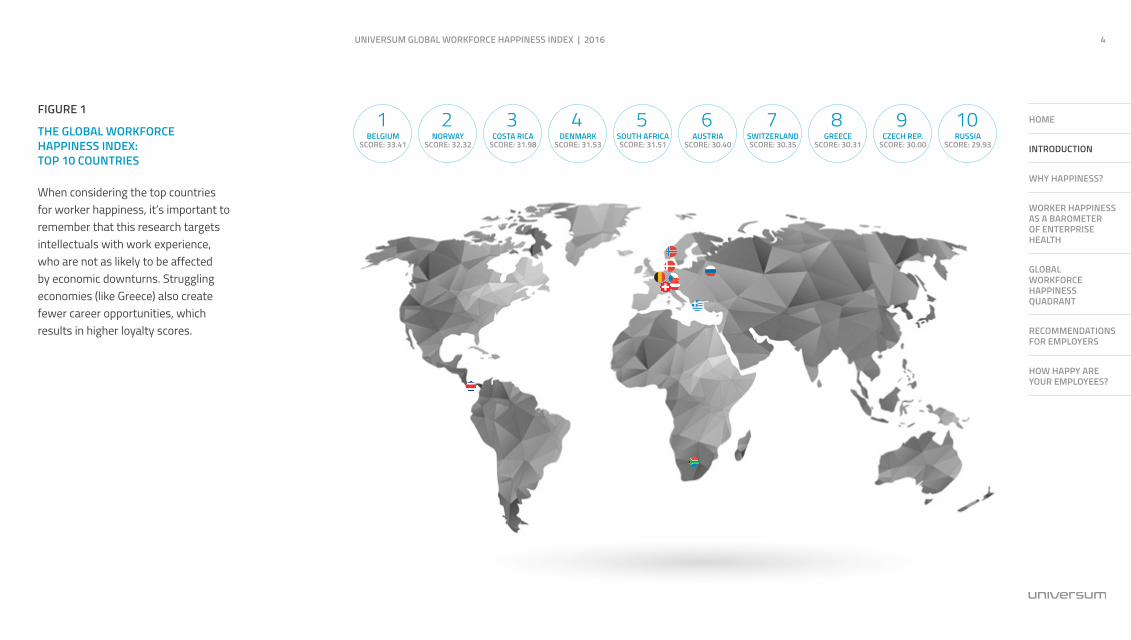
FIGURE 1
THE GLOBAL WORKFORCE HAPPINESS INDEX: TOP 10 COUNTRIES
BELGIUMSCORE: 33.41
1NORWAY
SCORE: 32.32
2COSTA RICA
SCORE: 31.98
3DENMARK
SCORE: 31.53
4SOUTH AFRICASCORE: 31.51
5AUSTRIA
SCORE: 30.40
6SWITZERLANDSCORE: 30.35
7GREECE
SCORE: 30.31
8CZECH REP.
SCORE: 30.00
9RUSSIA
SCORE: 29.93
10
5
HOME
INTRODUCTION
WHY HAPPINESS?
WORKER HAPPINESS AS A BAROMETER OF ENTERPRISE HEALTH
GLOBAL WORKFORCE HAPPINESS QUADRANT
RECOMMENDATIONS FOR EMPLOYERS
HOW HAPPY ARE YOUR EMPLOYEES?
When considering the top countries for worker happiness, it’s important to remember that this research targets intellectuals with work experience, who are not as likely to be affected by economic downturns. Struggling economies (like Greece) also create fewer career opportunities, which results in higher loyalty scores.

UNIVERSUM GLOBAL WORKFORCE HAPPINESS INDEX | 2016 5
Why happiness?
5
HOME
INTRODUCTION
WHY HAPPINESS?
WORKER HAPPINESS AS A BAROMETER OF ENTERPRISE HEALTH
GLOBAL WORKFORCE HAPPINESS QUADRANT
RECOMMENDATIONS FOR EMPLOYERS
HOW HAPPY ARE YOUR EMPLOYEES?
UNIVERSUM GLOBAL WORKFORCE HAPPINESS INDEX | 2016 6
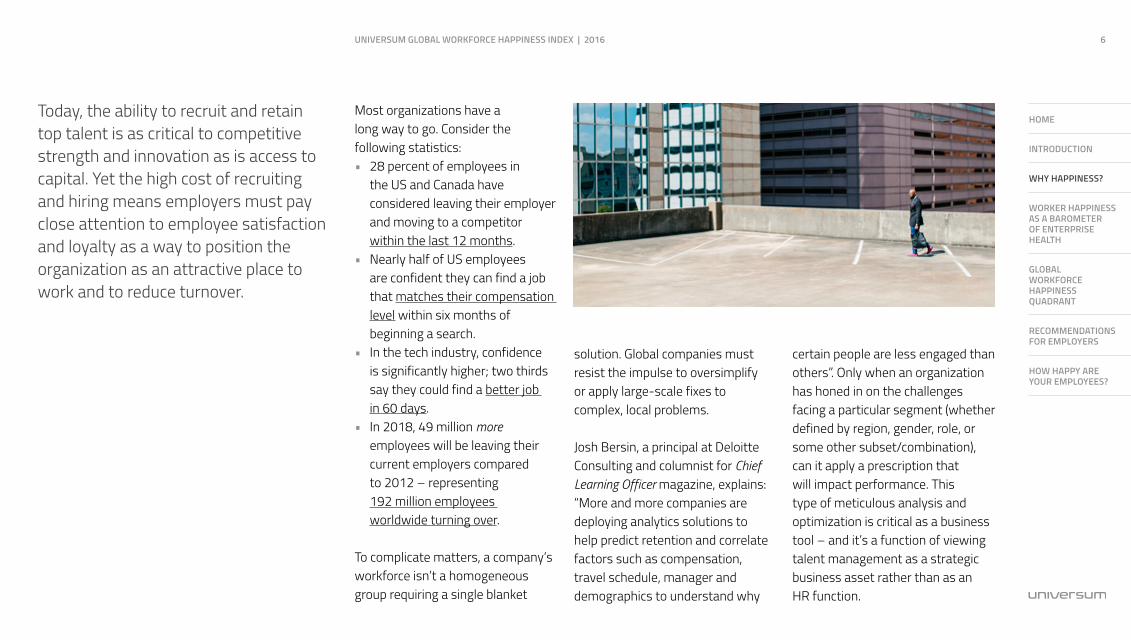
Most organizations have a long way to go. Consider the following statistics: • 28 percent of employees in
the US and Canada have considered leaving their employer and moving to a competitor within the last 12 months.
• Nearly half of US employees are confident they can find a job that matches their compensation level within six months of beginning a search.
• In the tech industry, confidence is significantly higher; two thirds say they could find a better job in 60 days.
• In 2018, 49 million more employees will be leaving their current employers compared to 2012 – representing 192 million employees worldwide turning over.
To complicate matters, a company’s workforce isn’t a homogeneous group requiring a single blanket
Today, the ability to recruit and retain top talent is as critical to competitive strength and innovation as is access to capital. Yet the high cost of recruiting and hiring means employers must pay close attention to employee satisfaction and loyalty as a way to position the organization as an attractive place to work and to reduce turnover.
solution. Global companies must resist the impulse to oversimplify or apply large-scale fixes to complex, local problems.
Josh Bersin, a principal at Deloitte Consulting and columnist for Chief Learning Officer magazine, explains: “More and more companies are deploying analytics solutions to help predict retention and correlate factors such as compensation, travel schedule, manager and demographics to understand why
certain people are less engaged than others”. Only when an organization has honed in on the challenges facing a particular segment (whether defined by region, gender, role, or some other subset/combination), can it apply a prescription that will impact performance. This type of meticulous analysis and optimization is critical as a business tool – and it’s a function of viewing talent management as a strategic business asset rather than as an HR function.
HOME
INTRODUCTION
WHY HAPPINESS?
WORKER HAPPINESS AS A BAROMETER OF ENTERPRISE HEALTH
GLOBAL WORKFORCE HAPPINESS QUADRANT
RECOMMENDATIONS FOR EMPLOYERS
HOW HAPPY ARE YOUR EMPLOYEES?
UNIVERSUM GLOBAL WORKFORCE HAPPINESS INDEX | 2016 7
Worker happiness as a barometer of enterprise health
7
HOME
INTRODUCTION
WHY HAPPINESS?
WORKER HAPPINESS AS A BAROMETER OF ENTERPRISE HEALTH
GLOBAL WORKFORCE HAPPINESS QUADRANT
RECOMMENDATIONS FOR EMPLOYERS
HOW HAPPY ARE YOUR EMPLOYEES?
UNIVERSUM GLOBAL WORKFORCE HAPPINESS INDEX | 2016 8
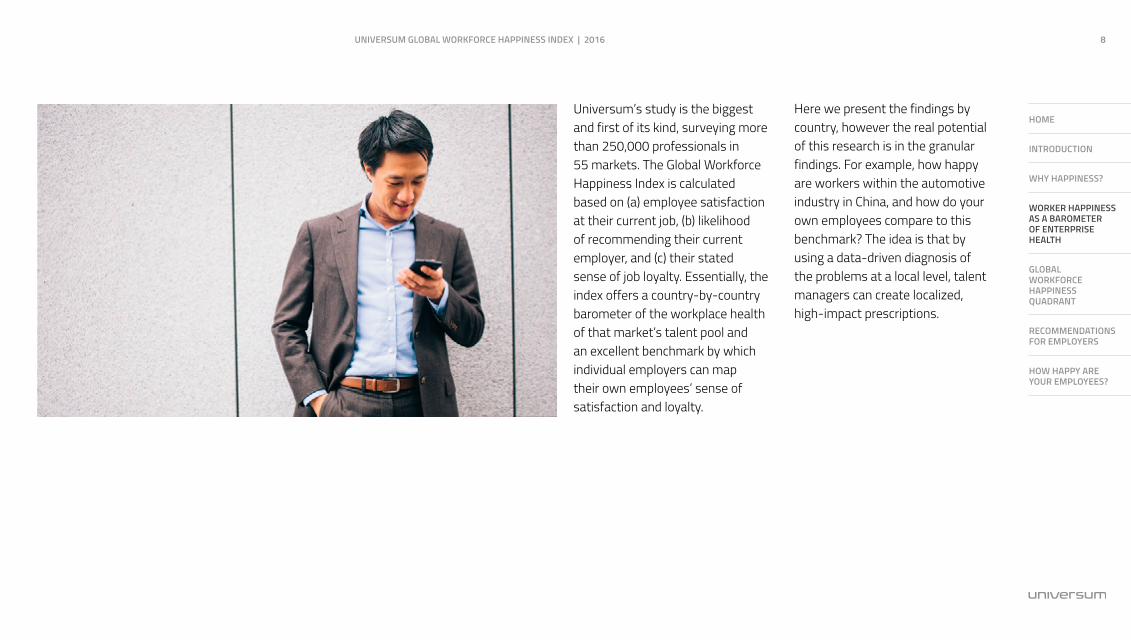
Universum’s study is the biggest and first of its kind, surveying more than 250,000 professionals in 55 markets. The Global Workforce Happiness Index is calculated based on (a) employee satisfaction at their current job, (b) likelihood of recommending their current employer, and (c) their stated sense of job loyalty. Essentially, the index offers a country-by-country barometer of the workplace health of that market’s talent pool and an excellent benchmark by which individual employers can map their own employees’ sense of satisfaction and loyalty.
Here we present the findings by country, however the real potential of this research is in the granular findings. For example, how happy are workers within the automotive industry in China, and how do your own employees compare to this benchmark? The idea is that by using a data-driven diagnosis of the problems at a local level, talent managers can create localized, high-impact prescriptions.
HOME
INTRODUCTION
WHY HAPPINESS?
WORKER HAPPINESS AS A BAROMETER OF ENTERPRISE HEALTH
GLOBAL WORKFORCE HAPPINESS QUADRANT
RECOMMENDATIONS FOR EMPLOYERS
HOW HAPPY ARE YOUR EMPLOYEES?
UNIVERSUM GLOBAL WORKFORCE HAPPINESS INDEX | 2016 9
Global Workforce Happiness Quadrant
9
HOME
INTRODUCTION
WHY HAPPINESS?
WORKER HAPPINESS AS A BAROMETER OF ENTERPRISE HEALTH
GLOBAL WORKFORCE HAPPINESS QUADRANT
RECOMMENDATIONS FOR EMPLOYERS
HOW HAPPY ARE YOUR EMPLOYEES?

UNIVERSUM GLOBAL WORKFORCE HAPPINESS INDEX | 2016 10
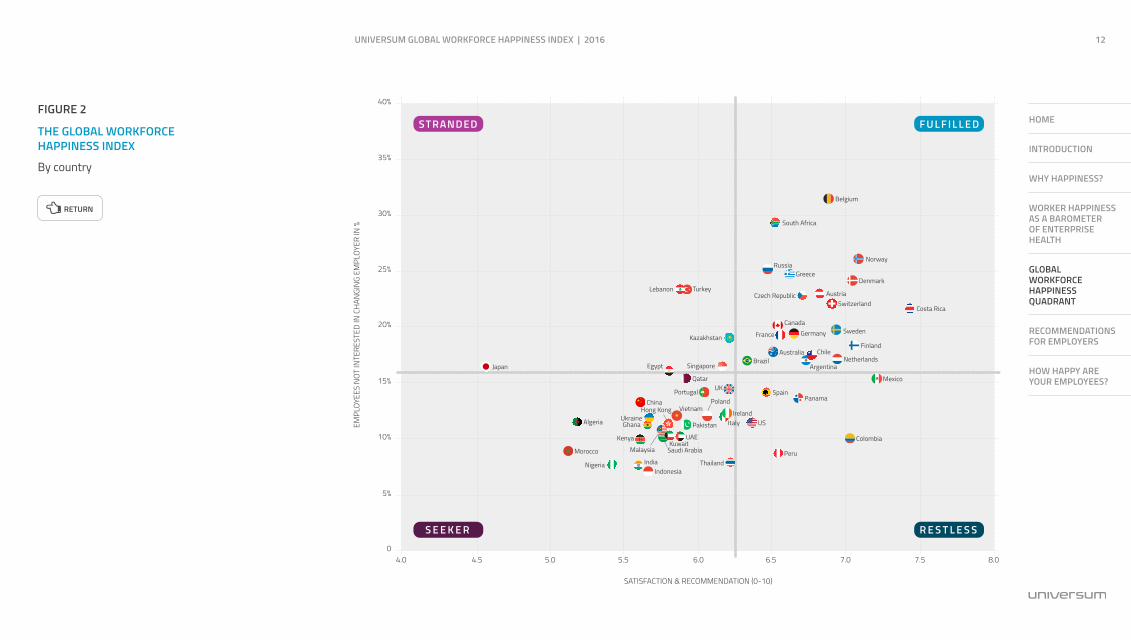
First let’s focus on the implications of each quadrant.
STRANDED: In the stranded category are those employees who are dissatisfied in their current jobs, but are unmotivated or unwilling to make a change. This is often due to macro-economic influences, such as high unemployment and low opportunity to advance in a chosen field, but stranded employees also exist within regions with high employment prospects.
SEEKER: Seekers are those dissatisfied at work and looking for a change. Seekers are motivated to change and may already have one foot out the door. Seekers are less likely to recommend your company as an employer to those in their network, meaning post-departure seekers are unlikely to recommend colleagues or return in the future.
Universum’s Global Workforce Happiness Quadrant helps visualize the challenges and opportunities by region.
FULFILLED
SEEKER
STRANDED
RESTLESS
RESTLESS: Restless employees require immediate attention. These are workers who are satisfied at work and even likely to recommend a company as a place of employment, but are also open to changing jobs.
FULFILLED: Employees in this category are satisfied, feel positive about your company as a place of work and are not interested in changing jobs. These are your stable, loyal employees; however employers should never assume fulfilled employees will stay this way.
The quadrant shows the average index score for each country. FIGURE 2
Why does the country score matter for organizations? It’s important that companies understand (a) where different segments of their workforce lie on this quadrant, and
HOME
INTRODUCTION
WHY HAPPINESS?
WORKER HAPPINESS AS A BAROMETER OF ENTERPRISE HEALTH
GLOBAL WORKFORCE HAPPINESS QUADRANT
RECOMMENDATIONS FOR EMPLOYERS
HOW HAPPY ARE YOUR EMPLOYEES?

UNIVERSUM GLOBAL WORKFORCE HAPPINESS INDEX | 2016 11
INDUSTRY HAPPINESS INDEX
In addition to rankings by country, Universum also examines happiness – a score that combines worker satisfaction, loyalty and willingness to recommend an employer – by industry. Companies can examine their own workers’ happiness scores related to the industry average. A positive gap means your company is more likely to retain employees. A negative gap requires immediate attention.
(b) how those segments compare to local markets. For example, a technology company in Germany relies heavily on the work of a team of software engineers in that country. The ability to attract and retain engineers to work in Hamburg and Munich is not simply helpful, it’s mission critical in order for that organization to stay out in front of competitors. The company wants to know (a) how do engineers inside our organization compare to engineers in Germany, and (b) what does this tell us about our ability to remain competitive over the next 18 months?
Companies must also pay close attention to differences by generation. Research from Universum shows roughly a third
TOP 5 ‘HAPPY’ INDUSTRIESLegal servicesAerospace & defenceEducational & scientific institutionsInsuranceTechnology, hardware & equipment
BOTTOM 5 ‘HAPPY’ INDUSTRIESHealthcare servicesMedia & advertisingTourismEngineering & manufacturingRetail
of younger professionals worry they won’t find a job that matches their personality – a critical issue for employers to consider when recruiting young professionals. And 16 percent more of Generation Z than Gen Y thinks this way. How do these attitudes play out in the workplace and what can employers do to compensate? If an organization notices attrition within a particular subset – say 20-something product designers – they must ask, what exactly drives attrition in that group and how does it differ from older employees? Again, a data-driven approach in which organizations measure results and optimize strategy on a rolling basis defines best in class organizations.
HOME
INTRODUCTION
WHY HAPPINESS?
WORKER HAPPINESS AS A BAROMETER OF ENTERPRISE HEALTH
GLOBAL WORKFORCE HAPPINESS QUADRANT
RECOMMENDATIONS FOR EMPLOYERS
HOW HAPPY ARE YOUR EMPLOYEES?
UNIVERSUM GLOBAL WORKFORCE HAPPINESS INDEX | 2016 12
FIGURE 2
THE GLOBAL WORKFORCE HAPPINESS INDEX
By country
RETURN
HOME
INTRODUCTION
WHY HAPPINESS?
WORKER HAPPINESS AS A BAROMETER OF ENTERPRISE HEALTH
GLOBAL WORKFORCE HAPPINESS QUADRANT
RECOMMENDATIONS FOR EMPLOYERS
HOW HAPPY ARE YOUR EMPLOYEES?
40%
EMPL
OYEE
S NO
T IN
TERE
STED
IN C
HANG
ING
EMPL
OYER
IN %
SATISFACTION & RECOMMENDATION (0-10)
35%
30%
25%
20%
15%
10%
5%
04.0 4.5 5.0 5.5 6.0 6.5 7.0 7.5 8.0
Belgium
South Africa
RussiaGreece
Norway
Denmark
Czech Republic AustriaSwitzerland
Costa Rica
Canada
France Germany
BrazilAustralia Chile
Argentina
Finland
Sweden
Mexico
SpainPanama
US
Peru
ColombiaKenya
Saudi ArabiaKuwait
UAE
Thailand
Lebanon Turkey
Kazakhstan
SingaporeEgyptJapan
IndonesiaIndiaNigeria
Algeria
Morocco
Pakistan
Malaysia
Qatar
Portugal UK
IrelandItaly
PolandChinaVietnam
UkraineGhana
Hong Kong
Netherlands
STRANDED F U L F I L L E D
S E E K E R R E S T L E S S

UNIVERSUM GLOBAL WORKFORCE HAPPINESS INDEX | 2016 13
Recommendations for employers
13
HOME
INTRODUCTION
WHY HAPPINESS?
WORKER HAPPINESS AS A BAROMETER OF ENTERPRISE HEALTH
GLOBAL WORKFORCE HAPPINESS QUADRANT
RECOMMENDATIONS FOR EMPLOYERS
HOW HAPPY ARE YOUR EMPLOYEES?
UNIVERSUM GLOBAL WORKFORCE HAPPINESS INDEX | 2016 14
1. BENCHMARK YOUR EMPLOYEES AGAINST THEIR COUNTRY HAPPINESS INDEX AND INDUSTRY INSIDER RANKING. First, find out how your organization compares to those within your industry and country. How large is the gap? Does it affect your ability to recruit and retain employees?
2. ANALYZE FINDINGS TO UNCOVER KEY DRIVERS. Dig deeper. Some portion of your organization’s score is driven by macro-economic conditions – issues largely outside of your control. High unemployment will push talent into the stranded category. Excellent government-sponsored benefits for work-life balance will help pull up your overall score. That’s why it’s critical for organizations not simply to determine scores for their organization or divisions, but how those scores compare to like-organizations – something we call the Happiness Gap.
For example, Deloitte Consulting recounts the case of a pharmaceutical company in China. Scientists were leaving the company in droves, yet an annual engagement survey could not diagnose the problem. Ultimately, the company analyzed key variables across all departures and determined that compensation was of outsized importance for Chinese scientists compared to scientists in other parts of the world. Scientists employed by this organization expected significant increases each year, and without those, they were poached by competing organizations. Measuring the Happiness Gap of your employees, country-by-country, serves as an early warning system for your organization; use it to drill down and understand the variables that cause your employees to feel differently from their peers inside other organizations and
what your company can do to close that gap. Remember: your talent competitors are those organizations that are vying for the same talent you are. Talent competitors are not necessarily your direct competitors.
3. SEPARATE “ATTRACTION DRIVERS” FROM “RETENTION DRIVERS”. Once an employer figures out which factors can be controlled, decide which of these are recruiting drivers vs. retention drivers. Research from Towers Watson indicates workers are attracted to a particular employer for base pay and job security, but development opportunities and confidence in senior leadership become critically important once hired. Does your organization distinguish between the two states? Amazon offers an interesting case study – and an extreme example – of the danger of not tracking the
HOME
INTRODUCTION
WHY HAPPINESS?
WORKER HAPPINESS AS A BAROMETER OF ENTERPRISE HEALTH
GLOBAL WORKFORCE HAPPINESS QUADRANT
RECOMMENDATIONS FOR EMPLOYERS
HOW HAPPY ARE YOUR EMPLOYEES?
UNIVERSUM GLOBAL WORKFORCE HAPPINESS INDEX | 2016 15
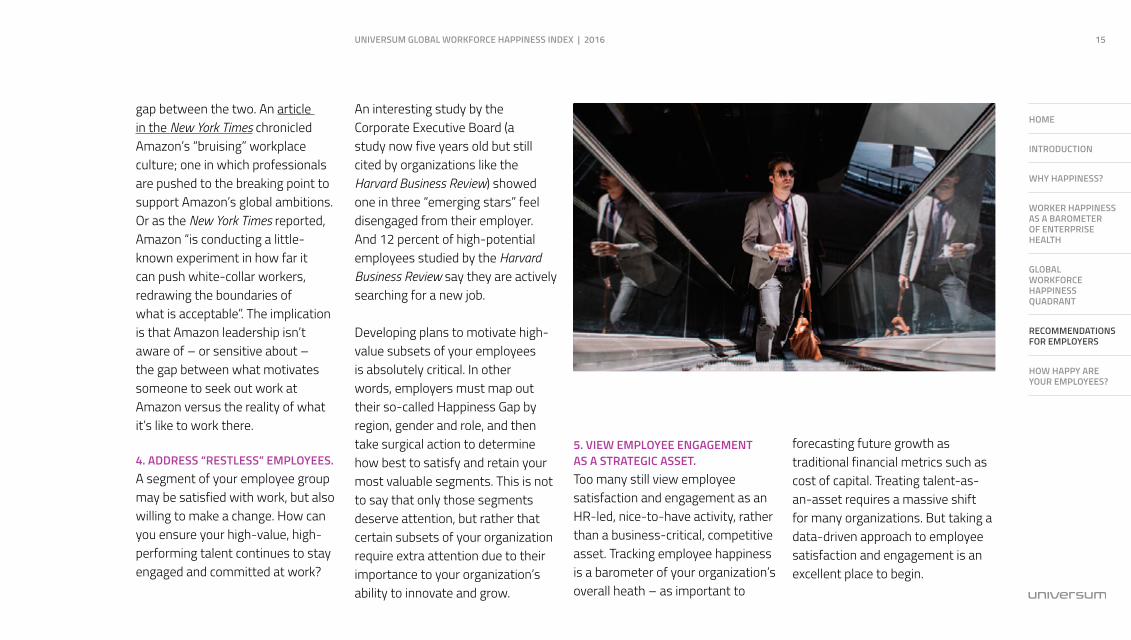
gap between the two. An article in the New York Times chronicled Amazon’s “bruising” workplace culture; one in which professionals are pushed to the breaking point to support Amazon’s global ambitions. Or as the New York Times reported, Amazon “is conducting a little-known experiment in how far it can push white-collar workers, redrawing the boundaries of what is acceptable”. The implication is that Amazon leadership isn’t aware of – or sensitive about – the gap between what motivates someone to seek out work at Amazon versus the reality of what it’s like to work there.
4. ADDRESS “RESTLESS” EMPLOYEES.A segment of your employee group may be satisfied with work, but also willing to make a change. How can you ensure your high-value, high-performing talent continues to stay engaged and committed at work?
An interesting study by the Corporate Executive Board (a study now five years old but still cited by organizations like the Harvard Business Review) showed one in three “emerging stars” feel disengaged from their employer. And 12 percent of high-potential employees studied by the Harvard Business Review say they are actively searching for a new job. Developing plans to motivate high-value subsets of your employees is absolutely critical. In other words, employers must map out their so-called Happiness Gap by region, gender and role, and then take surgical action to determine how best to satisfy and retain your most valuable segments. This is not to say that only those segments deserve attention, but rather that certain subsets of your organization require extra attention due to their importance to your organization’s ability to innovate and grow.
5. VIEW EMPLOYEE ENGAGEMENT AS A STRATEGIC ASSET. Too many still view employee satisfaction and engagement as an HR-led, nice-to-have activity, rather than a business-critical, competitive asset. Tracking employee happiness is a barometer of your organization’s overall heath – as important to
forecasting future growth as traditional financial metrics such as cost of capital. Treating talent-as-an-asset requires a massive shift for many organizations. But taking a data-driven approach to employee satisfaction and engagement is an excellent place to begin.
HOME
INTRODUCTION
WHY HAPPINESS?
WORKER HAPPINESS AS A BAROMETER OF ENTERPRISE HEALTH
GLOBAL WORKFORCE HAPPINESS QUADRANT
RECOMMENDATIONS FOR EMPLOYERS
HOW HAPPY ARE YOUR EMPLOYEES?
UNIVERSUM GLOBAL WORKFORCE HAPPINESS INDEX | 2016 16
HOW HAPPY ARE YOUR EMPLOYEES? How does your company compare to its peers? Our data will help you shape your approach to attracting and retaining top talent.
Solutions include:
The Employer Branding Strategy Report: improve your EVP and be more strategic about your employer branding to ensure you can attract and retain top talent.
The Ideal Employer Brand Report: understand the key strengths and weaknesses of your recruiting competitors, while leveraging a strategic tool that empowers you to capture the right talent and reduce your cost per hire.
The Talent Insight Report: understand the needs and preferences of top talent and make fact-based decisions about recruitment instead of navigating in the dark.
Visit our website to access results of strategic importance to your organization.
HOME
INTRODUCTION
WHY HAPPINESS?
WORKER HAPPINESS AS A BAROMETER OF ENTERPRISE HEALTH
GLOBAL WORKFORCE HAPPINESS QUADRANT
RECOMMENDATIONS FOR EMPLOYERS
HOW HAPPY ARE YOUR EMPLOYEES?

UNIVERSUM GLOBAL WORKFORCE HAPPINESS INDEX | 2016 17