the bigger picture - 2degrees-investing.org · new york (united states): 205 e 42nd street, 10017...
TRANSCRIPT
T H E B I G G E R P I C T U R ETHE IMPACT OF AUTOMATION, AI, SHARED ECONOMY… ON OIL DEMAND

The 2° Investing Initiative (2°ii) is a non-profit think tank set-up to produceresearch on pathways for aligning the financial sector with climate goals. Itsresearch is provided free of charge and 2°ii does not seek any direct or indirectfinancial compensation for its research. 2°ii is not an investment adviser, andmakes no representation regarding the advisability of investing in anyparticular company or investment fund or other vehicle. A decision to invest inany such investment fund or other entity should not be made in reliance on anyof the statements set forth in this publication. The information & analysiscontained in this research report does not constitute an offer to sell securities orthe solicitation of an offer to buy, or recommendation for investment, in anysecurities within the United States or any other jurisdiction. The information isnot intended as financial advice. The research report provides generalinformation only. The information and opinions constitute a judgment as at thedate indicated and are subject to change without notice. The information maytherefore not be accurate or current. No representation or warranty, express orimplied, is made by 2°ii as to their accuracy, completeness or correctness. 2°iidoes not warrant that the information is up to date.
Contact:Email: [email protected]: www.2degrees-investing.org
Telephone: +331 428 119 97 • +1 516 418 3156Paris (France): 97 Rue Lafayette, 75010 Paris, France
New York (United States): 205 E 42nd Street, 10017 NY, USALondon (United Kingdom): 40 Bermondsey Street, SE1 3UD London, UK
Authors: Jakob Thomä, with the support of Stanislas Dupré and Mark FultonPublished May 2018
Supported by EU LIFE OPERATING GRANT
This report has been realized with the financial support of the Life NGO operating grant. The views expressed in this report are the sole responsibility of the authors and do not
necessarily reflect the views of the sponsors.
TABLE OF CONTENTS
Summary 2
1. Introduction 3
2. Disruptive trends 4
3. Impact on oil 6
4. Conclusion 10
References 11
Methodology 13
1
2 DEGREES INVESTING INITIATIVE
WORKING PAPER NO. 2018/2

This report seeks to quantify the potential impact of breakthroughtechnologies on oil demand.
It finds that breakthrough technologies like artificial intelligence, bio-plastics, 3D printing, holograms, nanotechnology, hyperloops, artificialintelligence, and autonomous driving, as well as trends like the ‘sharingeconomy’, can reduce oil demand by 34% relative to the baseline NewPolicy Scenario (NPS) of the International Energy Agency in the next 22years.
This impact is the equivalent of the expected difference between theNew Policy Scenario (NPS, ~4°C) and the Sustainable DevelopmentScenario (SDS, ~2°C) of the International Energy Agency.
Adding the equivalent percentage adjustment of the difference of theIEA NPS to SDS to the alternative baseline implies a potential reductionof oil demand by 54% in the next 22 years.
These estimates rely almost exclusively on peer-reviewed or industry-expert assumptions about the trends for each technology and sector.
While admittedly highly uncertain, they suggest a potential volatility forthe oil sector that is significantly more pronounced than that implied incurrent ‘2°C scenarios’.
Crucially, these estimates while optimistic may even understate thetechnology revolution.
Should technology adoption outperform or the IEA understate relatedclimate policy trends, the effects may even be more pronounced,especially since they don’t necessarily capture technology breakthroughin the buildings and petrochemical sector.
SUMMARY
2
Figure 1: Impact of disruptive technologies on oil demand in 2040
0
20
40
60
80
100
120
SDS
Oil
pro
du
ctio
n -
20
40
NP
S O
il p
rod
uct
ion
- 2
04
0
Shar
ing
eco
no
my
3D
Pri
nti
ng
Au
ton
om
ou
s d
rivi
ng
AI S
up
ply
ch
ain
eff
icie
nci
es
Bio
-pla
stic
s
Ho
logr
ams
Nan
ote
chn
olo
gy
Hyp
erl
oo
p
Alt
ern
ativ
e b
ase
line
-2
04
0
NP
S to
SD
S o
il d
em
and
ad
just
me
nt
Alt
ern
ativ
e S
DS
- 2
04
0
mb
/d o
il p
rod
uct
ion
in 2
04
0

Traditionally, critiques of the IEA have focused on their assumptionsaround electrification of transport and speed of penetration ofrenewables.
Notable examples to that effect include research by Greenpeacedeveloping an alternative decarbonization scenario. 2 These scenario alsotend to increase the level of ambition with regard to the probability oflimiting global warming to well below 2°C. Research from the CarbonTracker Initiative has also challenged some of the macro assumptions ofthe IEA.3
This report takes a different approach, highlighting that disruptivetrends like artificial intelligence, autonomous driving, and 3D printingcan potentially by themselves bridge the gap between a 4°C and 2°C oildemand scenario.
Coupled with broader transition trends, this could create a 50%reduction in oil demand within just 22 years, significantly acceleratingthe transition and improving the likelihood of limiting global warming towell below 2°C above pre-industrial levels. Crucially, these achievementsare possible relying exclusively on existing technology forecasts. Moredramatic assumptions around robotics may lead to more pronouncedshifts. Driven to a large degree by software, they circumvent some of thecapital lock-in challenges traditionally associated with changes in theenergy sector.
The report marks the first comprehensive analysis of a range ofdisruptive trends on oil demand in the context of the transition to a low-carbon economy. It thus fills a critical gap in the research space. It alsoshows how disruptive trends may require the use of more disruptivescenarios in the context of stress-testing and scenario analysis that takeinto account the current technology revolutions under way.
The recommendations of the Financial Stability Board Task Force onClimate-Related Financial Disclosures (TCFD) have put scenarioanalysis on the agenda of both companies and financial institutions.
Specifically, the TCFD recommends that “all organizations exposed toclimate-related risks should consider: (1) using scenario analysis to helpinform their strategic and financial planning processes and (2) disclosingthe potential impacts and related organizational responses.”
In addition, the Paris Agreement in Art. 2.1c calls for aligning financialflows with climate goals. The translation of this policy objective in bothmandatory (France) and voluntary disclosure initiatives (Switzerland)has made scenario analysis a core element of the policy and markettoolbox for helping to achieve both the 2°C climate goal, as well asfinancial markets and economies that are resilient to the associatedtransition to a low-carbon economy.
These trends have put the question of the sources and assumptions of2°C scenarios under increased scrutiny.
Arguably the most prominent scenarios in the oil & gas industry arethose developed by the International Energy Agency (IEA). They are theprimary scenario reference report in the annual reports and publishedscenario analyses of major oil and gas companies.1 Specifically, theInternational Energy Agency has developed three scenarios: a CurrentPolicy Scenario (CPS), roughly consistent with 6°C warming, a NewPolicy Scenario (NPS), roughly consistent with 4°C warming, and aSustainable Development Scenario (SDS), roughly consistent with 2°Cwarming.
1 See for example Carbon Tracker Initiative (2018)
1. INTRODUCTION
3
2 Greenpeace (2015)3 Carbon Tracker Initiative (2017)

Global oil production can be linked to a range of different uses, of
which the most well-known, passenger vehicles, only makes up
around a quarter.
Road transport represents roughly 40% of oil consumption, with
aviation and shipping making up another 15%, and all other uses
making up the rest (e.g. plastics, power generation, petrochemicals,
buildings, steam and process heat, other). The figure below summarizes
the different use cases for oil demand today. Crucially, the analysis does
not look at carbon impacts of changes to different oil demands, but
purely the underlying oil demand assumption
The range of different use cases also imply a significant exposure to
disruptive trends across a range of industries. By extension, the range of
disruptive technologies that might affect oil demand is also broad. The
figure across shows the key types of disruptive technology trends
potentially at play, with a more detailed discussion on the next page.
Figure 2: Oil demand by type in 2040 (Source: Authors, based on IEA
estimates)
2. Disruptive trends Sharing economy
3D Printing
Autonomous vehicles
AI in supply chains
Bio-plastics
Holograms
Hyperloop
Nanotechnology
4
-
5
10
15
20
25
30
Pas
sen
ger
veh
icle
s
Fre
igh
t
Oth
er
Bu
ildin
gs
Pla
stic
s
Avi
atio
n
Ste
am a
nd
pro
cess
he
at
Po
we
rge
ner
atio
n
Mar
itim
e
Pe
tro
che
mic
als
feed
sto
cks
mb
/d in
20
15

Autonomous driving. Autonomous driving is another area of significantdisruption. Autonomous vehicles are already tested on the road, with asignificant degree of automation built into the Tesla software.Autonomous driving could thus be associated with limited lock-in effectas vehicles simply receive ‘software updates’ as the technology matures.The range of estimates on the impact of autonomous vehicles is wide,from rebound effects actually increasing oil demand to positiveestimates suggesting up to a 40% efficiency gain across all roadtransport. 9
Holograms. Holograms can help revolutionize business travel and byextension the consumption of oil. This is likely to – should it scale –impact business travel in particular. Given some travel constraints andthe fact that the majority of air travel is either cargo or ‘private’,holograms are only expected to have a low single digit effect on airtravel consumption, with no robust estimates to date on scale.
Hyperloop. The Hyperloop is designed to be an alternative technology toair travel, creating super high-speed on-ground travel connections,powered by electricity, across major industrial or population centers.Here too, estimates are missing, but high capital lock-in and longconstruction phases suggest limited penetration by 2040, even under anoptimistic scenario, although hyperloops may come to play a moreprominent role in the long-term.
Nanotechnology. Beyond its role in plastics, nanotechnology can alsohelp accelerate fuel efficiency trends, through a combination of loweringthe weight of vehicles and thus increasing efficiency, improving tireefficiency, and nanocatalysts that make fuel consumption moreefficient.10
Sharing economy. Car- and bike-sharing programs, as well as therevolution in the nature of taxi services is set to reduce the purchase ofprivate vehicles and by extension likely the consumption of oil relatedto passenger vehicles. Estimates by McKinsey suggest that the sharingeconomy is likely to reduce car sales by around 10% over the next 25years. The effect on oil demand in 2040 of this trend is somewhatuncertain, related to both the speed of adoption of the sharingeconomy and the actual replacement of oil-fuelled vehicles withalternatives.
3D printing. 3D printing is set to have potentially significant impacts onthe logistics sector, driving more local production of goods andpotentially reducing the transportation of intermediate goods acrosslong distances. 4 According to Integracore, around 25% of the freight,41% of the air cargo sector, and 37% of the shipping sector may be atrisk in the context of 3D printing. In estimating the implications for oildemand, there are data challenges related to the share that cargomakes up in the aviation and shipping sector respectively.
AI Supply chain efficiencies. Artificial intelligence will help significantlyimprove the efficiencies of supply chains, reducing waste both in thelogistics chain itself, as well as in the nature of goods and servicestransported. Estimates suggest AI can help increase supply chainefficiencies by around 20-30%,7 with commensurate effects in particularon the freight, air cargo, and shipping cargo sector.
Bio-plastics. Primarily driven by non-climate related environmentalconcerns, notably plastic trash in the ocean, biodegradable plastic islikely to make inroads as the technology develops, with potentiallyupward of 50% of plastics replaced by non-oil based alternatives by2040, 8 including potentially with nanotechnology solutions.
5
5 IntegraCore (2016)6 Aviation Stack Exchange (2016)
9 Wadud, Z. et al. (2016)10 Nano Magazine (2017)
7 visualfabriq (2017) 8 World Economic Forum (2016)

The figure below summarizes the collective impact of the disruptive
effects on potential oil demand in 2040. It suggests that these
disruptive trends can account for the entire difference between the
IEA New Policy Scenario (NPS – 4°C scenario) and the IEA Sustianable
Development Scenario (SDS – 2°C with a 50% probability).
Thus, disruptive trends could in theory by themselves generate the oil
demand reduction consistent with a 2°C scenario. This analysis of
course does not reflect uncertainty as to the extent that these factors
are already considered in the New Policy Scenario, for which the IEA
does not provide specific information. However, given that the NPS is a
‘baseline’ scenario, it is unlikely that disruptive trends factor materially
in this case. A detailed calculation methodology can be found in Annex
1, p. 13-15.
Crucially, the results control for ‘double counting’ such that for example
efficiency gains from artificial intelligence materialize to an already
more efficient transport fleet due to autonomous driving.
Applying the SDS trend proportionally to the alternative NPS baseline
assuming disruptive trends shaves another 20 million barrels / day off
of expected demand.
This implies that the aggregate impact of an economic disruption
caused by artificial intelligence and other technologies (autonomous
driving, 3D printing) as well as decarbonization envisioned under a SD
scenario could halve global oil production in the next 22 years relative
to a baseline 4°C scenario (-54%), and reduce oil demand by about 34%
relative to a non-disruptive SDS.
3. Impact on oil
6
Figure 3: Impact of disruptive technologies on oil demand in 2040
0
20
40
60
80
100
120
SDS
Oil
pro
du
ctio
n -
20
40
NP
S O
il p
rod
uct
ion
- 2
04
0
Shar
ing
eco
no
my
3D
Pri
nti
ng
Au
ton
om
ou
s d
rivi
ng
AI S
up
ply
ch
ain
eff
icie
nci
es
Bio
-pla
stic
s
Ho
logr
ams
Nan
ote
chn
olo
gy
Hyp
erl
oo
p
Alt
ern
ativ
e b
ase
line
-2
04
0
NP
S to
SD
S o
il d
eman
d a
dju
stm
en
t
Alt
ern
ativ
e SD
S -
20
40
mb
/d o
il p
rod
uct
ion
in 2
04
0
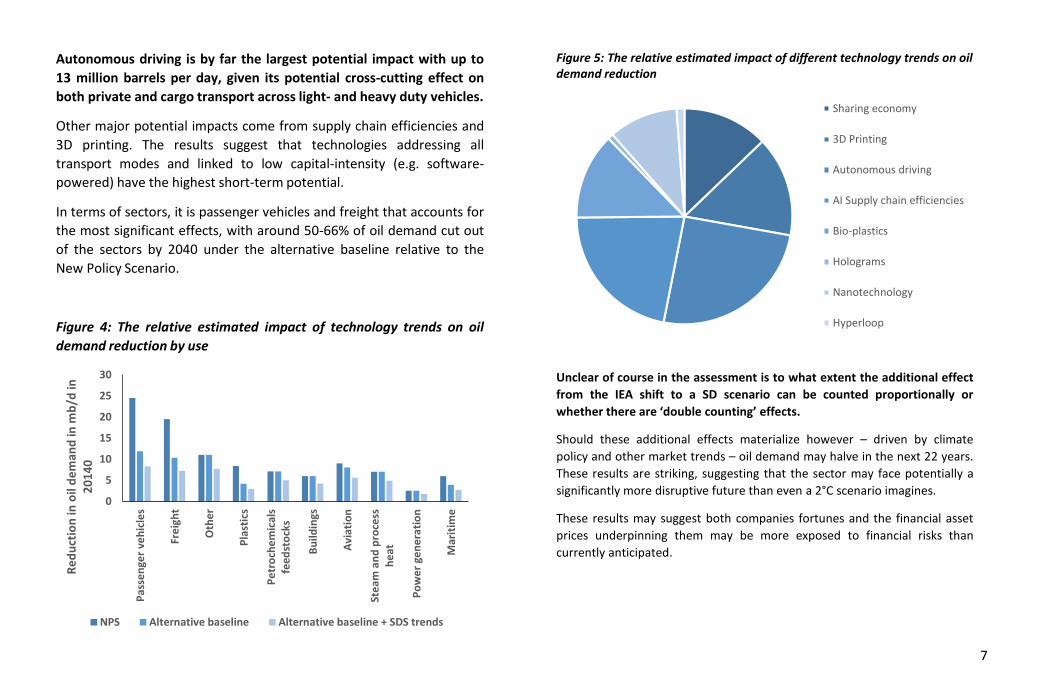
Autonomous driving is by far the largest potential impact with up to
13 million barrels per day, given its potential cross-cutting effect on
both private and cargo transport across light- and heavy duty vehicles.
Other major potential impacts come from supply chain efficiencies and
3D printing. The results suggest that technologies addressing all
transport modes and linked to low capital-intensity (e.g. software-
powered) have the highest short-term potential.
In terms of sectors, it is passenger vehicles and freight that accounts for
the most significant effects, with around 50-66% of oil demand cut out
of the sectors by 2040 under the alternative baseline relative to the
New Policy Scenario.
Figure 4: The relative estimated impact of technology trends on oil
demand reduction by use
7
Figure 5: The relative estimated impact of different technology trends on oil demand reduction
Unclear of course in the assessment is to what extent the additional effect
from the IEA shift to a SD scenario can be counted proportionally or
whether there are ‘double counting’ effects.
Should these additional effects materialize however – driven by climate
policy and other market trends – oil demand may halve in the next 22 years.
These results are striking, suggesting that the sector may face potentially a
significantly more disruptive future than even a 2°C scenario imagines.
These results may suggest both companies fortunes and the financial asset
prices underpinning them may be more exposed to financial risks than
currently anticipated.
Sharing economy
3D Printing
Autonomous driving
AI Supply chain efficiencies
Bio-plastics
Holograms
Nanotechnology
Hyperloop
0
5
10
15
20
25
30
Pas
sen
ger
veh
icle
s
Fre
igh
t
Oth
er
Pla
stic
s
Pe
tro
che
mic
als
feed
sto
cks
Bu
ildin
gs
Avi
atio
n
Ste
am a
nd
pro
cess
he
at
Po
we
r ge
ne
rati
on
Mar
itim
e
Re
du
ctio
n in
oil
de
man
d in
mb
/d in
2
01
40
NPS Alternative baseline Alternative baseline + SDS trends

This paper sought to present the first comprehensive analysis of the
potential aggregate impact of breakthrough technologies on oil
demand.
The results are striking, with up to 50% of oil demand set to disappear
in the next 22 years under optimistic technology assumptions – coupled
with the implementation of the Paris Agreement 2°C climate goal policy
agenda. Even without such an agenda, oil demand is set to drop by
around one-third if these technology trends materialize. The results are
dramatic and stand in stark contrast to a baseline scenario of increasing
oil demand of around 10-15%, and even higher under the so-called
‘Current Policy Scenario’ of the International Energy Agency.
The results presented here are ‘optimistic’, but ground in credible
third-party estimates.
This optimism relates to the potential adoption of the technology and
its specific effects on oil demand, which is of course incredibly difficult
to model and can be interpreted in very different ways, especially when
considering different potential rebound effects. It represents what may
be – depending on the eye of the beholder – a best case or worst case
scenario for oil demand under a disruptive trend.
In this, it is critical to point out that the paper focused exclusively on
one question – oil demand – and did not take into account other
environmental or climatic factors. Thus, the breakthrough technologies
described above may increase electricity demand that may give rise to
increased demand for coal-fired or gas-fired electricity. Equally, the
technologies involved in these trends may rely on other natural
resources with negative environmental implications. While important,
these effects were not in scope of the analysis.
4. Conclusion The results should not be seen as a forecast, but an alternative
scenario should technology disruption materialize and oil demand
respond commensurately.
Crucially, this scenario is not science fiction, but an aggregated
perspective based on credible, third-party estimates on potential effects,
that are at least in-part grounded in peer-reviewed academic processes
and / or in-depth industry research.
A scenario is just that, a scenario. However, it speaks to a potentially
credible future that may – unlike a 2°C scenario constrained by
assumptions around current technologies and capital lock-in – truly
disrupt the oil sector in a very short period of time.
While the scenario may seem like ‘science fiction’, it may even
understate the technology revolution underway.
Nanotechnology, 3D printing, artificial intelligence, and related
technologies may fundamentally rupture a range of markets that shift
our transport, energy, and materials needs. A science fiction narrative
might lead to a complete replacement of oil-based plastics, lab-based
biofuels that replace oil in the aviation and shipping sector and related
trends. The sky is the proverbial limit.
8

Aviation Stack Exchange (2016) ”What percentage of airliner flights globally are
freight flights?”
<https://aviation.stackexchange.com/questions/30542/what-percentage-
of-airliner-flights-globally-are-freight-flights>
Biron, M. (2017) “Industrial Applications of Renewable Plastics –
Environmental, Technological and Economic Advances”
Carbon Tracker Initiative (2017) “The Unexpected Power of Low-Carbon
Technology”
Carbon Tracker Initiative (2018) “Under the Microscope: Are companies’
scenario analyses meeting investors’ requirements”
Chen, Z. (2017) “The Influence of 3D Printing on Global Container Multimodal
Transport System” Complexity, Volume 2017, 19 pp.
DHL Trend Research (2016) “3D Printing And The Future Of Supply Chains” <
http://www.dhl.com/content/dam/downloads/g0/about_us/logistics_insig
hts/dhl_trendreport_3dprinting.pdf > [20.04.2018]
Endresen, Ø.; Sørgård. E.; Behrens, H. L; Brett, P. O. and Isaksen, I. (2007) “A
historical reconstruction of ships' fuel consumption and emissions” Journal
of Geophysical Research: Athmospheres, 112, D12.
Exxon Mobil Corporation (2018) “The Outlook for Energy”
<http://corporate.exxonmobil.com/en/energy/energy-outlook>
[12.04.2018]
FreightWaves (2018) “The sharing economy: Six disruptions on the
transportation ecosystem”
<https://www.freightwaves.com/news/2018/1/2/the-sharing-economy-
disruption-on-transportation> [20.04.2018]
References
Greenpeace (2015) “Energy Revolution 2015”
<https://www.greenpeace.org/archive-
international/en/publications/Campaign-reports/Climate-Reports/Energy-
Revolution-2015/> [12.04.2018]
IntegraCore (2016) “The Future Impact of 3D Printing on the Transportation
Industry” <https://blog.integracore.com/freight/the-future-impact-of-3d-
printing-on-the-transportation-industry/> [20.04.2018]
LoupVentures (2017) “Auto Outlook 2040: The Rise of Fully Autonomous
Vehicles” < http://loupventures.com/auto-outlook-2040-the-rise-of-fully-
autonomous-vehicles/> [20.04.2018]
McKinsey (2017) “How shared mobility will change the automotive industry”
<https://www.mckinsey.com/industries/automotive-and-assembly/our-
insights/how-shared-mobility-will-change-the-automotive-industry>
[20.04.2018]
Nano Magazine (2017) “7 Ways Nanotechnology Could Combat Climate
Change” <https://nano-magazine.com/news/2017/6/29/7-ways-
nanotechnology-could-combat-climate-change> [12.04.2018]
Nordic Council of Ministers (2017) “Environmental impacts and potential of the
sharing economy” TemaNord 2017:554, <https://norden.diva-
portal.org/smash/get/diva2:1145502/FULLTEXT01.pdf> [20.04.2018]
Progressive Markets (2017) “Bioplastics Market - Size, Trend, Share,
Opportunity Analysis, and Forecast, 2017-2025”
<https://www.progressivemarkets.com/industry-research/bioplastics-
market> [20.04.2018]
11

PwC (2015) “2015 Commercial Transportation Trends”
<https://www.strategyand.pwc.com/trends/2015-commercial-
transportation-trends> [20.04.2018]
The Drive (2018) “Forecast: Autonomous-Vehicle Sales to Top 33 Million in
2040” < http://www.thedrive.com/sheetmetal/17298/forecast-
autonomous-vehicle-sales-to-top-33-million-in-2040> [20.04.2018]
The Telegraph (2017) “What does AI mean for the future of manufacturing?”,
15.08.2017 < https://www.telegraph.co.uk/business/social-
innovation/artificial-intelligence-future-of-manufacture/>
UNCTAD (2016) “Review of Maritime Transport”
<http://unctad.org/en/PublicationsLibrary/rmt2016_en.pdf >
Visualfabriq (2017) “The role of machine learning to significantly improve
forecast accuracy”, presentation held at POI European Promotion
Optimization Summit 2017 <https://visualfabriq.com/wp-
content/uploads/2017/09/POI-Amsterdam-2017-Visualfabriq-Optimizing-
Forecast-Accuracy.compressed.pdf>
[12.04.2018]
Wadud, Z. et al. (2016) “Help or hindrance? The travel, energy and carbon
impacts of highly automated vehicles” Transportation Research Part A, 86:
1-18.
World Economic Forum (2016) “The New Plastic Economy: Rethinking the
future of plastics”
References
12

The following describes the methodology underpinning the estimates
on changes in oil demand by 2040. The baseline oil production figures
are derived from the International Energy Agency.
Shared economy. The shared economy effect was exclusively applied topassenger duty vehicles, although it also may impact other sectors likefreight.11 Effects in terms of energy consumption for example inbuildings however are expected to be muted and may even be offset byhigher disposal income effects.12 Estimates with regard to penetrationrange from 10% (McKinsey)13 to 68% (LoupVentures) 14 by 2040 in termsof fleet penetration. In a meta-study focusing on the impact of sharedvehicles on car use, most estimates suggest around 25% lower net oilconsumption, although estimates will go as high as 48% in one casestudy.15 For the purpose of this paper, the optimistic penetrationestimate was applied (68%), albeit with the average savings (25%). Thisimplies a net reduction of 17% in oil demand in the passenger vehiclesector.
3D Printing. The effects of 3D Printing were applied exclusively to thefreight, aviation and maritime sector, using the cargo share estimatesfor aviation (10%) and shipping (52%) highlighted earlier. Here, theanalysis relies on estimates from PWC.16 More specific estimates alsosuggest impacts on oil tanker demand in terms of a reduction of 10%. 17
Applying this additional factor only reduces oil demand by about100,000 barrels a day however and is thus – in relative terms –negligible in the overall analysis. Of course, logistics companies in theirscenario analysis paint a much more conservative future of single-digitreductions in freight volume, claiming it will primarily impact ‘last-mile’logistics. 18
METHODOLOGY
Artificial intelligence supply chain. The reduction in transport needs in
the freight, air cargo, and shipping sector due to efficiencies in supply
chain is highly uncertain and not extensively modelled. However,
estimates for efficiency gains in manufacturing for example are around
10% 19 and some industry actors assume gains of 20-30%.20 The
estimates in this paper apply an optimistic 30% estimate to the freight
sector and a similar oil demand reduction for air cargo (~10% of air
travel) 21 and maritime. For maritime, estimates for the share of cargo in
total maritime shipping could not be identified, but are expected to be
quite high, given the relative prominence of cargo shipping. Estimates
suggest fishing vessel bunker demand (not considered in the supply
chain discussion) represent around 10% of maritime bunker demand. It
is unclear to what extent artificial intelligence can be expected to
increase the efficiency of oil tankers, which is thus also excluded from
the analysis. Data on the relative share here too is scarce in terms of
maritime bunker demand, 22 but based on tonnages represents around
35% of commercial cargo shipping. 23 While obviously differences in fuel
efficiency, use, etc. may imply that the actual oil demand underlying the
cargo tonnage differs significantly from its share in tonnage – generally
receiving a lower EVDI score (implying higher fuel efficiency), but
perhaps differing in use case. Without further data, the 30% efficiency
gain was thus applied to 52% of maritime oil demand. It is perhaps
relevant to note that more or less conservative assumptions do not
significantly change the estimates (less than 1 mb/d based on a basic
sensitivity analysis).
13
19 The Telegraph (2017)20 Visualfabriq (2017)21 Aviation Stack Exchange (2016)22 Endresen et al. (2007)
15 Nordic Council of Ministers (2017)16 PwC (2015)17 Chen, Z. (2017)18 DHL Trend Research (2016)
11 FreightWaves (2018)12 Nordic Council of Ministers (2017)13 McKinsey (2017)14 LoupVentures (2017)
23 UNCTAD (2016)

Autonomous vehicles. The expected penetration of autonomous
vehicles by 2040 varies widely. Crucially, with software update
capabilities in future cars, technology lock-in should be minimal, thus
implying that any technology improvement in the late 2030s will be
scalable across the global car fleet. Estimates of penetration vary from
around 25%24 to 90%.25 A study by Wadud et al. in Transportation
Research Part A26 models different ‘efficiency futures’ with optimistic
and less optimistic outcomes ranging from an increase in total road
transport energy demand of 110% to a decrease of 40%. The optimistic
outcome was chosen here, where total energy demand for passenger
vehicles drops by around 55% and increases slightly by around 3% for
freight (largely driven by an increase in travel demand not offset by a
reduction in energy intensity). Assuming that these effects apply to 90%
of autonomous vehicles in a world where around 80% of vehicles are
not electrified, the overall effect is a 41% reduction in oil demand for
passenger vehicles and a 2% increase in oil demand for the freight
sector.
Bio-plastics. While bioplastics currently represent about 1-2% of the
plastics market, this figure is set to grow to perhaps 15-20% by 2025,
according to Progressive Markets. 27 More long-term estimates suggest
the moment where bioplastics achieve 50% penetration may be 2040.28
This estimate was applied to oil demand.
METHODOLOGY
Holograms. No meaningful third-party estimate exist to their effect. In
order to illustrate the effect, a 30% reduction in business travel (and
commensurate reduction in oil demand) was assumed. Given the very
limited impact of this estimate, a higher or lower estimate would be
unlikely to shift the broader picture. Business travel is estimated to
represent 12% of the passenger air travel, which in turn represents 90%.
Nanotechnology. Nanotechnology can impact oil demand through a
range of different drivers, notably through the use of lightweight nano-
composite materials increasing fuel efficiency, nano-coatings reducing
drags of aircraft, nanocatalysts improving fuel efficiency, nano-
structured materials to improve the energy ratings of tires, as well as
improved renewables and batteries. Together, these applications can
transform the climate challenge, assuming their technological potential
will materialize. For the estimates in this paper, a 15% efficiency gain
was applied to passenger vehicles and freight, based on the potential for
nano-structured material sin tyres to drive category A tires consuming
7.5% less fuel and 8-10% fuel savings of nanocatalysts identified by
Energenics. 29 These savings may of course be higher when factoring the
additional potential of nano-coatings and nano-composite materials, as
well for aviation and maritime shipping.
Hyperloop. Similar to the hologram, hyperloop estimates are poorly
defined. A generic 1% saving across passenger vehicles, freight, aviation,
and maritime shipping was applied, with similar low impacts suggesting
that higher or lower estimates would be unlikely to change significantly
the overall picture.
14
29 Nano Magazine (2017)27 Progressive Markets (2017)28 Biron (2017)
24 The Drive (2018)25 LoupVentures (2017)26 Wadud, Z. et al. (2016)

Methodology note on sequencing and cumulative trends. The relativeimpact of each trend is applied in sequence. Thus, the 15% potentialreduction in oil demand for passenger vehicles is applied on theadjusted baseline demand after factoring in autonomous vehicles,shared economy, etc. The relative effects of each technologybreakthrough are thus lower or higher in part depending on whichplace they take in the sequence.
METHODOLOGY
15

