the big picture: “getting it going” and “keeping it going”
DESCRIPTION
The Big Picture: “Getting it Going” and “Keeping it Going”. Susan Barrett Implementer Partner, OSEP Center on PBIS. pbis.org. www.scalingup.org. Problem Statement. - PowerPoint PPT PresentationTRANSCRIPT

The Big Picture:“Getting it Going” and
“Keeping it Going”
Susan Barrett
Implementer Partner,
OSEP Center on PBIS

pbis.org

www.scalingup.org

Problem Statement
“We give schools strategies & systems for developing positive, effective, achieving, & caring school & classroom environments, but implementation is not accurate, consistent, or durable. Schools need more than training.”
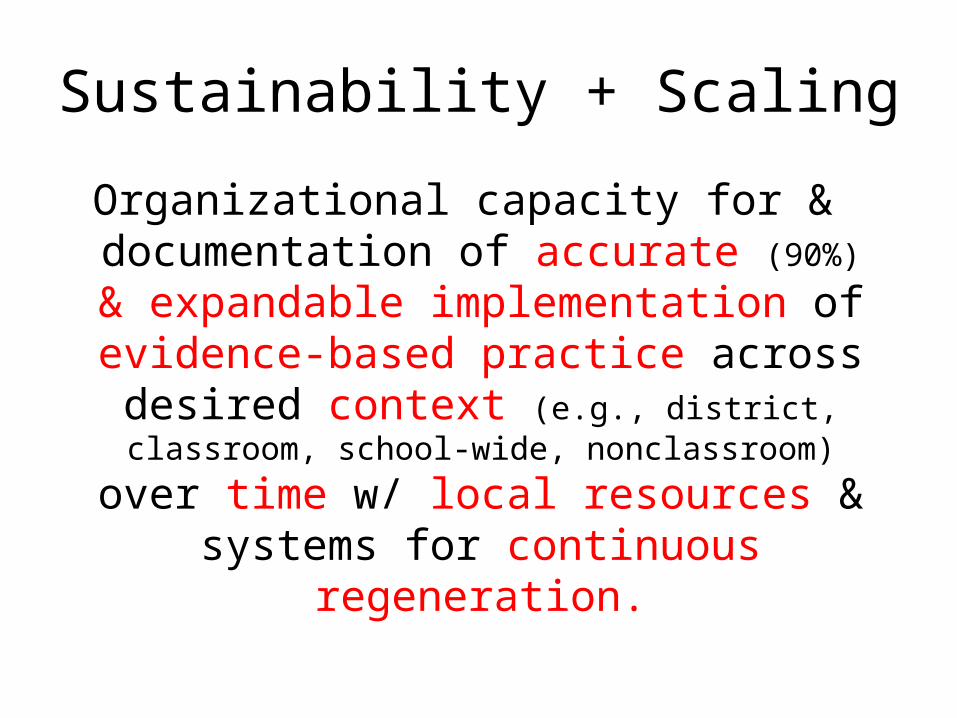
Sustainability + Scaling
Organizational capacity for & documentation of accurate (90%) &
expandable implementation of evidence-based practice across desired context
(e.g., district, classroom, school-wide, nonclassroom)
over time w/ local resources & systems for continuous regeneration.
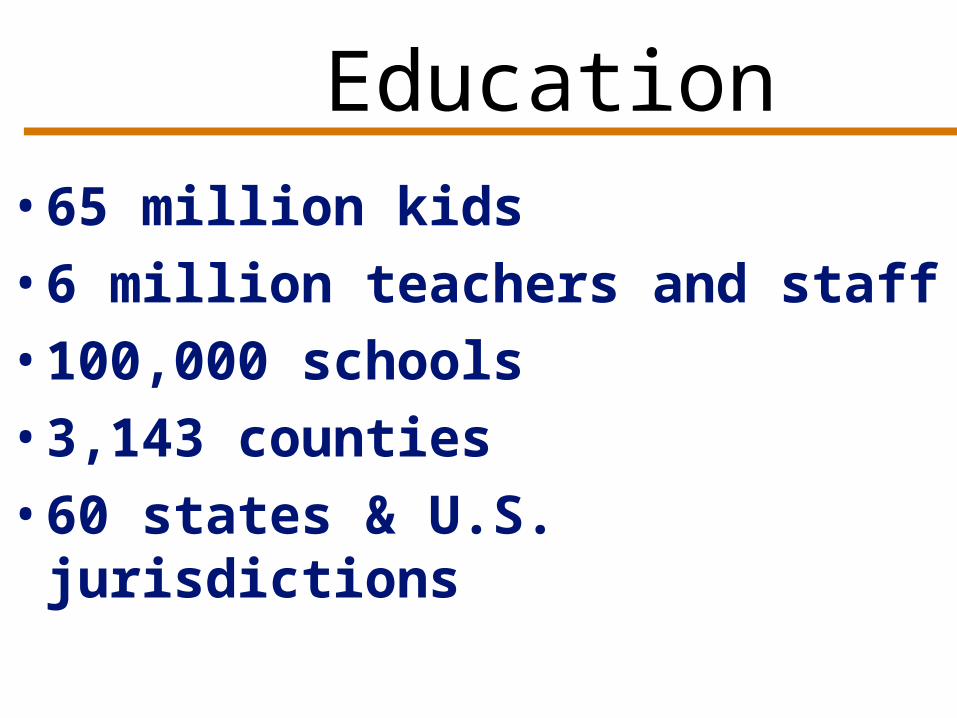
Education• 65 million kids
• 6 million teachers and staff
• 100,000 schools
• 3,143 counties
• 60 states & U.S. jurisdictions

Expansion 7,800 Schools !!!
Maryland 600 schools North Carolina 548 schools
Illinois 744 schools Colorado 405 schools
Florida 250 schools New York 322 schools
Michigan 248 schools Ohio 221 schools
New Hampshire 141schools West Virginia 215 schools
Virginia 210 schools Louisiana 285 schools
Missouri 300 schools Oregon 398 schools

Start with the end in mind…
• What will it take to have 100,000 replications that produce increasingly effective outcomes for 100 years?– Fixsen
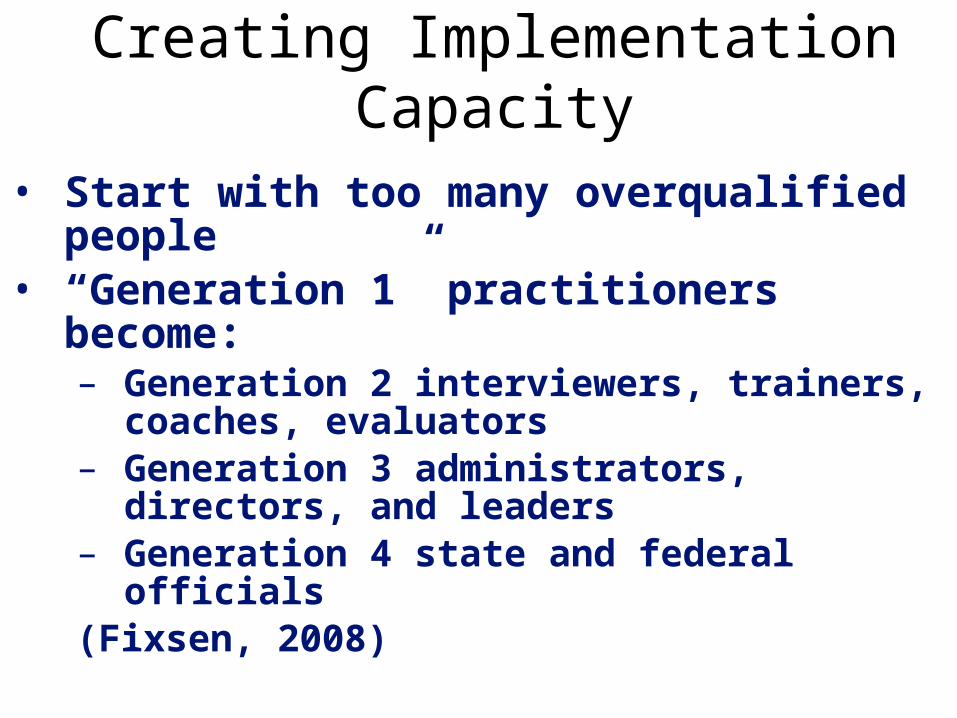
Creating Implementation Capacity
• Start with too many overqualified people• “Generation 1” practitioners become:
– Generation 2 interviewers, trainers, coaches, evaluators
– Generation 3 administrators, directors, and leaders
– Generation 4 state and federal officials(Fixsen, 2008)

Educational Initiatives
• Guiding Principles (Coyne, 2008)– Promoting evidence based practices– Supporting change at the systems level
(feasible, consistent and relevant to local needs)
– Developing local capacity to sustain effective practices over time
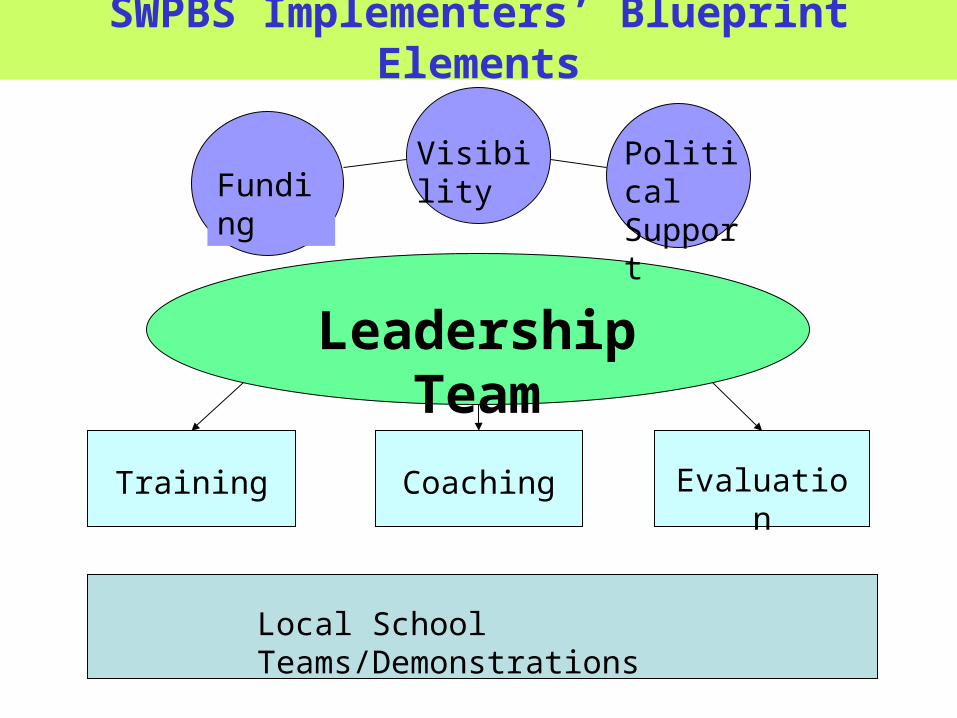
Leadership Team
FundingVisibility Political
Support
Training Coaching Evaluation
Local School Teams/Demonstrations
SWPBS Implementers’ Blueprint Elements

MemoTo: School Administrators
From: District Administrators
In keeping with the new state initiative, this fall we will be implementing an exciting new district initiative of SNI in place of LYI. All in-service days previously scheduled for LYI will be rescheduled as staff development for SNI. The $500 for release time and materials for LYI will be discontinued and provided instead for SNI. By the way, you will need to create local SNI teams that meet weekly. The former members of your LYI team would be perfect for this new team. Your new SNI binders will be coming next week. Have a great year!!!

14 Initiatives• School Counseling Services• Second Step• FBA/BIP’s• School Health• Social Skills• Bully proofing• Anger Management• Student Intervention Plans• Behavioral Contracting• Character Education• 504 Plans/IEP• CICO• Responsive Classroom• Expanded School Mental Health

Competing or Coordinated
• Need for a framework, the anchor, for all school improvement efforts
• Common language, Common logic

School counseling services Second Step FBAs/BIPs School health services Social skills, bully proofing, and/or anger management groups
Student Intervention Plans
UNIVERSAL
TARGETED
INTENSIVE
School wide PBIS
Check-in/Check-out Section 504 Plans and/or IEPs
Health Education Voluntary State Curriculum Behavioral contracting
Alternative programs
Character Education
Responsive counseling School mental health services Bullying Prevention
Expanded School Mental Health Initiatives and Interagency Partnerships
Lead
ersh
ip T
eam
Stu
dent
Ser
vice
s T
eam
Fam
ily
ES
MH
Wrap T
eam

Empower Educators
• We need to be better consumers!
• Say “No”, unless . . .
Show evidence of need

Office referrals are increasing every day!!!
“Minor disrespect and disruption are increasing over time and are most likely during the last 15 minutes of our block periods when students are engaged in independent seatwork. This pattern is most common in 7th and 8th grades, involves many students, and appears to be maintained by peer attention.”

The playground is out of control !!!!The students won’t listen to anyone
and are fighting all of the time!!!
“Major & minor referrals have increased by 50% during lunch time on the playground. The referrals are mostly 4th and 5th graders, and disrespect and aggressive behavior are the highest problem behaviors. Peer attention is the motivation.”

DATA is your friend
• 3 Parts– Coherent office referral procedures– Computer Application– Decision Making

Using Data -Using Data -
• Does your Data give you an accurate Does your Data give you an accurate picture? Reliable? What is your confidence picture? Reliable? What is your confidence level? Do you share with all staff?level? Do you share with all staff?
• General Data Decision RulesGeneral Data Decision Rules• Are you able to make precision statements? Are you able to make precision statements?
Do you present to faculty to get buy in?Do you present to faculty to get buy in?• How do you know when to move “up the How do you know when to move “up the
triangle”?triangle”?
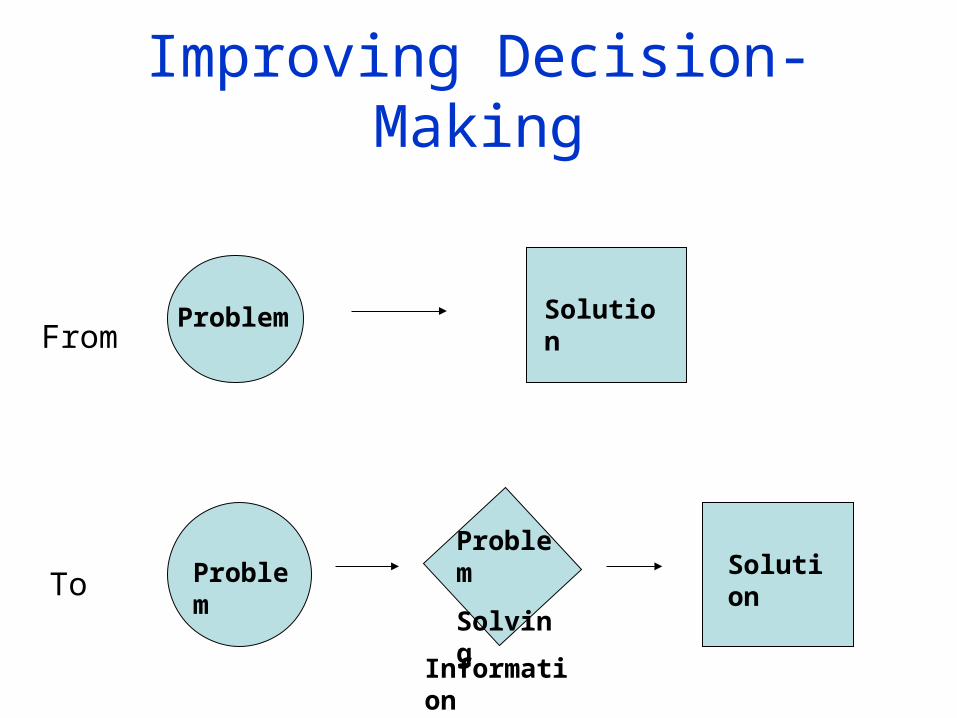
Improving Decision-Making
Problem SolutionFrom
To ProblemProblem
SolvingSolution
Information
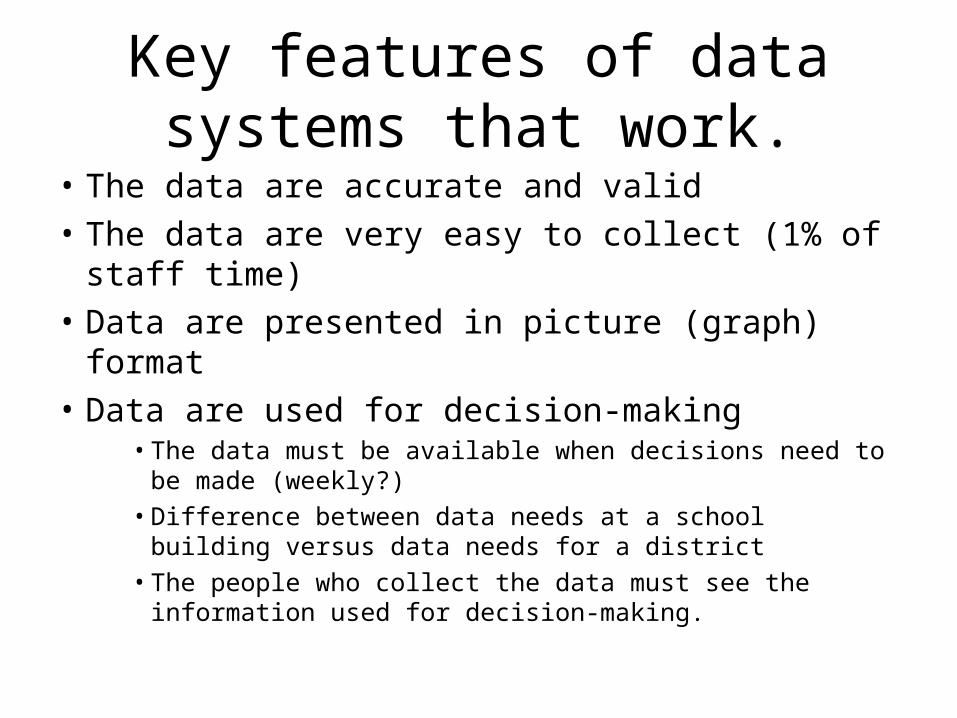
Key features of data systems that work.
• The data are accurate and valid
• The data are very easy to collect (1% of staff time)
• Data are presented in picture (graph) format
• Data are used for decision-making• The data must be available when decisions need to be made
(weekly?)
• Difference between data needs at a school building versus data needs for a district
• The people who collect the data must see the information used for decision-making.

Why Collect Discipline Information?
• Decision making
• Professional Accountability
• Decisions made with data (information) are more likely to be (a) implemented and (b) effective
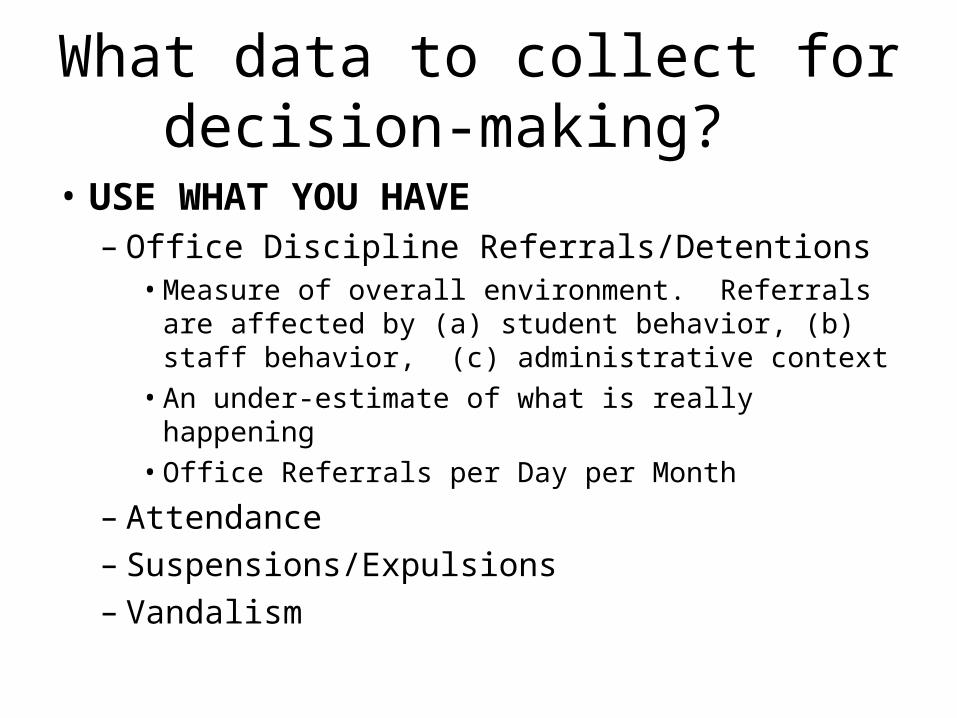
What data to collect for decision-making?
• USE WHAT YOU HAVE– Office Discipline Referrals/Detentions
• Measure of overall environment. Referrals are affected by (a) student behavior, (b) staff behavior, (c) administrative context
• An under-estimate of what is really happening
• Office Referrals per Day per Month
– Attendance– Suspensions/Expulsions– Vandalism
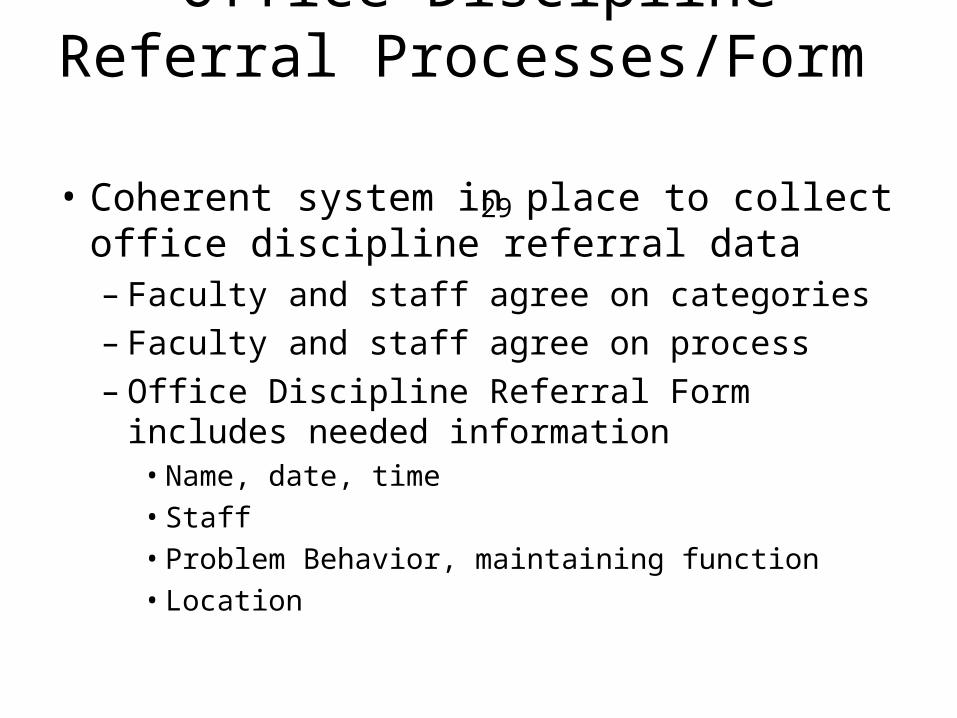
Office Discipline Referral Processes/Form
29• Coherent system in place to collect office
discipline referral data– Faculty and staff agree on categories– Faculty and staff agree on process– Office Discipline Referral Form includes needed
information• Name, date, time• Staff• Problem Behavior, maintaining function• Location

When Should Data be Collected?
• Continuously
• Data collection should be an embedded part of the school cycle not something “extra”
• Data should be summarized prior to meetings of decision-makers (e.g., weekly)
• Data will be inaccurate and irrelevant unless the people who collect and summarize it see the data used for decision-making.

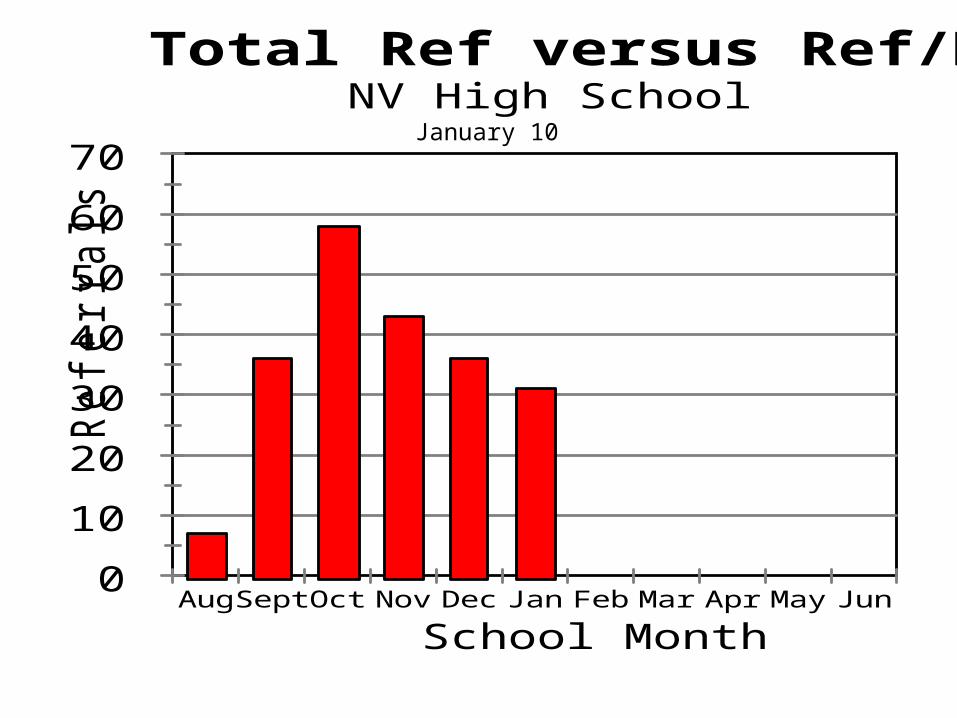
Organizing Data for “active decision-making”
• Counts are good, but not always useful
• To compare across months use “average office discipline referrals per day per month”
0
10
20
30
40
50
60
70
Refe
rrals
Aug Sept Oct Nov Dec Jan Feb Mar Apr May Jun
School Month
Total Ref versus Ref/Day/MoNV High School
January 10

Change Report OptionsChange Report Options1.41.82.72.52.753.4900.000

Using Data for On-Going Problem Solving
• Start with the decisions not the data
• Use data in “decision layers” (Gilbert, 1978)– Is there a problem? (overall rate of ODR)– Localize the problem
– (location, problem behavior, students, time of day)
– Get specific
• Don’t drown in the data
• It’s “OK” to be doing well
• Be efficient

Is there a problem?
• Office Referrals per Day per Month
• Attendance
• Faculty Reports

SWIS Data Summary
06-07
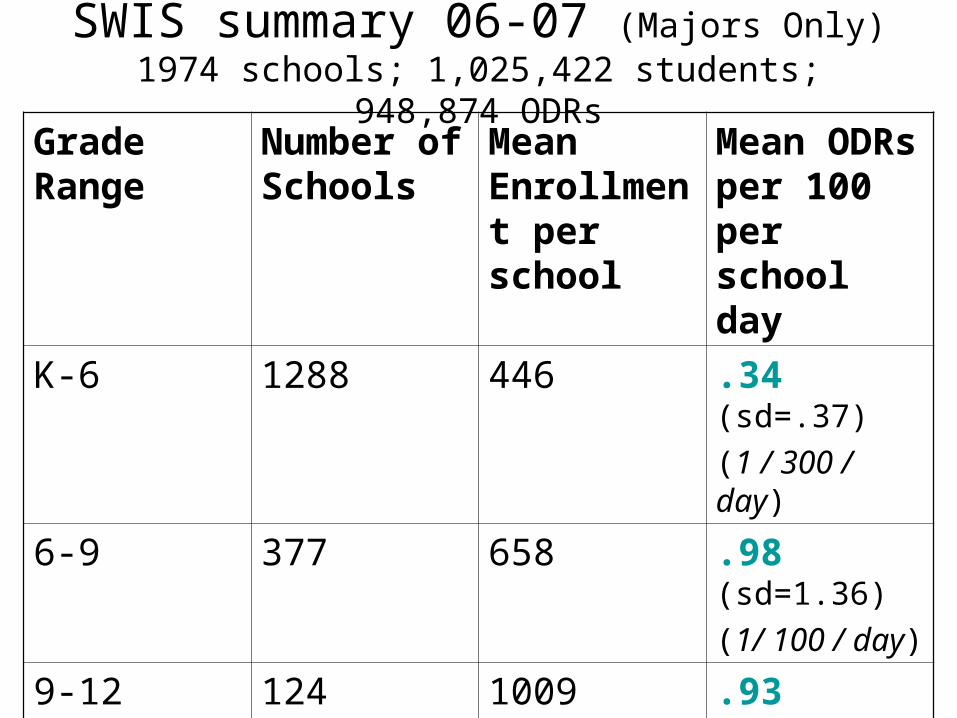
SWIS summary 06-07 (Majors Only)1974 schools; 1,025,422 students; 948,874 ODRs
Grade Range
Number of Schools
Mean Enrollment per school
Mean ODRs per 100 per school day
K-6 1288 446 .34 (sd=.37)
(1 / 300 / day)
6-9 377 658 .98 (sd=1.36)
(1/ 100 / day)
9-12 124 1009 .93 (sd=.83)
(1/ 107 / day)
K-(8-12) 183 419 .86 (sd=1.14)
(1/ 120 / day

Interpreting Office Referral Data:Is there a problem?
• Absolute level (depending on size of school)– Middle, High Schools (> 1 per day per 100)– Elementary Schools (> 1 per day per 300)
• Trends– Peaks before breaks?– Gradual increasing trend across year?
• Compare levels to last year– Improvement?

0
5
10
15
20 A
ve R
efe
rrals
per
Day
Sept Oct Nov Dec Jan Feb Mar Apr May Jun
School Months
Office Referrals per Day per MonthLast Year and This Year
Middle School
N= 495

What systems are problematic?• Referrals by problem behavior?
– What problem behaviors are most common?
• Referrals by location?– Are there specific problem locations?
• Referrals by student?– Are there many students receiving referrals or only a small number of
students with many referrals?
• Referrals by time of day?– Are there specific times when problems occur?

Defining the ProblemWhat Problem Behaviors Are
Occurring?Referrals by Problem Behavior
0
5
10
15
20
Ta
rdy
Fo
rge
/Th
eft
Dre
ss C
od
eT
ob
acco
Alc
oh
ol
Co
mb
ustib
lB
om
bA
rso
nW
ea
po
ns
Oth
er
Un
kn
ow
nD
rug
sT
ech
Iap
pO
ut b
ou
nd
sG
an
gM
ino
rM
-Prp
tyM
-Oth
er
M-D
ress
M-T
ech
M-T
ard
yM
-Un
kn
ow
nIn
ap
p la
nL
yin
gV
an
da
lM
-Dis
rup
tio
nH
ara
ss
Pro
p d
am
M-I
na
pp
la
nM
-Co
nta
ct
M-D
isre
sp
tS
kip
Dis
resp
tA
gg
/Fig
ht
Dis
rup
tio
n
Nu
mb
er
of
Re
ferr
als
Referrals: 52
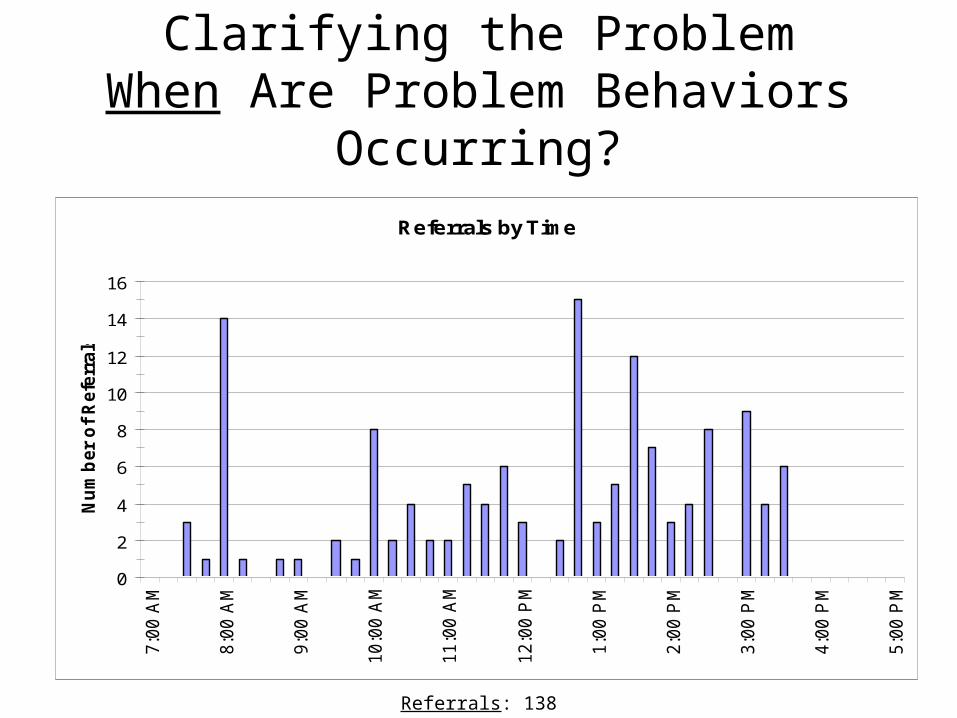
Clarifying the ProblemWhen Are Problem Behaviors
Occurring?Referrals by Time
0
2
4
6
8
10
12
14
16
7:0
0 A
M
8:0
0 A
M
9:0
0 A
M
10:0
0 A
M
11:0
0 A
M
12:0
0 P
M
1:0
0 P
M
2:0
0 P
M
3:0
0 P
M
4:0
0 P
M
5:0
0 P
M
Nu
mb
er
of
Refe
rrals
Referrals: 138

Clarifying the ProblemWhere Are Problem Behaviors
Occurring?
Referrals by Location
0
20
40
60
80
100
Com
mon
Bath
rm
Bus Z
n
Park
lot
Specia
l evt
Oth
er
Unknow
n
Off
ice
Locker
rm
Off
-Cam
pus
Sta
diu
m
Café
Lib
rary
Hall
Gym
Cla
ss
Bus
Ply
gd
Nu
mb
er
of
Refe
rrals
Referrals: 166
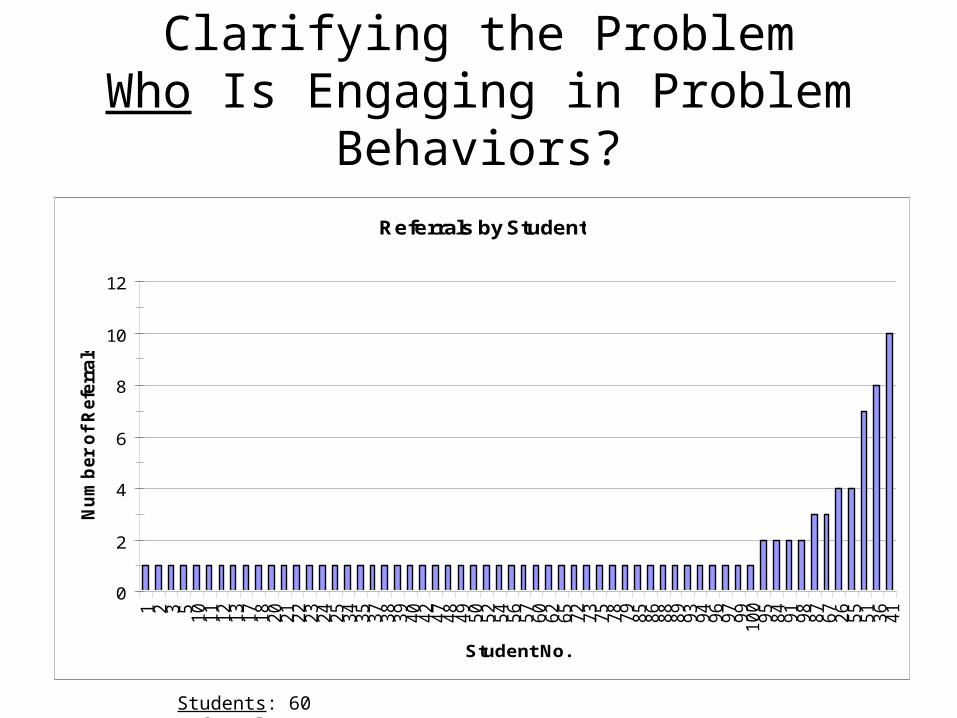
Clarifying the ProblemWho Is Engaging in Problem
Behaviors?Referrals by Student
0
2
4
6
8
10
12
1 2 3 5 10
11
12
13
17
18
20
21
22
23
24
25
34
35
37
38
39
40
42
47
48
49
50
52
54
56
57
60
62
65
72
73
75
78
79
85
86
88
89
93
94
96
97
99
100
95
84
91
98
87
67
26
55
51
36
41
Student No.
Nu
mb
er
of
Refe
rrals
Students: 60 Referrals: 96
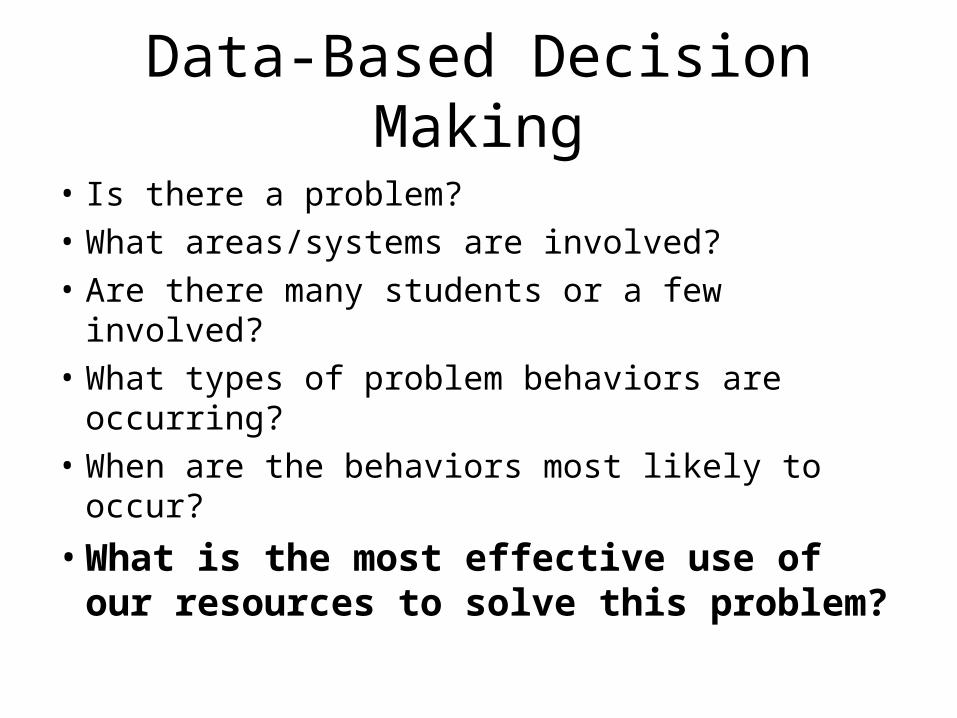
Data-Based Decision Making
• Is there a problem?• What areas/systems are involved?• Are there many students or a few involved?• What types of problem behaviors are
occurring?• When are the behaviors most likely to occur?
• What is the most effective use of our resources to solve this problem?

CollectCollect and Useand Use
DataData
Review Status and
Identify Problems
Develop andRefine
Hypotheses
Discuss andSelect
Solutions
Develop andImplementAction Plan
Evaluate andRevise
Action Plan
Problem Solving Foundations
Team Initiated Problem Solving (TIPS) Model
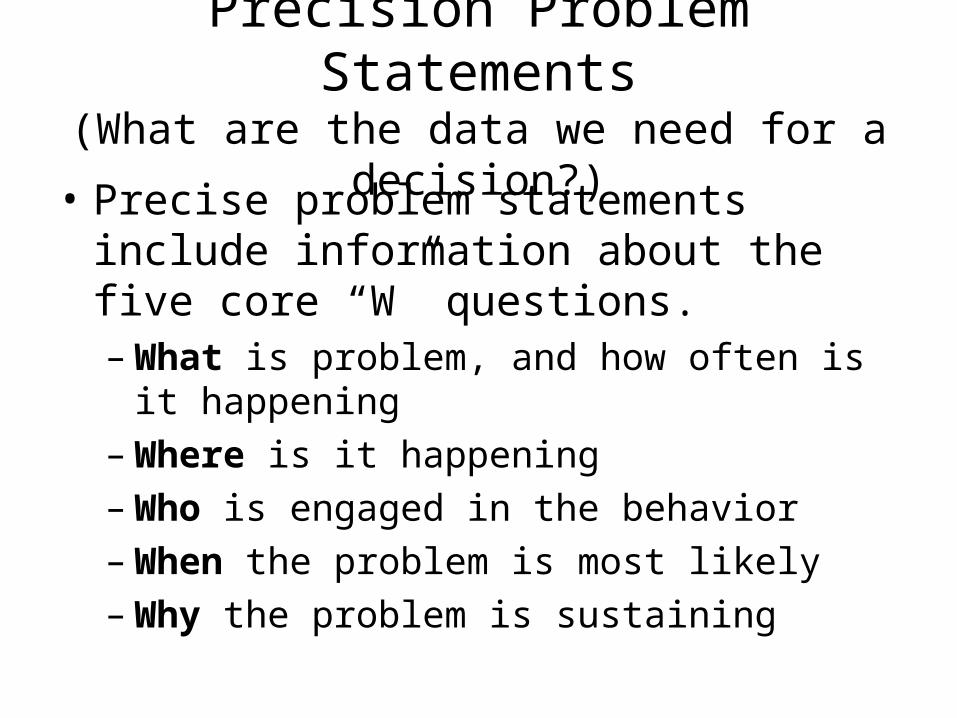
Precision Problem Statements(What are the data we need for a decision?)
• Precise problem statements include information about the five core “W” questions.– What is problem, and how often is it
happening– Where is it happening– Who is engaged in the behavior– When the problem is most likely– Why the problem is sustaining
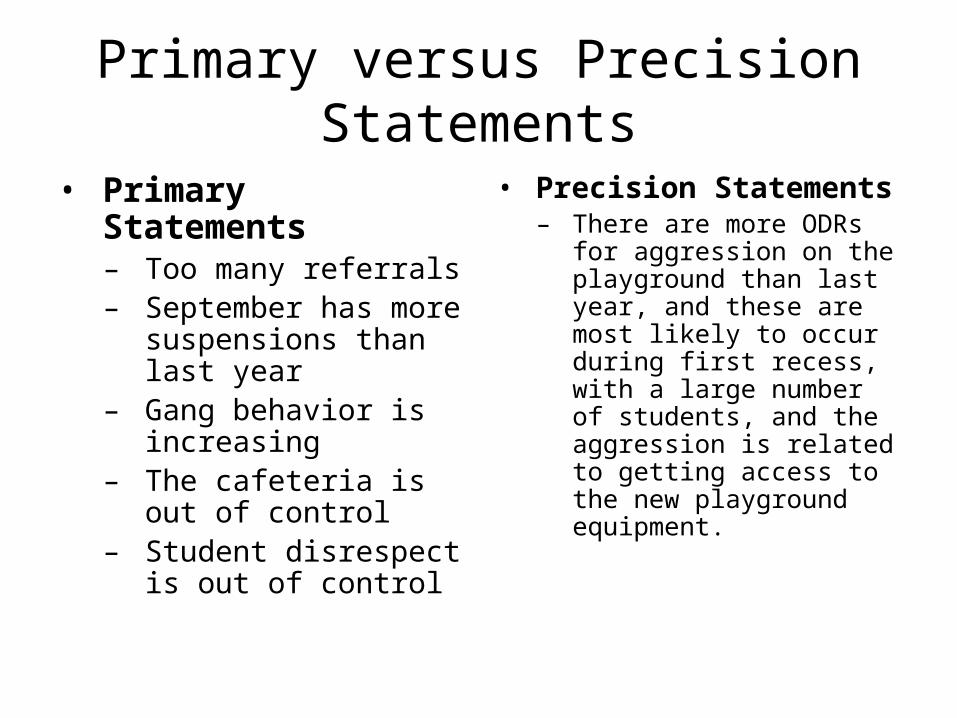
Primary versus Precision Statements
• Primary Statements– Too many referrals– September has more
suspensions than last year
– Gang behavior is increasing
– The cafeteria is out of control
– Student disrespect is out of control
• Precision Statements– There are more ODRs
for aggression on the playground than last year, and these are most likely to occur during first recess, with a large number of students, and the aggression is related to getting access to the new playground equipment.

What are the data you are most likely to need to move from a Primary to a Precise
statement?• What problem behaviors are most common?
– ODR per Problem Behavior• Where are problem behaviors most likely?
– ODR per Location• When are problem behaviors most likely?
– ODR per time of day• Who is engaged in problem behavior?
– ODR per student• Why are problem behaviors sustaining?
– No graph

What other data may you want?
• ODR by staff• ODR by IEP• ODR by grade• ODR by gender by grade• Faculty subjective impressions• Academic performance• Attendance• Information about home status
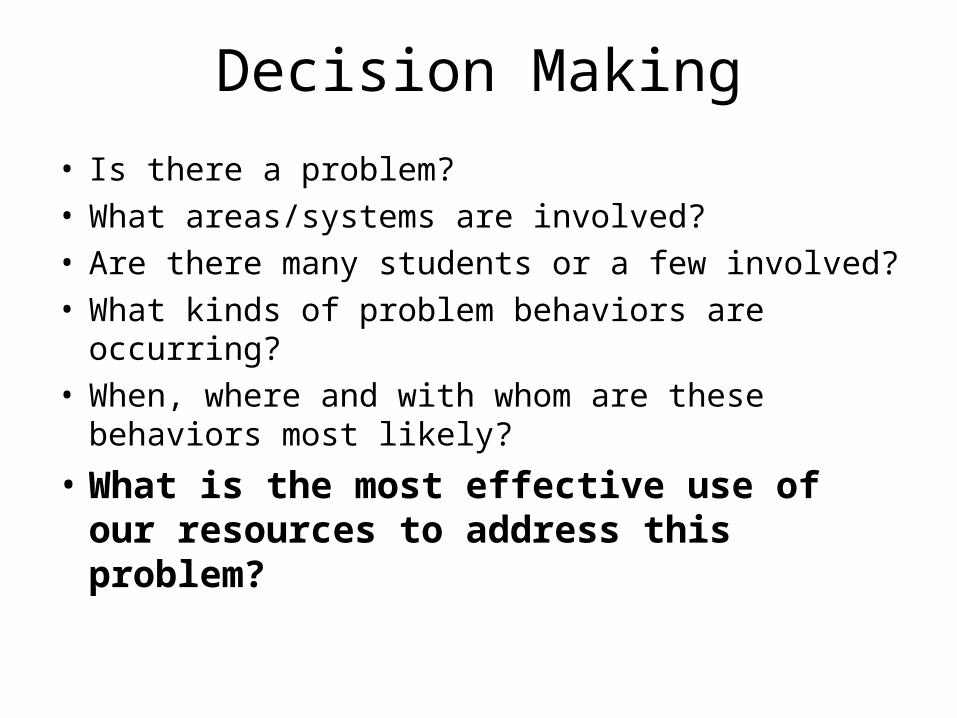
Decision Making
• Is there a problem?• What areas/systems are involved?• Are there many students or a few involved?• What kinds of problem behaviors are occurring?• When, where and with whom are these
behaviors most likely?
• What is the most effective use of our resources to address this problem?

Primary to precise
• Primary– Kids are noisy in the hallway going to reading
• Precise– Many second graders coming from reading
are too loud from room 13 to room 22 and their noise is maintained by peer attention. We also have very little adult supervision available

Using Data to Build Solutions
• Prevention: How can we avoid the problem context?– Who, When, Where– Schedule change, curriculum change, etc
• Teaching: How can we define, teach, and monitor what we want?– Teach appropriate behavior– Use problem behavior as negative example
• Recognition: How can we build in systematic reward for desired behavior?
• Extinction: How can we prevent problem behavior from being rewarded?
• Consequences: What are efficient, consistent consequences for problem behavior?
• How will we collect and use data to evaluate (a) implementation fidelity, and (b) impact on student outcomes?
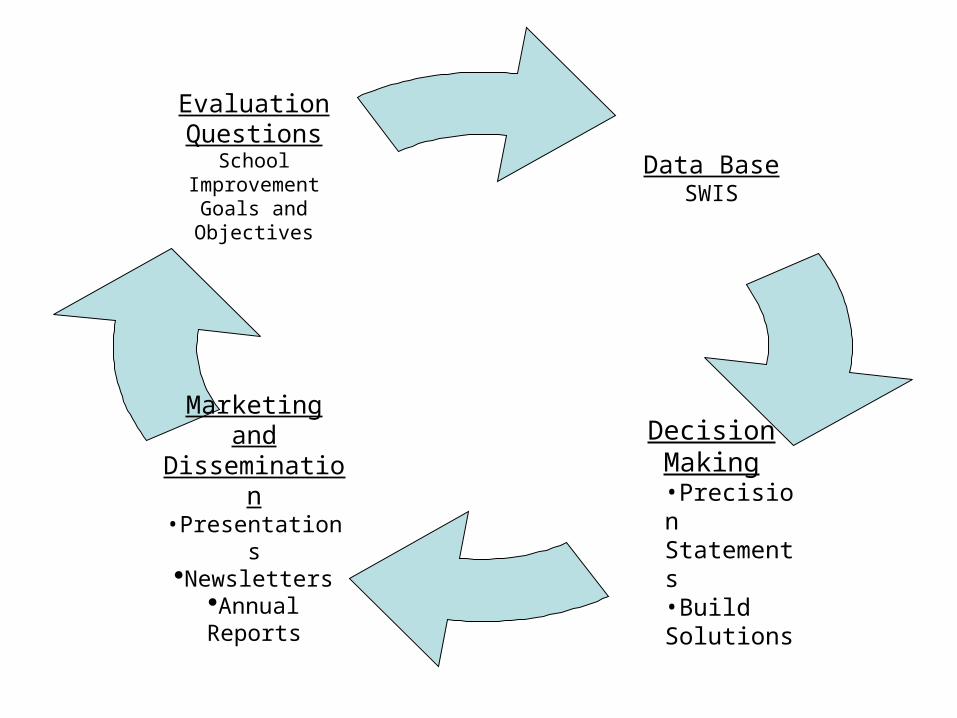
Data BaseSWIS
Decision Making•Precision Statements•Build Solutions
Evaluation Questions
School Improvement
Goals and Objectives
Marketing and Dissemination•PresentationsNewsletters
Annual Reports
Educational Initiatives
• Guiding Principles (Coyne, 2008)– Promoting evidence based practices– Supporting change at the systems level
(feasible, consistent and relevant to local needs)
– Developing local capacity to sustain effective practices over time
Keep it Going!!
• Create Useful Systems of Data Collection• Establish Community of Practice
– We will be more efficient and effective if we share and learn together- Local NETWORKs
• Apply three tiered logic to your work• Showcase and celebrate outcomes!!
– Cost benefit
• Fidelity!!• Action Plan, process tools like BOQ, staff surveys!!!