the bezeq era investors presentation, february 2015
TRANSCRIPT

The Bezeq Era
Investors presentation, February 2015

2
Forward-Looking Statement
This presentation contains forward-looking statements within the meaning of Section 27A of the Securities Act of 1933, as amended, and Section 21E of the Securities Exchange Act of 1934, as amended. Forward-looking statements are statements that are not historical facts and may include financial projections and estimates and their underlying assumptions, statements regarding plans, objectives and expectations with respect to future operations, products and services, and statements regarding future performance. These statements are only predictions based on our current expectations and projections about future events. There are important factors that could cause our actual results, level of activity, performance or achievements to differ materially from the results, level of activity, performance or achievements expressed or implied by the forward-looking statements. Those factors include the factors indicated in our filings with the Securities and Exchange Commission (SEC). For more details, refer to our SEC filings and the amendments thereto, including our Annual Report on Form 20-F and Current Reports on Form 6-K. We undertake no obligation to update forward-looking statements to reflect subsequent occurring events or circumstances, or to changes in our expectations, except as may be required by law.
The information contained in this presentation is subject to, and must be read in conjunction with, all other publically available information, including our Annual Report on Form 20-F for the year ended December 31, 2013, and other filings that we make from time to time including our quarterly data. Any person at any time acquiring securities must do so only on the basis of such person’s own judgment as to the merits or the suitability of the securities for its purpose and only based on such information as is contained in such public filings, after having taken all such professional or other advice as it considers necessary or appropriate in the circumstances and not in reliance on the information contained in the presentation. In making this presentation available, we give no advice and make no recommendation to buy, sell or otherwise deal in our shares or in any other securities or investments whatsoever. No offering of securities shall be made in the United States except pursuant to registration under the U.S. Securities Act of 1933, as amended, or an exemption therefrom. No offering of securities shall be made in Israel except pursuant to an effective prospectus under the Israeli Securities Law, 1968 or an exemption from the prospectus requirements under such law.

BCOM’s Profile
3
B Communications Ltd. (TASE and Nasdaq: “BCOM”) holds the controlling interest (approximately 30.8%) in Bezeq, The Israel Telecommunication Corp. (“Bezeq”), Israel’s largest telecommunications provider (TASE: BEZQ).
BCOM is mainly focused on deleveraging and decreased its net debt from more than NIS 5 billion as of the date it acquired its controlling interest in Bezeq (in April 2010) to NIS 2.5 billion as of September 30, 2014.
On February 19, 2014, BCOM announced the completion of an international offering of US$ 800 million senior secured notes that was used to fully refinance the bank and institutional debt that it incurred to acquire its controlling interest in Bezeq.
BCOM is part of the Eurocom Group in Israel.
3

4
Bezeq and B-Com are ultimately controlled by the Eurocom Group, the most experienced operator in the Israeli telecommunications field
Eurocom was founded in 1979
One of Israel’s largest holding companies with a strong presence in Israel and a growing international presence
Owned by Shaul Elovitch, Chairman of the Board of Directors (80% ownership) and Yossef Elovitch, Director (20% ownership)
Solid financial base and strategic partnerships support growth
Investments in telecommunications, satellite services, media, consumer electronics, real estate and additional fields
Space Communications
Ltd.
Satcom Sys Ltd.
Satlink Communications
Ltd.
Satellite Services
Telecom Consumer Electronic Products
Eurocom Cellular Communications
(Nokia)
Eurocom Digital Communications
(Panasonic)
D.M. EngineeringLtd.
Eurocom RealEstate Ltd.
EITAG Ltd.
Real Estate
Enlight energy Ltd.
Eurocom Capital Finance Ltd.
Investments & Finance
Traded on TASE Traded on NASDAQ
1 YES is 49.8% owned by Bezeq and 50.2% is owned by Eurocom. Following a Supreme Court decision which prevents Bezeq from holding a control interest in YES, as of August 2009, Bezeq ceased consolidating YES financial results and started accounting for its investment in YES according to the equity method (impact on Bezeq’s net income)
Internet Gold (IGLD)
B Communications (B-Com)
Bezeq1
70%
67%
31% control
stake
YES – D.B.S. Satellite Services
(1998) Ltd. 1

Proven capabilities in: • Strategy creation & strategic
planning• Marketing & brand development• Operational & financial management• Management of mergers &
acquisitions• Creation of partnerships• Capital raising: 13 major transactions
• 2 IPOs – IGLD and BCOM• 10 bond issues• $800 million international offering
Doron Turgeman CEO since 2011 & CFO from 2001 till 201119 years experience in management17 years experience in communications
Shaul Elovitch Founder & Chairman Over 30 years experience building leading communications businesses and other major investments businesses
BCOM - Experienced, Disciplined Leadership
5
Chairman of the board of directors of Bezeq and it’s subsidiaries 5
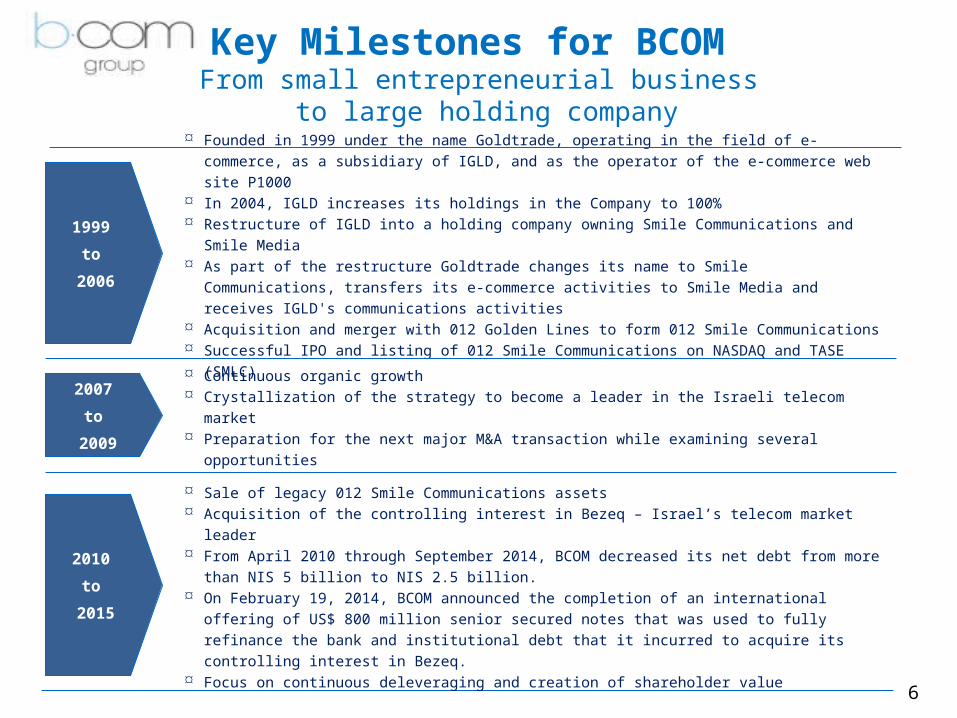
Key Milestones for BCOM From small entrepreneurial business
to large holding company
6
Founded in 1999 under the name Goldtrade, operating in the field of e-commerce, as a subsidiary of IGLD, and as the operator of the e-commerce web site P1000
In 2004, IGLD increases its holdings in the Company to 100% Restructure of IGLD into a holding company owning Smile Communications and Smile Media As part of the restructure Goldtrade changes its name to Smile Communications, transfers
its e-commerce activities to Smile Media and receives IGLD's communications activities Acquisition and merger with 012 Golden Lines to form 012 Smile Communications Successful IPO and listing of 012 Smile Communications on NASDAQ and TASE (SMLC)
1999
to
2006
Continuous organic growth Crystallization of the strategy to become a leader in the Israeli telecom market Preparation for the next major M&A transaction while examining several opportunities
2007
to
2009
2010
to
2015
Sale of legacy 012 Smile Communications assets Acquisition of the controlling interest in Bezeq – Israel’s telecom market leader From April 2010 through September 2014, BCOM decreased its net debt from more than NIS
5 billion to NIS 2.5 billion. On February 19, 2014, BCOM announced the completion of an international offering of US$
800 million senior secured notes that was used to fully refinance the bank and institutional debt that it incurred to acquire its controlling interest in Bezeq.
Focus on continuous deleveraging and creation of shareholder value

Group Structure
7
Eurocom Group
Internet Gold Golden Lines
BCOM
~70%
~66.7%
~31%
~69%
Walla!
100%100%
100%
~50%
100%
Mobile telephonyand data
Fixed-line, broadband infrastructure, data
com
Call centreservices
ILD, ISP,enterprise
solutions
Pay-TV (DTH)
Internet portal
Free float
~30%
Free float
Free float
~33.3%
~100%
Private
• M.cap (Mil. NIS) - 329• NAV(3) (Bil. NIS) - 1.2• Net debt (Mil. NIS) - 801• Net debt / EBITDA – 4.04• Listed - TASE, NASDAQ
• M.cap (Bil. NIS) - 1.8• NAV (2) (Bil. NIS) - 3.1• Net debt (Bil. NIS) – 2.46• Net debt / EBITDA – 3.19• Listed - TASE, NASDAQ
• M.cap (Bil. NIS) – 18.2• TTM EV/EBITDA (4) - 5.5• Net debt / EBITDA (4) –
1.4• Listed - TASE
Source: Company’s information, Bezeq’s investors’ presentation.
(1) All figures are as of September 30, 2014, except for Market Cap. which is at February 4, 2015.
(2) BCOM’s NAV is defined as value of BCOM’s shares according to Bezeq market cap, based on Bezeq stock price as of February 4, 2015
less BCOM’s net debt.
(3) IGLD’s NAV is defined as value of IGLD’s shares according to BCOM’s NAV, based on Bezeq stock price as of February 4, 2015 less IGLD’s
net debt.
(4) Bezeq’s EV/EBITDA and Net Debt/EBITDA ratios are effected by the one-time capital gain generated from the sale of the "Yad2" web site.

Bezeq Overview
8

Bezeq is Israel’s largest telecom group and the most comprehensive infrastructure and service provider
Note: LTM results and KPIs as of 3Q ’14; Subscriber based market share data as of 3Q ’141 Company estimates; Captures private and business sector2 50.2% held by Eurocom. Following a Supreme Court decision which prevents Bezeq from getting control of YES, as of August 2009, Bezeq ceased consolidating YES financial results and started accounting for its investment in YES according to the equity method (impact on Bezeq’s net income)
3 Breakdown based on gross revenue (pre elimination of inter-company revenues)4 Breakdown based on aggregate EBITDA generated by Bezeq Fixed-Line, Pelephone and Bezeq International (pre elimination of inter-company items)5 Company estimates; Based on total broadband Internet infrastructure access services subscribers in the market6 Adjusted EBITDA represents profit before income tax, share of loss of equity-accounted investee, financing expenses, net and depreciation and amortization. EBITDA includes sale of Coral-tell Ltd. (“Yad2”) for NIS 582 million
Bezeq Group Market cap: NIS 18.2bn (as of February 4,
2015) LTM Revenue: NIS 9.2bn LTM Adj. EBITDA6: NIS 4.5bn
100% 100% 100% 49.8%2
Fixed-Line (Telephony, Broadband and Data Transmission)
ISP, ILD and Enterprise
Cellular Pay-TV (DTH)
2.2mm access lines/1.3mm broadband Internet lines
#1 Fixed-Line telephony provider with 63%1 market share
#1 Broadband infrastructure provider with 65% market share
Largest ISP with 41% market share5
Offering full suite of data transfer, network and ICT solutions for small and large enterprises
2.6mm subscribers Among top three
incumbent cellular providers with 26% market share
623K subscribers
Sole licensed DTH provider in Israel with 41% Pay-TV market share
(Pelephone)
LTM Revenue: NIS 4.3bn
46% of total revenues3
LTM EBITDA: NIS 2.6bn
68% of total EBITDA4
LTM Revenue: NIS 1.5bn
16% of total revenues3
LTM EBITDA: NIS 361mm
9% of total EBITDA4
LTM Revenue: NIS 1.7bn
LTM EBITDA:NIS 564mm
YES results are not consolidated into Bezeq financials2
LTM Revenue: NIS 3.6bn
38% of total revenues3
LTM EBITDA: NIS 883mm
23% of total EBITDA4
9

Bezeq is the historical incumbent and since its privatization in 2005 has been controlled under a Control Permit attached to the 30% stake
Control permitControl permit
Control in Bezeq is held by holders of a pre-approved permit from the Israeli Prime Minister and the Ministry of Communications (“Control Permit”)
Only a party that holds a Control Permit may exercise its holdings in such a manner as to direct the activities of Bezeq
B-Com is the only shareholder that has a permit to direct the activities of Bezeq
B-Com has nominated all of the members of Bezeq’s board of directors who were elected by shareholders1
B-Com consolidates Bezeq’s financial statements based on its de-facto control of Bezeq
2005 2010 2012
Bezeq begins operating as a governmental
company responsible for all communications
services in Israel
Bezeq begins operating as a governmental
company responsible for all communications
services in Israel
Privatization of Bezeq
Apax-Saban-Arkin consortium purchases the control stake for NIS 4.2bn
Privatization of Bezeq
Apax-Saban-Arkin consortium purchases the control stake for NIS 4.2bn
Bezeq International launches its submarine
cable
Bezeq International launches its submarine
cable
1990
Listing on the TASEListing on the TASE
2009
Bezeq launches the NGN network
Pelephone launches High Speed GSM+ network
Board approves dividend policy of 100% of net income
Bezeq launches the NGN network
Pelephone launches High Speed GSM+ network
Board approves dividend policy of 100% of net income
History and milestonesHistory and milestones
Stella Handler appointed CEO of Bezeq (Fixed-Line)
FTTH/FTTB deployment underway (BFIBER)
Stella Handler appointed CEO of Bezeq (Fixed-Line)
FTTH/FTTB deployment underway (BFIBER)
B-Com acquires the control stake from
Apax-Saban-Arkin for NIS 6.5bn
B-Com acquires the control stake from
Apax-Saban-Arkin for NIS 6.5bn
Source: Company information1 Excluding employee representatives on the Board whose nominations require the prior approval of our ultimate controlling shareholder, Mr. Shaul Elovitch,
as chairman of Bezeq’s Board of Directors, pursuant to Bezeq’s collective bargaining agreement
Fiber deployment will reach 1,000,000 households by the end of 2014
Pelephone launches High Speed 4G services
Wholesale regulation approved
Fiber deployment will reach 1,000,000 households by the end of 2014
Pelephone launches High Speed 4G services
Wholesale regulation approved
10
1984 1990 2005 2009 2010 2012 2013 2014

90100110120130140150160170180
Israel Eurozone USA
Bezeq operates in an attractive macroeconomic environment with unique characteristics
Source: EIU; Israel Central Bureau of Statistics; Company data; Public filings for competitors’ data1 Indicates credit rating and outlook by S&P / Moody’s2 Mobile subscribers based on total UMTS subscribers for all MNOs; Broadband internet subscribers based on Bezeq and HOT subscribers; Fixed-Line telephony lines
based on Bezeq, HOT, Cellcom, Partner and other operators3 Based on aggregate revenues of the 4 largest telecom groups: Bezeq (incl. YES), HOT, Cellcom and Partner; USD/NIS conversion based on exchange rate of 3.47 as
of December 31, 2013
2000-2012 CAGR
+3.4% +1.0% +1.7%
The Israeli economy benefits from positive fundamentals as reflected in its A+/A1 (stable)1 sovereign credit rating
The Israeli economy benefits from positive fundamentals as reflected in its A+/A1 (stable)1 sovereign credit rating
The Israeli telecommunications market is growing alongside the growth in population...
The Israeli telecommunications market is growing alongside the growth in population...
Bezeq Group40%
HOT17%
Cellcom Group20%
Partner Group18%
Total 2013 revenue: $7.2bn3
Duopoly in infrastructure market with Bezeq and HOT as sole owners of fixed-line infrastructure
High penetration and usage rates across all telecommunications services
Technology driven market with rapid adoption rate of new technologies
Strong brand appreciation and loyalty with high premium
Relatively young population
2010A 2011A 2012A 2013A 3Q 2014
3,453 3,543 3,514 3,508 3,509
9,411 9,372 9,616 9,682 9,750
1,818 1,879 1,940 2,007 2,062
Total fixed line subscribers Total mobile subscribersTotal broadband subscribers
2
...and Bezeq is the largest player in the market with the largest revenue share
...and Bezeq is the largest player in the market with the largest revenue share
% of total market revenue
Aggregate mobile, broadband internet and fixed-line telephony lines ('000s)
Consistent high GDP growth...Consistent high GDP growth...
2012-2016E CAGR
+3.9% +0.8% +2.3%
...with strong underlying population growth...with strong underlying population growth
2009 2010 2011 2012 2013 2Q 2014
7.6 7.7 7.8 8.0 8.1 8.2
Israel population (...
1.8%% Population growth in Israel
1.9% 1.8% 1.9%Real GDP (rebased to
100) 1.9%
11

Bezeq’s leading position is supported by its fully ownedadvanced network infrastructure and technology across all lines of business
Bezeq Fixed-LineBezeq Fixed-Line PelephonePelephone
YESYESBezeq InternationalBezeq International
Extended optical fiber deployment underway – Bfiber (FTTH/FTTB)
Fiber rollout is on track to reach 1,000,000 households by end of 2014
The only fixed-line company with a nationwide fiber network
Implementing VDSL and vectoring technologies
Highly advanced nationwide NGN network that has led to impressive achievements
Average speed among Bezeq subscribers has increased from 17.3 Mbps in Q3 2013 to 24.0 Mbps in Q3 2014
Advanced infrastructure following the launch of submarine cable in 2012 (“Jonah”)
Among the most advanced in the world (40G upgradable to 100G)
Key differentiator over competition
Only Israeli ISP to own an international infrastructure
Increased capacity and Internet performance
Potential revenue streams from future sale of additional cable capacity
Full cable redundancy
Pioneer in HD broadcasting, advanced set-top box combining PVR, VOD & HD, and streamer
Leader in value added services based on Hybrid satellite-IP platform and Progressive Download technology
Launched “yes Multiroom” service (first in Israel)
Recently launched “yes Go” - TV Everywhere service (first in Israel)Madrid
LondonPoP
FrankfurtPoP
Valencia
Paris
Brussels
Amsterdam
Zurich
MilanBucharest
Budapest
Bratislaw
Prague
Vienna
Palermo Catania
Marseille
Rome Bari
Chania
Athens
Tel-Aviv
Haifa
Cyprus
Istanbul
Thessalonica
Sofia
Jordan
Jonah cableAriel cable
Israel
12
Fast and advanced network Rolling out High Speed 4G network , using
LTE technology. In 2015 majority of the population will
enjoy 4G coverage Covers substantially all of Israel with 2 switch
farms connected to approximately 2,200 sites The network performances expected to upsurge
following the LTE frequency tender

Bezeq Fixed-Line is the leading company in Telephony, Broadband and Data Transmission Services
Source: Company data and competitors’ public filings1 Average revenue per user not including revenues from data communications and transmissions services, internet services, services to communications providers, and contract and other services. Based on average subscribers for the period. 2 Represents HOT Q1 ’13 ARPU; Broadband ARPU not available after Q1 ’13; Q4 ’12 ARPU not available
2011A 2012A 2013A LTM Sept 14
80 81 84 84
’11- 3Q ’14 LTM CAGR: 8.1%
...and broadband ARPU1 continues to increase and drive revenues
...and broadband ARPU1 continues to increase and drive revenues
Broadband revenues(NIS mm)
Since 2011 the number of telephony lines has decreased moderately and remained meaningful...
Since 2011 the number of telephony lines has decreased moderately and remained meaningful...
2011A 2012A 2013A 3Q 2014A
2,367 2,268 2,216 2,205
Bezeq access lines
(000’s)
1,092 1,166 1,287 1,354
ARPU (NIS)
...and the decline which characterized 2012-2013 has abated during 2014 and nearly stopped
...and the decline which characterized 2012-2013 has abated during 2014 and nearly stopped
Cancellation of “Naked DSL” Unlimited packages introduced to the market by
mobile operators
2011A 2012 A 2013 A 9M 2014A
45 58
94
72 61 61 67
55
Growth in Bezeq broadband subs (000's)
Growth in to-tal broad-band market subs (000's)
Bezeq marketshare (%)
Bezeq has been consistently increasing its market share in the broadband infrastructure market...
Bezeq has been consistently increasing its market share in the broadband infrastructure market...
60.3 % 64.7 %59.1 % 62.9 %
HOT’s ARPU 57 62 662
1Q 13A 2Q 13A 3Q 13A 4Q 13A 1Q 14A 2Q 14A 3Q 14A
-26 -18
-1-7
-2-9
0
Bezeq access lines net adds (000’s)
13

Bezeq Fixed-Line presents high performance compare to global benchmark indicators
Incumbent rolling 12 month fixed broadband market share gains (Q3-14)
Incumbent rolling 12 month fixed broadband market share gains (Q3-14)
14
Incumbent retail wireline line loss by operator
(Q3-14 YoY change %)
Incumbent retail wireline line loss by operator
(Q3-14 YoY change %)
Bezeq
UK
Austria
Belgium
Sweden
The Neths
Europe
France
Portugal
Germany
Norway
Denmark
2.8%
0.9%
0.5%
0.3%
0.2%
-0.2%
-0.6%
-0.8%
-1.3%
-1.3%
-1.5%
-2.4%
Austria
Bezeq
Portugal
Germany
France
UK
Belgium
Europe
Denmark
Neths
Sweden
Norway
0.1%
-0.8%
-2.4%
-3.6%
-3.7%
-3.9%
-4.0%
-4.4%
-5.0%
-6.2%
-7.6%
-12.9%
Source: Company data, Credit Suisse research Q3 2014

Source: Company data and competitors’ public filings1 Calculated as total revenues less operating profit
Pelephone presents the smallest net subscriber loss and the highest ARPU in the mobile market
…it was able to support high EBITDA margins relative to peers
…it was able to support high EBITDA margins relative to peers
2011A 2012A 2013A 9M 2014
35%32% 28%
27%
34%
30%
27% 27%32%
29%22%
23%
Pelephone Cellcom Partner
(9p.p.)
(7p.p.)
(8p.p.)
’11 – 9M ‘14 change
Pelephone emerged with the highest ARPU following the turmoil in the Israeli mobile market...
Pelephone emerged with the highest ARPU following the turmoil in the Israeli mobile market...
2011A 2012A 2013A 1Q 14A 2Q 14A 3Q 14A
107
95 86 80 79 78
106 88 79
75 75 71
11197
8377
76 76
Pelephone CellcomPartner
ARPU by operator (in NIS)
(31.5%)
(33.4%)
’11 – 3Q ‘14 change
(27.1%)
2013A Q1 14A Q2 14A Q3 14A
2,956 2,936 2,914 2,894
3,092 3,049 3,029 3,010
2,642 2,631 2,610 2,600
Partner Cellcom Pelephone
(62k subs)
(42k subs)
’13 – Q3 ‘14 change
Subs (000’s)
…recording the smallest net subscriber loss over the period...
…recording the smallest net subscriber loss over the period...
(82k subs)
EBITDA margin of total mobile revenues (%)
New MNOs enter the market
2011A 2012A 2013A LTM Sept 2014
4,188
3,5763,201 3,116
...and by implementing efficiencies that led to improved cost base...
...and by implementing efficiencies that led to improved cost base...
Pelephone Opex 1
(NIS mm)
15

Bezeq International is the leading ISP, ILD and business solutions provider
…and Bezeq International has been outgrowing peers and successfully increasing its market share in the ISP market
…and Bezeq International has been outgrowing peers and successfully increasing its market share in the ISP market
Source: Company data and competitors’ public filings1 Total revenues excluding ILD revenue
The ISP market has been growing consistently with the broadband infrastructure market...
The ISP market has been growing consistently with the broadband infrastructure market...
2011A 2012A 2013A Sept 2014
1,879 1,940
2,007 2,062
Total broadband infrastructure subs (000’s)
2011A 2012A 2013A
941 957
1,032
ISP, ICT and data are Bezeq International’s growth engines...
ISP, ICT and data are Bezeq International’s growth engines...
ISP, ICT and data revenues1
(NIS mm)
72%69.5% 71.4%% of total BezeqInternational revenues
2011A 2012A 2013A LTM Sept 2014
350 355 357 361
25.9% 26.5%24.9% 24.5%
...offsetting decline in ILD and allowing it to maintain overall stable EBITDA level and margin despite competition
...offsetting decline in ILD and allowing it to maintain overall stable EBITDA level and margin despite competition
Bezeq International EBITDA (NIS mm)
EBITDA margin (%)
Bezeq international ISP market share (%)
3.2% 3.5% 2.7%
2010A 2011A 2012A 2013A 3Q 2014A
35.9% 37.5%
38.9% 40.0%
41.0%
16

Q2 2013A
Q3 2013A
Q4 2013A
Q1 2014A
Q2 2014A
Q3 2014A
5 10 8 6
6 10
(4)
(13)
(6) (3)2
(12)
YES
HOT
YES (Multi Channel Satellite TV - DTH) presents sustained growth in market share
Growth in subscribers and market share continues…
Growth in subscribers and market share continues…
YES’s unparalleled content offering continues to be a key differentiator vs. HOT...
YES’s unparalleled content offering continues to be a key differentiator vs. HOT...
YESMarket share %
...while maintaining stable ARPU despite premium pricing
...while maintaining stable ARPU despite premium pricing
2013A 1Q 14A 2Q 14A 3Q 14A
233 234 234 233YES ARPU (NIS)
39.5% 40.7% 41.0% 42.0%
HOT’s Pay-TVARPU2
209
Source: Company data and competitors’ public filings1 According to TNS Israel, September 2014, conducted at yes’s request2 HOT no longer reports Pay-TV ARPU as of Q1 ’13
8 wins in “docaviv festival” 2014
47 wins in the 2014 Emmy awards (films, series and Documentaries films)
7 out of the 10 most watched series in the US are broadcasted on yes.
17
Which company broadcast the best content?1
HOTyes
41.2%
Net growth in Pay-TV market (000’s subs)
40.2%

Bezeq Group - Financial overview
2011A 2012A 2013A LTM Sept 2014
11,373 10,278
9,563 9,202
5,825 5,810 5,754 5,635
Consolidated revenue (NIS mm)
Revenue excl. Pelephone (NIS mm)
Bezeq has substantial revenue level…Bezeq has substantial revenue level……and has delivered consistent expansion in EBITDA1 margin…
…and has delivered consistent expansion in EBITDA1 margin…
2011A 2012A 2013A LTM Sept 2014
4,650 4,477 4,130 4,474
2,729 3,054 3,0653,591
40.9% 43.6% 43.2%48.6%
Consolidated Adj. EBITDA (NIS mm)Adj. EBITDA excl. Pelephone (NIS mm)Consolidated Adj. EBITDA margin
…resulted in high levels of OpFCF3 and cash conversion
…resulted in high levels of OpFCF3 and cash conversion
2011A 2012A 2013A LTM Sept 2014
2,747 2,937 2,902
3,196
59.1%
65.6%70.3
%
% of consolidate
d Adj. EBITDA3
(OpFCF conversion
ratio)
2011A 2012A 2013A LTM Sept 2014
1,903
1,540
1,228 1,278
1,637 1,235
916 1,038
Consolidated capex (NIS mm) Net capex (NIS mm)
Capex % of Revenue
16.7%
15.0%
12.8%13.9
%71.4
%
1 Adjusted EBITDA represents profit before income tax, share of loss of equity-accounted investee, financing expenses, net and depreciation and amortization. The EBITDA includes Coral tell Ltd. (Yad2) sale which amounted 582 million NIS2 Net capex reflects cash flows received from disposal of real estate and copper3 Operating Free Cash Flow defined as Consolidated Adj. EBITDA – Consolidated Capex
2
...which combined with stable capex levels......which combined with stable capex levels...
Consolidated OpFCF (NIS mm)
18

Bezeq’s dividend distribution has been meaningful and consistent over the years
2006A 2007A 2008A 2009A 2010A 2011A 2012A 2013 9M 2014A
1,600 1,060
1,514 1,941 2,195 2,155 2,071 1,830 2,069
1,800²
1,5383 1,000² 1,000²
1,0002
59.9%
151.9%
89.9% 87.8%
169.1%
203.7%
110.5%87.5%
59.9% 56.3%89.9% 87.8%
99.5%
139.1%
74.5%56.6%
92.2%
Bezeq Group - Dividends by Year (NIS mm)Bezeq Group - Dividends by Year (NIS mm)
Bezeq has a board-approved dividend policy of distributing 100% of net profit attributable to shareholders on a semi-annual basis
100% distribution has been effective since 2006 (following Bezeq’s privatization) and was officially approved as a policy by the board in 2009
Special Dividend of NIS 3.0bn from 2011 to 2013 via capital reduction Special dividend was distributed in 2007 by previous control shareholders
Total Dividend/FCF¹
¹ Based on regular and special dividends paid during the fiscal year; FCF calculated as (Operating cash flow – net capex)² Special dividend3 One-off dividend paid after Bezeq ceased to consolidate YES financial results
1,600
2,860
1,514
1,941
3,733
3,1553,071
2,069
Regular Dividend/FCF¹
Regular dividend
Special / One-off dividend
19
2,830

Reduction in Bezeq’s Net Debt
20
8,582 8,085
7,323 6,951 6,269
September 2013 December 2013 March 2014 J une 2014 September 2014
Bezeq Group – Net Debt (NIS mm)Bezeq Group – Net Debt (NIS mm)
Bezeq’s net debt is calculated as Bezeq’s gross debt less Bezeq’s cash and cash equivalents and investments in marketable securities.

21
Financials & KPI
22
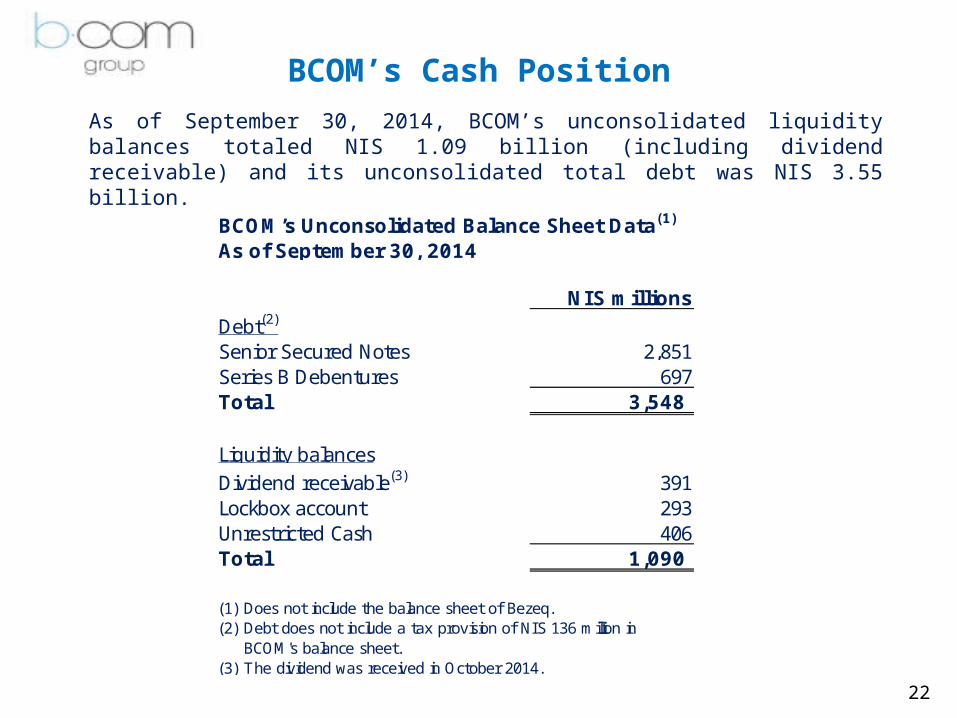
BCOM’s Cash Position
As of September 30, 2014, BCOM’s unconsolidated liquidity balances totaled NIS 1.09 billion (including dividend receivable) and its unconsolidated total debt was NIS 3.55 billion.
BCOM’s Unconsolidated Balance Sheet Data(1)
NIS millionsDebt(2)
Senior Secured Notes 2,851Series B Debentures 697Total 3,548
Liquidity balancesDividend receivable(3) 391 Lockbox account 293 Unrestricted Cash 406 Total 1,090
(1) Does not include the balance sheet of Bezeq.(2) Debt does not include a tax provision of NIS 136 million in(2) BCOM's balance sheet.(3) The dividend was received in October 2014.
As of September 30, 2014

23
BCOM During 2014
January 1, 2014 December 31, 2014
BCOM's share in Bezeq's market cap (NIS Billions) 4.97 5.86
Net Financial Debt (NIS Billions)(1) 2.74 2.46
NAV (NIS Billions)(2) 2.23 3.41
Debt Weighted Duration (In years) 2.77 4.45
LTV (3) 55.1% 41.9%
Local rating of Series B Debentures A2 A1
Series B Debentures YTM 4.13% 2.68%
Total Liquidity (NIS Billions)(4) 0.66 1.00
Scheduled 12M Principal and Interest Payments (NIS Millions) 505 277
Bcom Debt Coverage Ratio(5) 1.51 2.69
BCOM's proportional Net Debt / EBITDA(6) 4.20 3.19
(1) Net financial debt reported at December 31, 2013 and September 30, 2014.
(2) NAV is calculated as BCOM's share in Bezeq's market cap minus its Net Financial debt.
(3) LTV is calculated as BCOM's Net Financial debt divided by its share in Bezeq's market cap.
(4) For December 31, 2014 total liquidity was estimated based on liquidity balances for September 30, 2014 less
(4) interest payments on our Senior Secured Notes paid in Q4-14.
(5) Debt coverage ratio is calculated as dividends received by BCOM in TTM divided by scheduled interest and principal
payments (excluding early repayments).
(6) Net Debt / EBITDA at December 31, 2013 and September 30, 2014.

24
BCOM Solo- Asset Balances(NIS millions)
Statements of Financial Position December 31, 2013 September 30, 2014AssetsCash and cash equivalents 129 22Investments including derivatives 534 677Other receivables 5 4Dividend receivable - 390Total current assets 668 1,093
Investments in investee 3,874 3,638Total non-current assets 3,874 3,638
Total assets 4,542 4,731

25
BCOM Solo- Liability Balances(NIS millions)
Statements of Financial Position December 31, 2013 September 30, 2014LiabilitiesCurrent maturities 233 - Short-term debentures 62 - Trade payables 2 1Other payables including derivatives 171 252Total current liabilities 468 253
Long term loans form banks and others 2,261 - Debentures 818 3,593Total non-current liabilities 3,079 3,593
Total liabilities 3,547 3,846
Total equity 995 885
Total liabilities and equity 4,542 4,731

26
BCOM Solo P&L(NIS Millions)
Q1/ 2014 Q2/ 2014 Q3/ 2014 1-9/ 2014
BCOM's Prfit & Loss
G&A expenses (1) (1) (1) (3)
Financing expenses, net (1) (310) (100) (99) (509)
Total expenses (311) (101) (100) (512)
Interest in Bezeq's net income (2) 141 250 132 523
PPA amortization, net (33) (42) (34) (109)
Net income (loss) (203) 107 (2) (98)
(1) Financing expenses in Q1/2014 included NIS 179 million of one-time expenses related to the early repayment of bank(1) and institutional loans and the early redemption of all outstanding Series A Debentures following the issuance of the
(1) Senior Secured Notes.
(2) Bezeq results for Q2/2014 included NIS 582 million one-time capital gain (before tax) from the sale of the "Yad2"

BCOM Debt Repayment Schedule (NIS millions)
27• All amounts include future estimated interest payments 27
231 231 231 231 231 231
2,842
46217 205 194 182
277
448 436 425 413
231
2,842
-
500
1,000
1,500
2,000
2,500
3,000
Senior Secured Notes Series B Debentures

Reduction in BCOM’s Net DebtFrom the Bezeq acquisition and until September 30, 2014
(NIS Millions)
28
(4,428)(4,206)
(4,264) (3,986)(3,617)
(3,308)(2,968)
(2,642)(2,698) (2,427)
(5,600)
(4,600)
(3,600)
(2,600)
(1,600)
(600)
400
1,400
Cash and cash eqivalents Dividend receivable Loans from banks and institutions Debentures Other Net Finacial Debt

Bezeq Era
Thank you
29