the berman value folio - forbes 03, 2015 · the berman value folio ... ebay is probably worth...
TRANSCRIPT
The only thing harder than making one difficult decision is making two. eBay (EBAY) has finally spun-off the PayPal (PYPL) unit. This leaves us with two very separate companies with vastly different business dynamics, each of which must be held or sold.
EBAY is the slower growth auction business that retains some relevance, but remains the distant also-ran to Amazon (AMZN) in a "buy it now" world.
PYPL is the fast growth payments company that recently acquired Venmo and Xoom to establish its dominance in every manner of electronic remittance? while being challenged on all sides by the shifting pixels of new competitors like Apple and Square.
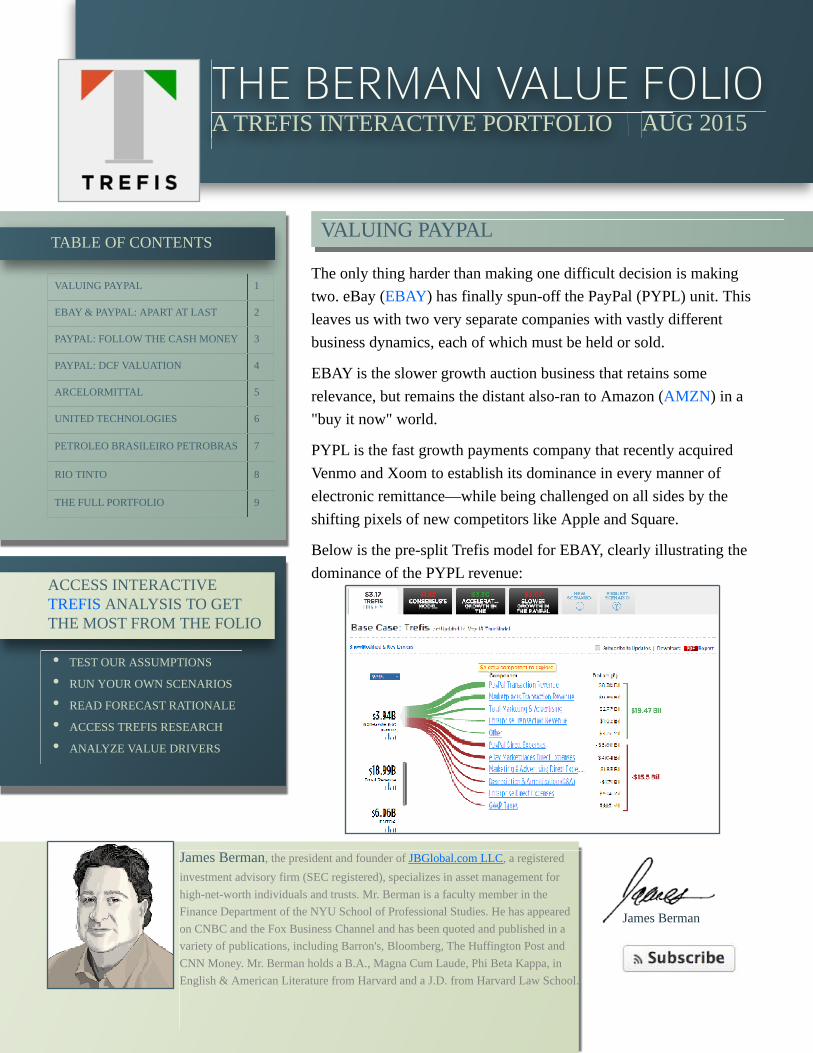
Below is the pre-split Trefis model for EBAY, clearly illustrating the dominance of the PYPL revenue:
James Berman
THE BERMAN VALUE FOLIOA TREFIS INTERACTIVE PORTFOLIO
TABLE OF CONTENTS
ACCESS INTERACTIVE TREFIS ANALYSIS TO GET THE MOST FROM THE FOLIO
James Berman, the president and founder of JBGlobal.com LLC, a registered
investment advisory firm (SEC registered), specializes in asset management for high-net-worth individuals and trusts. Mr. Berman is a faculty member in the Finance Department of the NYU School of Professional Studies. He has appeared on CNBC and the Fox Business Channel and has been quoted and published in a variety of publications, including Barron's, Bloomberg, The Huffington Post and CNN Money. Mr. Berman holds a B.A., Magna Cum Laude, Phi Beta Kappa, in English & American Literature from Harvard and a J.D. from Harvard Law School.
VALUING PAYPAL
AUG 2015
VALUING PAYPAL 1
EBAY & PAYPAL: APART AT LAST 2
PAYPAL: FOLLOW THE CASH MONEY 3
PAYPAL: DCF VALUATION 4
ARCELORMITTAL 5
UNITED TECHNOLOGIES 6
PETROLEO BRASILEIRO PETROBRAS 7
RIO TINTO 8
THE FULL PORTFOLIO 9
- TEST OUR ASSUMPTIONS
- RUN YOUR OWN SCENARIOS
- READ FORECAST RATIONALE
- ACCESS TREFIS RESEARCH
- ANALYZE VALUE DRIVERS
2
555
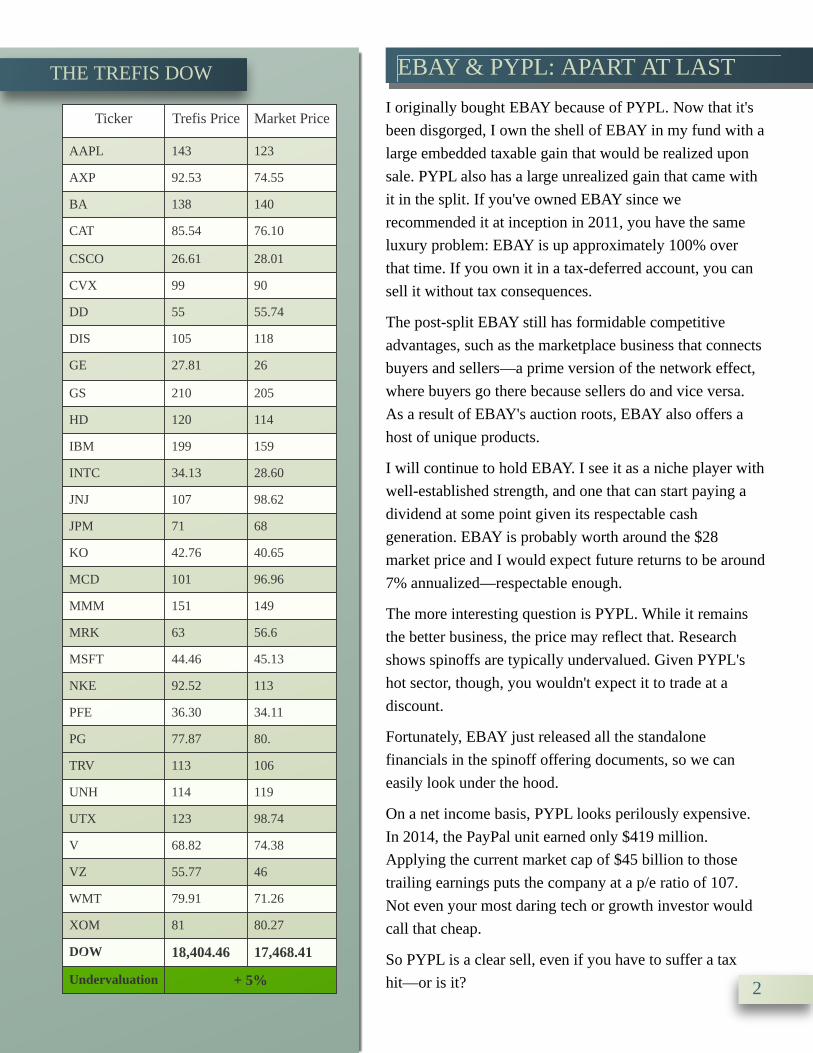
THE TREFIS DOW
Ticker Trefis Price Market Price
AAPL 143 123
AXP 92.53 74.55
BA 138 140
CAT 85.54 76.10
CSCO 26.61 28.01
CVX 99 90
DD 55 55.74
DIS 105 118
GE 27.81 26
GS 210 205
HD 120 114
IBM 199 159
INTC 34.13 28.60
JNJ 107 98.62
JPM 71 68
KO 42.76 40.65
MCD 101 96.96
MMM 151 149
MRK 63 56.6
MSFT 44.46 45.13
NKE 92.52 113
PFE 36.30 34.11
PG 77.87 80.
TRV 113 106
UNH 114 119
UTX 123 98.74
V 68.82 74.38
VZ 55.77 46
WMT 79.91 71.26
XOM 81 80.27
DOW 18,404.46 17,468.41
Undervaluation + 5%
EBAY & PYPL: APART AT LAST
I originally bought EBAY because of PYPL. Now that it's been disgorged, I own the shell of EBAY in my fund with a large embedded taxable gain that would be realized upon sale. PYPL also has a large unrealized gain that came with it in the split. If you've owned EBAY since we recommended it at inception in 2011, you have the same luxury problem: EBAY is up approximately 100% over that time. If you own it in a tax-deferred account, you can sell it without tax consequences.
The post-split EBAY still has formidable competitive advantages, such as the marketplace business that connects buyers and sellers? a prime version of the network effect, where buyers go there because sellers do and vice versa. As a result of EBAY's auction roots, EBAY also offers a host of unique products.
I will continue to hold EBAY. I see it as a niche player with well-established strength, and one that can start paying a dividend at some point given its respectable cash generation. EBAY is probably worth around the $28 market price and I would expect future returns to be around 7% annualized? respectable enough.
The more interesting question is PYPL. While it remains the better business, the price may reflect that. Research shows spinoffs are typically undervalued. Given PYPL's hot sector, though, you wouldn't expect it to trade at a discount.
Fortunately, EBAY just released all the standalone financials in the spinoff offering documents, so we can easily look under the hood.
On a net income basis, PYPL looks perilously expensive. In 2014, the PayPal unit earned only $419 million. Applying the current market cap of $45 billion to those trailing earnings puts the company at a p/e ratio of 107. Not even your most daring tech or growth investor would call that cheap.
So PYPL is a clear sell, even if you have to suffer a tax hit? or is it?
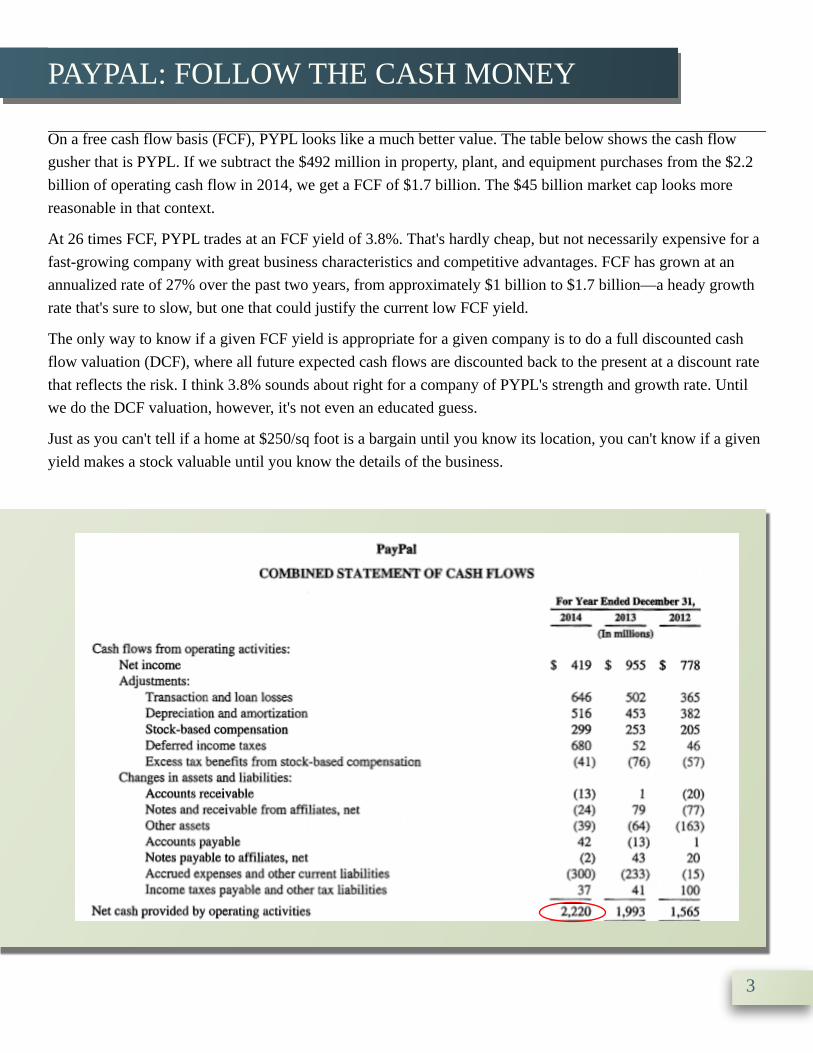
On a free cash flow basis (FCF), PYPL looks like a much better value. The table below shows the cash flow gusher that is PYPL. If we subtract the $492 million in property, plant, and equipment purchases from the $2.2 billion of operating cash flow in 2014, we get a FCF of $1.7 billion. The $45 billion market cap looks more reasonable in that context.
At 26 times FCF, PYPL trades at an FCF yield of 3.8%. That's hardly cheap, but not necessarily expensive for a fast-growing company with great business characteristics and competitive advantages. FCF has grown at an annualized rate of 27% over the past two years, from approximately $1 billion to $1.7 billion? a heady growth rate that's sure to slow, but one that could justify the current low FCF yield.
The only way to know if a given FCF yield is appropriate for a given company is to do a full discounted cash flow valuation (DCF), where all future expected cash flows are discounted back to the present at a discount rate that reflects the risk. I think 3.8% sounds about right for a company of PYPL's strength and growth rate. Until we do the DCF valuation, however, it's not even an educated guess.
Just as you can't tell if a home at $250/sq foot is a bargain until you know its location, you can't know if a given yield makes a stock valuable until you know the details of the business.
3
PAYPAL: FOLLOW THE CASH MONEY
The two main components of any DCF are the expected growth rate of the cash flows and the discount rate. Since no one has a crystal ball, it's best to make these assumptions conservative. Any model is only as good as its inputs: garbage in, garbage out. The best way to mitigate this risk is to use numbers that reflect a reasonable but restrained upside.
In conventional finance, the discount rate is the weighted average cost of capital (WACC), as measured by the cost of debt and cost of equity, adjusted for their proportions. Since cost of equity calculations rely on Beta, a volatility statistic that I believe measures risk incorrectly, I use my own estimate of fundamental risk based on a benchmark for the average company of 10%. Then I adjust up or down for (1) the fundamental financial strength and (2) the competitive dynamics of the business.
With PYPL, the stellar balance sheet and cash generation are above average, as are the structural economic advantages? while the competitive space is
more intense than usual. The higher the risk, the higher the discount rate. After adjusting up from 10% for heightened competition and adjusting back down for the good financials and business qualities, I end up with a discount rate of 11%. My actual calculation is 10.6%, but I'm rounding up to be? you guessed it? conservative.
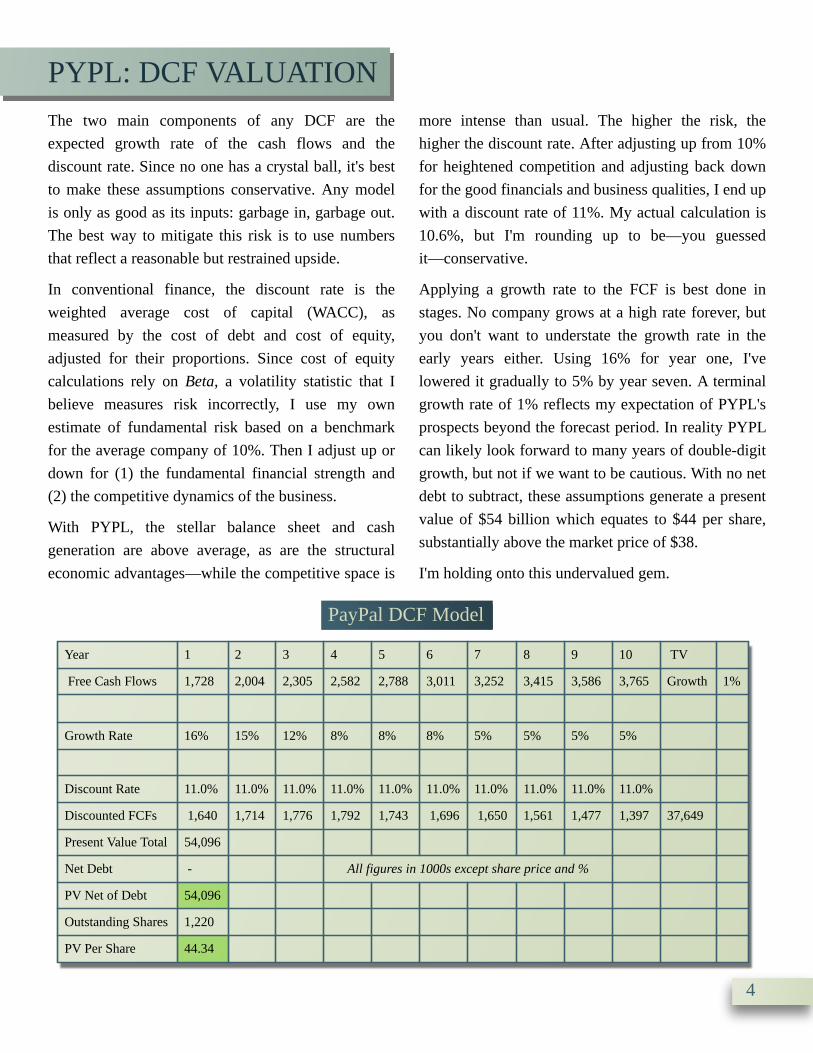
Applying a growth rate to the FCF is best done in stages. No company grows at a high rate forever, but you don't want to understate the growth rate in the early years either. Using 16% for year one, I've lowered it gradually to 5% by year seven. A terminal growth rate of 1% reflects my expectation of PYPL's prospects beyond the forecast period. In reality PYPL can likely look forward to many years of double-digit growth, but not if we want to be cautious. With no net debt to subtract, these assumptions generate a present value of $54 billion which equates to $44 per share, substantially above the market price of $38.
I'm holding onto this undervalued gem.
PYPL: DCF VALUATION
Year 1 2 3
Free Cash Flows 1,728 2,004 2,305
Growth Rate 16% 15% 12%
4 5 6 7 8 9 10 TV
2,582 2,788 3,011 3,252 3,415 3,586 3,765 Growth 1%
8% 8% 8% 5% 5% 5% 5%
Discount Rate 11.0% 11.0% 11.0% 11.0% 11.0% 11.0% 11.0% 11.0% 11.0% 11.0%
Discounted FCFs 1,640 1,714 1,776 1,792 1,743 1,696 1,650 1,561 1,477 1,397 37,649
Present Value Total 54,096
Net Debt - All figures in 1000s except share price and %
PV Net of Debt 54,096
Outstanding Shares 1,220
PV Per Share 44.34
4
PayPal DCF Model
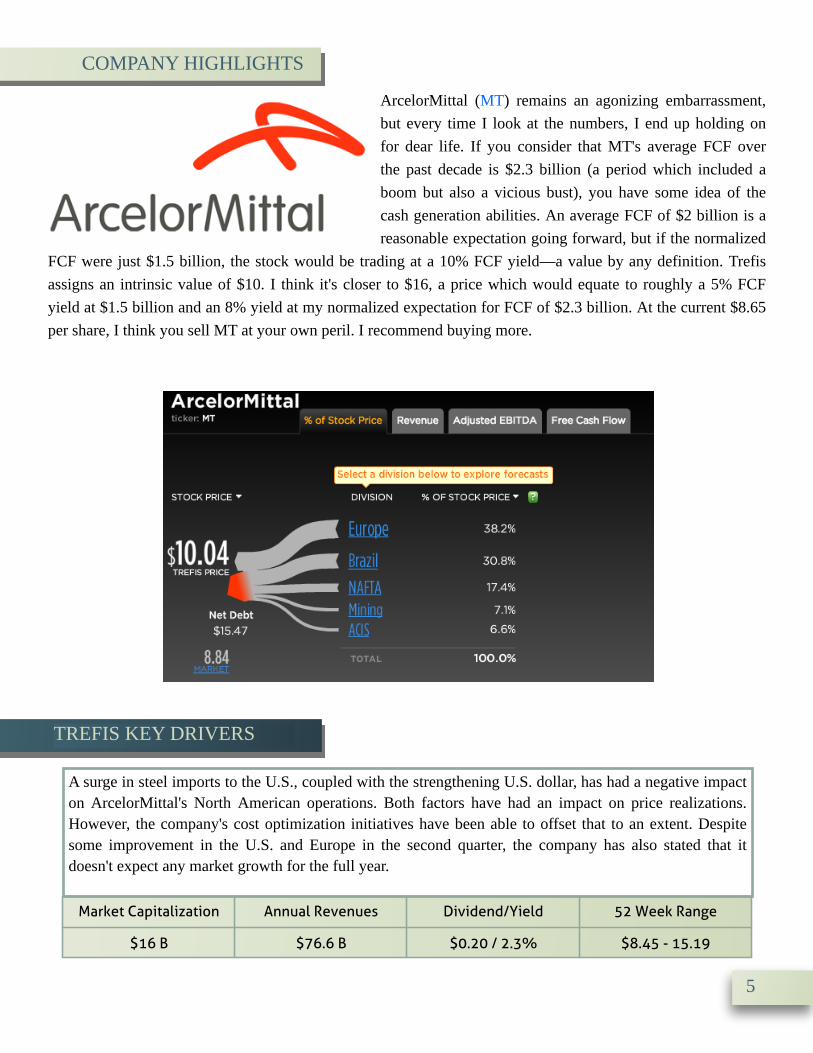
ArcelorMittal (MT) remains an agonizing embarrassment, but every time I look at the numbers, I end up holding on for dear life. If you consider that MT's average FCF over the past decade is $2.3 billion (a period which included a boom but also a vicious bust), you have some idea of the cash generation abilities. An average FCF of $2 billion is a reasonable expectation going forward, but if the normalized
FCF were just $1.5 billion, the stock would be trading at a 10% FCF yield? a value by any definition. Trefis assigns an intrinsic value of $10. I think it's closer to $16, a price which would equate to roughly a 5% FCF yield at $1.5 billion and an 8% yield at my normalized expectation for FCF of $2.3 billion. At the current $8.65 per share, I think you sell MT at your own peril. I recommend buying more.
Market Capitalization Annual Revenues Dividend/Yield 52 Week Range
$16 B $76.6 B $0.20 / 2.3% $8.45 - 15.19
COMPANY HIGHLIGHTS
TREFIS KEY DRIVERS
A surge in steel imports to the U.S., coupled with the strengthening U.S. dollar, has had a negative impact on ArcelorMittal's North American operations. Both factors have had an impact on price realizations. However, the company's cost optimization initiatives have been able to offset that to an extent. Despite some improvement in the U.S. and Europe in the second quarter, the company has also stated that it doesn't expect any market growth for the full year.
5
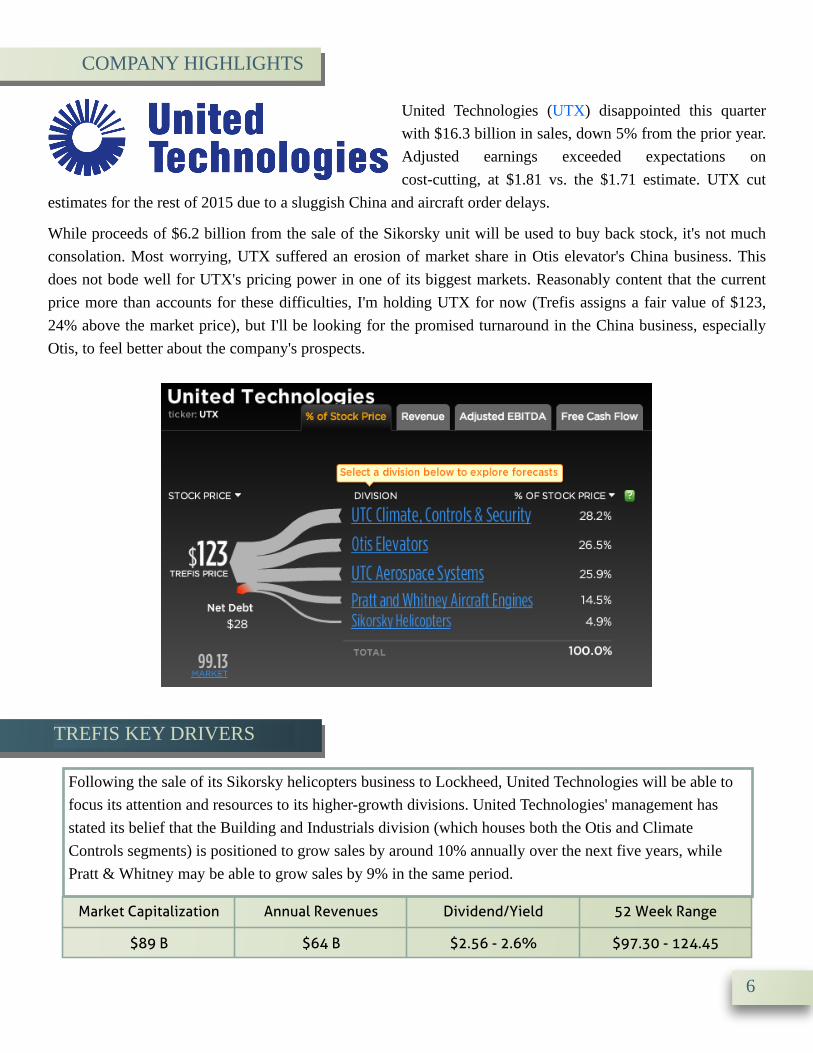
United Technologies (UTX) disappointed this quarter with $16.3 billion in sales, down 5% from the prior year. Adjusted earnings exceeded expectations on cost-cutting, at $1.81 vs. the $1.71 estimate. UTX cut
estimates for the rest of 2015 due to a sluggish China and aircraft order delays.
While proceeds of $6.2 billion from the sale of the Sikorsky unit will be used to buy back stock, it's not much consolation. Most worrying, UTX suffered an erosion of market share in Otis elevator's China business. This does not bode well for UTX's pricing power in one of its biggest markets. Reasonably content that the current price more than accounts for these difficulties, I'm holding UTX for now (Trefis assigns a fair value of $123, 24% above the market price), but I'll be looking for the promised turnaround in the China business, especially Otis, to feel better about the company's prospects.
Market Capitalization Annual Revenues Dividend/Yield 52 Week Range
$89 B $64 B $2.56 - 2.6% $97.30 - 124.45
COMPANY HIGHLIGHTS
TREFIS KEY DRIVERS
Following the sale of its Sikorsky helicopters business to Lockheed, United Technologies will be able to focus its attention and resources to its higher-growth divisions. United Technologies' management has stated its belief that the Building and Industrials division (which houses both the Otis and Climate Controls segments) is positioned to grow sales by around 10% annually over the next five years, while Pratt & Whitney may be able to grow sales by 9% in the same period.
6
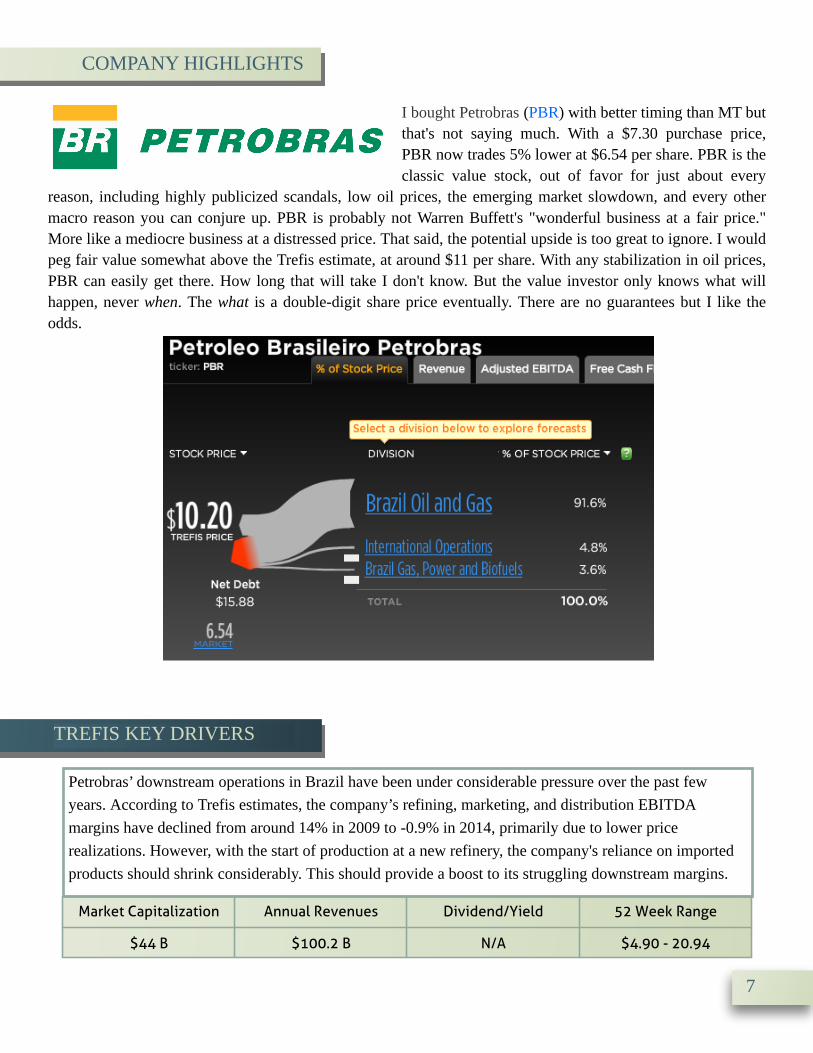
I bought Petrobras (PBR) with better timing than MT but that's not saying much. With a $7.30 purchase price, PBR now trades 5% lower at $6.54 per share. PBR is the classic value stock, out of favor for just about every
reason, including highly publicized scandals, low oil prices, the emerging market slowdown, and every other macro reason you can conjure up. PBR is probably not Warren Buffett's "wonderful business at a fair price." More like a mediocre business at a distressed price. That said, the potential upside is too great to ignore. I would peg fair value somewhat above the Trefis estimate, at around $11 per share. With any stabilization in oil prices, PBR can easily get there. How long that will take I don't know. But the value investor only knows what will happen, never when. The what is a double-digit share price eventually. There are no guarantees but I like the odds.
Market Capitalization Annual Revenues Dividend/Yield 52 Week Range
$44 B $100.2 B N/A $4.90 - 20.94
COMPANY HIGHLIGHTS
TREFIS KEY DRIVERS
Petrobras? downstream operations in Brazil have been under considerable pressure over the past few years. According to Trefis estimates, the company?s refining, marketing, and distribution EBITDA margins have declined from around 14% in 2009 to -0.9% in 2014, primarily due to lower price realizations. However, with the start of production at a new refinery, the company's reliance on imported products should shrink considerably. This should provide a boost to its struggling downstream margins.
7
8
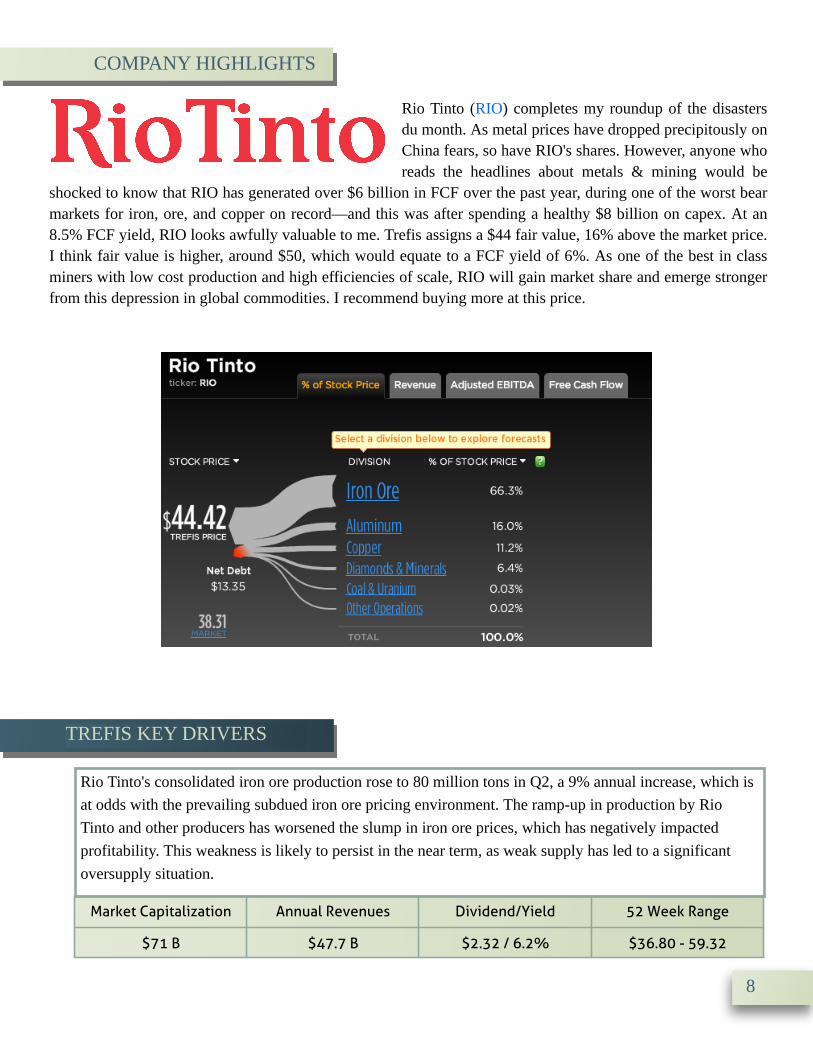
Rio Tinto (RIO) completes my roundup of the disasters du month. As metal prices have dropped precipitously on China fears, so have RIO's shares. However, anyone who reads the headlines about metals & mining would be
shocked to know that RIO has generated over $6 billion in FCF over the past year, during one of the worst bear markets for iron, ore, and copper on record? and this was after spending a healthy $8 billion on capex. At an 8.5% FCF yield, RIO looks awfully valuable to me. Trefis assigns a $44 fair value, 16% above the market price. I think fair value is higher, around $50, which would equate to a FCF yield of 6%. As one of the best in class miners with low cost production and high efficiencies of scale, RIO will gain market share and emerge stronger from this depression in global commodities. I recommend buying more at this price.
Market Capitalization Annual Revenues Dividend/Yield 52 Week Range
$71 B $47.7 B $2.32 / 6.2% $36.80 - 59.32
COMPANY HIGHLIGHTS
TREFIS KEY DRIVERS
Rio Tinto's consolidated iron ore production rose to 80 million tons in Q2, a 9% annual increase, which is at odds with the prevailing subdued iron ore pricing environment. The ramp-up in production by Rio Tinto and other producers has worsened the slump in iron ore prices, which has negatively impacted profitability. This weakness is likely to persist in the near term, as weak supply has led to a significant oversupply situation.
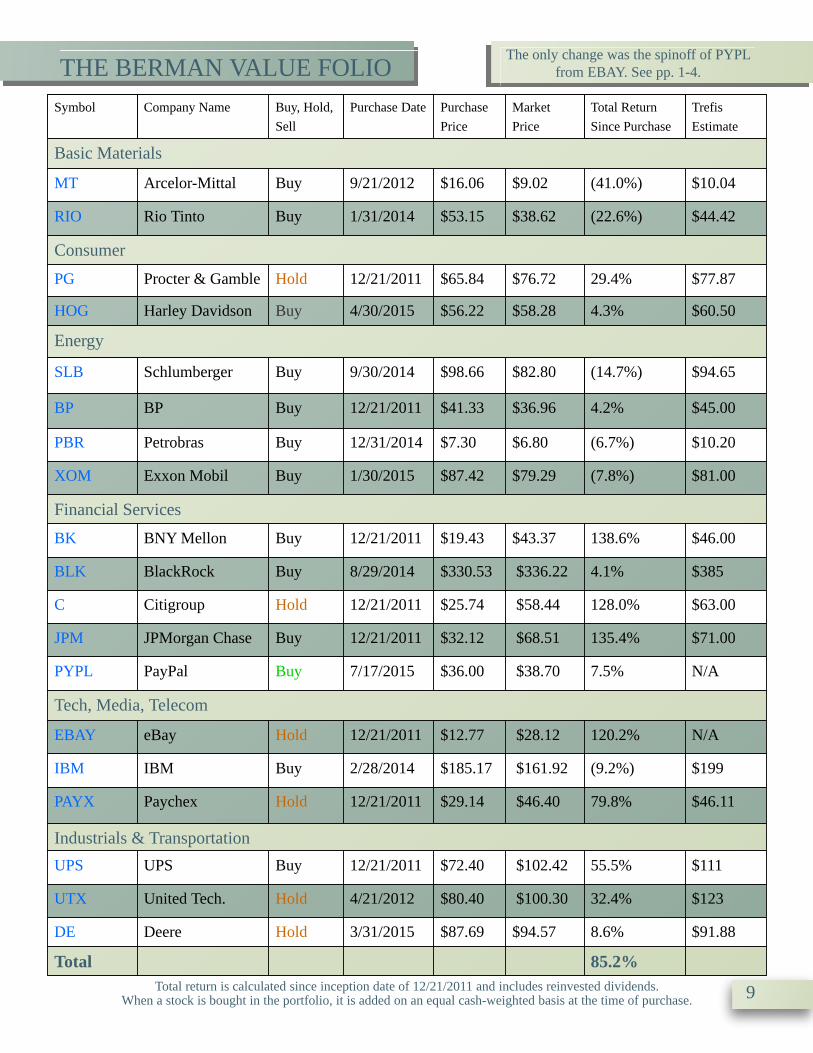
Total return is calculated since inception date of 12/21/2011 and includes reinvested dividends. When a stock is bought in the portfolio, it is added on an equal cash-weighted basis at the time of purchase. 9
THE BERMAN VALUE FOLIOSymbol Company Name Buy, Hold,
SellPurchase Date
Basic Materials
MT Arcelor-Mittal Buy 9/21/2012
RIO Rio Tinto Buy 1/31/2014
Purchase Price
Market Price
Total Return Since Purchase
Trefis Estimate
$16.06 $9.02 (41.0%) $10.04
$53.15 $38.62 (22.6%) $44.42
Consumer
PG Procter & Gamble Hold 12/21/2011 $65.84 $76.72 29.4% $77.87
HOG Harley Davidson Buy 4/30/2015 $56.22 $58.28 4.3% $60.50
Energy
SLB Schlumberger Buy 9/30/2014 $98.66 $82.80 (14.7%) $94.65
BP BP Buy 12/21/2011 $41.33 $36.96 4.2% $45.00
PBR Petrobras Buy 12/31/2014 $7.30 $6.80 (6.7%) $10.20
XOM Exxon Mobil Buy 1/30/2015 $87.42 $79.29 (7.8%) $81.00
Financial Services
BK BNY Mellon Buy 12/21/2011 $19.43 $43.37 138.6% $46.00
BLK BlackRock Buy 8/29/2014 $330.53 $336.22 4.1% $385
C Citigroup Hold 12/21/2011 $25.74 $58.44 128.0% $63.00
JPM JPMorgan Chase Buy 12/21/2011 $32.12 $68.51 135.4% $71.00
PYPL PayPal Buy 7/17/2015 $36.00 $38.70 7.5% N/A
Tech, Media, Telecom
EBAY eBay Hold 12/21/2011 $12.77 $28.12 120.2% N/A
IBM IBM Buy 2/28/2014 $185.17 $161.92 (9.2%) $199
PAYX Paychex Hold 12/21/2011 $29.14 $46.40 79.8% $46.11
Industrials & Transportation
UPS UPS Buy 12/21/2011 $72.40 $102.42 55.5% $111
UTX United Tech. Hold 4/21/2012 $80.40 $100.30 32.4% $123
DE Deere Hold 3/31/2015 $87.69 $94.57 8.6% $91.88
Total 85.2%
The only change was the spinoff of PYPL from EBAY. See pp. 1-4.
The Berman Value Folio
DISCLAIMER
The Berman Value Folio (TBVF) is published monthly and provides information and investment ideas on stocks. All material in TBVF is copyright, 2011 through the present, by Trefis and JBGlobal.com LLC and may not be reproduced in whole or in part in any form without written consent. TBVF is written by James Berman with assistance from Trefis staff. TBVF is distributed by both Trefis and Forbes. Forbes acts only as distributor and is not responsible for, nor does it endorse, any TBVF content or investment ideas. All stock buys and sells are the sole decision of James Berman. In the TBVF portfolio, James Berman is restricted to buying only stocks that are covered by Trefis. TBVF is intended for experienced investors, who understand the risks, costs, mechanics and consequences of investing. None of the content in this newsletter is intended to be, nor should be interpreted as, a solicitation to buy or sell securities. The selection of portfolio stocks is based on fundamental analysis. There is, however, no assurance that these securities will produce profits. They may instead produce serious losses. It should not be assumed that the recommendations made in the future will be profitable or will equal the performance of any prior securities mentioned in the TBVF. All investing involves risk of serious loss. No graph, chart, formula or other device offered or portrayed in TBVF can in and of itself be used to make trading or investment decisions. Any graph, chart, formula or other device is inherently unreliable in making a trading or investment decision due to the intrinsically misleading nature of such items.
Performance results are based on model portfolios and do not reflect actual trading. Actual performance will vary based on a variety of factors, including market conditions and trading costs. TBVF results may not reflect the impact that material economic and market factors might have had on the adviser's decision-making if the adviser were actually managing clients' money in this portfolio. TBVF contains stocks that are managed with a view towards capital appreciation. James Berman and JBGlobal.com may manage other portfolios with different strategies and returns that may materially differ from TBVF results with substantially higher or lower performance. TBVF model results do not reflect the deduction of any management fees, advisory fees, brokerage or other commissions, bid-ask spreads, tax consequences, and any other expenses that a client would have to actually pay or would have actually paid in a real portfolio. All return figures assume the reinvestment of all dividends. When a stock is bought in the portfolio, it is added on an equal cash-weighted basis at the time of purchase. Past performance does not guarantee future results. Any forward-looking statement is inherently uncertain and cannot be relied upon as a statement of actual performance. If you would like a spreadsheet furnishing a list of all recommendations made by TBVF since inception on 12/21/2011, please send an email request to: [email protected].
Although all content is derived from data believed to be reliable, accuracy cannot be guaranteed. James Berman, JBGlobal.com LLC, Insight Guru Inc., Trefis, TBVF?s publisher and distributor(s) and their employees assume no liability whatsoever for any investment losses as a result of securities purchased on TBVF recommendations. TBVF is not intended to provide personalized investment advice. Readers and subscribers should consult their financial adviser before investment. James Berman is an investor in Insight Guru Inc., the parent company of Trefis, both personally and through the venture fund he subadvises. James Berman, therefore, has a financial interest in Trefis aside from his interest in TBVF.
James Berman, JBGlobal.com LLC and employees of TBVF, Insight Guru Inc., JBGlobal.com L.L.C. and Trefis may hold positions in some or all of the stocks mentioned here, both personally and in the accounts and funds they manage for others. No compensation for recommending particular securities, services, or financial advisors is solicited or accepted. If you are unwilling or unable to abide by any conditions of this disclaimer, then you may obtain a refund for the unused portion of your subscription at any time.
10