the bds donor coordination groupthe bds donor coordination group jim tanburn, coordinator donor...
TRANSCRIPT

Concluding Remarks at the 2nd National Conference of
the BDS Donor Coordination Group
Jim Tanburn, CoordinatorDonor Committee for Enterprise Development
Naivasha, Kenya4th October 2006

Outline of this presentation
1) About the Donor Committee for Enterprise Development
Synthesis and update (a personal perspective)2) The good news, and the less good news3) Future demand for ‘what you do’4) What to do about it? Towards an agenda
for action

Overall Objectives and Rationale of the Donor Committee
• To coordinate donor agendas, approaches• To share successful experiences and lessons
learned in the field• To benchmark approaches/instruments and agree
on jointly defined standards• To avoid duplication of activities• To build staff and practitioner capacity
The Paris Declaration on Aid Effectiveness puts increasing emphasis on donor harmonisation; DCED work aims at further substantiating this in the technical field of enterprise development

Committee’s modes of working• Formed in 1979 as the informal “Committee of Donor
Agencies for Small Enterprise Development”• Since 2005, move towards more substantial operations,
including more formal structures– Co-chairs complemented by Executive Committee– Secretariat with part-time Coordinator – Membership fee to finance Secretariat activities
• Technical work through working groups, currently on– Business Enabling Environment– Linkages and Value Chains
• Increasing focus on services to members (through Secretariat)– Knowledge management, websites, newsletter– Support to members, country coordination groups

The Committee’s evolving structureAnnual Meeting / General Assembly of Members
Executive CommitteeCo-Chairs + Martin Clemensson, ILOJean-Christophe Favre, SDCDag Larsson, NORAD
SecretariatJim Tanburn, Coordinator• Knowledge management• Websites, newsletter• Support to working groups
Working Groups: currently• Business Environment
Reform(Chair: Martin Clemensson)
• Linkages and Value Chains(Co-chairs: Doyle Baker, FAO, Michele Clara, UNIDO)
Trust Fund, admin. by IFC
Co-ChairsLaurence Carter, World Bank GpCorinna Küsel, German Devt. Coop.

Committee’s most active members• Bilateral agencies currently active in the
Committee include Governments of Australia, Austria, Canada, Denmark, France, Germany, Netherlands, Norway, Sweden, Switzerland, UK, USA
• Multi-lateral agencies currently active include the European Commission, FAO, IFAD, ILO, OECD-DAC, UNCTAD, UNDP, UNIDO, World Bank Group

Some activities of the Committee• International and regional Conferences:
– e.g. Cairo Conference on business environment reform, 2005 (300 people from 29 donor agencies)
• Participatory definition of best practice for donors:– e.g. Guiding Principles: “Business Development
Services for Small Enterprises” (Blue Book), 2001• Knowledge management, websites etc.
– Home site: www.Enterprise-Development.org– www.BDSknowledge.org Oracle database for BDS,
Value Chains, Making Markets Work for the Poor etc.– www.BusinessEnvironment.org Database on BE reform– Monthly newsletter etc.

0
10,000
20,000
30,000
40,000
50,000
60,000
Dec-05 Jan-06 Feb-06 Mar-06 Apr-06 May-06 Jun-06 Jul-06 Aug-06
Page Views per month on Committee websites
Enterprise-Development
Total
BDS
BusinessEnvironment

Future agenda of the Committee?• New modes of operation, e.g.
benchmarking / peer reviews• Address new topics flexibly, e.g. ‘SWAps’• New Secretariat with more services,
outreach; Committee represented in other forums
• Reach new donors as members• Link more to country level donor groups

Some personal observations #1• HQs develop policies and strategies• Many agencies are now decentralised• So what is the relationship between HQ
policies and what happens in the field?• HQs depend on field colleagues for case
study material• But field staff also need to be aware
‘which way the wind is blowing’

A. Services contribute strongly to aggregate productivity growth … Contribution in percentage
points
Source: OECD STAN Database 2004, Wölfl (2005)
0.81.0
2.9
1.1 0.71.2 0.9
1.71.9 1.7 2.1
1.2 1.2 1.5
2.4
4.3
2.2
4.0
2.22.1
2.11.9 1.5
-2
-1
0
1
2
3
4
5S
pain
Fran
ceH
unga
ryIta
ly
Net
herla
nds
Bel
gium
New
Zea
land
Den
mar
k
Aus
tria
Ger
man
yP
ortu
gal
Japa
nLu
xem
bour
gC
anad
aFi
nlan
d
Kor
eaS
lova
k R
epub
licP
olan
dN
orw
ay
Gre
ece
Uni
ted
Kin
gdom
Aus
tralia
Uni
ted
Sta
tes
Business sector services Other services industriesManufacturing industries Other industries
in p
erce
ntag
e po
ints

The good news #1• Growing interest in funding private sector
development (PSD) – eg OECD DAC, UK, AusAID• Some have extensive references to SED – eg
Commission for Africa

More good news• Practitioners have embraced key principles
of PSD and competitiveness• New donors – eg Bill and Melinda Gates
Foundation $30m on Value Chain development. Emerging donors eg in E. Europe, believe PSD is important
• Changing trade agreements, world markets can provoke strong demand for help from Governments, associations
• Convergence of competitiveness, poverty

Maximising the Utility of Bamboo
Other Developing Products
DD
HandicraftsBamboo Shoots
Industrial Processing4 typesRaw Culms
Medium Value
3 Main Sub-Sectors
H
H
HH
S
S
D4
7
1
2
35
8
9
6
5-10%
40-50%
30-40%
5-10%
4
7
1
2
35
8
9
6
5-10%
40-50%
30-40%
5-10%
Pulp
Charcoal
Fiber boards
Fuels
Lumber
Leftovers & processing waste
1
2
3
4
5
6
7
Blinds, Mats, Carpet
Flooring
Vegetable
Handicrafts
Brooms, Cloths8
Manure, Fodder
Extracts, Medicine
Bamboo poles
Laminated furniture
9
Charcoal, Pulp
Handicrafts
Chopsticks, ToothpicksMiddle upper
Middle lower
Base
Shoots
Sheath & Rhizome
Scaffoldings
Chopsticks, Toothpicks
Twigs
Leaves
Top
4
Source: Zhu 2005
Premium Value
Bulk Products
From presentation by John Marsh, Oxfam Hong Kong, in Chiang Mai, Sept. 06 (see www.mmw4p.org)

‘Pro-poor’ measured via labour & input
cost base data from businesses.
Bamboo sector ~75% pro-poor
Pro-poor financial impact per ha is total
financial returns to the poor throughout
the supply chain from bamboo sustainablyproduced from 1 ha
Full time equivalent jobs (FTE) created on farms, factories etc throughout the supply chain from
the bamboo sustainably
produced from 1 ha
Jobs, Financial Impact by Product
Premium processing eg flooring, laminate furniture
Medium value processingchopsticks, panels
Bulk processing paper, charcoal
0
0.2
0.4
0.6
0.8
1.0
1.2
0 500 1,000 1,500 2,000 2,500 3,000
Local pro-poor financial impact per ha(USD )
Jobs per ha (FarmersWorkers
FTE)
Flooring VN
Mat board VN
Woven mat VN
Chopsticks VN
Paper + pulp VN
Charcoal, briquets, China
Charcoal, briquets, Laos
Raw culms VNRaw culms for construction
Low Value Processing
From presentation by John Marsh, Oxfam Hong Kong, in Chiang Mai, Sept. 06 (see www.mmw4p.org)

Thanh Hoa,Viet Nam2006
Depends on Policy & Action
New$40m
Bulk$21m
Mature, New$72m
.
Anji, China, 2006New Mix. Impact viaHigh Bamboo cost+High Labour cost+
Viet Nam, Laos Current Policy Direction ?
Raw$20m
Jobs per ha (FarmersWorkers FTE)
0
0.10
0.20
0.30
0.40
0.50.
300 400 500 600 700 800 900 1,000.Local pro-poor financial impact per ha (USD)
Mekong Potentialnext 5-10 years ?
Med$31m
From presentation by John Marsh, Oxfam Hong Kong, in Chiang Mai, Sept. 06 (see www.mmw4p.org)

Even more good newsLarger companies are very interested:• HP Micro-Enterprise Acceleration Institute• Unilever / Oxfam joint study in Indonesia• Shell, others funding Investment Climate
Facility

The not-so-good news #1• Little attention to measuring impacts or
achieving scale; ‘champions’ lack cases• Traditional interventions dressed up in
progressive language• Some recent evaluations not very positive;
targeted approaches perceived to have mixed impacts
• Trend towards budget support, SWAps• Growing belief that “all growth is good for
the poor”

Shares of income (Dollar and Kraay 2001)
Log (Per Capita Income)
Log (Per Capita
Income in Poorest
Quintile)
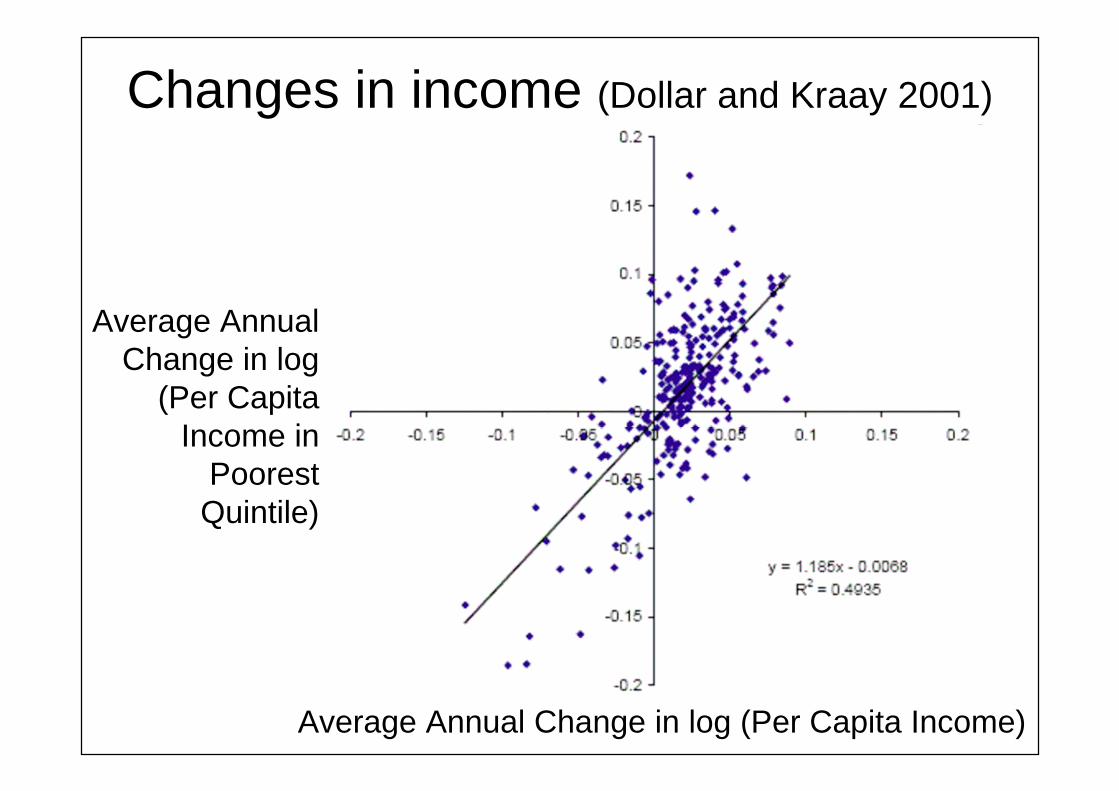
Changes in income (Dollar and Kraay 2001)
Average Annual Change in log
(Per Capita Income in
Poorest Quintile)
Average Annual Change in log (Per Capita Income)

More not-so-good news• Perception that targeted approaches are not
effective, and may do more harm than good (perverse incentives etc.)
• Some confusion over the alternatives• Trend towards budget support to recipient
governments leaves multi-stakeholder PSD without obvious home
• Also trend toward reform of the overall business environment

Business entry costs as % of GDP/Capita (Bannock et al, 2002)

So – time for us to think more strategically…

Eg Plowing the Sea: case studies from Latin America (up-grading value chains in response to demand from Governments and industry associations)
Where is the demand?

Other sources of demand• From private companies, for matching
grant schemes (PPPs, African Enterprise Challenge Fund etc.)
• From communities, via participatory approaches (LED, clusters etc.)
• From governments / associations, as a result of benchmarking?

Cos
tIn
puts
Pro
vide
rs
1:196,080,000PROG. TOTAL COST (US$)
1:244,786,470PROG. DIRECT COST (US$)
1640,76935,136Profit (‘000 US$)
7537,090501,641Assets (‘000 US$)
1248,13143,107Domestic Sales (‘000)
13930,796821,008Export (‘000 US$)
1678,20267,630Female Staff (no.)
21926583No. of Intervention
Change in %
Monitoring(2005)
Baseline(2003)
Particular
RMG Bangladesh (Deepak Adhikary, IFC/SEDF)
6716793Total PROVIDERS
LeverageValue
Sect
or I
mpa
ct

-1818202025251818151518Return on Invested Capital (Knit) (%)
Sector Performance Sector Performance Benchmarks Benchmarks
-0.400.400.300.300.500.500.460.300.300.37Labor Cost (US$/ Labor Cost (US$/ Operator Hour)Operator Hour)
Financial BenchmarksFinancial Benchmarks
75756060707080806565303044Plant Efficiency (Produced Min./Spent Min) (%)
11530.50.53310108Rejection Rate55--6677776666--88151511Labor Turnover/ Year (%)
Process BenchmarksProcess Benchmarks Cam
bC
amb
Viet
nVi
etn
Chi
naC
hina
Sri
Sri
Lank
aLa
nka
Global B’mark
‘Reference’ Country Benchmark
B’deshBaseline
SEDF Assisted
RMG Bangladesh: Benchmarks (Adhikary 2006)
404065656060707040400.50.5+1Women in Supervisor Positions (%)
Social/Environmental Social/Environmental BenchmarksBenchmarks

Cost Per T-Shirt
Cost Per T-Shirt
Import Dependence
Labor Cost/Shirt
Overheads Outbound Logistics
Speed to Market
Kenya (68)
Raw Material Costs
~ 80%
~ 65%
$0.80
$2.30
$0.25 $0.19
$0.62
$0.06 < 15 days
> 30 Days
Honduras (122)
Source Make Deliver
$1.30
High Tariffs:Honduras = 9.6%Kenya = 21.9%
Impact of Rules of OriginExacerbated by location and therefore transportation costs
High Cost of LogisticsHonduras = $ 658 / TEUKenya = $1475 /TEU
Lengthy Customs Clearance for Imports:Honduras = 4 daysKenya = 15 days
Lower Wages Offset byLower Labor Productivity
Honduras: $12/ labor dayKenya: $9.40/ labor day
Honduras: 45-50 shirts/dayKenya: 20-25 shirts/day
Lengthy Customs Clearance For Exports: Honduras = 1 dayKenya = 2 days
High Incidence of Rejects:Honduras: <1%Kenya: >3%
$0.28$0.40 $3.60
Source: Presentation by Uma Subramanian, FIAS, in Vienna to Donor Committee Working Group on Linkages and Value Chains, 2006

Value Chain Distribution of CostsWax Print Textiles
-4.682.01 1.32 0.62 0.7230.91
LaborIntermedinputs Admin
Cap. Charge Utilities
InboundLogistics
Profits
5.721.94
OutbdLogistics
Export subsidies
Cotton Yields, Kg/haWorld 600Nigeria 180
Cotton Costs (US$/kg)Nigeria 1.27Kyrgyz 0.32China 0.59
Utility costs US cents/KWh
India 18.7Nigeria 17.1Kenya 7.0Pakistan 6.6China 6.0S.Africa 5.0Indonesia 3.7
Labor costs(US cents/hour)
S. Africa 222.0Nigeria 92.3Kenya 66.0China 57.0India 40.6Pakistan 38.8Indonesia 34.3
Ratio of mgmt cost to labor close to 1
High sourcing costs for dyes/chem imports
Delays resulting in capital carrying charges
Source: Presentation by Vincent Palmade and Uma Subramanian, FIAS, at Donor Committee Cairo Conference, 2005

What to do about it? Towards an agenda for action
Many donors are looking for:• Scale / volume• Assurance of results• Compliance with ‘current thinking’
(including a fit within current categories)• Capacity to deliver

How to influence current thinking
• Think about USP – eg convergence of pro-poor, competitiveness, BE?
• Choose forum to reach thought leaders: Journals + events can be a useful trigger
• Publish case studies which are compelling, convincing and credible / have a slogan, a story and statistics
• Use websites of Committee, others

Thank you for your attention!
Any questions? Comments?