the basics of the economic growth in china
TRANSCRIPT
The Basics of the Economic
Growth in China
Wenming Xu
Associate Professor, School of Law and Economics
China University of Political Science and Law
Ph.D., Law Faculty, University of Bologna
Email: [email protected]
1
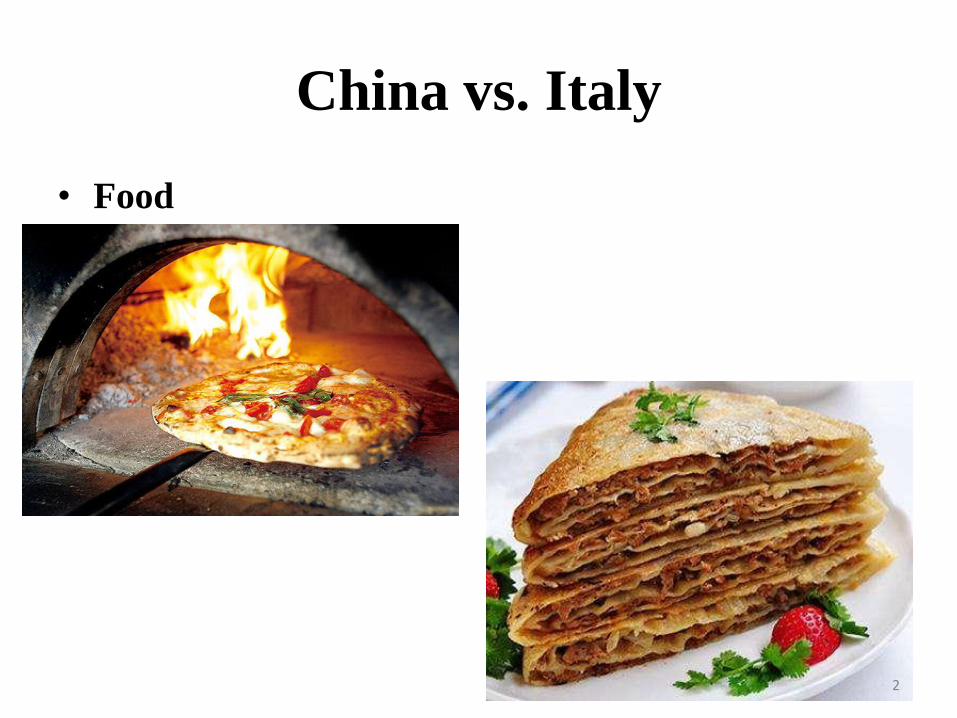
China vs. Italy
• Food
2

China vs. Italy
• Family
3

Outlines
• A brief presentation of the economic growth in China for last 30 years.
• A presentation of the economic conditions in China for recent years.
• A presentation of the China’s financial markets.
• A presentation of the reform in China’s financial law and regulation.
4

1. Facts of Economic Growth• GDP (Gross domestic product) (Source: World Bank Indicators)
• 1960, US (543.3 billion), China (59.7 billion)
• 2016, Italy (1.86 trillion), US (18.6 trillion), Japan (4.94 trillion), Germany (3.48
trillion), United Kingdom (3.65 trillion), China (11.2 trillion, second largest)
• 2016 per capita GDP: US (57,638.16), Italy (30,674.84), China (8,123.18)
0.00
2,000.00
4,000.00
6,000.00
8,000.00
10,000.00
12,000.00
14,000.00
16,000.00
18,000.00
20,000.00
1990 2000 2008 2009 2010 2011 2012 2013 2014 2015 2016
GD
P
China
Italy
United States
United Kingdom
Japan
Germany
Billion
5

1. Facts of Economic Growth
• China GDP growth rate: Comparison with other major entities.
(Source: World Bank Indicators)
6
-8.00
-6.00
-4.00
-2.00
0.00
2.00
4.00
6.00
8.00
10.00
12.00
1990 2000 2008 2009 2010 2011 2012 2013 2014 2015 2016
China
Italy
United States
United Kingdom
Japan
Germany

1. Facts of Economic Growth
• Decomposition of GDP
• GDP=C+I+G+NX
7
The Components of 2016 GDP in China
household consumption governmental comsuption
investment net export
(Source: National Bureau of
Statistics of the People's
Republic of China)
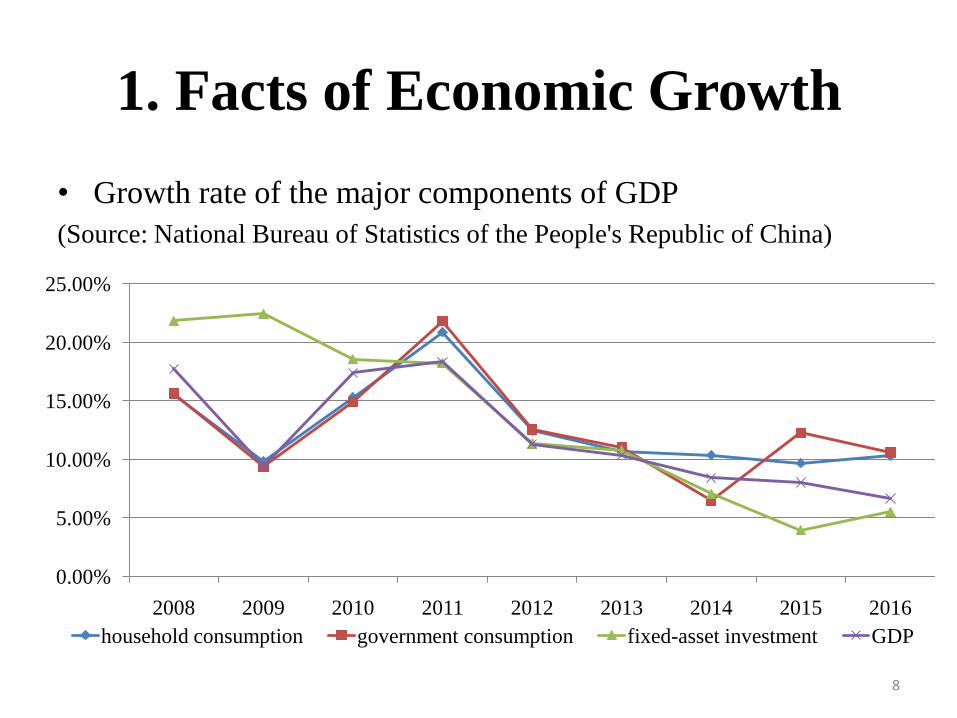
1. Facts of Economic Growth
• Growth rate of the major components of GDP
(Source: National Bureau of Statistics of the People's Republic of China)
8
0.00%
5.00%
10.00%
15.00%
20.00%
25.00%
2008 2009 2010 2011 2012 2013 2014 2015 2016
household consumption government consumption fixed-asset investment GDP
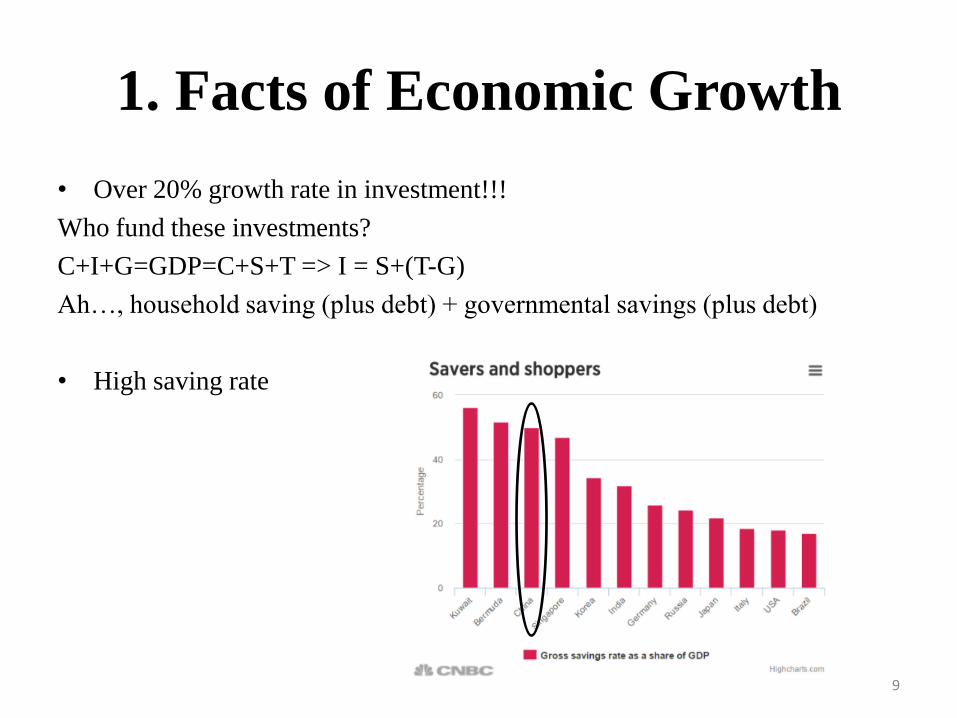
1. Facts of Economic Growth
• Over 20% growth rate in investment!!!
Who fund these investments?
C+I+G=GDP=C+S+T => I = S+(T-G)
Ah…, household saving (plus debt) + governmental savings (plus debt)
• High saving rate
9

1. Facts of Economic Growth
• Total Imports and Exports
10
China-US
58%
UK
8%
Germany
17%
France
5%
Italy
5%
Netherland
7%
China-EU
42%
2016 Total Imports and Exports (China and
US, China and Europe)
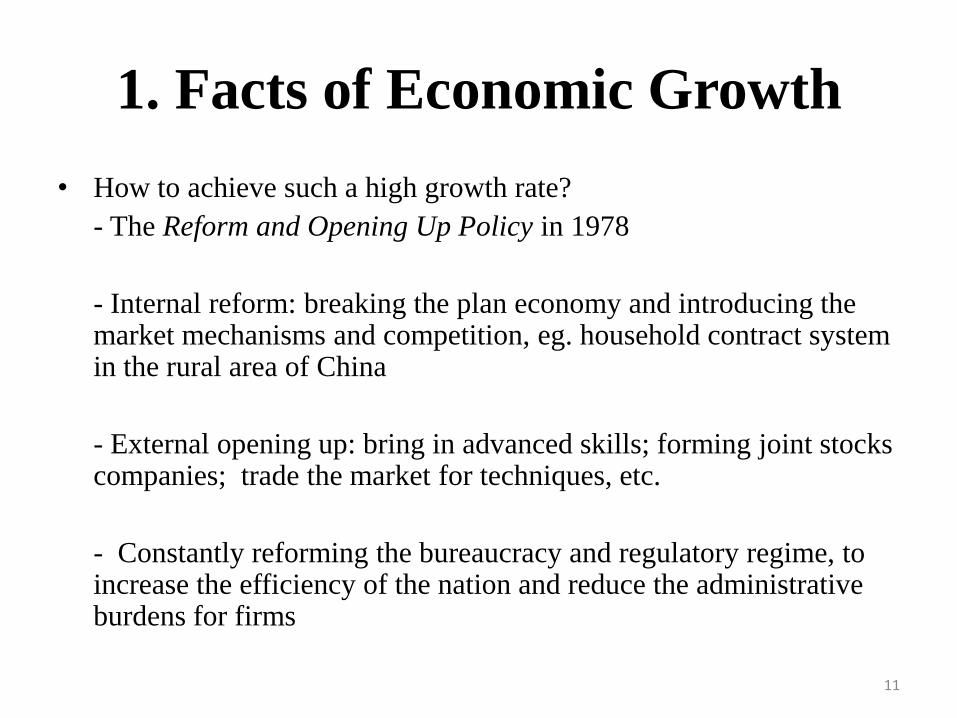
1. Facts of Economic Growth
• How to achieve such a high growth rate?
- The Reform and Opening Up Policy in 1978
- Internal reform: breaking the plan economy and introducing the market mechanisms and competition, eg. household contract system in the rural area of China
- External opening up: bring in advanced skills; forming joint stocks companies; trade the market for techniques, etc.
- Constantly reforming the bureaucracy and regulatory regime, to increase the efficiency of the nation and reduce the administrative burdens for firms
11

2. Post Financial Crisis and the
“New Normal”• 2008 is a divide for China’s economy. The global financial crisis imposed
significant negative impacts on the economic growth in China mainly due
to the dry-up exports.
12
15.2 14.2 14.2
10.4
1980–89 average:
9.8%1990–99 average:
10.0%
2000–09 average:
10.3
2010–16 average:
8.0
0
2
4
6
8
10
12
14
16
19
80
19
81
19
82
19
83
19
84
19
85
19
86
19
87
19
88
19
89
19
90
19
91
19
92
19
93
19
94
19
95
19
96
19
97
19
98
19
99
20
00
20
01
20
02
20
03
20
04
20
05
20
06
20
07
20
08
20
09
20
10
20
11
20
12
20
13
20
14
20
15
20
16
GDP growth GDP per capita growth

2. Post Financial Crisis and the
“New Normal”• A comparison between hypothetical GDP growth rate without the stimulus program
and the actual one with stimulus. (ref: Ouyang, Min and Yulei Peng, 2015. The
treatment-effect estimation: A case study of the 2008 economic stimulus package of
China, Journal of Econometrics 188(2), 545-557
13
GDP growth rate
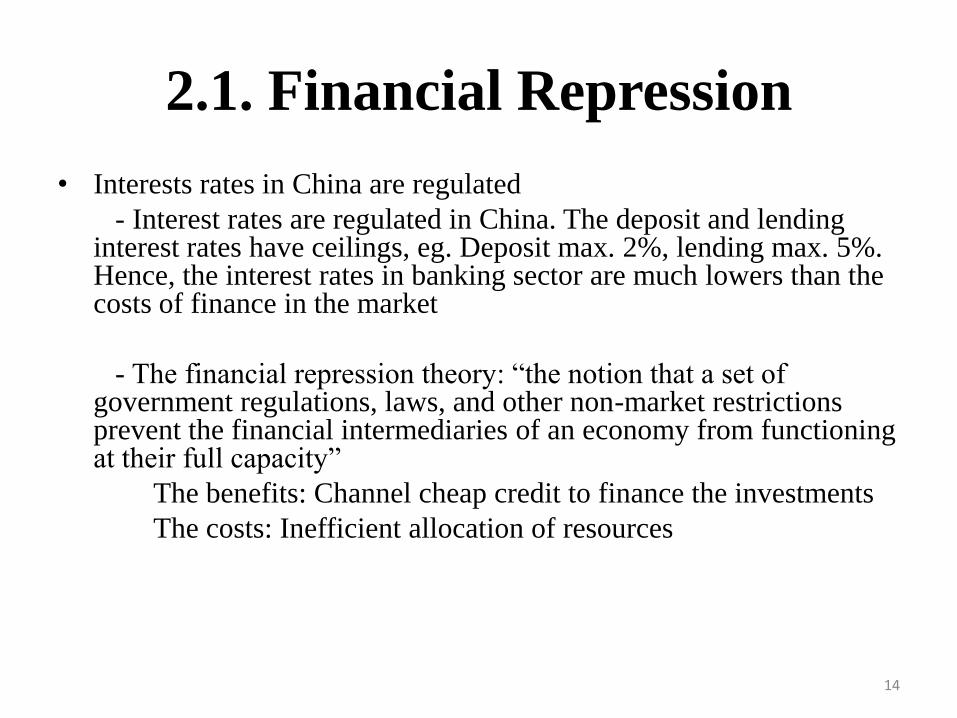
2.1. Financial Repression
• Interests rates in China are regulated
- Interest rates are regulated in China. The deposit and lending interest rates have ceilings, eg. Deposit max. 2%, lending max. 5%. Hence, the interest rates in banking sector are much lowers than the costs of finance in the market
- The financial repression theory: “the notion that a set of government regulations, laws, and other non-market restrictions prevent the financial intermediaries of an economy from functioning at their full capacity”
The benefits: Channel cheap credit to finance the investments
The costs: Inefficient allocation of resources
14
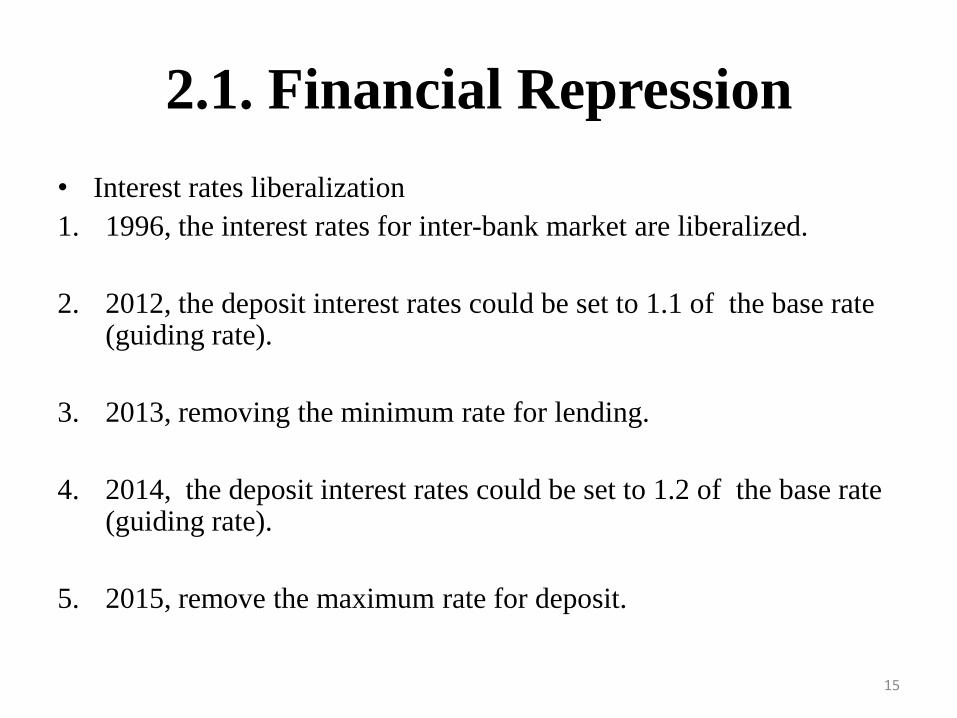
2.1. Financial Repression
• Interest rates liberalization
1. 1996, the interest rates for inter-bank market are liberalized.
2. 2012, the deposit interest rates could be set to 1.1 of the base rate (guiding rate).
3. 2013, removing the minimum rate for lending.
4. 2014, the deposit interest rates could be set to 1.2 of the base rate (guiding rate).
5. 2015, remove the maximum rate for deposit.
15

2.1. Financial Repression
16
0
2
4
6
8
Jan 2
010
Jan 2
011
Jan 2
012
Jan 2
013
Jan 2
014
Jan 2
015
Jan 2
016
Jan 2
017
Jul
%
Shanghai interbank offered rate overnight Lending rate within and including 1 year Deposits rate for 1 year
1. Retail interests rates still follow the PBC’s guidance, bank and deposit rates
unchanged despite higher (producer price) inflation.
2. Wholesale interests are liberalized, yield curve more stable and up.

2.2. Economic stimulus and shadow
banking
• There was a debate on the possibility if China could maintain such high
growth rate, or it has entered into a new and slow growth regime.
• At that time, the nation thought that it could return to the old track.
• The central government proposed a massive governmental stimulus
program, named “4 trillion” in Sep. 2008, which is invested mainly in the
infrastructures and real estates.
- The investments bring the “old industries” back, i.e.
steel, coal, cement, glass, petroleum, iron ore, etc.
- The leverage ratio of the economy increases.
- Private sectors are partially squeezed out.
17

2.2. Economic stimulus and shadow
banking
• The secret for the economic growth lies in leverage.
- Tips: indirect finance via commercial banks dominates the financing
sector and large banks are state-owned.
• 1) The investment needs funding;
2) The public money is limited;
3) Commercial banks are directed to fund such projects;
4) Leverage goes up.
• To lower the financial costs, the central bank adopted an easy-money policy
accordingly, and the growth rate of the money supply is very high.
18

2.2. Economic stimulus and shadow
banking
• A new problem: Shadow banking sector
- Definition: People’s Bank of China’s definition “China’s shadow banking
[system] as credit intermediation involving entities and activities outside
the regular banking system” that serves to provide “liquidity and credit
transformation” and “which could potentially” be a source of “systemic risk
or regulatory arbitrage”.
- Chinese style: bank-centric shadow financing system; commercial banks
move their assets off the balance-sheet
- American style: market-centric shadow financing system; financial
engineering attracted short-term finance from the capital market
19

2.2. Economic stimulus and shadow
banking
• Commercial banks are major sponsor for the shadow banking sector
because they want to pursue higher profits, because the lending interest
rates are lower than the market level.
• A case
1.
2.
20
Bank FirmsLoan, interests rate 5%
Bank Firms
Trust company (conduits)
Buy trust
products, return
rate 8%
Investment,
guaranteed
return 12%

2.2. Economic stimulus and shadow
banking• Traditional indices are not accurate any more.
• Traditional proxies for the money supply:
- M0: Currency
- M1: M0+demand deposit
- M2: M1+ fixed term deposit = Currency+demand deposit+ fixed term
deposit
• New indices: Total social financing (demand side)
- Definition: broad measure of financing obtained by the real economy
sector in China, four subcategories: 1. balance-sheet lending of financial
institutions (bank loans); 2. off-balance-sheet lending (trust company
loans, trade credit); 3. direct financing (corporate bond, stock financing); 4.
others (micro-loans).
21

2.2. Economic stimulus and shadow
banking• Total social financing and loans grow at a much faster rate than M2. It is
very dangerous for China as some leverage is moved off the balance
sheet, because the financial regulators miscalculate the potential risks of the
banks.
22
8
9
10
11
12
13
14
15
Jan
-15
Feb
-15
Mar
-15
Apr-
15
May
-15
Jun
-15
Jul-
15
Aug-1
5
Sep
-15
Oct
-15
Nov-1
5
Dec
-15
Jan
-16
Feb
-16
Mar
-16
Apr-
16
May
-16
Jun
-16
Jul-
16
Aug-1
6
Sep
-16
Oct
-16
Nov-1
6
Dec
-16
Jan
-17
Feb
-17
Mar
-17
Apr-
17
May
-17
Jun
-17
Jul-
17
%
M2 Total social financing Loans

2.2. Economic stimulus and shadow
banking• The loose credit increases the leverage of the government sector, corporate
sector and household sector, which fuel the economic growth post crisis.
23
0
50
100
150
200
250
300
2007 2008 2009 2010 2011 2012 2013 2014 2015 2016
% of GDP General government Households Corporate debt

2.3. The “New Normal”
• Starting from 2011, the GDP growth rate of China starts to decline, and remains 6.x since 2015. It is recognized by the central government that the economy enters the “New Normal”.
• What is “New Normal”?
1. Low growth rate.
2. High growth quality, including high efficiency and low environmental pollution.
3. Better structure: rebalancing real estate, exports, increasing consumption .
4. Reducing the excess productivity capacity, corporate debt and corporate cost.
5. Relieving the financial risks, mainly high leverage.
24

2.3 The “New Normal”
• Challenge 1: Foreign exchange reserve
Due to the uncertainties of the economic performance, there started a
capital outflow after 2014.
25
-80.0
-60.0
-40.0
-20.0
0.0
20.0
40.0
60.0
3,000
3,200
3,400
3,600
3,800
4,000
4,200
4,400
Dec-11 Jan-13 Jan-14 Jan-15 Jan-16 Jan-17
Reserves ($bn) Capital (12 month av, $bn, RHS) 1/
1/ Includes errors and omissions
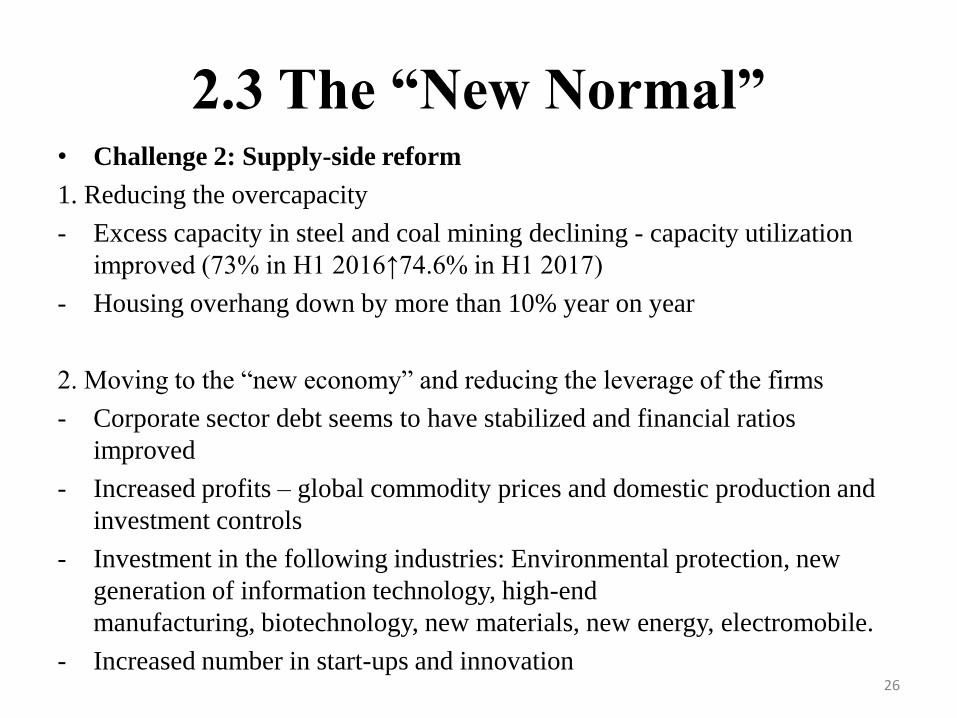
2.3 The “New Normal”• Challenge 2: Supply-side reform
1. Reducing the overcapacity
- Excess capacity in steel and coal mining declining - capacity utilization
improved (73% in H1 2016↑74.6% in H1 2017)
- Housing overhang down by more than 10% year on year
2. Moving to the “new economy” and reducing the leverage of the firms
- Corporate sector debt seems to have stabilized and financial ratios
improved
- Increased profits – global commodity prices and domestic production and
investment controls
- Investment in the following industries: Environmental protection, new
generation of information technology, high-end
manufacturing, biotechnology, new materials, new energy, electromobile.
- Increased number in start-ups and innovation26

2.3 The “New Normal”
• Challenge 2: Supply-side reform
3. Problems to solve:
- Unfinished agenda – corporate deleveraging and excess
capacity
- Carefully balancing the role of the state and that of the
market in the current transition period
- Other structural reforms that increase productivity
27
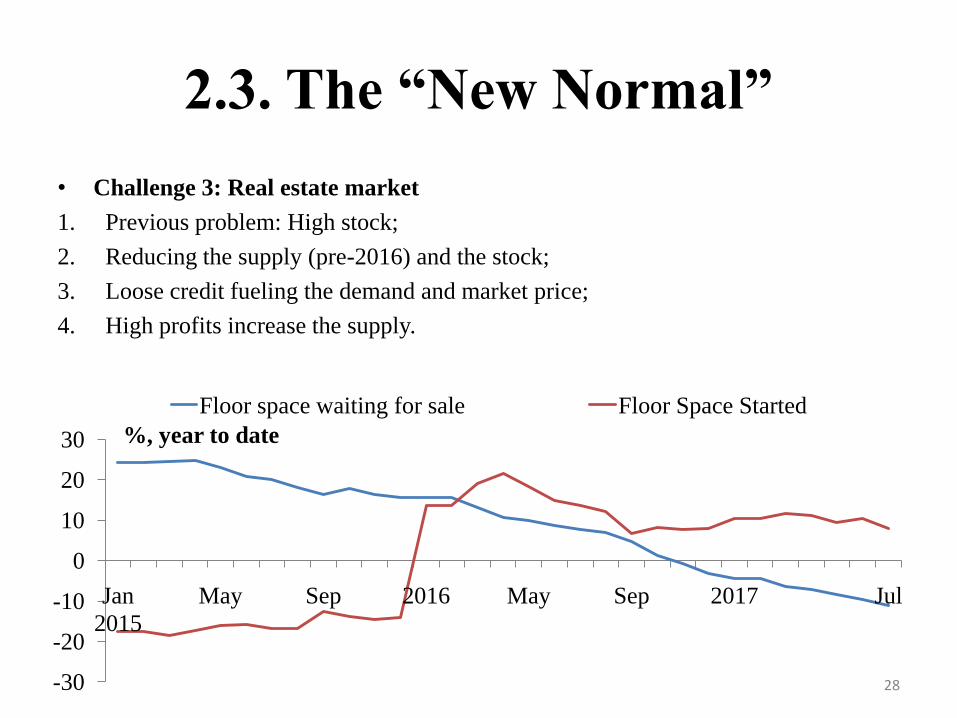
2.3. The “New Normal”
• Challenge 3: Real estate market
1. Previous problem: High stock;
2. Reducing the supply (pre-2016) and the stock;
3. Loose credit fueling the demand and market price;
4. High profits increase the supply.
28-30
-20
-10
0
10
20
30
Jan
2015
May Sep 2016 May Sep 2017 Jul
%, year to date
Floor space waiting for sale Floor Space Started

2.3. The “New Normal”
• Challenge 3: Real estate market
- The housing price goes up quickly starting the end of 2015.
- Q: Will you buy some products when the price goes up or goes down?
29
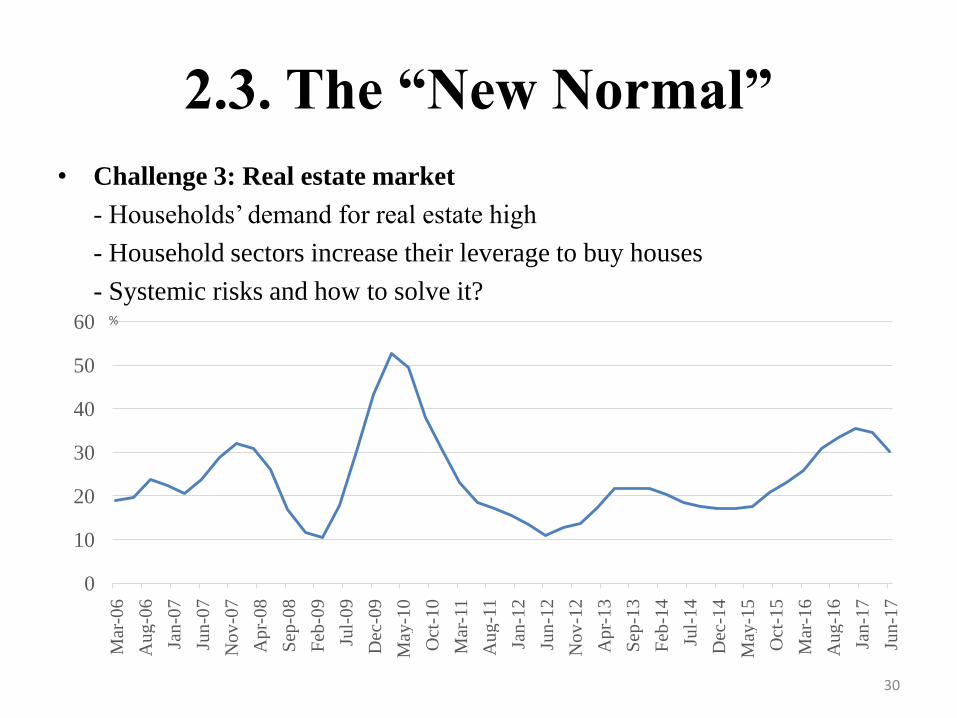
2.3. The “New Normal”
• Challenge 3: Real estate market
- Households’ demand for real estate high
- Household sectors increase their leverage to buy houses
- Systemic risks and how to solve it?
30
0
10
20
30
40
50
60
Mar
-06
Au
g-0
6
Jan
-07
Jun
-07
No
v-0
7
Ap
r-0
8
Sep
-08
Feb
-09
Jul-
09
Dec
-09
May
-10
Oct
-10
Mar
-11
Au
g-1
1
Jan
-12
Jun
-12
No
v-1
2
Ap
r-1
3
Sep
-13
Feb
-14
Jul-
14
Dec
-14
May
-15
Oct
-15
Mar
-16
Au
g-1
6
Jan
-17
Jun
-17
%
2.3. The “New Normal”
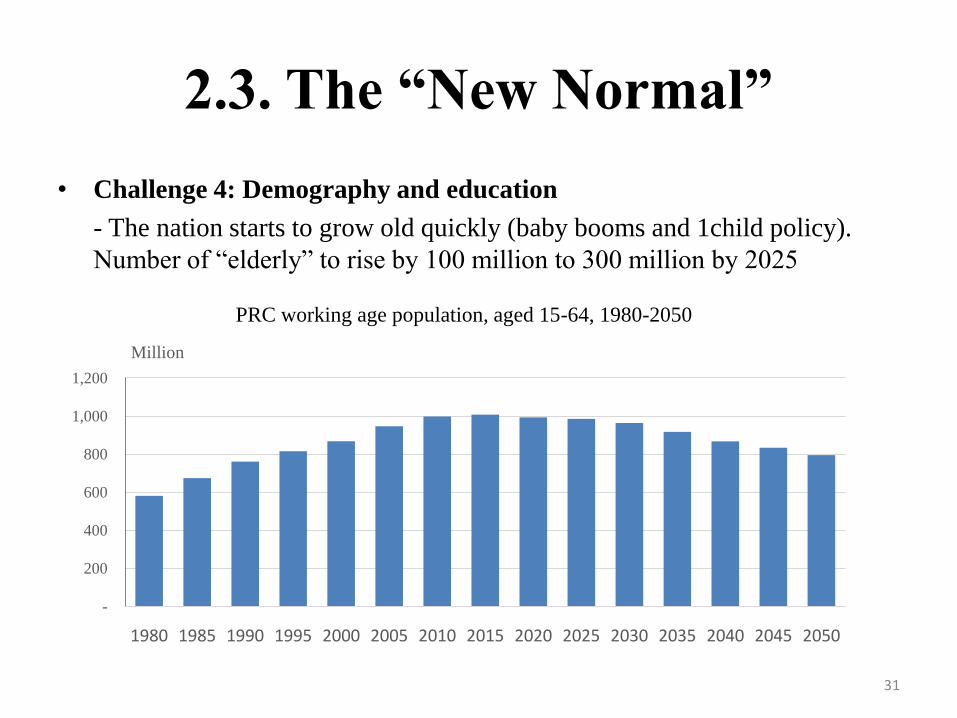
• Challenge 4: Demography and education
- The nation starts to grow old quickly (baby booms and 1child policy).
Number of “elderly” to rise by 100 million to 300 million by 2025
31
-
200
400
600
800
1,000
1,200
1980 1985 1990 1995 2000 2005 2010 2015 2020 2025 2030 2035 2040 2045 2050
Million
PRC working age population, aged 15-64, 1980-2050
2.3. The “New Normal”
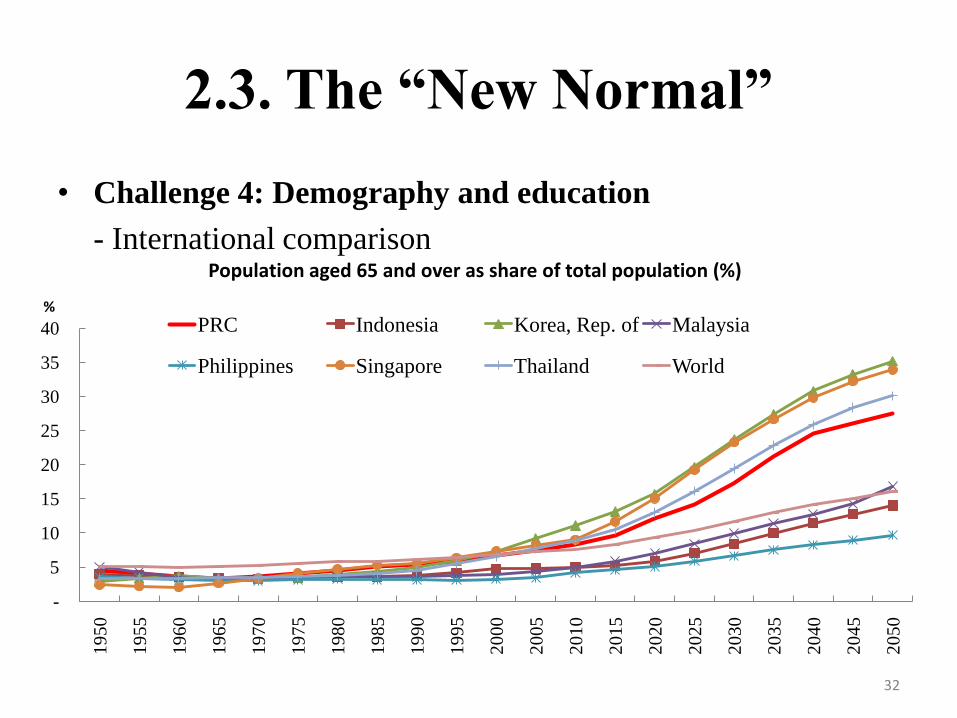
• Challenge 4: Demography and education
- International comparison
32
-
5
10
15
20
25
30
35
40
19
50
19
55
19
60
19
65
19
70
19
75
19
80
19
85
19
90
19
95
20
00
20
05
20
10
20
15
20
20
20
25
20
30
20
35
20
40
20
45
20
50
%
Population aged 65 and over as share of total population (%)
PRC Indonesia Korea, Rep. of Malaysia
Philippines Singapore Thailand World

2.3. The “New Normal”• Challenge 4: Demography and education
- Human resource kept in low level
- Education level of PRC’s 25-34 year olds in 2010 lower than OECD in
1980
- Education sector reform essential for PRC to increase productivity
33

2.3. The “New Normal”
34
High income economy =f(K,L,A)
.Competition
InnovationR&D
.
Financial sector
Public resource
management
Investment Climate
2.3. The “New Normal”
• Sustainable growth?
- Working population is reduced – less labor
- The education of the working population is
insufficient – small value-add
35

Summary
• China has maintained high growth rate starting from the 1970s, which is indeed a miracle in the modern society.
•
• The economic growth is a Pareto Improvement, because nearly the whole nation gain benefits.
• But after the financial crisis, China has made the policy to maintain its economic growth at the super-high level. The policy leaves some problems behind.
• Now China is trying very hard to push forward structural reform and reduce the systemic risks.
36

Thanks for Your Attention!
37