the bank lending channel: lessons from the crisis
TRANSCRIPT
WORK ING PAPER SER I E SNO 1335 / MAY 2011
by Leonardo Gambacortaand David Marques-Ibanez
THE BANK LENDING CHANNEL
LESSONS FROMTHE CRISIS

WORKING PAPER SER IESNO 1335 / MAY 2011
THE BANK LENDING CHANNEL
LESSONS FROM THE CRISIS 1
by Leonardo Gambacorta 2 and David Marques-Ibanez 3
1 This working paper is forthcoming in Economic Policy. We would like to thank the Editor of Economic Policy (Philippe Martin), Michael Haliassos,
Luigi Spaventa as well as two anonymous referees and the editors of the ECB and BIS working paper series for their very insightful comments
and suggestions. We would also like to thank Claudio Borio, Francesco Drudi, Gabriel Fagan, Michael King, Petra Gerlach-Kristen,
Philipp Hartmann, Andres Manzanares, Huw Pill, Steven Ongena, Flemming Würtz and participants at the 52nd Panel Meeting
of Economic Policy and at a BIS seminar for useful comments and discussions. The paper has been published
in Economic Policy (April 2011 issue). The opinions expressed in this paper are those of the
authors only and are in no way the responsibility of the BIS or the ECB.
2 Bank for International Settlements (BIS); e-mail: [email protected].
3 European Central Bank, Kaiserstrasse 29, D-60311 Frankfurt am Main,
Germany; e-mail: [email protected]
This paper can be downloaded without charge from http://www.ecb.europa.eu or from the Social Science Research Network electronic library at http://ssrn.com/abstract_id=1814042.
NOTE: This Working Paper should not be reported as representing the views of the European Central Bank (ECB). The views expressed are those of the authors
and do not necessarily reflect those of the ECB.In 2011 all ECB
publicationsfeature a motif
taken fromthe €100 banknote.

© European Central Bank, 2011
AddressKaiserstrasse 2960311 Frankfurt am Main, Germany
Postal addressPostfach 16 03 1960066 Frankfurt am Main, Germany
Telephone+49 69 1344 0
Internethttp://www.ecb.europa.eu
Fax+49 69 1344 6000
All rights reserved.
Any reproduction, publication and reprint in the form of a different publication, whether printed or produced electronically, in whole or in part, is permitted only with the explicit written authorisation of the ECB or the authors.
Information on all of the papers published in the ECB Working Paper Series can be found on the ECB’s website, http://www.ecb.europa.eu/pub/scientifi c/wps/date/html/index.en.html
ISSN 1725-2806 (online)

3ECB
Working Paper Series No 1335May 2011
Summary 4
Non-technical summary 5
1 Introduction 6
2 Stylised facts and empirical evidence 8
3 The new bank lending channel 9
3.1 The role of bank capital 10
3.2 Market funding, securitisation and the new bank business model 11
3.3 Monetary policy and bank risk 13
4 The econometric model 14
4.1 The data 4.2 The endogeneity problem 18
5 Results 19
5.1 Securitisation activity and the impact of low interest rates over a long period
5.2 The impact of bank debt funding on supplied lending 21
5.3 The role of bank capital and bank risk perception
6 Conclusions 24
References 26
Tables and fi gures 29
CONTENTS
1
20
22
7

4ECBWorking Paper Series No 1335May 2011
SUMMARY
The 2007-2010 financial crisis highlighted the central role of financial intermediaries’ stability in buttressing a smooth transmission of credit to borrowers. While results from the years prior to the crisis often cast doubts on the strength of the bank lending channel, recent evidence shows that bank-specific characteristics can have a large impact on the provision of credit. We show that new factors, such as changes in banks’ business models and market funding patterns, had modified the monetary transmission mechanism in Europe and in the US prior to the crisis, and demonstrate the existence of structural changes during the period of financial crisis. Banks with weaker core capital positions, greater dependence on market funding and on non-interest sources of income restricted the loan supply more strongly during the crisis period. These findings support the Basel III focus on banks’ core capital and on funding liquidity risks. They also call for a more forward-looking approach to the statistical data coverage of the banking sector by central banks. In particular, there should be a stronger focus on monitoring those financial factors that are likely to influence the functioning of the monetary transmission mechanism particularly in a period of crisis. JEL classification: E51, E52, E44. Keywords: bank lending channel, monetary policy, financial innovation.
5ECB
Working Paper Series No 1335May 2011
Non-technical summary The 2007-2010 financial crisis highlighted the central role of financial intermediaries’ stability in supporting a smooth transmission of monetary policy. In the decades prior to the credit crisis, however, most of the macroeconomic literature tended to overlook the role of banks as a potential source of frictions in the transmission mechanism of monetary policy. In parallel, empirical results from this period often cast doubts on the strength of the bank lending channel.
We study the impact of banks’ conditions on the provision of credit and the transmission mechanism of monetary policy during the recent crisis. We use a sample comprising more than 1,000 listed banks from 15 countries (Austria, Belgium, Denmark, Germany, Greece, Finland, France, Ireland, Italy, the Netherlands, Portugal, Spain, Sweden, the United Kingdom and the United States). Our sample incorporates quarterly information from individual banks including the period of the crisis as it covers the period spanning from the first quarter of 1999 to the fourth quarter of 2009. The use of quarterly information is more appropriate for measuring the short-term impact of monetary policy changes on bank lending. Bank risk is proxied by means of the one-year expected default frequency (EDF) which is a widely-used measure of credit risk employed by financial institutions, central banks and regulators. Bank balance-sheet information is matched with securitisation data originated by each bank and macroeconomic information at the country level.
We find that changes in banks’ funding patterns and business models have modified the transmission mechanism in Europe and in the US. The type of bank funding is a key element in assessing banks’ ability to withstand adverse shocks: dependence on short-term market funding and securitisation activity seem to be particularly important in this respect. In line with earlier work for the US, we find that bank capital (especially if measured by using the Tier 1 ratio) influences loan supply shifts. More generally, bank risk, as perceived by financial markets, is an important determinant of loan supply.
These findings support the Basel III focus on banks’ core capital and on funding liquidity risks. They also call for a more forward-looking approach to the statistical data coverage of the banking sector by central banks. The empirical findings of our paper also go in the direction of increasing the resilience of banks against liquidity risks. In this respect, our results showing that the composition of banks’ debt funding sources matters for the loan supply are in line with recent proposals on liquidity by the Basel Committee on Banking Supervision.
The amount of investment banking and other fee-based activities are also relevant factors influencing the transmission mechanism. During the crisis, banks with higher proportions of more profitable, but more volatile, non-interest income activities limited credit to borrowers to a greater extent. These results also hold when we take into account weak supervision of financial activities by regulators.
From a more operational perspective, the undoubtedly strong impact of banks’ conditions in determining their loan supply calls for an improvement in the statistical coverage and analysis of the financial sector by central banks. This would include detailed standardised and comparable microeconomic balance-sheet information on individual banks matched with borrowers’ conditions (i.e. including banks’ lending terms and conditions to individual borrowers). All in all, this calls for a more forward-looking and dynamic approach to data collection by central banks.
6ECBWorking Paper Series No 1335May 2011
1. INTRODUCTION
The 2007-2010 financial crisis has vividly highlighted the importance of the stability of the banking sector and its role in providing credit for global economic activity. In the decades prior to the credit crisis, however, most of the macroeconomic literature tended to overlook the role of banks as a potential source of frictions in the transmission mechanism of monetary policy. For example, most central banks around the world did not regularly include the banking sector in their macroeconomic models. There were three main reasons for this limited interest in the financial structure from a macroeconomic perspective.
First, it was technically difficult to model the role of financial intermediaries in “state-of-the-art” macroeconomic models. It is not easy to incorporate a fully fledged banking sector into Dynamic Stochastic General Equilibrium (DSGE) models in particular. It is only recently that initial steps in this direction have been taken by macroeconomic modellers, with the introduction of financial imperfections and bank capital into these models.1
Second, the role of financial intermediaries was not expected to be relevant under most economic conditions. The main reasons given during the years prior to the crisis for this subdued role of financial factors on macroeconomic conditions were the decline in the volatility of the economic cycle and the expected beneficial effect of financial innovation distributing credit risk across the financial system. As a result, there was a feeling by many macroeconomists that financial factors were interesting from a historical perspective but mostly a “veil” and not quantitatively relevant from a macroeconomic point of view.
Third, empirical papers on the traditional bank lending channel of monetary policy transmission yielded mixed results both in Europe and in the United States. In particular, the role of the quantity and the quality of bank capital in influencing loan supply shifts has been largely downplayed, especially in Europe.2
The recent credit crisis, however, has reminded us of the crucial role performed by banks in supplying lending to the economy, especially in a situation of serious financial distress. At the same time, this role seems to differ from that depicted in traditional models of the bank lending channel. In particular, the crisis has shown that the whole monetary transmission mechanism has changed as a result of deregulation, financial innovation and the increasing role of institutional investors. This has in turn led to changes in banks’ business models and the more intensive use of market funding sources, such as the securitisation market.
Similarly, the stronger interaction between banks and financial markets exacerbates the impact of financial market conditions on the incentive structures driving banks. A number of authors have argued that the effect of monetary policy on financial stability has increased in recent years, leading to a new transmission mechanism of monetary policy: the risk-taking channel.3 The gist of this argument is that low interest rates could indeed induce financial imbalances as a
1 See Adrian and Shin (2010) for a survey. See also Gerali et al. (2010) and Meh and Moran (2010). 2 See Angeloni, Kashyap and Mojon (2003) and Ashcraft (2006). 3 See amongst others, Rajan (2005) and Borio and Zhu (2008).

7ECB
Working Paper Series No 1335May 2011
result of a reduction in risk aversion and a more intensive search for yield by banks and other investors.
In this paper we use an extensive and unique database of individual bank information, including an array of complementary proxies accounting for banks’ risk, banks’ business models and institutional characteristics. Unlike the overwhelming majority of international banking studies which employ annual data, we use quarterly data, which is more appropriate for measuring the short-term impact of monetary policy changes on bank lending. The initial dataset includes more than 1,000 banks from the European Union Member States and the US.
Our findings shed new light on the functioning of the bank lending channel. First, we find that banks’ business models have had an impact on the supply of credit. In particular, the amount of short-term funding and securitisation activity seem to be especially important in the way banks react to monetary policy shocks. Likewise, the proportion of fee-based revenues is also a relevant component in influencing loan supply movements: banks with a large amount of more profitable but also more volatile non-interest income activities limited their lending portfolio to a greater extent during periods of crisis. These results also hold when we take into account the intensity of supervision of financial intermediaries. Second, we find that bank capital (especially if properly measured using a Tier 1 ratio) influences loan supply shifts; more generally, we find that bank risk as perceived by financial markets is a very important determinant of the loan supply. Third, our results show that a prolonged period of low interest rates could boost lending, which is consistent with the “risk-taking channel” hypothesis. Finally, we do not detect significant changes in the average impact of monetary policy on bank lending during the period of the financial crisis. In other words, interest rate cuts during the crisis produced beneficial effects on the growth of bank lending with no sign of a “pushing on a string effect”. Non-standard measures also seem to have had a positive effect on bank lending. This finding is in line with Lenza, Pill and Reichlin (2010), who show that non-standard measures have had a large and positive impact on bank lending mainly through the effect they have in reducing interest rate spreads.
This paper detects some changes in the monetary transmission mechanism via the bank lending channel prior to and during the crisis. The policy question is whether such changes will persist in the near future or will disappear as the crisis subsides. The evidence presented in the paper is consistent with a scenario in which changes in the bank lending channel will not be permanent but are likely to evolve over time. The functioning of the monetary transmission mechanism will be influenced by future developments in the securitisation market and further changes in the regulation of financial intermediaries. In particular, financial innovation and how regulators supervise new business models are likely to have a major impact on banks’ incentives in the coming years. Moreover, the ultimate impact of new business models and financial innovation on the transmission mechanism of monetary policy will also probably call for wider and more intensive financial supervision, including of non-bank financial institutions (the so-called shadow banking system), thereby widening the prudential regulatory perimeter. This in turn means that central banks would need to require more comprehensive and timely data on banks and other financial intermediaries, especially data on those institutions likely to be systemic in nature.

8ECBWorking Paper Series No 1335May 2011
The remainder of this paper is organised as follows: The next section discusses some stylised facts together with the existing empirical evidence. Section 3 revisits the bank lending channel in the light of the recent crisis. After a description of the econometric model and the data in Section 4, Section 5 then indicates the main results. Section 6 summarises the most important conclusions and the policy implications of our findings.
2. STYLISED FACTS AND EMPIRICAL EVIDENCE
In the traditional credit channel, owing to imperfect substitutability between bank lending and bonds, monetary policy may have a stronger impact on economic activity via bank loan supply restrictions. While closely interconnected, this credit channel of monetary policy has traditionally been broken down into two main branches: the “narrow” and the “broad” credit channels.
The narrow credit channel or traditional “bank lending” channel focuses on the financial frictions deriving from the balance-sheet situation of banks. It assumes that a monetary policy tightening raises the opportunity cost of holding deposits, which in turn leads banks to reduce lending on account of the relative fall in funding sources. In other words, it contends that after a monetary policy tightening, banks are forced to reduce their loan portfolio due to a decline in total reservable bank deposits. The broad credit channel also includes the “balance-sheet” channel, in which the financial circumstances of borrowers (households and firms) can augment real economy fluctuations (Bernanke and Gertler, 1995).
Angeloni et al. (2003) provide evidence for the existence of a broad credit channel in many of the largest euro area countries over the period 1993-1999.4 The results from this collection of studies suggested that the key factor in Europe seemed to be whether banks were holding high or low levels of liquid assets. Banks holding more liquid assets showed weaker loan adjustment in the wake of changes to the short-term interest rates. But in contrast to the US, monetary policy does not have a greater impact on the lending of small banks. This finding was explained by certain structural characteristics of European banking markets: the importance of banks’ networks, state guarantees and public ownership (Ehrmann et al. 2003; Ehrmann and Worms, 2004).5
Evidence from the United States is slightly stronger and suggests that banks might have to restrain lending following a monetary policy tightening not only if they face liquidity
4 See Angeloni et al. (2003). The Monetary Transmission Network (MTN) was an extensive three-year joint effort by the European Central Bank and the other Eurosystem central banks. A common characteristic of the MTN studies is that they used cross-sectional differences between banks to discriminate between loan supply and loan demand movements. The strategy relies on the hypothesis that certain bank-specific characteristics (for example size, liquidity and capitalisation) influence only loan supply movements, while a bank’s loan demand is independent of these characteristics. Broadly speaking, this approach assumes that after a monetary tightening the drop in the availability of total bank funding (which affects banks’ ability to make new loans) or the ability to shield loan portfolios differs from bank to bank. In particular, small and less capitalised banks, which suffer a high degree of information friction in financial markets, face a higher cost in raising non-secured deposits and are compelled to a greater extent to reduce their lending; illiquid banks are less able to shield the effect of a monetary tightening on lending simply by drawing down cash and securities. Overall, identification issues and endogeneity problems remain one of the most challenging aspects to be tackled by the literature (Peek and Rosengren, 2010). 5 More recently, other studies for euro area countries have found support for the existence of a credit channel in the euro area: Gambacorta (2008) – by using information for Italian bank prices rather than quantities – provides an alternative way of disentangling loan supply from loan demand shift; Jimenez et al. (2009b) provide evidence from Spain using information from loan applications.
9ECB
Working Paper Series No 1335May 2011
constraints (Kashyap and Stein, 1995) but also if they have low capital levels (Kishan and Opiela, 2000; Van den Heuvel, 2002). As in Europe, the bank lending channel in the United States is also heavily influenced by the presence of internal capital markets (Ashcraft, 2006).
Tentative evidence from the syndicated loan market in the US during the crisis provides support for the existence of significant supply constraints in terms of both quantity (Ivashina and Scharfstein, 2008) and price of credit (Santos, 2009). Using flows of funds data from the United States, Cohen-Cole et al. (2008) also argue in this direction. According to their results, the fact that the amount of lending did not decline during the first quarters of the crisis was not due to “new” lending but mainly to the use of loan commitments, lines of credit and securitisation activity returning to banks’ balance sheets.
From the perspective of the bank lending channel, a very interesting development, particularly in the euro area, has occurred during the recent credit crisis. In particular, non-financial corporations were able to raise substantial amounts of funding via the corporate bond market even if at very high interest rates (see Figure 1). That is to say, many of the very large firms were able to bypass supply constraints in the banking sector by directly tapping into the corporate bond market. This casts some doubt on the main hypothesis of the Bernanke and Blinder (1988) model, namely the imperfect substitutability between bank lending and bonds, at least for large borrowers. This means that the bank lending channel is also evolving over time as a result of the development of alternative forms of market funding for firms, such the corporate bond market (De Bondt and Marques-Ibanez, 2005).
The focus of our study is on how the various financial elements within the banking system (which are not included in models of the traditional bank lending channel) may affect the transmission mechanism of monetary policy (see Bernanke, 2008). Foremost among these are: the role of bank capital, new forms of market funding, and innovation in the market for credit risk transfer.
3. THE NEW BANK LENDING CHANNEL
During the last decade the banking industry has experienced a period of intensive financial deregulation. This increased competition in the banking sector, lowering in turn the market power of banks and thereby depressing their charter value. The decline in banks’ charter values coupled with their limited liability and the existence of ‘quasi’ flat-rate deposit insurance encouraged banks to expand and take on new risks. As a result, there has been intense growth in lending together with an expansion of the range of financial products usually offered by financial institutions. For instance, banks expanded their activities towards more volatile non-interest sources of income.
In parallel, financial innovation contributed to the development of the “Originate to Distribute” (OTD) model, an intermediation approach in which banks originate, repackage and then sell on their loans (or other assets such bonds or credit risk exposures) to the financial markets. In principle, these innovations allowed a broader range of investors to access a class of assets hitherto limited to banks (i.e. loans) thereby distributing the risks to financial markets.

10ECBWorking Paper Series No 1335May 2011
The spectacular increase in size of institutional investors (see Figure 2) has also meant that banks could rely much more on market sources of funding contributing to the expansion of the securitisation and covered bond markets. As a result, banks’ funding became much more dependent on the perceptions of financial markets.
These changes had a significant impact on the bank lending channel of monetary policy transmission, especially during the financial crisis. In this section we focus in particular on three major aspects which we believe became important: i) the role of bank capital; ii) market funding, securitisation and the new business model; iii) the link between monetary policy and bank risk.
3.1. The role of bank capital
Capital could become an important driver of banks’ decisions, particularly in periods of financial stress in which capital targets imposed by banks’ creditors or regulators become more stringent. Notwithstanding the large body of research on bank behaviour under capital regulation,6 limited attention has been devoted so far to the link between bank capital regulation and monetary policy.
In the traditional “bank lending channel”, a monetary tightening may impact on bank lending if the drop in deposits cannot be completely offset by issuing non-reservable liabilities (or liquidating some assets). Since the market for bank debt is not frictionless and non-reservable banks’ liabilities are typically not insured, a “lemon’s premium” has to be paid to investors. In this case, bank capital can affect banks’ external ratings, providing investors with a signal about their creditworthiness. The cost of non-reservable funding (i.e. bonds or certificates of deposit (CDs)) would therefore be higher for banks with low levels of capitalisation if they were perceived as riskier by the market. Such banks are therefore more exposed to asymmetric information problems and have less capacity to shield their credit relationships (Jayaratne and Morgan, 2000).
If banks were able to issue unlimited amounts of CDs or bonds not subject to reserve requirements, the “bank lending channel” would in principle not be effective.7 In general, bank capital has an effect on lending if two conditions hold. The first is where breaking the minimum capital requirement is costly and as a result banks want to limit the risk of future capital inadequacy (Van den Heuvel, 2002). As capital requirements are linked to the amount of credit outstanding, the latter would determine an immediate adjustment in lending. By contrast, if banks have an excess of capital the drop in capital could easily be absorbed without any consequence for the lending portfolio. As equity is relatively costly in comparison with other forms of funding (deposits, bonds) banks tend to economise units of capital and usually aim to minimise the amount of capital in excess of what regulators (or the markets) require. The second condition is an imperfect market for bank equity: banks cannot easily issue new equity, particularly in periods of crisis, because of the presence of tax disadvantages, adverse selection problems and agency costs.
6 See Van Hoose (2007) for a review. 7 This is the point of the Romer and Romer (1990) critique.
11ECB
Working Paper Series No 1335May 2011
Empirical evidence has shown that these two conditions typically hold and that bank capital matters in the propagation of shocks to the supply of bank credit (Kishan and Opiela, 2000; Gambacorta and Mistrulli, 2004; Altunbas, Gambacorta and Marqués, 2009a). These papers tend to show that capital could become an important driver of banks’ incentive structure, particularly in periods of financial stress, because during such periods raising capital becomes even more expensive or unfeasible. It is therefore highly probable that during the recent crisis, capital constraints on many banks may have limited the lending supplied. In the same way, Beltratti and Stulz (2009) showed that stock market prices of banks with more Tier 1 capital have also done relatively better during the crisis than banks with low levels of capitalisation.
While it is likely that the importance of bank capital as a buffer has increased in recent years – particularly during the financial crisis – it is also possible that the information content of traditional bank capital measures has also declined significantly. Indeed, in the years that preceded the crisis many banks increased their actual leverage while maintaining or improving their regulatory capital ratios. This was mainly because banks are able to take on risk by expanding in certain riskier areas where capital charges are lower. This would call for a re-thinking of the role of capital at the macroeconomic level as well, possibly linked to overall banking leverage.
3.2. Market funding, securitisation and the new bank business model
Innovations in funding markets have had a significant impact on banks’ ability and incentives to grant credit and, more specifically, on the effectiveness of the bank lending channel. A major innovation has been banks’ greater reliance on market sources of funding, be they traditional (i.e. the covered bond market) or the result of financial innovation (i.e. securitisation activity). Greater recourse to these market funding instruments has made banks increasingly dependant on capital markets’ perceptions. It has also made them less reliant on deposits to expand their loan base (see Figure 3).
Until the financial crisis most banks were easily able to complement deposits with alternative forms of financing. Specifically, in line with the Romer and Romer (1990) critique on the effectiveness of the bank lending channel, banks could use non-deposit sources of funding, such as certificates of deposit, covered bonds and asset-backed securities (ABSs).
The presence of internal capital markets in bank holding companies may also help to isolate exogenous variation in the financial constraints faced by banks’ subsidiaries. Ashcraft (2006) and Gambacorta (2005) show that the loan growth rate of affiliated banks is less sensitive to changes in monetary policy interest rates than that of unaffiliated banks. In other words, owing to the presence of internal capital markets, banks affiliated with multi-bank holding companies are better able to smooth policy-induced changes in official rates. This is because a large holding company can raise external funds more cheaply and downstream funds to its subsidiaries. Similar results are obtained by Ehrmann and Worms (2004). Overall, the evidence suggests that the role of the bank lending channel may be reduced in the case of small banks affiliated to a larger entity.
The change in the structure of banks’ funding is also having an impact on banks’ intermediation function. As banks become more dependent on market funding there is also a
12ECBWorking Paper Series No 1335May 2011
closer connection between the conditions in the corporate bond market and banks’ ability to raise financing. Consequently, banks’ incentives and ability to lend are also likely to be more sensitive to investors’ perceptions and overall financial markets conditions than in the past, when banks were overwhelmingly funded via bank deposits.8 From a monetary policy perspective, this would mean that the impact of a given level of interest rate on bank loan supply and loans pricing could change over time, depending on financial market conditions (Hale and Santos, 2010).
A related strand of the recent literature focuses on the role of securitisation (see Marques-Ibanez and Scheicher, 2010). Securitisation activity did indeed also increase spectacularly in the years prior to the credit crisis in countries where it has been hardly used in the past (see evidence for the euro area in Figure 4). The change in banks’ business models from “originate and hold” to “originate, repackage and sell” had significant implications for financial stability and the transmission mechanism of monetary policy. This is because the same instruments that are used to hedge risks also have the potential to undermine financial stability – by facilitating the leveraging of risk. Moreover, there were major flaws in the actual interaction among the different players involved in the securitisation process as conducted prior to the crisis. These included misaligned incentives along the securitisation chain, a lack of transparency with regard to the underlying risks of the securitisation business, and the poor management of those risks. The implications of securitisation for the incentives banks have to grant credit and their ability to react to monetary policy changes can be analysed from different angles.
First, there is significant evidence suggesting that securitisation in the subprime segment led to laxer screening of borrowers prior to the crisis9. The idea is that as securities are passed through from banks’ balance sheets to the markets there could be fewer incentives for financial intermediaries to screen borrowers. In the short term, this change in incentives would contribute to looser credit standards, so some borrowers who in the past were denied credit would now be able to obtain it. In the long term, this would lead to higher default rates on bank loans. The laxer screening of borrowers is typically linked to an expansion in the credit granted. Indeed, Mian and Sufi (2008) – using comprehensive information, broken down by US postal zip codes, to isolate demand factors – show that securitisation played an important role in the expansion of the supply of credit.
Second, there is evidence that securitisation has reduced the influence of monetary policy changes on credit supply. In normal times (i.e. when there is no financial stress), this would make the bank lending channel less effective (Loutskina and Strahan, 2006). In line with this hypothesis, Altunbas, Gambacorta and Marques-Ibanez (2009a) found that, prior to the recent financial crisis, banks making more use of securitisation were more sheltered from the effects of monetary policy changes. However, their macro-relevance exercise highlights the fact that securitisation’s role as a shock absorber for bank lending could even be reversed in a situation of financial distress.
8 This is mainly because deposits tend to be a relatively “sticky” source of funding and by definition less dependent on financial markets conditions than tradable instruments (see Berlin and Mester, 1999; Shleifer and Vishny, 2009). 9 For evidence on the US subprime market see Dell’Ariccia, Igan and Laeven (2008) and Keys et al. (2010). For a different perspective on the Italian market for securitised mortgages see Albertazzi et al. (2010).

13ECB
Working Paper Series No 1335May 2011
Another consequence of banking deregulation has been a global trend towards more diversification in banks’ income sources and an expansion of non-interest income revenues (trading, investment banking and higher brokerage fees and commissions). The increase in non-interest income provides banks with additional sources of revenue. Such diversification can help foster stability in banks’ overall income. At the same time, non-interest income is usually a much more volatile source of revenue than interest-rate income. In periods of financial stress there could be a decline in the traditional sources of revenue together with an even larger decline in revenues from fees and brokerage services. Under these conditions it is highly likely that the change in business model could have an impact on banks’ performance and their ability to supply credit.
In the case of investment banks this problem would be particularly acute owing to their high dependence on non-interest sources of income. Typically, they were more profitable than traditional commercial banks in the years prior to the crisis, but they were also much more leveraged and their earnings turned out to be more volatile (see Figure 5).
3.3. Monetary policy and bank risk
The more intense, market-based pricing and stronger interaction between banks and financial markets reinforce the incentive structures driving banks, potentially leading to stronger links between monetary policy and financial stability effects (Rajan, 2005). Altunbas, Gambacorta and Marqués (2009b) claim that bank risk must be considered carefully, together with other standard bank-specific characteristics, when analysing the functioning of the bank lending channel of monetary policy. As a result of financial innovation, variables capturing bank size, liquidity and capitalisation (the standard indicators used in the bank lending channel literature) may not be adequate for the accurate assessment of banks’ ability and willingness to supply additional loans. Namely, the size indicator has become less indicative of banks’ ability to grant loans as banks following the “originate-to-distribute” model have securitised substantial amounts of assets, thereby reducing their size as measured by on-balance sheet indicators. The ability of banks to sell loans promptly and obtain fresh liquidity, coupled with new developments in liquidity management, has also lowered banks’ needs to hold certain amounts of risk-free securities on the asset side of their balance sheet. This has, in turn, distorted the significance of standard liquidity ratios. Likewise, developments in accounting practices and a closer link with market perceptions have also probably blurred the informative power of the capital-to-asset ratio. The latter was illustrated most vividly by the recent financial crisis, which showed that many of the risks were not adequately captured on banks’ books. Overall, it seems that financial innovation has probably changed and increased banks’ incentives towards more risk-taking (Instefjord, 2005).
Some recent studies argue that monetary policy could also have an impact on banks’ incentives to take on risk. The question is whether the stance of monetary policy could lead to an increase in the “risk tolerance” of banks which might trigger a credit supply shock if the risk-taking proves to be excessive. This mechanism could, at least in part, have contributed to the build-up of bank risk during the recent credit crisis (see Figure 6).
14ECBWorking Paper Series No 1335May 2011
The risk-taking channel may operate because low rates increase asset managers’ incentives to take on more risks for contractual, behavioural or institutional reasons – the so-called “search for yield”. This would bring about a disproportionate increase in banks’ demand for riskier assets with higher expected returns. The “search for yield” may also depend on the “sticky” rate of (nominal) return targets in certain contracts which are prevalent in banks, pension funds and insurance companies. For fund managers, the importance of this mechanism seems to have increased in recent years, owing to the trend towards more benchmarking and short-termism in compensation policies.
The second way in which low interest rates could make banks take on more risk is through their impact on valuations, incomes and cash flows.10 A reduction in the policy rate boosts asset and collateral values, which in turn can modify bank estimates of probabilities of default, loss-given default and volatility. For example, by increasing asset prices low interest rates tend to reduce asset price volatility and thus risk perception: since a higher stock price increases the value of equity relative to corporate debt, a sharp increase in stock prices reduces corporate leverage and could thus decrease the risk of holding stocks. This example can be applied to the widespread use of value-at-risk methodologies for economic and regulatory capital purposes (Danielsson et al., 2004). As volatility tends to decline in rising markets, it releases risk budgets of financial firms and encourages position-taking. A similar argument is provided in the Adrian and Shin (2010) model; they stress that changes in measured risk determine adjustments in bank balance sheets and leverage conditions and this, in turn, amplifies business cycle movements.
Using two comprehensive confidential databases based on credit register data for Spanish and Bolivian banks, Jiménez et al. (2009a) and Ioannidou et al. (2009) demonstrate the existence of a risk-taking channel. In particular, they find evidence that a “too accommodative” monetary policy may have led to additional (and probably excessive) banks’ risk-taking prior to the crisis. Altunbas, Gambacorta and Marques-Ibanez (2010) find support for the idea of a significant link between monetary policy looseness – calculated using both the Taylor rule and the natural rate – and the amount of risks taken by banks operating in the European Union and US. The main policy implication is that central banks’ actions have an impact on the attitude of banks to risk.
4. THE ECONOMETRIC MODEL
The empirical specification is based on Kashyap and Stein (1995), Ehrmann et al (2003) and Ashcraft (2006), which we modify to take into account possible structural changes in the period of the financial crisis. This is done by running a crisis dummy (C), which takes the value of 1 from the third quarter of 2007 to the fourth quarter of 2009 and zero elsewhere, with the coefficients of the model allowing changes in value during the period of financial crisis.11 The model is expressed by the following equation:
10 This is close in spirit to the familiar financial accelerator, in which increases in collateral values reduce borrowing constraints (Bernanke et al, 1996). Adrian and Shin (2010) claim that the risk-taking channel differs from and reinforces the financial accelerator because it focuses on amplification mechanisms resulting from financing frictions in the lending sector. See also Borio and Zhu (2008). 11 A simple theoretical framework that justifies the empirical model is reported in Ehrmann et al. (2003). The econometric approach is in line with the research conducted in the euro area within the Monetary Transmission Network and its extensions (Angeloni et al., 2003; Gambacorta, 2005).
15ECB
Working Paper Series No 1335May 2011
ikttktiktktMktktM
ikttkiktiikt
ZXiCNSMPiCXCTDCDloansCloans
ε+ΓΘ+κ+∆ψ+ψ+β+∆φ+φ+δ+δ+Η+Β+∆α+α+µ=∆
−−−−−
−−
11111
11
)*( )*()*( )ln()*()ln(
(1)
with i=1,…, N, k=1, …, 12 and t=1, …, T, where N is the number of banks, k is the country, T is the final quarter, µi is a vector of fixed effects and tΘ are the seasonal dummies. Table 1 shows the summary statistics of the variables used in the regressions.
In equation (1) the growth rate in nominal bank lending to residents (excluding interbank positions), ∆ln(loans), is regressed on country and time dummies (CD and TD respectively). These variables do not represent the focus of our analysis but are very important to take into account different country-specific institutional characteristics and loan demand shifts through time.12
Bank-specific characteristics included in vector X are: SIZE, the log of total assets, LIQ, cash and securities over total assets, CAP, the standard capital-to-asset ratio (or, alternatively, the TIER1 ratio), SEC, a dummy for securitisation activity, RISK, a dummy for bank riskiness, NII, non-interest income over total revenues, DEP, the share of deposits over total liabilities, and STF, the share of short-term funding. Bank-specific characteristics refer to t-1 in order to mitigate a possible endogeneity bias (see Section 4.1). All bank-specific characteristics, except the dummies, have been normalised with respect to their averages across all banks in the sample, in order to obtain indicators that amount to zero over all observations. This means that for model (1) the average of the interaction terms are also zero, and the parameters φ and φ* may be broadly interpreted as the average monetary policy effect on lending for a theoretical average bank.
The variable ∆iM refers to changes in the monetary policy rate. The econometric specification also includes interactions between changes in the monetary policy rate and the vector of individual bank characteristics X. All central banks have taken non-standard monetary policy measures during the crisis (Borio and Disyatat, 2009; Del Negro et al., 2010). In order to disentangle the effects of such measures on bank lending from those determined by changes in the monetary policy rate we inserted in the regressions the ratio between each central bank’s total assets and nominal GDP, a proxy for non-standard policy measures (NSPM).
The vector Z includes other controls for institutional characteristics at the country level that could change through time: a measure for the relative stance of monetary policy (LOWINT), a dummy variable accounting for government assistance to specific banks (RESCUE) which takes the value of 1 from the quarter in which a bank benefits from specific government intervention, a regulatory variable accounting for the extent to which banks may engage in securities, insurance and real estate activities (REG) and, finally, a variable that measures the intensity of supervision (SUP).
There are three main hypotheses that can be tested using equation (1): (i) Do certain bank-specific characteristics affect the loan supply? (ii) Do certain bank-specific characteristics affect
12 Similar results may be obtained by substituting the time-fixed effects with country-specific macroeconomic variables such as the growth rate of nominal GDP, housing and stock price quarterly changes (Kashyap, Stein and Wilcox, 1993; Friedman and Kuttner, 1993; Bernanke and Gertler, 1989).

16ECBWorking Paper Series No 1335May 2011
the impact of monetary shocks on the lending supply? (iii) Have these effects changed in magnitude during the financial crisis?
The first test involves looking at the statistical significance of the coefficients in the δ vector in equation (1). For example, the short-term impact on lending in response to a change in bank capital is expressed by: CAPtt CAPloans δ=∆∆ −1/)ln( (where δCAP is the specific coefficient for bank capital in the vector δ). In contrast, the long-term impact is expressed by: )1/(/)ln( 1 αδ −=∆∆ − CAPtt CAPloans . In other words, if CAPδ >0 well-capitalised banks provide more loans.
The second hypothesis is verified through the statistical significance of the coefficient ψ in equation (1). A one percentage point increase in the monetary rate ∆iM causes a drop in lending that depends on bank-specific characteristics. In this respect the distributional effects of bank capital on lending (keeping other balance-sheet indicators equal) in the short run is expressed by
11/)ln( −− +=∆∆ tCAPMtt CAPiloans ψφ , while the long-run effect is represented by: )1/()(/)ln( 11 αψφ −+=∆∆ −− tCAPMtt CAPiloans . Interestingly, when CAPψ =0, banks with different
capital ratios at t-1 react similarly to a monetary shock as the two derivatives collapse to φ and )1/( αφ − respectively. These values correspond to the short and long-run effects of interest rate
changes on lending for the average bank. If CAPψ >0, the lending supply of well-capitalised banks in t-1 is less reactive to a monetary shock.
We performed the third test by looking at the statistical significance of the coefficients in the vectors δ∗ and ψ∗ . That is, we checked the possible existence of structural changes related to the crisis which are directly attributable to the impact of the capital base on bank lending (see point (i) above) by analysing the coefficient *
CAPδ . During the crisis period the short-term impact of lending in response to changes in bank capital at t-1 is expressed by:
*1/)ln( CAPCAPtt CAPloans δδ +=∆∆ − (where CAPδ and *
CAPδ are the specific coefficients for bank capital in the vectors δ and δ∗). Τhe long-term impact is expressed by:
)1/()(/)ln( **1 ααδδ −−+=∆∆ − CAPCAPtt CAPloans . If no structural changes in the effect of capital on
lending ( *CAPδ =0) or in the autoregressive component ( *α =0) are detected, the two effects are
equivalent to those analysed under (i). A similar approach can be used to test whether there are structural changes in the heterogeneity of the response in bank lending relating to different initial levels of capital. In this case the short-term effect is expressed by
1**
1 )(/)ln( −− +++=∆∆ tCAPMtt CAPiloansCAP
ψψφφ , while the long-run effect is given by: )1/(])([/)ln( *
1**
1 α−α−ψ+ψ+φ+φ=∆∆ −− tCAPMtt CAPiloansCAP
. If no structural changes in the effect of capital on lending ( *
CAPψ =0) or in the autoregressive component ( *α =0) are detected, the two effects are equivalent to those analysed under (ii).
The first part of Table 2 provides a summary of the expected signs of the impact on bank lending growth of bank-specific characteristics and their interaction with the monetary policy indicator.
17ECB
Working Paper Series No 1335May 2011
4.1. The data
The sample comprises quarterly balance sheet information from individual banks taken from Bloomberg between the first quarter of 1999 and the fourth quarter of 2009. Unlike the overwhelming majority of international banking studies, which employ annual data, we use quarterly information. It is more appropriate for measuring the short-term impact of monetary policy changes on bank lending. The initial sample includes information from a non-balanced panel of more than 1,000 banks from 15 countries: Austria, Belgium, Denmark, Germany, Greece, Finland, France, Ireland, Italy, the Netherlands, Portugal, Spain, Sweden, the United Kingdom and the United States. Our sample helps to ensure as much comparability as possible in accounting standards as only listed banks are included. These institutions are usually large and their financial statements more comparable.
Bank risk is proxied by means of the one-year ahead expected default frequency (EDF) which is a widely-used measure of credit risk employed by financial institutions, central banks and regulators.13 We believe the use of this measure to be very important because it is intended to capture transfers of credit risk not only via true sale securitisation but also through credit derivatives or synthetic collateralised debt obligations (CDOs), as perceived by market participants. EDF information is, however, only available for 737 banks in the sample. The dummy RISK takes the value of 1 for those banks that each quarter fall into the last decile of the EDF distribution.14
Securitisation data come from Bondware, which is a commercial database compiled by Dealogic, an independent data distributor, with additional data from Standard and Poor’s (S&P), a large private rating agency. The data starts in 1999 and covers more than 90% of the public funded securitisation market.15 The securitisation activity indicator (SEC) is a dummy that takes the value of 1 if a bank is particularly active in the securitisation market. The dummy has been constructed in the following way: we first calculated the ratio SL i,t/TAi,t-1, where SL stands for the flow of securitised lending in year t and TAt-1 represents each bank’s total assets at the end of the previous year. We then attached a value of one if a bank fell into the last quartile of the distribution of this ratio.
The monetary policy rate is the overnight rate (see Figure 7).16 Central bank total assets used to calculate the proxy for non-standard monetary policy measures were taken from Datastream and national sources (see Figure 8).17
13 EDF is a forward-looking indicator of credit risk computed by Moody’s KMV using financial markets data, balance-sheet information and Moody’s proprietary bankruptcy database. For more details, see among others Altunbas, Gambacorta and Marqués (2009b). 14 We consider as risky banks those banks belonging to the last decile because of the skewness of the EDF distribution. However, we find qualitatively similar results when considering those banks belonging to the last quartile of the distribution. 15 We look at individual deal-by-deal issuance patterns from euro-area originators. The advantage of using data on securitisation activity from Bondware and S&P is that the name of the originator, date of issuance and deal proceeds are registered. The sample includes funded public ABSs as well as cash flow (balance-sheet) CDOs issued by euro-area originators. In other words, the securities included in the sample involve a transfer of funding from market investors to originators so that pure synthetic structures (such as synthetic CDOs, in which there is transfer of credit risk only) are not included. 16 We also tried other measures of monetary policy rates with a higher maturity (one-month, three-month) that might be better able to capture the effect of the recent credit crisis on the actual cost of bank refinancing. However, the main results of the model remained unchanged from a qualitative point of view.

18ECBWorking Paper Series No 1335May 2011
We were able to evaluate the stance of monetary policy by examining the difference between the real short-term interest rate and the “natural interest rate”, calculated using a Hodrick-Prescott filter. The aim of this variable is to control for the presence of a risk-taking channel of monetary policy: low interest rates over an extended period of time could push banks to take on more risk and increase lending supply. In order to capture the persistency of low interest rate over time we constructed a variable LOWINT, which counts how many consecutive quarters the real short-term interest rate has been below the natural one.18
Table 3 gives some basic information on the dataset that includes more than 1,000 banks. From a macroeconomic point of view, the dataset is highly representative as it comprises more than two-thirds of the total lending provided by banks in the European Union and the US. The average size of the banks in the sample is largest in the United Kingdom, Belgium and Sweden and smallest in Finland. At the same time, the average size of US banks is not very large because there is more information available for this country and many small banks are also listed. The averages of individual bank characteristics differ across countries. There are also differences in terms of capital and liquidity ratios, probably reflecting different competitive and institutional conditions, as well as different stages of the business cycle. 19
4.2. The endogeneity problem
One possible identification limitation in testing whether monetary policy affects bank lending is that, in principle, the situation of the banking sector could also impact on monetary policy decisions.
We have considered this potential problem using the dynamic Generalised Method of Moments (GMM) panel methodology that allows us to obtain consistent and unbiased estimates of the relationship between the monetary policy indicator, bank-specific characteristics and bank lending. This methodology was developed by Arellano and Bond (1991), and further developed by Blundell and Bond (1998). It helps mitigate some of the endogeneity concerns if the instruments (lagged values of the variables) are not correlated with the variables under investigation. The GMM estimator ensures efficiency and consistency, provided that the models are not subject to serial correlation of order two and that the instruments used are valid (this is checked using the Sargan test). We use the instruments as defined by Blundell and Bond (1998). According to these authors, in fact, exogenous variables, transformed in first differences, are
17 The high ratio for Denmark is due to a large amount of foreign assets owned by the central bank. However, the use of the first difference of the ratio in equation (1) as proxy for non-standard monetary policy measure attenuates this characteristic. 18 For more details on the construction of this variable and a comparison with a Taylor rule see Altunbas, Gambacorta and Marqués-Ibanez (2010). Table A1 in the appendix provides the correlation matrix between the variables used in the regression. 19 US banks represent three-quarters of the dataset while the rest mostly comprises large European listed banks. While the sample covers between 50% and 80% of each domestic financial system measured in terms of total assets, for some countries the number of institutions is insufficient to give a complete representation of the structure of the domestic banking industry. This also prevents us from running individual country regressions. However, the scope of our analysis is to detect possible changes in the bank lending channel prior to and during the crisis, independent of bank jurisdiction, because we work mostly with large banks operating internationally. We have taken account of country-specific aspects through the inclusion of country fixed effects and institutional controls (via the regulatory and supervisory indices). Overall, we interpret our result as valid in general for banks in the EU and US once country-specific factors have been taken into account.
19ECB
Working Paper Series No 1335May 2011
instrumented by themselves, while endogenous regressors (also transformed in first differences) are instrumented by their lags in levels.
This approach has been applied in other areas of research in which the model was affected by possible endogeneity biases. For instance, Blundell and Bond (1998) use it to estimate a labour demand model and Beck et al. (2000) apply it to investigate the relation between financial development and economic growth. Following the work by Ehrmann et al (2003) the GMM methodology has also been used extensively in the bank lending channel literature.
5. RESULTS
The results of the regressions are summarised in the right-hand part of Table 2. Details on all the coefficients, their standard errors and the miss-specification test for the regressions are given in Tables A2 and A3 in the Appendix. Column A2.I reports the results of the baseline equation taken by Ehrmann et al. (2003). The response of bank lending to short-term interest rates has the expected negative sign and the effect is amplified during the period of the financial crisis: in normal times, a one percentage point increase in the monetary interest rate causes a 1.6% drop in lending. The effect is greater during the crisis (-2.0%) but the difference is not statistically significant.20
The positive coefficient attached to the variable NSMP suggests that non-standard monetary policy measures have indeed been effective during the crisis in containing the drop in lending. Taking the results at face value, a 1% increase in the ratio between total central bank assets and GDP leads to a 0.5% increase in the growth rate of nominal lending. This result remains statistically significant also in more complete specifications but tend to have a lower size.
Most of the theoretical models would suggest that the effect of banks’ size, liquidity and capital (SIZE, LIQ and CAP) on supplied lending should be positive (see first part of Table 2). This means that big, well-capitalised and highly-liquid banks should be less prone to adjusting their credit portfolio in the event of a monetary policy shock and in the course of a crisis. However, our results show that many of these coefficients in fact turn out not to be significant or to be unexpectedly negative. Consistent with Ehrmann et al. (2003), the effect for SIZE is never significant in normal times, and its role as an indicator of informational asymmetries appears to be quite poor. The coefficient on the standard capital-to-asset ratio often has an incorrect negative sign, which casts some doubt on the role of this indicator in capturing the effect of bank’s capital position on bank lending. The interaction between liquidity and the monetary policy indicator is also negative (even if not statistically significant), suggesting that lending by banks with a higher level of liquidity reacts more sharply to monetary changes, especially in periods of crisis. This is contrary to standard results in the monetary transmission channel literature and could result from the fact that most of the securities included in the ratio proved not to be liquid in the crisis. These preliminary results call for further investigation of
20 The long-run elasticity of bank lending with respect to monetary interest rate changes for the average bank is expressed as follows: )1/()(/)ln( **
1 ααφφ −−+=∆∆ −Mtt iloans . If we take the coefficients in the first column of Table A2, in normal times, when 0** == αφ , the long-run elasticity is: -1.569/(1-0.027)=-1.61, while during the period of crisis it is: (-1.569-0.331)/(1-0.027-0.001)= -1.98. However, the difference between the effect in normal times and that during the crisis is not statistically significant.

20ECBWorking Paper Series No 1335May 2011
the new mechanism of monetary policy transmission resulting from the changes in bank liquidity management highlighted in Section 3.
5.1. Securitisation activity and the impact of low interest rates over a long period
In column A2.II of Table 2 the baseline model has been extended to include controls for: i); securitisation activity; ii) the risk-taking channel; iii) regulatory differences.
Securitisation activity is positively related to bank lending. That is to say, banks that securitise their assets to a larger extent have, on average, a higher growth rate of lending. This result is consistent with the view of securitisation as a source of capital relief and additional funding that can be used by banks to grant additional loans (Altunbas et al., 2009a).
As expected, there is a positive interaction between securitisation and monetary policy which is in line with the bank lending channel literature. This means that banks with greater access to the securitisation market are better able to buffer their lending activity against shocks related to the availability of external finance. However, this effect is more limited in normal times than during a financial crisis. For example, if we take the coefficients from the second column in Table A2, after three months in normal times a one percent increase in the money market rate leads to a drop in bank lending of 1.6% for the average bank and of 0.5 percent for a bank that is particularly active in the securitisation market (i.e. in the last quartile of the distribution of securitised lending over total assets). The difference tends to reduce if the increase in the money market rate takes place during a period of crisis: In the latter case the drop in lending is equal to 2.1% for the average bank and 1.6% for the bank that remains particularly active in the securitisation market.21 The reduction in the insulating effect of securitisation during the crisis period was probably due to the fact that banks had difficulties in originating and distributing ABSs during the crisis. Indeed, the securitisation market remained seriously distressed after August 2007 and many ABSs continued to be self-retained and were used as collateral in refinancing operations with the central bank (see Figure 4). This implies that overall the insulation effect of securitisation was limited in the period 2007-2009.22
21 The heterogeneous effects of a monetary tightening on bank lending owing to different levels of activity among banks in the securitisation market can be calculated as follows: the interaction between securitisation and monetary policy can be expressed as ψSEC in normal times and as ψSEC +ψ*SEC during the crisis period (see equation (1)). In normal times a 1% increase in the monetary policy rate (∆iM=1%) after three months causes a drop in lending equal to φ +ψSEC SECt-1. If we take the coefficients from column II in Table A2 (φ=-1.621, ψSEC =1.072), this implies a drop in lending of -1.621+1.072SECt-1. The impact on lending for the average bank (i.e. SEC=0) is thus equal to -1.621%, while the drop in lending for a bank that has a level of securitisation activity in the last quartile of the distribution (SEC=1) is equal to -0.549%. In normal times, banks more active in the securitisation market are therefore better insulated from a monetary shock, although in economic terms this insulation effect is not particularly large. The relative impact in the long run ((-1.621+1.072SECt-1)/(1-0.035)) will be only slightly higher, at -1.68% and -0.57% respectively, indicating that the transmission of the monetary impulse to bank lending is almost complete after three months. During the period of crisis the short-run impact of a one percent increase in the overnight interest rate may be expressed as φ +φ*+(ψSEC+ψ*SEC)SECt-1. If we take the coefficients from the second column of Table 3 (φ*=--0.494, ψ*SEC =-0.455), we have -2.115+0.617 SECt-1. Hence, the impact on lending for the average bank is equal to -2.11%, while the drop for a bank which is particularly active in the securitisation market is equal to -1.64.. In this case the relative impact in the long run will be higher (due to the change in the autoregressive component, α*=0.049), at -2.31% and -1.64% respectively. This indicates that during the financial crisis the insulating impact of securitisation on the credit portfolio was lower, probably due to the small volumes treated on the market. 22 Much of the issuance of ABSs since the end of 2007 has been related to their use as collateral in the Eurosystem refinancing operations. According to informal estimates from market participants, approximately 90% of euro-denominated ABSs issued in 2008 seems to have been used as collateral for ECB liquidity standing facilities rather than sold to the markets. This percentage is even higher if we consider only real mortgage-backed securities (RMBS).
21ECB
Working Paper Series No 1335May 2011
The results in the column A2.II of Table 2 are consistent with the existence of a risk-taking channel: there is a positive and significant link between the number of consecutive quarters in which interest rates are below the benchmark (LOWINT) and supplied lending (Altunbas et al., 2010). This is not a direct test for the existence of such a channel but nevertheless suggests that bank lending has expanded more in those jurisdictions where interest rates have been particularly low for a prolonged period of time. This result is consistent with the evidence provided by Altunbas et al. (2010), who analyse in a more systematic way the impact of low interest rates on different measures of bank risk-taking.
Following the approach in Barth et al. (2004), we introduced into the model a regulation variable (REG) that takes into account the extent to which banks are allowed to engage in securities, insurance and real estate activities. For the countries analysed in this study, the variable REG takes a value between 5 and 12, where the latter value represents the maximum level of activity in which banks may engage. The results indicate a negative value for this variable, supporting the idea that banks supplied less lending in those countries where specific institutional factors allowed them also to be involved in more non-traditional banking activities.
5.2. The impact of bank debt funding on supplied lending
As discussed in Section 3, the bank lending channel literature has neglected so far the role of bank funding composition in influencing lending supply. In this section we try to fill this gap by analysing two new measures that could alter the functioning of the monetary transmission mechanism, especially during a crisis: i) the deposit to total liability ratio; ii) the short-term funding ratio.
The first indicator has been used to date as a measure of bank contractual strength. Banks that have a large amount of deposits will adjust their deposit rates by less (and less quickly) than banks whose liabilities are mainly composed of variable rate bonds that are directly affected by market movements (Berlin and Mester, 1999). Intuitively, this should mean that, in view of the presence of menu costs, it is more likely that a bank will adjust its terms for passive deposits if the conditions relating to its own alternative form of refinancing (i.e. bonds) change. Moreover, a bank will refrain from changing deposit conditions because, if the ratio of deposits to total liabilities is high, even small changes to their price will have a huge effect on total interest rate costs. In contrast, banks which use relatively more bonds than deposits for financing purposes come under greater pressure because their costs increase contemporaneously with and to a similar extent as market rates.
The above-mentioned mechanism should work especially during periods of financial stress. The results in column A2.III of Table 2 show that this is indeed the case. The interaction of the deposit to total liability ratio (DEP) and changes in the interest rate is very strong during periods of crisis though it is not significant in normal times.
The second indicator is the short-term funding ratio. The financial crisis has shown that those banks with an unbalanced funding structure inclined towards short-term market instruments suffered more. This is reflected in the results presented in column A2.IV of Table 2: the credit portfolios of banks with a high percentage of short-term market funding instruments (STF)

22ECBWorking Paper Series No 1335May 2011
shrank by more during the period of financial distress and reacted by more to monetary policy changes.
5.3. The role of bank capital and bank risk perception
The results reported so far do not suggest the existence of meaningful cross-sectional differences in the response of lending to monetary policy shocks resulting from differences in bank capitalisation. Coefficients for bank capital are in most cases insignificant or unexpectedly negative in normal times. This could have two main explanations: i) the standard capital-to-asset ratio typically used by the bank lending channel literature does not properly capture the capital adequacy of banks (Gambacorta and Mistrulli, 2004); ii) accounting practices have blurred the informative power of the capital-to-asset ratio; the latter was illustrated most vividly by the recent financial crisis, which showed that many of the risks had not previously been captured adequately on banks’ books.
In this section we try to overcome these problems in two ways. First, we use the Tier 1 ratio (Tier 1 capital over risk-weighted asset), which can control better for banks’ solvency. Another major advantage of the use of core capital is that this measure is more comparable across countries than broader measures of capital.23 Second, we include directly in the specification an ex-ante measure for bank risk based on the one-year ahead expected default frequency (EDF). The latter is a forward-looking indicator that allows for a more direct assessment of how the markets perceive bank risk.24
However, the inclusion of these variables in the regression has a cost in terms of the representativeness of the sample because Tier 1 and EDF data are not available for all the banks. The Tier 1 ratio is available for 924 banks and the EDF variable for only 737 banks.
Column A3.I of Table 2 indicates that when the Tier 1 ratio is included in the specification, well-capitalised banks show a significantly higher supply of lending, especially during the period of financial crisis. There are also significant differences between banks with high and low levels of capitalisation when the reaction to changes in the short-term interest rates is examined.
Column A3.II of Table 2 includes the dummy RISK (that takes the value of 1 for those banks that are in the last decile of the EDF distribution) and its interaction with the monetary policy indicator and the dummy crisis. The dummy RISK replaces the variable SIZE as a more direct measure for bank risk. The results show that bank riskiness has a negative effect on the banks’ capacity to provide lending, and that this was especially the case during the period of crisis. As indicated in Section 3, unlike other bank-specific variables, which reflect historical accounting information, expected-default frequencies (EDF) is a forward-looking variable. It partly reflects “market discipline”, including markets’ perceptions of the bank and their capability to issue riskier uninsured funds (such as bonds or CDs). In this respect, there is evidence that investors in banks’ debt are quite sensitive to bank risk (Sironi, 2003). As a result, it would be difficult for
23 Partly for this reason Tier 1 capital was included among the Financial Soundness Indicators proposed by the IMF as long ago as 2001 (IMF, 2001). 24 Also arising from the use of true-sale securitisation, credit derivatives or synthetic CDOs, not included in the variable SEC.

23ECB
Working Paper Series No 1335May 2011
banks perceived as riskier by the market to issue uninsured debt or equity funds to finance lending, especially during periods of financial crisis (Shin, 2008).
Not all banks were equally affected during the period of financial turmoil. The banks which were predominantly hit were large institutions which had moved away from traditional retail banking activities towards a business model that principally relied on trading, investment banking activities and the creation, distribution and trading of new and complex securities. In column A3.III of Table 2 we have therefore replaced the liquidity ratio with the ratio between non-interest income and total revenues (NII). The results show that those banks that adopted an unbalanced business model tilted towards non-traditional activities were hit most during the crisis and therefore benefited more from the interest rate cuts.
The impact of non-interest income on the monetary transmission mechanism could be affected by the intensity of bank supervision. In the last column of Table 2 we have therefore introduced a discrete variable for supervisory strength, SUP, used by Barth et al (2004) that could in principle take a value ranging from 0 (no supervision) to 10 (maximum supervision). In our dataset this variable ranges from 4.6 to 8.4. Even with the variable the result still holds.
The last robustness check involved evaluating the potential impact on our results of other country factors at the bank level. In other words, we checked whether individual bank coefficients could change in different countries even when there were controls for country-specific institutional, macroeconomic or financial factors. Banks with exactly the same characteristics (bank capital, size, liquidity, profitability, funding structure, etc.) might indeed react differently because of some unobservable country characteristics (not correlated with the observable characteristics in the regression (fixed country effect, quality of supervision, regulation, etc.).
In order to take into account this point we tried first to include country-specific coefficients. However the model was very difficult to estimate because of the high number of parameters. Results turned out to be rather unstable, with problems of autocorrelation of the residual and weak power of the instruments. This was basically because of the few banks available for some countries.
We tried therefore to follow a different approach by regrouping our sample into two main regional economic areas and re-estimating a simplified version of the last equation of Table 2 (column IV in Table A3) that excludes interaction terms between monetary policy changes and bank-specific characteristics. In particular, we used the following equation:
ikttkt
ktktMikt
tiktiikt
ZNSMPEUiCEUXCEU
TDloansCEUloans
ε+ΓΘ+κ++β++∆φ+φ++δ+δ+
+Η+∆α+α++µ=∆
−
−−−
−
1
111
1
)1()*)(1()*)(1(
)ln()*)(1()ln(
(2)
with i=1, …, N, k=1, …, 12 and t=1, …, T, where N is the number of banks, k is the country, T is the final quarter, µi is a vector of fixed effects, and EU is a dummy variable that takes the value of 1 if the bank has its headquarter in the European Union.
24ECBWorking Paper Series No 1335May 2011
The results (not reported for the sake of brevity) largely suggested that there were no significant differences in the coefficients for European banks (coefficients of variables interacted with EU proved never to be statistically significant).25
6. CONCLUSIONS
This paper finds significant changes in the functioning of the bank lending channel of monetary policy transmission resulting from financial innovation and changes in banks’ business models. In contrast to earlier studies, we document that the standard bank-specific characteristics usually included in the literature (size, liquidity, capitalisation) are not able to fully capture the functioning of the new dimensions of the bank lending channel.
An important result is that the type of funding is a key element in assessing banks’ ability to withstand adverse shocks: short-term funding and securitisation activity seem to be particularly important in this respect. The amount of investment banking and other fee-based activities is also a relevant factor influencing the transmission mechanism. Banks with a high proportion of more profitable, but more volatile, non-interest income activities limited credit to borrowers to a greater extent during the crisis. These results also hold when we take into account differences in the supervision of financial activities by regulators.
An important question is whether such changes in the transmission mechanism will persist in the near future or will disappear as the crisis subsides. The evidence presented in the paper is consistent with a scenario in which such changes cannot be considered as permanent but are likely to evolve over time.
The functioning of the monetary policy transmission mechanism will be influenced by future developments in the securitisation market. For example, a drop-off in securitisation volumes will hinder banks from raising funds in the financial markets and hamper their ability to supply loans in the event of a monetary tightening. Moreover, the new financial regulations (MAG, 2010; BCBS, 2010a) will surely have an effect on the functioning of the bank lending channel in the years ahead.
Some policy implications can be derived from our results. First, monetary policy is not completely neutral from a financial stability perspective. Deregulation and financial innovation have made banks much more vulnerable to market conditions and bouts of financial instability. From a policy perspective, this brings financial stability and monetary policy considerations much closer together.
Second, the results feed into the current policy debate on the new guidelines for capital and banking regulations drawn up by the Basel Committee on Banking Supervision (BCBS, 2009a and 2010b), usually referred to as Basel III, since they suggest that strengthening core capital
25 This result is interesting in that it provides a robustness check for an interpretation of our results that is valid in general for listed banks in the EU and the US. However, it has to be taken with caution because the dataset has an over-representation of US banks. Even grouping the information the content of our results for European and US banks only is subject to a number of caveats. For example, UK banks operate as part of a very large and market-based financial system with a global outlook as well as clearly differentiated legal features when compared with those in other European Union countries. For all these reasons we think that cross-country comparison could be an interesting area for future research. However, this probably needs a different dataset, ideally with more detailed information on the banking structure at the country level.
25ECB
Working Paper Series No 1335May 2011
helps to ensure a smooth transmission of monetary policy and this is in line with the agreements reached by the BCBS. Specifically, our results on core bank capital for the crisis period concur with the initiatives of increasing minimum common equity requirements and a stronger definition of bank capital. The proposed creation of a counter-cyclical capital buffer of additional core capital that can be used to absorb losses during periods of stress seems also very much in accordance with our results (Drehmann et al., 2010).
The empirical findings of our paper also go in the direction of the desirability of increasing the resilience of banks against liquidity risks (BCBS, 2009b; 2010a). Our exercise showed that the composition of banks’ debt funding sources matters for the loan supply in that increased short-term funding and/or additional funding via market sources (i.e. securitisation and bond financing) seem to constrain banks’ ability to supply new loans in periods of financial instability. This is in line with the BCBS liquidity proposals for a net stable funding ratio.
Third, from a more operational perspective, the undoubtedly strong impact of bank-specific conditions on their loan supply calls for an improvement in the statistical coverage and analysis of the financial sector by central banks. This could include detailed standardised and comparable microeconomic balance-sheet information on individual banks matched with borrowers’ conditions (i.e. including banks’ lending terms and conditions to individual borrowers). A very useful initiative in this respect would be the creation of comprehensive and standardised credit registers available to central bankers on a confidential basis. The data coverage could also incorporate banks’ off-balance-sheet activities in order to better capture changing business models and financial innovation developments (Jappelli and Pagano, 1993; 2002). However, differences in data protection laws could be a difficult obstacle to overcome at the international level (Matuszyk and Thomas, 2008).
Fourth, the closer link between financial stability and monetary policy considerations calls for a better understanding of banks’ incentives to take risks. The systemic dimension of these incentives could have a macroeconomic impact on the aggregate loan supply. It could also require a widening of the perimeter of statistical data collection to include the incentives of non-bank systemic financial institutions whose failure could potentially have a large impact on the broader financial system and therefore on banks’ ability to lend. All in all, this calls for a more forward-looking and dynamic approach to data collection by central banks, supervisory authorities and statistical offices so that the risk-taking incentives of large financial players are better understood.
The recent crisis has prompted the creation of a number of institutions to monitor and contain the emergence of systemic risks in a number of countries.26 The coordination of the collection and analysis of the type of data mentioned earlier in close cooperation with central banks would be useful for a careful quantification of bank supply constraints. More broadly, such cooperation might be paramount for ascertaining the best policy to pursue to prevent future financial crises or to buffer their deleterious consequences.
26 Such as the Financial Stability Oversight Committee in the United States, the European Systemic Risk Board in Europe or the work of the Financial Stability Board globally.

26ECBWorking Paper Series No 1335May 2011
REFERENCES
Adrian, T. and H. S. Shin (2010). ‘Financial Intermediaries and Monetary Economics’, in B.M. Friedman and M. Woodford, eds., Handbook of Monetary Economics, 3, Amsterdam: Elsevier.
Albertazzi, U., G. Eramo, L. Gambacorta, C. Salleo (2010). ‘Securitization is not that evil after all’, Bank for International Settlements Working Paper, forthcoming.
Altunbas, Y., L. Gambacorta and D. Marques-Ibanez (2009a). ‘Securitisation and the bank lending channel’, European Economic Review, 53(8), 996-1009.
Altunbas, Y., L. Gambacorta and D. Marques-Ibanez (2009b). ‘Bank risk and monetary policy’, Journal of Financial Stability, 6(3), 121-129.
Altunbas, Y., L. Gambacorta and D. Marques-Ibanez (2010). ‘Does monetary policy affect bank risk-taking?’, Bank for International Settlements Working Papers 298 and European Central Bank Working Paper 1166.
Angeloni, I., A. Kashyap and B. Mojon (2003). Monetary Policy Transmission in the Euro Area, Cambridge University Press.
Arellano, M. and S. Bond (1991). ‘Some Tests of Specification for Panel Data: Monte Carlo Evidence and an Application to Employment Equations’, Review of Economic Studies, 58(2), 277–97.
Ashcraft, A. (2006). ‘New Evidence on the Lending Channel’, Journal of Money, Credit, and Banking, 38(3), 751-76.
Barth, J.R., G. Caprio and R. Levine (2004). ‘Bank regulation and supervision: What works best?’, Journal of Financial Intermediation, 13(2), 205-48.
Basel Committee on Banking Supervision (2009a). ‘Strengthening the resilience of the banking sector’, consultative document, Basel.
Basel Committee on Banking Supervision (2009b). ‘International framework for liquidity risk measurement, standards and monitoring’ consultative document, Basel.
Basel Committee on Banking Supervision (2010a). ‘An Assessment of the Long-Term Impact of Stronger Capital and Liquidity Requirements’, August.
Basel Committee on Banking Supervision (2010b), ‘Group of Governors and Heads of Supervision announces higher global minimum capital standards’, Press release, 12 September.
Beck, T., R. Levine and N.Loayza (2000). ‘Finance and the sources of growth’, Journal of Financial Economics, 58(1-2), 261–300.
Beltratti, A. and R. M. Stulz (2009). ‘Why did some banks perform better during the credit crisis? A cross-country study of the impact of governance and regulation’, Charles A Dice Center Working Paper No. 2009-12.
Berlin, M. and L.J. Mester (1999). ‘Deposits and relationship lending’, Review of Financial Studies, 12(3), 579-607.
Bernanke, B.S. (2008). ‘The Financial accelerator and the credit channel’, remarks at the conference on The Credit Channel of Monetary Policy in the Twenty First Century, Federal Reserve Bank of Atlanta.
Bernanke, B. and A.S. Blinder (1988). ‘Is it money or credit, or both or neither? Credit, money and aggregate demand’, American Economic Review, 78(2), 435-9.
Bernanke, B. and M. Gertler (1989). ‘Agency Costs, Net Worth, and Business Fluctuations’, American Economic Review, 79(1), 14-31.
Bernanke, B.S. and M. Gertler (1995). ‘Inside the black box: The credit channel of monetary policy transmission’, Journal of Economic Perspectives, 9(1), 27-48.
Bernanke, B., M. Gertler and S. Gilchrist (1996). ‘The financial accelerator and the flight to quality’, The Review of Economics and Statistics, 48(1-15).

27ECB
Working Paper Series No 1335May 2011
Blundell, R. and S.Bond (1998). ‘Initial Conditions and Moment Restrictions in Dynamic Panel
Data Models’, Journal of Econometrics, 87(2), 115–43. Borio, C. and H. Zhu (2008). ‘Capital regulation, risk-taking and monetary policy: A missing
link in the transmission mechanism?’, Bank for International Settlements Working Paper No. 268.
Borio, C. and P. Disyatat (2009). ‘Unconventional monetary policies - An appraisal’, BIS Working Paper Series No. 292.
Cohen-Cole, E., B. Duygan-Bump, J. Fillat and J. Montoriol-Garriga (2008). ‘Looking behind the aggregates: A reply to facts and myths about the financial crisis of 2008’, Federal Reserve Bank of Boston, Working Paper Series No. 5.
Danielsson, J., H. S. Shin and J. P. Zigrand (2004). ‘The impact of risk regulation on price dynamics’, Journal of Banking and Finance, 28, 1069–87.
Drehmann M., Borio C., Gambacorta L., Jimenez G. and Trucharte C. (2010). ‘Countercyclical capital buffers: Exploring Options’, BIS Working Paper No. 317.
De Bondt, G. and D. Marques-Ibanez (2005). ‘High-yield bond diffusion in the United States, the United Kingdom and the Euro Area’, Journal of Financial Services Research, 27(2), 163-81.
Del Negro, M., A. Ferrero and N. Kiyotaki (2010). ‘The Great Escape? A Quantitative Evaluation of the Fed's Non-Standard Policies’, Federal Reserve Bank of New York, mimeo, February 2010.
Dell’Ariccia, G., D. Igan and L. Laeven (2008). ‘Credit booms and lending standards: Evidence from the subprime mortgage market’, International Monetary Fund Working Paper No 08/106.
Ehrmann, M., L. Gambacorta, J. Martinez Pagés, P. Sevestre and A. Worms (2003). ‘Financial systems and the role of banks in monetary policy’, in Angeloni I., A.K. Kashyap and B. Mojon (eds.), Monetary Policy Transmission in the Euro Area, Cambridge University Press, Cambridge.
Ehrmann, M. and A. Worms (2004). ‘Bank networks and monetary policy transmission’, Journal of the European Economic Association, 2(6), 1148-71.
Friedman, B. and K.Kuttner (1993). ‘Economic Activity and the Short-Term Credit Markets: an Analysis of Prices and Quantities’, Brooking Papers on Economic Activity, 2, 193-283.
Gambacorta, L. (2005). ‘Inside the bank lending channel’, European Economic Review, 49, 1737-59.
Gambacorta, L. (2008). ‘How do banks set interest rates?’, European Economic Review, 52, 792-819.
Gambacorta, L. and P.E. Mistrulli (2004). ‘Does bank capital affect lending behavior?’, Journal of Financial Intermediation, 13(4), 436-57.
Gerali, A., S. Neri, L. Sessa and F. Signoretti (2010). ‘Credit and banking in a DSGE model of the euro area’, Journal of Money Credit and Banking,42 (6), 107-141.
Hale, G.. and J. A. C. Santos (2010). ‘Do banks propagate debt market shocks?’, Federal Reserve Bank of San Francisco Working Paper Series No 2010-08.
IMF, (2001). ‘Financial Soundness Indicators’, Policy Paper. Instefjord, N. (2005). ‘Risk and hedging: Do credit derivatives increase bank risk?’, Journal of
Banking and Finance, 29, 333-45. Ioannidou, V., S. Ongena and J.L. Peydrò (2009). ‘Monetary Policy and Subprime Lending: A
Tall Tale of Low Federal Funds Rates, Hazardous Loans, and Reduced Loans Spreads’, European Banking Center Discussion Paper, No. 2009-04S.
Ivashina, V. and D. S. Scharfstein (2008). ‘Bank lending during the financial crisis of 2008’, Mimeo, Harvard Business School.
Jappelli, T. and M. Pagano (1993). ‘Information sharing in credit markets’, Journal of Finance, 48(5), 1693-1718.

28ECBWorking Paper Series No 1335May 2011
Van den Heuvel, S. (2002). ‘Does bank capital matter for monetary transmission?’, Economic
Policy Review, Federal Reserve Bank of New York, 1-7. VanHoose, D. (2007). ‘Theories of bank behavior under capital regulation’, Journal of Banking
and Finance, 31, 3680-97.
Jappelli, T. and M. Pagano (2002). ‘Information sharing, lending and defaults: Cross-country
evidence’, Journal of Banking and Finance, 26(10), 2017-45. Jayaratne, J. and D. P. Morgan (2000). ‘Capital market frictions and deposit constraints at
banks’, Journal of Money, Credit and Banking, 32(1), 74-92. Jiménez G., S. Ongena, J.L. Peydrò-Alcalde and J. Saurina (2009a). ‘Hazardous times for
monetary policy: What do twenty-three million bank loans say about the effects of monetary policy on credit risk-taking?’, Banco de España Working Paper No. 0833.
Jimenez, G., S. Ongena, J.L. Peydró-Alcalde and J. Saurina (2009b). ‘Identifying loan supply and balance-sheet channels with loan applications’, presented at the Fourth Bank of Italy-CEPR Conference on Money, Banking and Finance: ‘Corporate Governance, Capital Structure and Firm Performance’, Rome, October 2009.
Kashyap, A.K. and J.C. Stein (1995). ‘The Impact of Monetary Policy on Bank Balance Sheets’, Carnegie Rochester Conference Series on Public Policy, 42, 151-95 .
Kashyap, A., J.C. Stein and D.Wilcox (1993). ‘Monetary Policy and Credit Conditions: Evidence from the Composition of External Finance’, American Economic Review, 83(1), 78-98.
Keys, B., T. Mukherjee, A. Seru and V. Vig (2010). ‘Did securitization lead to lax screening? Evidence from subprime loans 2001-2006’, Quarterly Journal of Economics, 125(1), January.
Kishan, R.P. and T. P. Opiela (2000). ‘Bank size, bank capital, and the bank lending channel’, Journal of Money, Credit, and Banking, 32 (1), 121-41.
Lenza, M., H. Pill and L.Reichlin (2010). ‘Monetary policy in exceptional times’, Economic Policy, 25, 295–339.
Loutskina, E. and P.E. Strahan (2006). ‘Securitization and the declining impact of bank finance on loan supply: Evidence from mortgage acceptance rates’, NBER Working Paper No 11983.
Macroeconomic Assessment Group (2010). ‘Assessing the Macroeconomic Impact of the Transition to Stronger Capital and Liquidity Requirements’, Financial Stability Board and the Basel Committee on Banking Supervision, August.
Marques-Ibanez, D. and M. Scheicher (2010). ‘Securitisation: Causes and consequences’, in Berger, A., P. Molyneux and J. Wilson (eds.), Handbook of Banking, Oxford University Press, 599-633.
Matuszyk, A. and L. Thomas (2008), ‘The evolution of credit bureaus in European countries’, Journal of Financial Transformation, 23, 135-44.
Meh, C. and K. Moran (2010). ‘The role of bank capital in the propagation of shocks’ Bank of Canada Working Paper Series No. 2008-36.
Mian, A. and A. Sufi (2008). ‘The consequences of mortgage credit expansion: Evidence from the 2007 mortgage default drisis’, NBER Working Paper No 13936.
Peek, J. and E. Rosengren (2010). ‘The role of banks in the transmission of monetary policy’, in Berger, A., P. Molyneux and J. Wilson (eds.), Handbook of Banking, Oxford University Press, 257-278.
Rajan, R. (2005). ‘Has financial development made the world riskier?’, NBER Working Paper No 11728.
Romer, C. D. and D.H. Romer (1990). ‘New evidence on the monetary transmission mechanism’, Brooking Paper on Economic Activity No. 1, 149–213.
Santos, J. A. (2009). ‘Bank Corporate Loan Pricing Following the Subprime Crisis’, mimeo. Shin, H.S. (2008). ‘Securitisation and Monetary Policy’, paper presented at the Economic
Journal Lecture at the Royal Economic Society, Warwick March 2008. Shleifer, J. A. and R. W. Vishny (2009). ‘Unstable banking’, National Bureau of Economic
Research Working Paper Series No. 14943. Sironi, A. (2003). ‘Testing for Market Discipline in the European Banking Industry: Evidence
from Subordinated Debt Issues’, Journal of Money, Credit & Banking, 35(3), 443-72.

29ECB
Working Paper Series No 1335May 2011
Table 1: Summary statistics of the variables used in the regressions a
a The sample period goes from 1999:Q1 to 2009:Q4.
Variable name
Variable description
Number of observations Mean Std. Dev. Min. Max.
Endogenous variable: Δln(loans) Lending growth rate 39,695 0.020 0.098 -1.000 0.997
Bank-specific characteristics in vector X: SIZE Log of total assets 39,626 6.985 2.162 -2.332 16.111 LIQ Liquidity ratio 34,343 0.269 0.159 0.000 1.000 CAP Capital-to-asset ratio 39,623 0.101 0.086 0.000 1.000
TIER1 Tier1 ratio 36,220 0.117 0.059 -0.567 1.000
SL/TA
Ratio between the flow of securitised lending and total assets at the end of the previous year 39,695 0.001 0.016 0.000 1.161
SEC
Dummy that takes the value of 1 if a bank is particularly active in the securitisation market (last quartile of SL/TA distribution) 39,695 0.250 0.442 0.000 1.000
EDFExpected default frequency (1- year ahead) 24,294 0.011 0.033 0.000 0.350
RISKDummy that takes the value of 1 if a bank is risky (last quartile of EDF distribution) 24,294 0.100 0.299 0.000 1.000
NII Non-interest income to total revenues 39,233 0.180 0.386 -8.088 44.722
DEP Deposit to total funding ratio 37,459 0.804 0.171 0.000 1.000
STF Share of short-term funding 39,424 0.082 0.121 0.000 1.000
Monetary policy indicator: ΔiM Quarterly change in
the overnight rate 39,571 -0.001 0.006 -0.038 0.015
NSMPNon-standard measure of monetary policy 38,529 0.002 0.012 -0.059 0.130
Other controls for institutional characteristics at the country level in vector Z:
RESCUE
Dummy that takes the value of 1 if a bank has been supported by a specific government intervention and 0 elsewhere
39,695
0.025
0.155
0.000
1.000
LOWINT
Number of quarters in which the interest rate has been below the natural rate
39,695
4.549
4.927
0.000
17.000
REGRegulatory index 39,695
10.717 1.588 4.000 12.000 SUP Supervisory strength 39,695 4.549 4.927 0.000 17.000
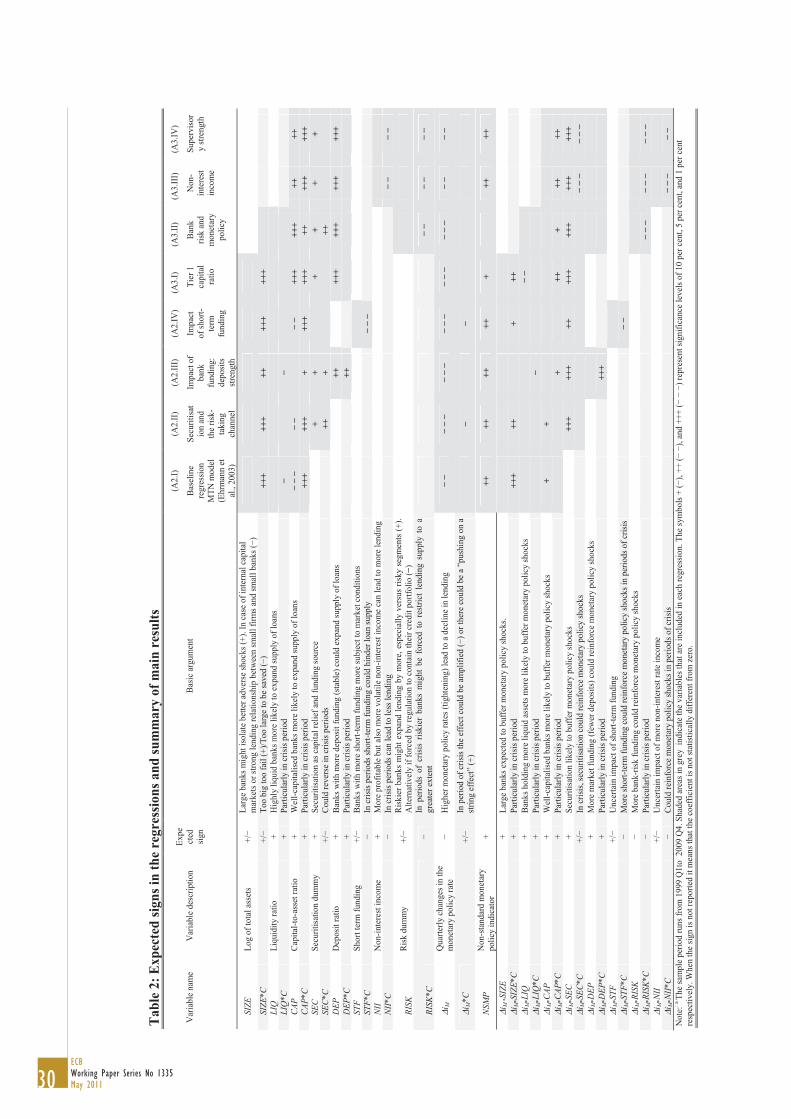
30ECBWorking Paper Series No 1335May 2011
Tabl
e 2:
Exp
ecte
d sig
ns in
the
regr
essio
ns a
nd su
mm
ary
of m
ain
resu
lts
(A2.
I) (A
2.II)
(A
2.III
) (A
2.IV
) (A
3.I)
(A
3.II)
(A
3.III
) (A
3.IV
) V
aria
ble
nam
e
V
aria
ble
desc
riptio
n
Ex
pect
ed
sign
Ba
sic a
rgum
ent
Base
line
regr
essio
n M
TN m
odel
(E
hrm
ann
et
al.,
2003
)
Secu
ritisa
tio
n an
d th
e ris
k-ta
king
ch
anne
l
Impa
ct o
f ba
nk
fund
ing:
de
posit
s str
engt
h
Impa
ct
of sh
ort-
term
fu
ndin
g
Tier
1
capi
tal
ratio
Bank
ris
k an
d m
onet
ary
polic
y
Non
-in
tere
st in
com
e
Supe
rviso
ry
stren
gth
SIZE
Lo
g of
tota
l ass
ets
+/
Larg
e ba
nks m
ight
isol
ate
bette
r adv
erse
shoc
ks (+
). In
cas
e of
inte
rnal
cap
ital
mar
kets
or st
rong
lend
ing
rela
tions
hip
betw
een
smal
l firm
s and
smal
l ban
ks (
)
SIZE
*C
+/
To
o bi
g to
o fa
il (+
)/Too
larg
e to
be
save
d (
) ++
+ ++
+ ++
++
+ ++
+
LIQ
Liqu
idity
ratio
+
Hig
hly
liqui
d ba
nks m
ore
likel
y to
exp
and
supp
ly o
f loa
ns
LIQ
*C
+ Pa
rticu
larly
in c
risis
perio
d
CA
PCa
pita
l-to-
asse
t rat
io
+ W
ell-c
apita
lised
ban
ks m
ore
likel
y to
exp
and
supp
ly o
f loa
ns
+++
+++
++
++
CAP*
C
+ Pa
rticu
larly
in c
risis
perio
d ++
+ ++
+ +
+++
+++
++
+++
+++
SEC
Secu
ritisa
tion
dum
my
+ Se
curit
isatio
n as
capi
tal r
elie
f and
fund
ing
sour
ce
+
+
+ +
+ +
SEC*
C
+/
Coul
d re
vers
e in
cris
is pe
riods
++
+
++
D
EPD
epos
it ra
tio
+ Ba
nks w
ith m
ore
depo
sit fu
ndin
g (s
tabl
e) c
ould
exp
and
supp
ly o
f loa
ns
++
++
+ ++
+ ++
+ ++
+ D
EP*C
+ Pa
rticu
larly
in c
risis
perio
d
++
STF
Shor
t ter
m fu
ndin
g +/
Ba
nks w
ith m
ore
shor
t-ter
m fu
ndin
g m
ore
subj
ect t
o m
arke
t con
ditio
ns
STF*
C
In
cris
is pe
riods
shor
t-ter
m fu
ndin
g co
uld
hind
er lo
an su
pply
NI
IN
on-in
tere
st in
com
e
+ M
ore
prof
itabl
e bu
t also
mor
e vo
latil
e no
n-in
tere
st in
com
e ca
n le
ad to
mor
e le
ndin
g
NII*
C
In
cris
is pe
riods
can
lead
to le
ss le
ndin
g
RISK
Ri
sk d
umm
y
+/
Risk
ier b
anks
mig
ht e
xpan
d le
ndin
g by
mor
e, e
spec
ially
ver
sus
risky
seg
men
ts (+
). A
ltern
ativ
ely
if fo
rced
by
regu
latio
n to
con
tain
thei
r cre
dit p
ortfo
lio (
)
RISK
*C
In p
erio
ds o
f cr
isis
riski
er b
anks
mig
ht b
e fo
rced
to
restr
ict
lend
ing
supp
ly t
o a
grea
ter e
xten
t
ΔiM
Q
uarte
rly c
hang
es in
the
mon
etar
y po
licy
rate
Hig
her m
onet
ary
polic
y ra
tes (
tight
enin
g) le
ad to
a d
eclin
e in
lend
ing
ΔiM
*C
+/
In
per
iod
of c
risis
the
effe
ct c
ould
be
ampl
ified
() o
r the
re c
ould
be
a “p
ushi
ng o
n a
strin
g ef
fect
” (+
)
NSM
PN
on-s
tand
ard
mon
etar
y po
licy
indi
cato
r +
++
++
++
++
+
++
++
ΔiM
*SI
ZE
+
Larg
e ba
nks e
xpec
ted
to b
uffe
r mon
etar
y po
licy
shoc
ks.
ΔiM
*SIZ
E*C
+
Parti
cula
rly in
cris
is pe
riod
+++
++
+
++
Δi
M*L
IQ
+ Ba
nks h
oldi
ng m
ore
liqui
d as
sets
mor
e lik
ely
to b
uffe
r mon
etar
y po
licy
shoc
ks
Δi
M*L
IQ*C
+ Pa
rticu
larly
in c
risis
perio
d
Δi
M*C
AP
+ W
ell-c
apita
lised
ban
ks m
ore
likel
y to
buf
fer m
onet
ary
polic
y sh
ocks
+
+
Δi
M*C
AP*C
+ Pa
rticu
larly
in c
risis
perio
d
+
++
+
++
++
ΔiM
*SEC
+ Se
curit
isatio
n lik
ely
to b
uffe
r mon
etar
y po
licy
shoc
ks
++
+ ++
+ ++
++
+ ++
+ ++
+ ++
+ Δi
M*S
EC*C
+/
In c
risis,
secu
ritisa
tion
coul
d re
info
rce
mon
etar
y po
licy
shoc
ks
ΔiM
*DEP
+ M
ore
mar
ket f
undi
ng (f
ewer
dep
osits
) cou
ld re
info
rce
mon
etar
y po
licy
shoc
ks
ΔiM
*DEP
*C
+
Parti
cula
rly in
cris
is pe
riod
+++
Δi
M*S
TF
+/
U
ncer
tain
impa
ct o
f sho
rt-te
rm fu
ndin
g
Δi
M*S
TF*C
M
ore
shor
t-ter
m fu
ndin
g co
uld
rein
forc
e m
onet
ary
polic
y sh
ocks
in p
erio
ds o
f cris
is
ΔiM
*RIS
K
M
ore
bank
-risk
fund
ing
coul
d re
info
rce
mon
etar
y po
licy
shoc
ks
ΔiM
*RIS
K*C
Parti
cula
rly in
cris
is pe
riod
ΔiM
*NII
+/
U
ncer
tain
impa
ct o
f mor
e no
n-in
tere
st ra
te in
com
e
Δi
M*N
II*C
Coul
d re
info
rce
mon
etar
y po
licy
shoc
ks in
per
iods
of c
risis
N
ote:
: a Th
e sa
mpl
e pe
riod
runs
from
199
9 Q
1to
200
9 Q
4. S
hade
d ar
eas i
n gr
ey i
ndic
ate
the
varia
bles
that
are
incl
uded
in e
ach
regr
essio
n. T
he sy
mbo
ls +
(),
++ (
),
and
+++
(
) r
epre
sent
sign
ifica
nce
leve
ls of
10
per c
ent,
5 pe
r cen
t, an
d 1
per c
ent
resp
ectiv
ely.
Whe
n th
e sig
n is
not r
epor
ted
it m
eans
that
the
coef
ficie
nt is
not
stat
istic
ally
diff
eren
t fro
m z
ero.

31ECB
Working Paper Series No 1335May 2011
T
able
3: A
vera
ge b
ank
feat
ures
by
coun
try
(199
9Q1-
2009
Q4)
Δln(
Loan
s)
SIZE
LI
Q
CAP
SL
/TA
EDF
NII
D
EP
STF
i MC
ount
ry
(Ann
ual
grow
th
rate
)
(USD
m
illio
ns)
(% o
f tot
al
asse
ts)
(% o
f tot
al
asse
ts)
(% o
f tot
al
asse
ts)
(1 y
ear
ahea
d)
(Per
cent
age
poin
ts)
(% o
f tot
al
liabi
litie
s)
(% o
f tot
al
liabi
litie
s)
(Per
cent
age
poin
ts)
N
umbe
r of
bank
s
W
eigh
t in
side
sa
mpl
e
Aus
tria
10.4
37
,497
32
.4
10.0
0.
000
0.55
19
.53
49.5
20
.7
2.9
11
1.1
Bel
gium
10
.1
198,
260
67.6
36
.1
0.23
0 0.
39
21.5
1 59
.5
17.1
2.
9 6
0.6
Ger
man
y 2.
4 14
9,99
9 50
.7
19.4
0.
143
0.93
38
.06
57.8
18
.0
2.9
34
3.4
Den
mar
k 5.
1 23
,403
33
.3
12.6
0.
000
0.74
23
.29
66.5
18
.6
3.3
44
4.4
Spai
n 15
.0
92,8
50
19.7
8.
4 1.
182
0.17
23
.13
62.7
19
.0
2.9
14
1.4
Finl
and
8.4
10,5
16
43.2
32
.4
0.00
2 0.
12
26.5
1 50
.6
13.3
2.
9 7
0.7
Fran
ce
3.4
129,
601
32.5
20
.7
0.00
4 0.
48
34.5
1 35
.3
25.2
2.
9 33
3.
3 U
nite
d K
ingd
om
10.7
41
9,03
6 31
.4
8.0
0.01
3 0.
52
26.3
8 61
.9
15.0
4.
8 13
1.
3 G
reec
e 18
.5
23,0
23
27.9
8.
6 0.
095
1.27
22
.30
71.2
15
.2
4.0
14
1.4
Irel
and
14.1
88
,312
24
.3
4.4
0.35
6 0.
53
17.3
2 58
.8
20.3
2.
9 4
0.4
Italy
14
.5
50,1
90
33.5
11
.3
0.43
7 0.
27
42.8
8 55
.8
20.7
2.
9 33
3.
3 N
ethe
rland
s 19
.6
174,
760
60.5
9.
1 0.
125
1.09
62
.36
76.9
25
.5
2.9
8 0.
8 Po
rtuga
l 12
.8
31,7
32
20.1
5.
1 0.
905
0.34
23
.94
61.3
16
.2
3.1
5 0.
5 Sw
eden
9.
9 15
0,92
6 29
.5
14.0
0.
016
0.12
21
.88
39.7
16
.1
3.3
5 0.
5 U
nite
d St
ates
7.
9 13
,481
25
.7
10.4
0.
118
1.28
15
.90
84.4
5.
9 3.
2 77
7 77
.1
To
tal
10.9
10
6,23
9 35
.5
14.0
0.
242
0.59
28
.00
59.4
17
.8
3.2
1008
10
0
a U
nwei
ghte
d av
erag
e ac
ross
cou
ntrie
s
Sour
ces:
Blo
ombe
rg, O
ECD
, Eur
osta
t, D
atas
tream
, Moo
dy's
KM
V, C
redi
tedg
e an
d B
IS.

32ECBWorking Paper Series No 1335May 2011
T
able
A1:
Cor
rela
tion
mat
rix
a
�
Δln(
Loan
s)
LIQ
SI
ZE
SEC
ED
F Ti
er1
NII
D
EP
STF
ΔiM
N
SPM
SU
P RE
SCU
E C
RE
G
Δln(
Loan
s)
1.00
0
LIQ
-0.0
20
1.00
0
0.00
0
SI
ZE
0.00
4 0.
140
1.00
0
0.
387
0.00
0
SEC
0.
003
0.03
6 0.
103
1.00
0
0.56
2 0.
000
0.00
0
ED
F-0
.068
-0
.024
-0
.083
-0
.005
1.
000
0.00
0 0.
000
0.00
0 0.
400
TI
ER1
0.05
7 0.
190
-0.2
40
0.00
3 -0
.099
1.
000
0.
000
0.00
0 0.
000
0.63
4 0.
000
NII
-0.0
31
0.15
5 0.
075
0.00
9 -0
.015
0.
036
1.00
0
0.
000
0.00
0 0.
000
0.08
6 0.
016
0.00
0
DEP
0.02
4 -0
.205
-0
.569
-0
.019
0.
074
0.26
3 -0
.214
1.
000
0.
000
0.00
0 0.
000
0.00
0 0.
000
0.00
0 0.
000
STF
0.01
5 0.
235
0.43
8 0.
090
-0.0
55
-0.1
40
0.13
8 -0
.754
1.
000
0.00
3 0.
000
0.00
0 0.
000
0.00
0 0.
000
0.00
0 0.
000
ΔiM
0.
065
0.02
3 -0
.004
0.
006
-0.1
06
0.02
1 0.
005
-0.0
08
0.02
0 1.
000
0.
000
0.00
0 0.
477
0.16
5 0.
000
0.00
0 0.
292
0.12
9 0.
000
NSP
M-0
.022
0.
050
0.00
9 0.
008
0.12
8 -0
.015
-0
.012
-0
.018
0.
000
-0.1
77
1.00
0
0.
000
0.00
0 0.
054
0.09
9 0.
000
0.00
5 0.
016
0.00
0 0.
986
0.00
0
SUP
0.00
7 -0
.006
0.
131
0.02
8 0.
000
-0.0
31
-0.0
25
-0.0
73
0.03
6 -0
.004
-0
.010
1.
000
0.
146
0.24
9 0.
000
0.00
0 0.
990
0.00
0 0.
000
0.00
0 0.
000
0.44
8 0.
026
RESC
UE
-0.0
35
-0.0
26
0.08
0 -0
.003
0.
144
0.00
0 -0
.002
-0
.002
-0
.019
-0
.076
0.
174
0.02
7 1.
000
0.00
0 0.
000
0.00
0 0.
554
0.00
0 0.
954
0.68
1 0.
726
0.00
0 0.
000
0.00
0 0.
000
C
-0.0
96
-0.0
54
0.03
0 -0
.006
0.
281
-0.0
35
-0.0
19
-0.0
37
-0.0
23
-0.3
50
0.31
7 0.
000
0.26
6 1.
000
0.
000
0.00
0 0.
000
0.17
5 0.
000
0.00
0 0.
000
0.00
0 0.
000
0.00
0 0.
000
0.94
4 0.
000
REG
0.02
1 -0
.206
-0
.364
-0
.011
0.
067
0.14
8 -0
.138
0.
510
-0.3
45
-0.0
67
-0.0
18
-0.2
00
0.00
6 -0
.052
1.
000
0.00
0 0.
000
0.00
0 0.
013
0.00
0 0.
000
0.00
0 0.
000
0.00
0 0.
000
0.00
0 0.
000
0.21
5 0.
000
a
The
sam
ple
perio
d go
es fr
om 1
999:
Q1
to 2
009:
Q4.
P-v
alue
s in
italic
s.
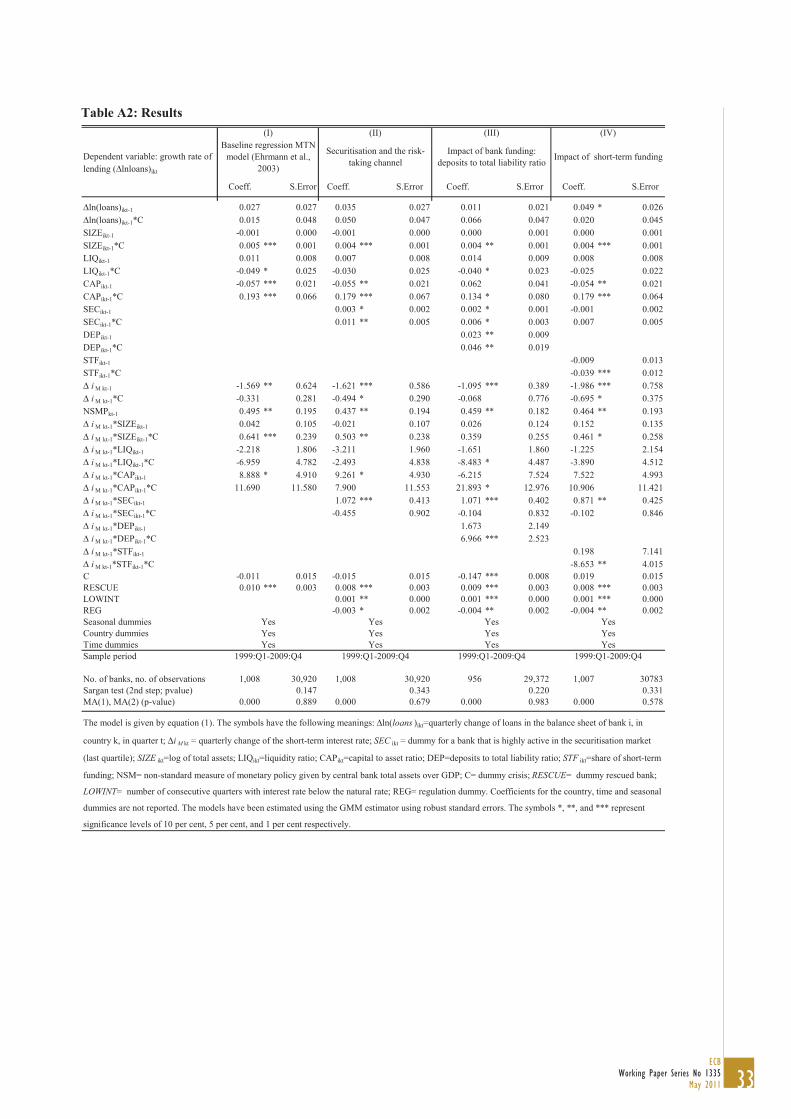
33ECB
Working Paper Series No 1335May 2011
Table A2: Results
Coeff. S.Error Coeff. S.Error Coeff. S.Error Coeff. S.Error
Δln(loans)ikt-1 0.027 0.027 0.035 0.027 0.011 0.021 0.049 * 0.026Δln(loans)ikt-1*C 0.015 0.048 0.050 0.047 0.066 0.047 0.020 0.045SIZEikt-1 -0.001 0.000 -0.001 0.000 0.000 0.001 0.000 0.001SIZEikt-1*C 0.005 *** 0.001 0.004 *** 0.001 0.004 ** 0.001 0.004 *** 0.001LIQikt-1 0.011 0.008 0.007 0.008 0.014 0.009 0.008 0.008LIQikt-1*C -0.049 * 0.025 -0.030 0.025 -0.040 * 0.023 -0.025 0.022CAPikt-1 -0.057 *** 0.021 -0.055 ** 0.021 0.062 0.041 -0.054 ** 0.021CAPikt-1*C 0.193 *** 0.066 0.179 *** 0.067 0.134 * 0.080 0.179 *** 0.064SECikt-1 0.003 * 0.002 0.002 * 0.001 -0.001 0.002SECikt-1*C 0.011 ** 0.005 0.006 * 0.003 0.007 0.005DEPikt-1 0.023 ** 0.009DEPikt-1*C 0.046 ** 0.019STFikt-1 -0.009 0.013STFikt-1*C -0.039 *** 0.012Δ i M kt-1 -1.569 ** 0.624 -1.621 *** 0.586 -1.095 *** 0.389 -1.986 *** 0.758Δ i M kt-1*C -0.331 0.281 -0.494 * 0.290 -0.068 0.776 -0.695 * 0.375NSMPkt-1 0.495 ** 0.195 0.437 ** 0.194 0.459 ** 0.182 0.464 ** 0.193Δ i M kt-1*SIZEikt-1 0.042 0.105 -0.021 0.107 0.026 0.124 0.152 0.135Δ i M kt-1*SIZEikt-1*C 0.641 *** 0.239 0.503 ** 0.238 0.359 0.255 0.461 * 0.258Δ i M kt-1*LIQikt-1 -2.218 1.806 -3.211 1.960 -1.651 1.860 -1.225 2.154Δ i M kt-1*LIQikt-1*C -6.959 4.782 -2.493 4.838 -8.483 * 4.487 -3.890 4.512Δ i M kt-1*CAPikt-1 8.888 * 4.910 9.261 * 4.930 -6.215 7.524 7.522 4.993Δ i M kt-1*CAPikt-1*C 11.690 11.580 7.900 11.553 21.893 * 12.976 10.906 11.421Δ i M kt-1*SECikt-1 1.072 *** 0.413 1.071 *** 0.402 0.871 ** 0.425Δ i M kt-1*SECikt-1*C -0.455 0.902 -0.104 0.832 -0.102 0.846Δ i M kt-1*DEPikt-1 1.673 2.149Δ i M kt-1*DEPikt-1*C 6.966 *** 2.523Δ i M kt-1*STFikt-1 0.198 7.141Δ i M kt-1*STFikt-1*C -8.653 ** 4.015C -0.011 0.015 -0.015 0.015 -0.147 *** 0.008 0.019 0.015RESCUE 0.010 *** 0.003 0.008 *** 0.003 0.009 *** 0.003 0.008 *** 0.003LOWINT 0.001 ** 0.000 0.001 *** 0.000 0.001 *** 0.000REG -0.003 * 0.002 -0.004 ** 0.002 -0.004 ** 0.002Seasonal dummiesCountry dummiesTime dummiesSample period
No. of banks, no. of observations 1,008 30,920 1,008 30,920 956 29,372 1,007 30783Sargan test (2nd step; pvalue) 0.147 0.343 0.220 0.331MA(1), MA(2) (p-value) 0.000 0.889 0.000 0.679 0.000 0.983 0.000 0.578
Yes Yes Yes Yes
(III) (IV)
Dependent variable: growth rate of lending (Δlnloans)ikt
Impact of bank funding: deposits to total liability ratio Impact of short-term funding
Baseline regression MTN model (Ehrmann et al.,
2003)
Securitisation and the risk-taking channel
(I) (II)
Yes Yes YesYes
The model is given by equation (1). The symbols have the following meanings: Δln(loans )ikt=quarterly change of loans in the balance sheet of bank i, in
country k, in quarter t; Δi M kt = quarterly change of the short-term interest rate; SEC ikt = dummy for a bank that is highly active in the securitisation market
(last quartile); SIZE ikt=log of total assets; LIQikt=liquidity ratio; CAPikt=capital to asset ratio; DEP=deposits to total liability ratio; STF ikt=share of short-term
funding; NSM= non-standard measure of monetary policy given by central bank total assets over GDP; C= dummy crisis; RESCUE= dummy rescued bank;
LOWINT= number of consecutive quarters with interest rate below the natural rate; REG= regulation dummy. Coefficients for the country, time and seasonal
dummies are not reported. The models have been estimated using the GMM estimator using robust standard errors. The symbols *, **, and *** represent
significance levels of 10 per cent, 5 per cent, and 1 per cent respectively.
1999:Q1-2009:Q41999:Q1-2009:Q4 1999:Q1-2009:Q41999:Q1-2009:Q4
Yes Yes Yes Yes

34ECBWorking Paper Series No 1335May 2011
Table A3: Results
Coeff. S.Error Coeff. S.Error Coeff. S.Error Coeff. S.Error
Δln(loans)ikt-1 0.002 0.020 0.030 0.025 0.027 0.023 0.027 0.023Δln(loans)ikt-1*C 0.105 ** 0.045 0.056 0.048 0.115 *** 0.044 0.115 *** 0.044SIZEikt-1 0.000 0.001SIZEikt-1*C 0.004 *** 0.001LIQikt-1 0.013 0.009 0.002 0.010LIQikt-1*C -0.030 0.024 -0.016 0.021TIER1ikt-1 0.095 *** 0.029 0.088 *** 0.032 0.067 ** 0.028 0.067 ** 0.028TIER1ikt-1*C 0.196 *** 0.067 0.206 ** 0.099 0.208 *** 0.068 0.207 *** 0.068SECikt-1 0.003 * 0.002 0.004 * 0.002 0.003 * 0.002 0.003 * 0.002SECikt-1*C 0.005 0.005 0.009 ** 0.005 0.005 0.004 0.005 0.004DEPikt-1 0.038 *** 0.012 0.044 *** 0.012 0.056 *** 0.010 0.056 *** 0.010DEPikt-1*C -0.005 0.024 -0.023 0.018 -0.024 0.015 -0.024 0.015RISKikt-1 -0.005 0.004 -0.004 0.004 -0.004 0.004RISKikt-1*C -0.026 ** 0.012 -0.019 ** 0.009 -0.019 ** 0.009NIIikt-1 -0.013 0.019 -0.013 0.019NIIikt-1*C -0.047 ** 0.020 -0.046 ** 0.020Δ i M kt-1 -1.476 *** 0.456 -1.733 *** 0.644 -1.330 ** 0.653 -1.273 ** 0.645Δ i M kt-1*C -1.087 0.757 -0.366 0.839 -0.189 0.824 -0.273 0.800NSMPkt-1 0.278 * 0.161 0.256 0.227 0.240 ** 0.117 0.237 ** 0.117Δ i M kt-1*SIZEikt-1 -0.071 0.116Δ i M kt-1*SIZEikt-1*C 0.567 ** 0.248Δ i M kt-1*LIQikt-1 -3.946 ** 1.960 -1.232 2.026Δ i M kt-1*LIQikt-1*C -3.642 4.224 -3.925 3.744Δ i M kt-1*TIER1ikt-1 4.743 5.794 3.406 5.334 -1.698 5.210 -1.827 5.209Δ i M kt-1*TIER1ikt-1*C 20.354 ** 8.820 23.628 * 12.238 22.632 ** 9.604 22.580 ** 9.594Δ i M kt-1*SECikt-1 1.133 *** 0.384 1.611 *** 0.448 1.866 *** 0.424 1.872 *** 0.425Δ i M kt-1*SECikt-1*C -0.718 0.696 -0.506 0.663 -2.082 *** 0.607 -2.078 *** 0.606Δ i M kt-1*DEPikt-1 -3.225 3.163 -2.730 3.619 2.183 3.497 2.248 3.483Δ i M kt-1*DEPikt-1*C 1.752 4.733 1.090 4.125 -1.673 3.935 -1.826 3.875Δ iM kt-1*RISKikt-1 -1.386 1.107 -0.989 1.091 -0.999 1.090Δ iM kt-1*RISKikt-1*C -2.369 *** 0.836 -1.922 *** 0.516 -1.935 *** 0.514Δ i M kt-1*NIIikt-1 4.413 4.051 4.429 4.057Δ i M kt-1*NIIikt-1*C -3.414 *** 1.266 -3.150 *** 1.214C -0.156 *** 0.017 -0.018 0.022 -0.173 *** 0.010 -0.172 *** 0.009RESCUE 0.007 *** 0.003 0.005 * 0.003 0.004 0.003 0.004 0.003LOWINT 0.001 *** 0.000 0.001 *** 0.000 0.002 *** 0.000 0.002 *** 0.000REG -0.002 0.002 -0.005 ** 0.002 -0.004 ** 0.002 -0.003 * 0.002SUP 0.002 0.002Seasonal dummiesCountry dummiesTime dummiesSample period
No. of banks, no. of observations 924 27,656 737 18,619 737 19,458 737 19,458Sargan test (2nd step; pvalue) 0.195 0.340 0.103 0.124MA(1), MA(2) (p-value) 0.000 0.906 0.000 0.817 0.000 0.435 0.000 0.439
Yes Yes YesYes Yes Yes Yes
The model is given by equation (1). The symbols have the following meanings: Δln(loans )ikt=quarterly change of loans in the balance sheet of
bank i, in country k, in quarter t; Δi M kt = quarterly change of the short-term interest rate; SEC ikt = dummy for a bank that is highly active in the
securitisation market (last quartile); SIZE ikt=log of total assets; LIQikt=liquidity ratio; TIER1ikt= TIER1ratio; DEP=deposits to total liability
ratio; NSM= non-standard measure of monetary policy given by central bank total assets over GDP; RISK ikt =dummy that takes the value of 1
if a bank has its expected default frequency (EDF) in the last decile of the distribution; C= dummy crisis; RESCUE= dummy rescued bank; LOWINT= number of consecutive quarters with interest rate below the natural rate; REG= regulation dummy; SUP= supervision strenght dummy. Coefficients for the country, time and seasonal dummies are not reported. The models have been estimated using the GMM estimator using robust standard errors. The symbols *, **, and *** represent significance levels of 10 per cent, 5 per cent, and 1 per cent respectively.
Yes Yes Yes Yes
1999:Q1-2009:Q4 1999:Q1-2009:Q4 1999:Q1-2009:Q4 1999:Q1-2009:Q4
Yes
(III) (IV)
Dependent variable: growth rate of lending (Δlnloans)ikt
Non-interest income Supervisory strengthTier1 capital ratio Bank risk and monetary policy
(I) (II)
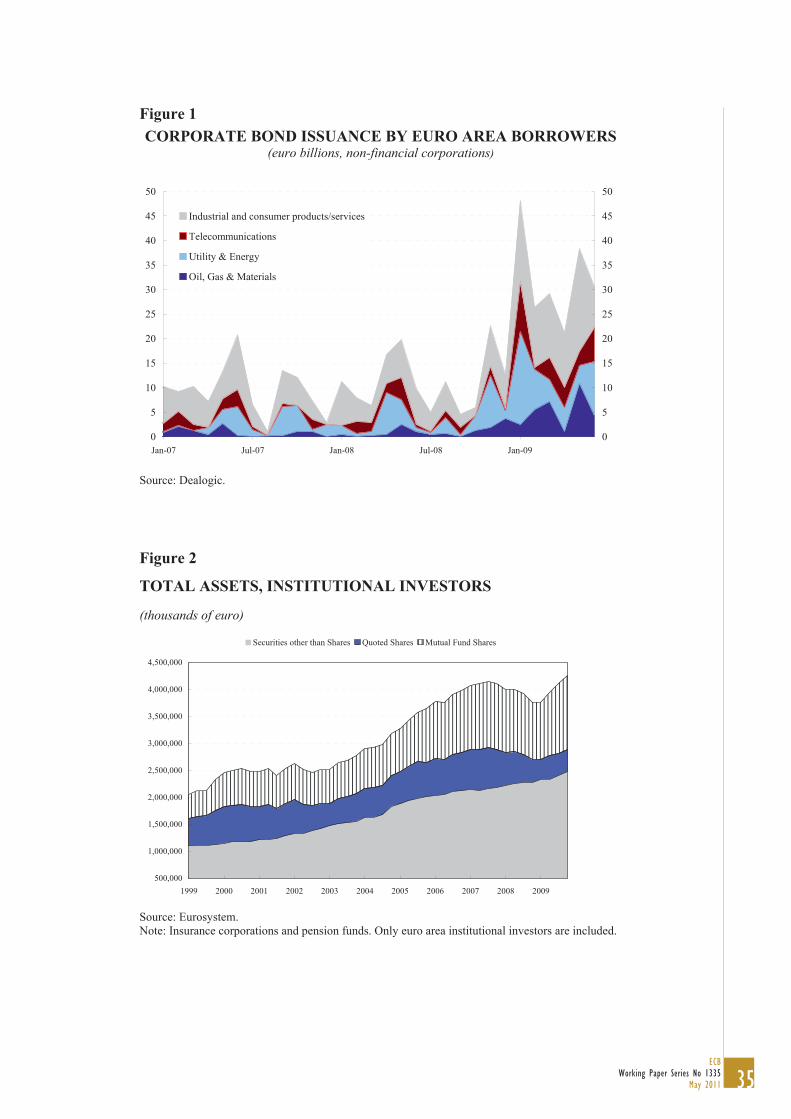
35ECB
Working Paper Series No 1335May 2011
Figure 1 CORPORATE BOND ISSUANCE BY EURO AREA BORROWERS
(euro billions, non-financial corporations)
0
5
10
15
20
25
30
35
40
45
50
Jan-07 Jul-07 Jan-08 Jul-08 Jan-090
5
10
15
20
25
30
35
40
45
50
Industrial and consumer products/services
Telecommunications
Utility & Energy
Oil, Gas & Materials
Source: Dealogic.
Figure 2
TOTAL ASSETS, INSTITUTIONAL INVESTORS
(thousands of euro)
500,000
1,000,000
1,500,000
2,000,000
2,500,000
3,000,000
3,500,000
4,000,000
4,500,000
1999 2000 2001 2002 2003 2004 2005 2006 2007 2008 2009
Securities other than Shares Quoted Shares Mutual Fund Shares
Source: Eurosystem. Note: Insurance corporations and pension funds. Only euro area institutional investors are included.

36ECBWorking Paper Series No 1335May 2011
Figure 3
DEPOSITS TO TOTAL LIABILITIES RATIO
0.7
0.8
0.9
1
1998 2000 2001 2002 2003 2004 2005 2006 2007 2008 2009
First quartile
Median
Fourth quartile
Source: Authors’ own estimates.
Figure 4
TOTAL AND RETAINED SECURITISATION IN THE EURO AREA (3 months moving average, millions of euros)
0
20,000
40,000
60,000
80,000
100,000
120,000
140,000
2001
Q1
2001
Q2
2001
Q3
2001
Q4
2002
Q1
2002
Q2
2002
Q3
2002
Q4
2003
Q1
2003
Q2
2003
Q3
2003
Q4
2004
Q1
2004
Q2
2004
Q3
2004
Q4
2005
Q1
2005
Q2
2005
Q3
2005
Q4
2006
Q1
2006
Q2
2006
Q3
2006
Q4
2007
Q1
2007
Q2
2007
Q3
2007
Q4
2008
Q1
2008
Q2
2008
Q3
2008
Q4
2009
Q1
2009
Q2
2009
Q3
2001 2002 2003 2004 2005 2006 2007 2008 2009
Source: Dealogic. Only funded securitisation by euro area originators is included. Total securitization is indicated by the continuous line; retained securitization is represented by the dotted line.
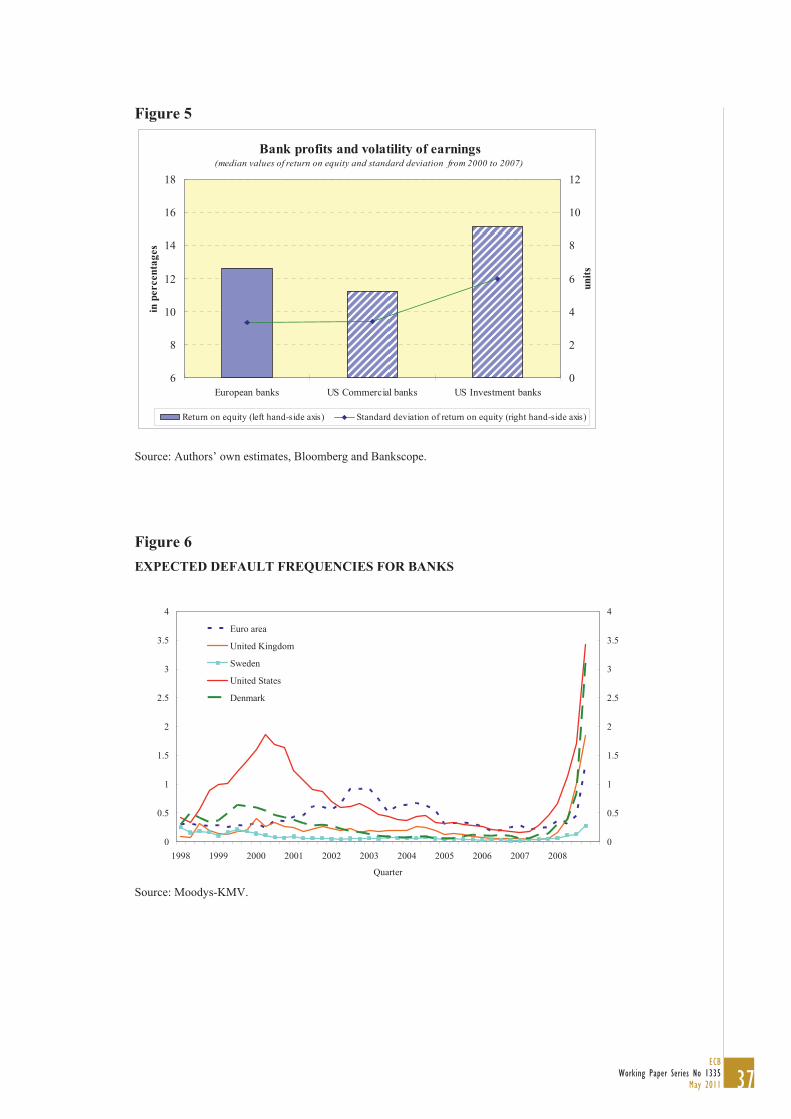
37ECB
Working Paper Series No 1335May 2011
Figure 5
Source: Authors’ own estimates, Bloomberg and Bankscope.
Figure 6 EXPECTED DEFAULT FREQUENCIES FOR BANKS
0
0.5
1
1.5
2
2.5
3
3.5
4
1998 1999 2000 2001 2002 2003 2004 2005 2006 2007 2008
Quarter
0
0.5
1
1.5
2
2.5
3
3.5
4
Euro area
United Kingdom
Sweden
United States
Denmark
Source: Moodys-KMV.
Bank profits and volatility of earnings
(median values of return on equity and standard deviation from 2000 to 2007)
6
8
10
12
14
16
18
European banks US Commercial banks US Investment banks
in p
erce
ntag
es
0
2
4
6
8
10
12
units
Return on equity (left hand-side axis) Standard deviation of return on equity (right hand-side axis)

38ECBWorking Paper Series No 1335May 2011
Figure 7
OVERNIGHT RATE
0
1
2
3
4
5
6
7
8
9
1999 2000 2001 2002 2003 2004 2005 2006 2007 2008 2009 2010
Denmark
Sweden
Euro area
United States
United Kingdom
Source: Reuters.
Figure 8
CENTRAL BANK TOTAL ASSETS OVER GDP
0.00
0.05
0.10
0.15
0.20
0.25
0.30
0.35
1999 2000 2001 2002 2003 2004 2005 2006 2007 2008 2009
DenmarkSwedenEuro areaUnited StatesUnited Kingdom
Source: Datastream and national sources.

Work ing PaPer Ser i e Sno 1118 / november 2009
DiScretionary FiScal PolicieS over the cycle
neW eviDence baSeD on the eScb DiSaggregateD aPProach
by Luca Agnello and Jacopo Cimadomo