the balancing act: using the mission-money matrix · the balancing act: using the mission-money...
TRANSCRIPT

The Balancing Act: Using the Mission-Money Matrix
Kate Barr, Nonprofits Assistance Fund TrixieAnn Golberg, Lifetrack Resources
Patti Cullen, Care Providers of Minnesota

Who We Are
Nonprofits Assistance Fund’s mission is to build financially healthy nonprofits that foster community vitality.
Our financial experts help nonprofits strengthen their capacity to address unexpected events, finance new opportunities, and realize strategic goals. We fulfill our mission by helping you thrive. Find out more at www.nonprofitsassistancefund.org.
Sustainable business models are responsive to the internal and external demands, opportunities, and environment and accommodate the interdependence of the components Financial, programmatic, and organizational sustainability
Sustainability

Business Model
Revenue Mix Cost of Effective Programs
Infrastructure Capital Structure
Mission/Business Model

The Balancing Act
Financial sustainability • The ability to generate resources to meet the needs of
the present without compromising the future Programmatic sustainability • The ability to develop, mature, and cycle out programs
to be responsive to constituencies over time Organizational sustainability • The ability to build, adapt and refresh organizational
capacity and leadership that is both relevant and responsive
[Jeanne Bell +]

The Matrix Map
A tangible, visual tool to foster understanding, discussion, and strategic decisions to build a sustainable business model
Identify business
lines
Calculate financial results
Evaluate mission merit
Plot on matrix
Facilitate strategy
discussion

Financial Sustainability
Financial Sustainability
Net financial results: Related income – All direct & indirect costs Net loss Net surplus

Financial Sustainability
Financial Literacy
Legal Services
Grants and contributions 47,000 35,000
Program fees 4,000 18,000
Total Income 51,000 53,000
Personnel 37,000 26,000
Rent and office 5,000 4,000
Other expenses 12,000 7,000
Total direct expenses 54,000 37,000
Indirect distribution 9,000 6,000
Total expenses 63,000 43,000
Surplus/Deficit (12,000) 10,000
Programmatic Sustainability
Relative value of business line/program area Answers the questions: What programs/activities must we do? What programs/activities do not add enough value? Requires more than “meets our mission”

Evaluating Mission Merit
Relative value of business line/program area 1. Aligns with mission 2. Excellence in execution 3. Scale or volume/reach 4. Depth of impact 5. Fills an important gap 6. Community building value 7. Leverage of other programs Create a rating process with appropriate input
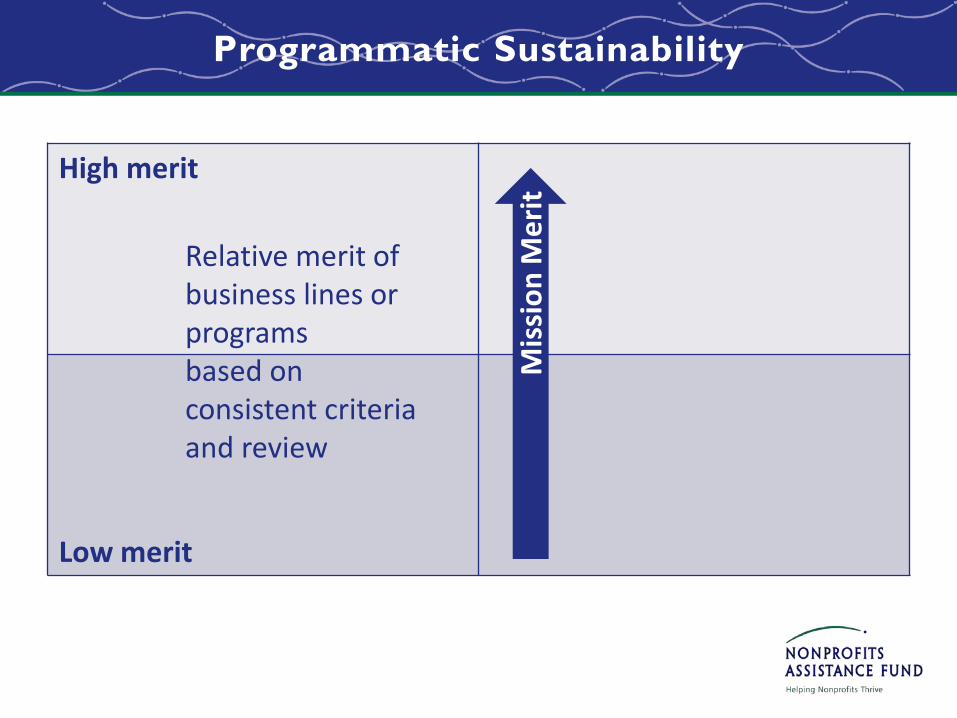
Programmatic Sustainability
High merit
Low merit
Mis
sion
Mer
it
Relative merit of business lines or programs based on consistent criteria and review
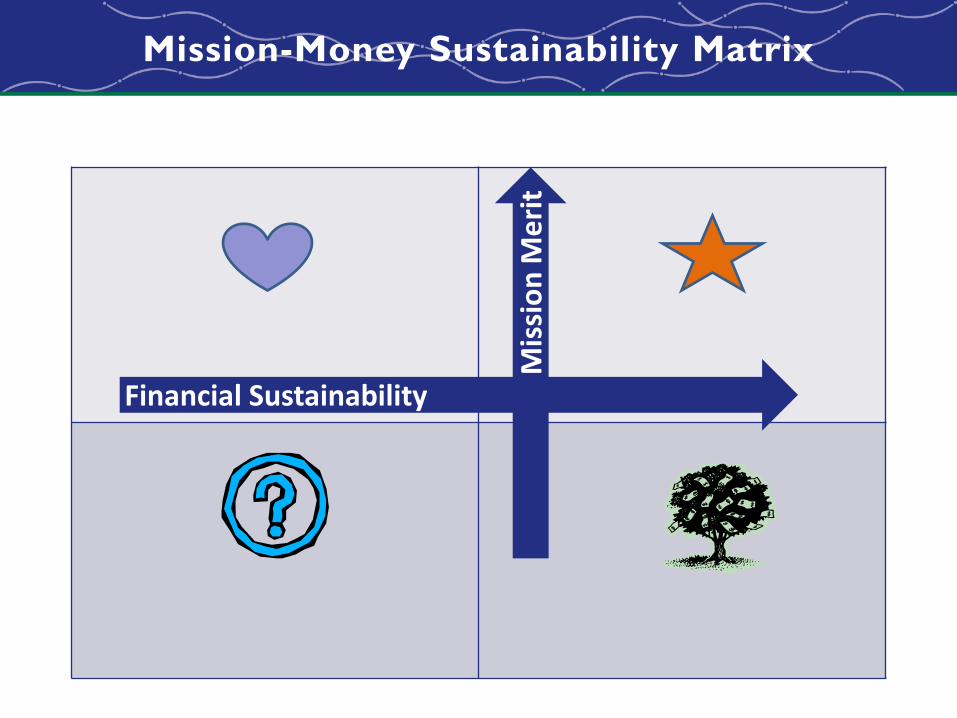
Mission-Money Sustainability Matrix
Financial Sustainability
Mis
sion
Mer
it

Mission-Money Matrix Map
Financial Literacy
Legal services
Annual walkathon
Financial Sustainability
Mis
sion
Mer
it
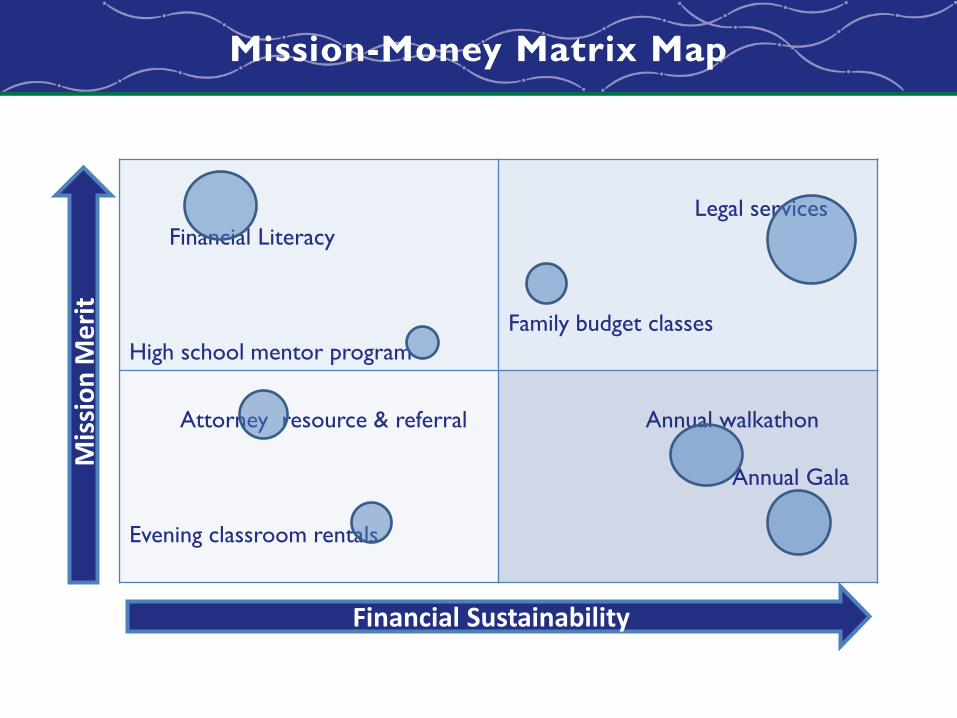
Mission-Money Matrix Map
Financial Literacy High school mentor program
Legal services Family budget classes
Attorney resource & referral Evening classroom rentals
Annual walkathon Annual Gala
Financial Sustainability
Mis
sion
Mer
it
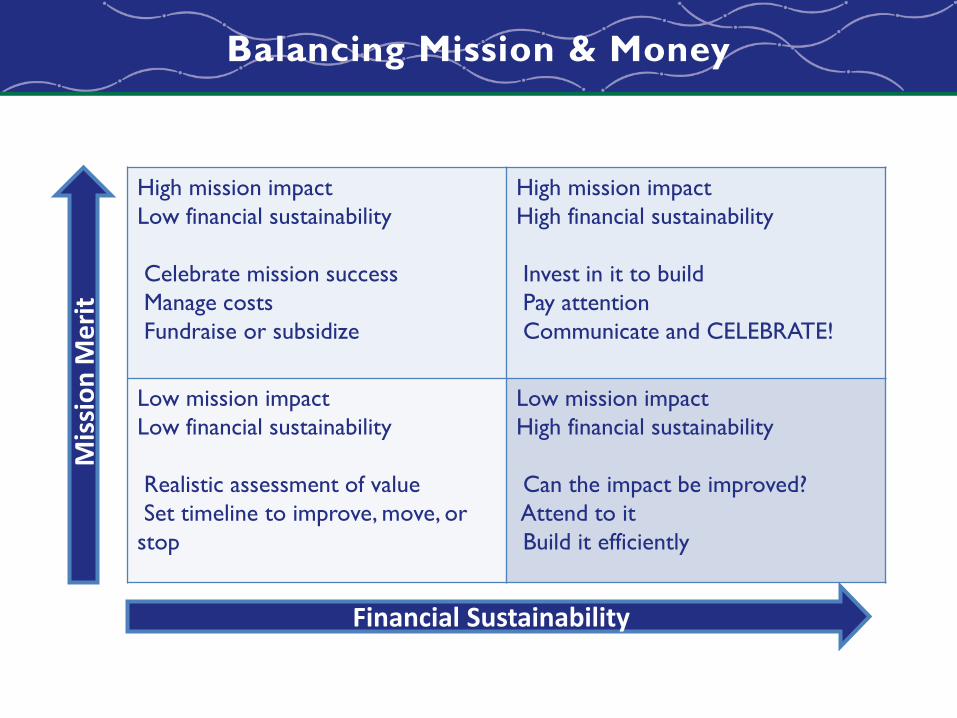
Balancing Mission & Money
High mission impact Low financial sustainability Celebrate mission success Manage costs Fundraise or subsidize
High mission impact High financial sustainability Invest in it to build Pay attention Communicate and CELEBRATE!
Low mission impact Low financial sustainability Realistic assessment of value Set timeline to improve, move, or stop
Low mission impact High financial sustainability Can the impact be improved? Attend to it Build it efficiently
Financial Sustainability
Mis
sion
Mer
it

Matrix Map
• Would a mission-money
matrix map be useful? • What is your readiness to
develop a matrix? • What mission criterea are
important? • Who would lead the
process? • What strategic decisions
would be influenced with a matrix map?
Financial Sustainability Mis
sion
Mer
it
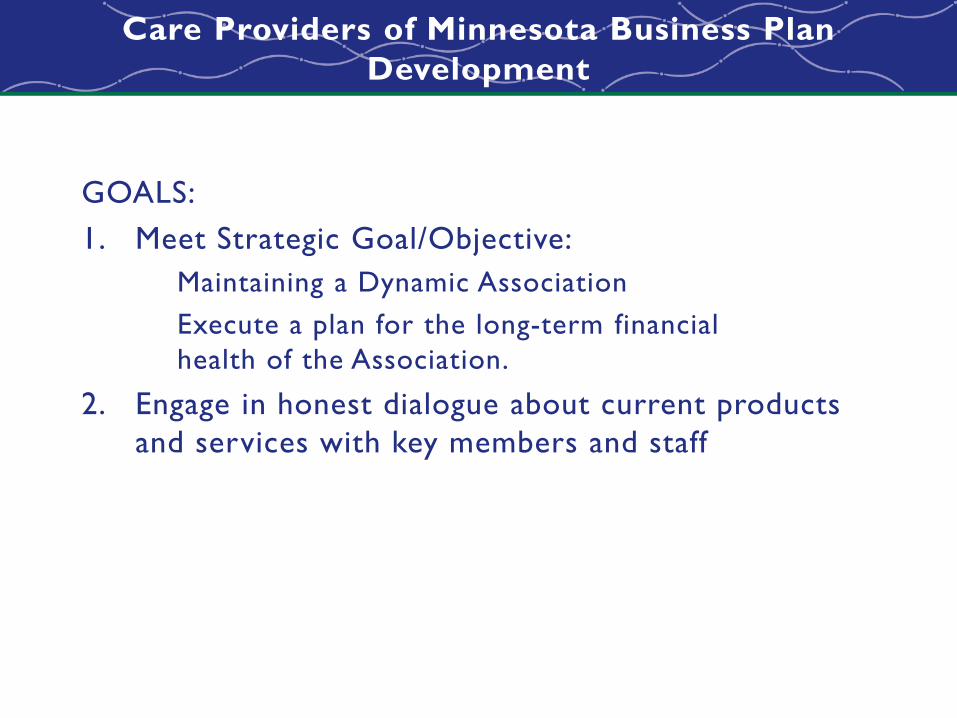
Care Providers of Minnesota Business Plan Development
GOALS: 1. Meet Strategic Goal/Objective:
Maintaining a Dynamic Association Execute a plan for the long-term financial health of the Association.
2. Engage in honest dialogue about current products and services with key members and staff
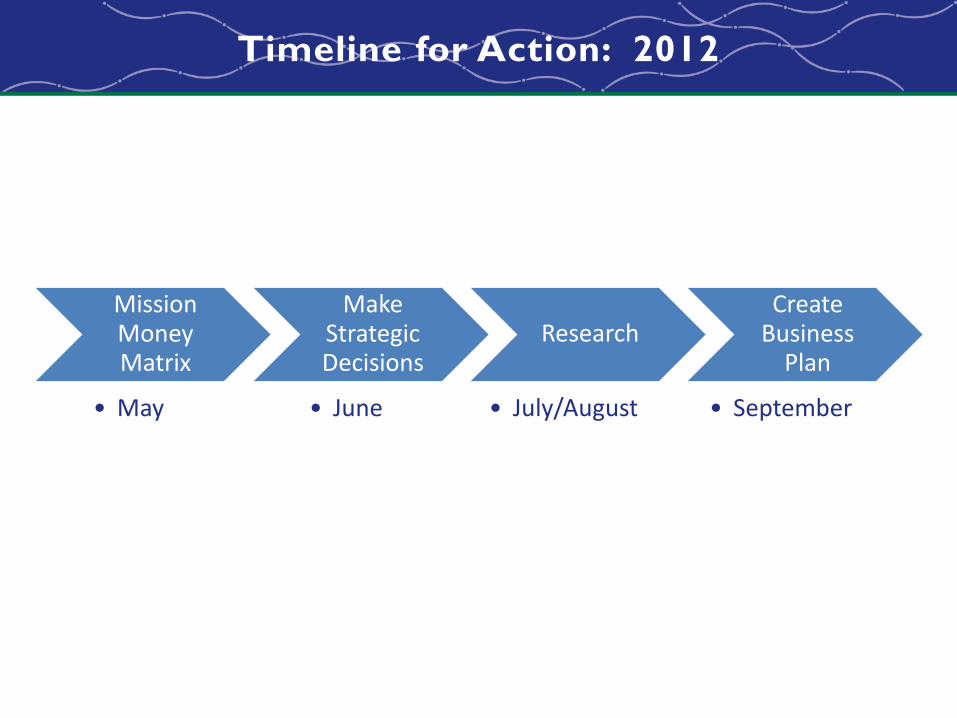
Timeline for Action: 2012
Mission Money Matrix
• May
Make Strategic Decisions
• June
Research
• July/August
Create Business
Plan
• September
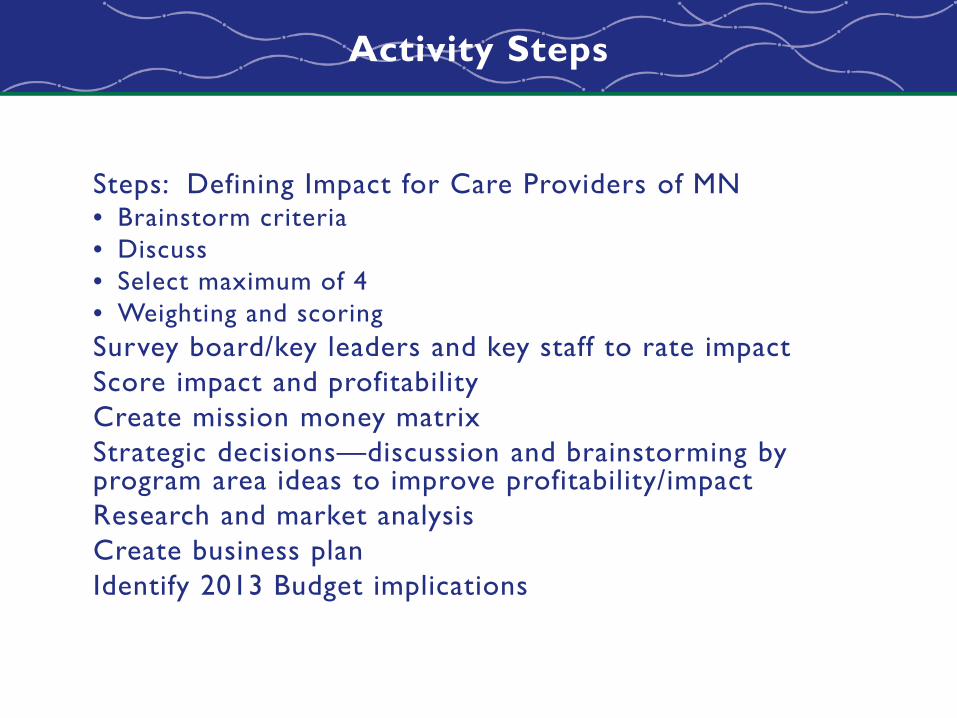
Activity Steps
Steps: Defining Impact for Care Providers of MN • Brainstorm criteria • Discuss • Select maximum of 4 • Weighting and scoring
Survey board/key leaders and key staff to rate impact Score impact and profitability Create mission money matrix Strategic decisions—discussion and brainstorming by program area ideas to improve profitability/impact
Research and market analysis Create business plan Identify 2013 Budget implications

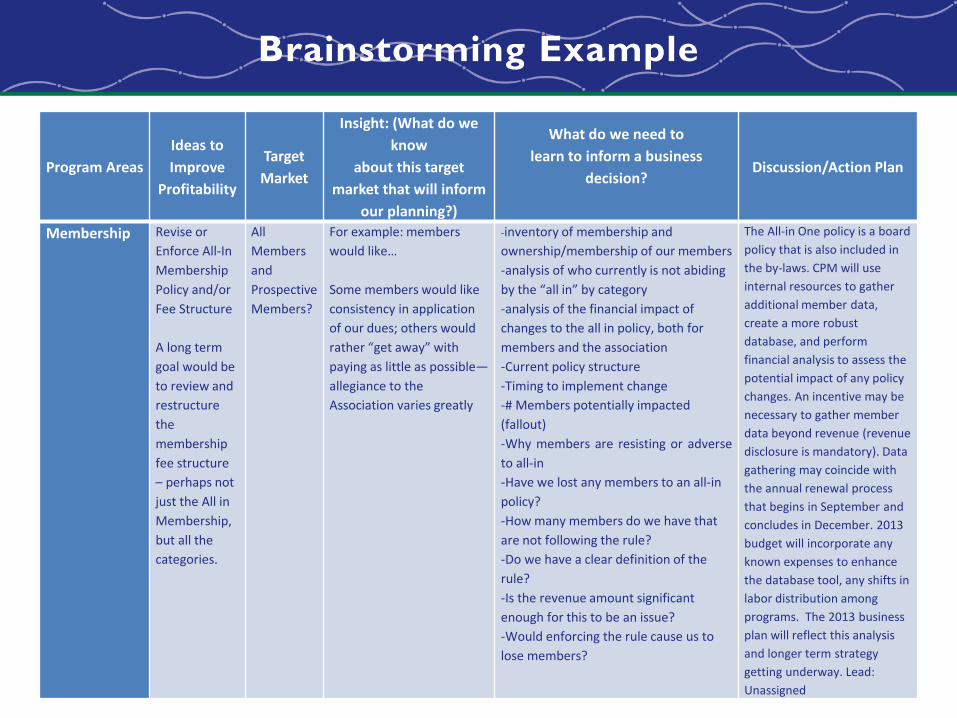
Brainstorming Example
Program Areas Ideas to Improve
Profitability
Target Market
Insight: (What do we know
about this target market that will inform
our planning?)
What do we need to learn to inform a business
decision?
Discussion/Action Plan
Membership Revise or Enforce All-In Membership Policy and/or Fee Structure A long term goal would be to review and restructure the membership fee structure – perhaps not just the All in Membership, but all the categories.
All Members and Prospective Members?
For example: members would like… Some members would like consistency in application of our dues; others would rather “get away” with paying as little as possible—allegiance to the Association varies greatly
-inventory of membership and ownership/membership of our members -analysis of who currently is not abiding by the “all in” by category -analysis of the financial impact of changes to the all in policy, both for members and the association -Current policy structure -Timing to implement change -# Members potentially impacted (fallout) -Why members are resisting or adverse to all-in -Have we lost any members to an all-in policy? -How many members do we have that are not following the rule? -Do we have a clear definition of the rule? -Is the revenue amount significant enough for this to be an issue? -Would enforcing the rule cause us to lose members?
The All-in One policy is a board policy that is also included in the by-laws. CPM will use internal resources to gather additional member data, create a more robust database, and perform financial analysis to assess the potential impact of any policy changes. An incentive may be necessary to gather member data beyond revenue (revenue disclosure is mandatory). Data gathering may coincide with the annual renewal process that begins in September and concludes in December. 2013 budget will incorporate any known expenses to enhance the database tool, any shifts in labor distribution among programs. The 2013 business plan will reflect this analysis and longer term strategy getting underway. Lead: Unassigned

Sample: summary of action steps
Near-term Action Target Date Responsibility-Lead
Gather additional data about the businesses operated by members.
January 31, 2013 Todd Bergstrom
Enhance database systems as necessary.
February 28, 2013 Todd Bergstrom
Perform financial analysis on impact of fee structure changes.
March 2013 Joe Cavanaugh
Conduct interviews with existing members operating these lines of business to better understand their home care and palliative care service needs.
April 2013 Patti Cullen
Explore opportunities with prospective members operating home care and palliative care.
August 2013 Patti Cullen
Develop inventory of companies offering these personal technology products/services and develop strategy for promotion of associate membership
April 1, 2013 Cyndi Cavanaugh
Create an inventory of existing business partners and the various ways we receive revenue from them.
November 1, 2012
Doug Beardsley
Lifetrack Resources
Strategic Planning: Understanding Financial
Sustainability “Mission-Money Matrix”

Objective: Adopt a Strategic Plan that develops and pursues Lifetrack Resources’ Vision for 2013-2015 that… • Maximizes Lifetrack’s competencies to develop the strengths
within children, families and adults facing the greatest life challenges.
• Grows Lifetrack’s brand and innovative work
• Is financially sustainable
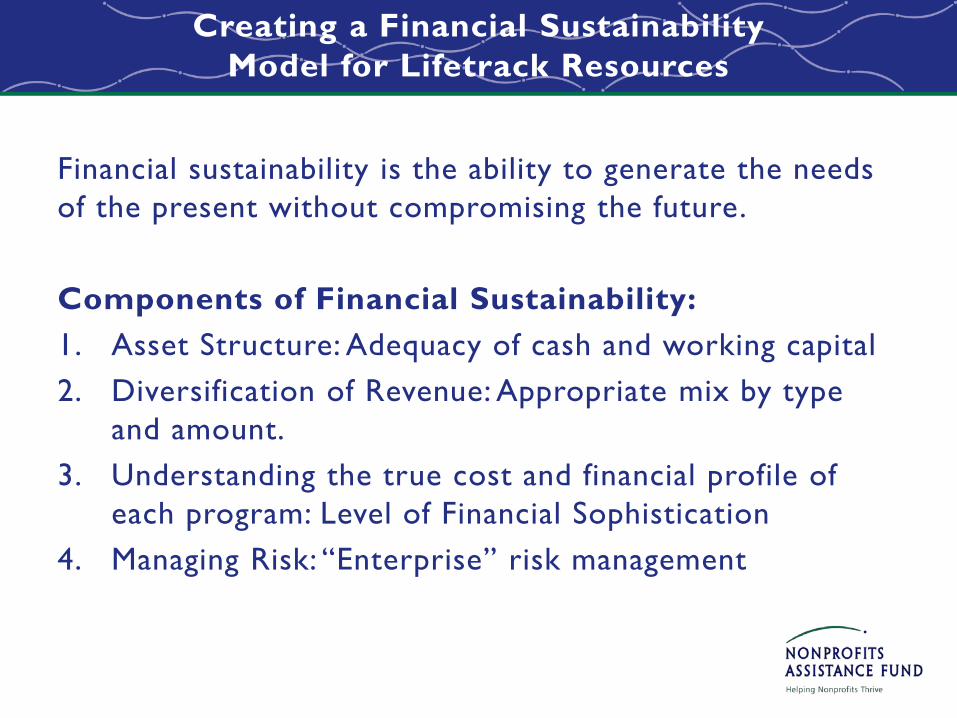
Creating a Financial Sustainability
Model for Lifetrack Resources
Financial sustainability is the ability to generate the needs of the present without compromising the future. Components of Financial Sustainability: 1. Asset Structure: Adequacy of cash and working capital 2. Diversification of Revenue: Appropriate mix by type
and amount. 3. Understanding the true cost and financial profile of
each program: Level of Financial Sophistication 4. Managing Risk: “Enterprise” risk management

Lifetrack’s Financial Sustainability
Lifetrack’s Asset Structure is complex, strong, improving, and facing new challenges. Efforts are needed to become more sophisticated in our use of financing options and investment in efforts to increase and sustain a new level of earned and contributed income. Lifetrack’s Diversification of Revenue benefits from the diversity of program strategies within and across EEO and CFHD. Two earned income strategies have also contributed to diversification. The mix of program and earned income strategies have resulted in a diversity of funder types and sources, although most current funders have narrow and narrowing interests and general or discretionary funds are minimal. Lifetrack’s level of financial sophistication (understanding our true costs and financial profile) is on a learning curve. This has benefited from the contingency planning process. Maintaining a reliable, consistent database is a concern. Lifetrack’s ability to Manage Risk is much improved due to lower risk levels and decreased concentration of grants, contingency planning process and adherence to CARF standards and other best practices in financial and organizational management. Lack of diversification and ability to drive new revenue development is a weakness to managing risks as funding volatil ity increases in all funder sectors.

Lifetrack’s Financial Sustainability
• Sustainability is an orientation not a destination, we will never arrive at a static mix of permanent programs and revenue streams but financial sustainability implications must be part of each program and financial consideration.
• Maintaining a program portfolio capable of leveraging differing and diverse revenue sources and funders provides greater long term stability but will contribute to short term volatility.
• Investment and specific expertise is needed to generate any new or increased income whether contributions, grant or earned income.
• Financing of new programs should be based on a return on investment analysis. Financing of new opportunities is different than deficit funding to manage funding shortfalls which provide unlikely opportunities for a return.

Applying The Matrix Map to Financial Strategies
The Matrix Map includes the following categories:
• Money Tree: These programs would be required to maintain profitability fully covering all costs while allowing for some ongoing investment to maintain their profitability. (Low Mission/High Margin)
• Heart : These programs would be required to demonstrate increased efficiency and cost control while maximizing their ability to meet their own direct and re-investment costs. (High Mission/Low Margin)

The Matrix Map
• Star: These programs would be required to cover current and re-investment costs, while receiving significant organizational attention and support. (High Mission/High Margin)
• Stop: For these programs, Lifetrack would build into its
planning and management process, protocol for eliminating programs that are not successful in covering their current costs and do not warrant the investment of a heart or star program. (Low Mission/Low Margin) Stop programs analyzed against a set of questions.

Consideration of Programs to Stop
• Did the program strategy’s revenue cover it’s direct expenditures? • If the program strategy was discontinued will it reduce common or
administrative costs? • Is the program strategy a “loss leader” that brings in other profitable
programs? • Is the program important to one important funding source? • Is the program strategy a place holder that we need to be able to have
future opportunities in this or other program strategies? • Does it help us connect with a needed geography or demographic? • Have we failed to provide the marketing support or adequate time for
clients or funders to “find” the program? • Can we just raise more $ for it? Is there a funder we have been
overlooking or has been a low priority in our grant writing? • What would make the program a Heart, Star or Money-Tree? Is it an
investment we would want to make verses those programs already in those categories?

• If the Program Matrix is to be applied as a key concept for implementing a financial sustainability business model, Lifetrack’s financial planning and management procedures need to be aligned to support and achieve the FS goals.
• Lifetrack’s Financial Sustainability requires clarity on the financial environment and revenue compatibilities of its Program Strategies.
• Lifetrack’s current financial or business model is constructed around the
two strategic focus areas: EEO and CFHD. • Lifetrack’s Program Strategies are evaluated against 4 categories -
ranging from High Mission and High Margin to Low Mission and Low Margin. These categories inform the revenue, growth and sustainability strategies to be deployed.


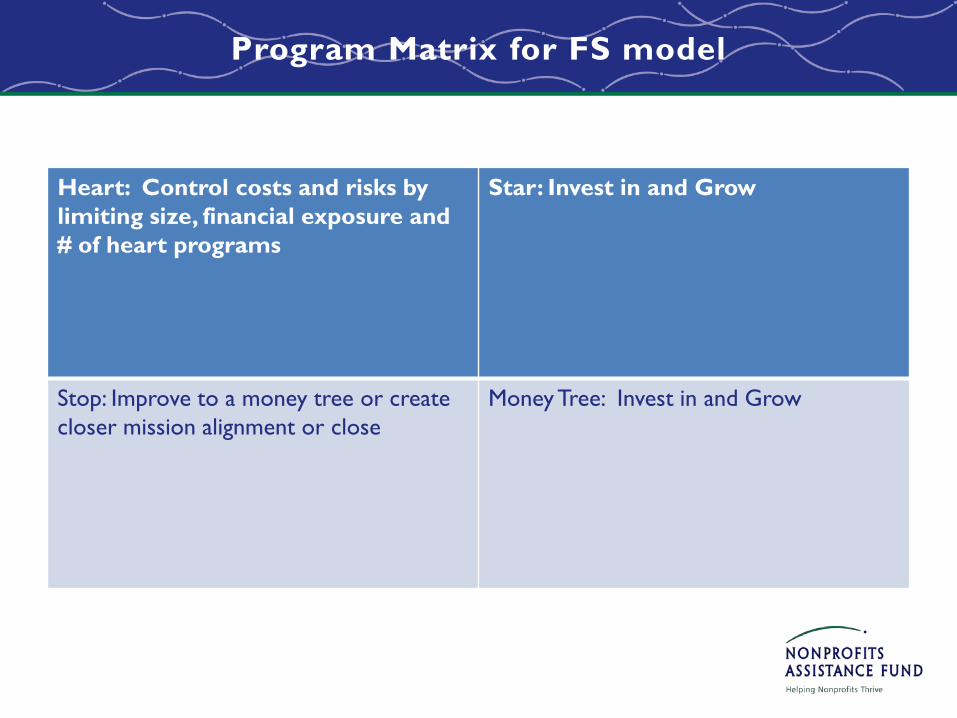
Program Matrix for FS model
Heart: Control costs and risks by limiting size, financial exposure and # of heart programs
Star: Invest in and Grow
Stop: Improve to a money tree or create closer mission alignment or close
Money Tree: Invest in and Grow
Tactics to move Lifetrack along the path toward the FS model
• Blending the Program Matrix
• Revenue Generation
• Customized Financial Sustainability Strategies

Financial Sustainability Dashboard
Asset Structure: How resources are held • Seek to maintain cash balance of 90 days operating expenses.
• Seek to grow the value of invested assets to represent at least 20% of total assets.
• Seek to protect the value of fixed assets with decisions to increase capital assets based on the organization’s ability to observe the initial expense and ongoing expenses to maintain the asset.
• Maintain a minimum of 45 days Unrestricted Liquid Net Assets (ULNA) which represents the portion of unrestricted net assets exclusive of any equity in land, buildings, and equipment (ownership net of associated debt.) ULNA includes a combination of cash, investments, receivables, and prepaid expenses less all liabilities not related to fixed assets.

Financial Sustainability Dashboard
Revenue Diversification: Access to resources • Total revenue and annual growth – cumulative consistent growth to expand service
capacity by increasing contributed and earned income. • Contributed Income: Designated (Private Sources) – Contributed income designated by the
donor or grant maker must be of adequate value to allow for designation to be honored without requiring Lifetrack to dedicate funds not intended for that purpose.
• Contributed Income: Undesignated (Private Sources) - Undesignated funds will be utilized to fund allocated/shared costs and/or new program investments which leverage future funding.
• Earned Income - Program’s util izing fee and/or sales income must establish rates adequate for covering all costs, positively contributing to Lifetrack’s discretionary or general funds and allowing for investment in growth
• Contracted Income (Public sources)- Contracts for services or programming cover all costs and positively contribute positively to Lifetrack’s Net Income.
• Investment Income – Care should be used in decisions related to use of investment income to ensure fund contributes to program growth and innovation versus funding budget deficits or cost overruns
• New program development – demonstrate competitiveness and ability to connect with evolving community needs.
• Public Support Ratio – Represents ability to secure funding from diverse sources and remain within the IRS standard of 33.34%.

Financial Sustainability Dashboard
Financial Profile: Use of Resources • Budget to invest in revenue growth strategies that position Lifetrack
to increase program capacity. • Program funding proposals and contracts reflect financial
sustainability expectations. • Prioritize administrative expenditures to stay within nonprofit
standards while allowing for investment in capacity for program growth and revenue development.
• Development revenue goals and expenditures will be consistent with nonprofit standards and reflect goals for program growth, reinvestment and diversification of contributed income.
• Maintain buildings for both program operations and retained functional and financial value.
Managing Risk: Protecting Resources • Enterprise risk management plan.

Lifetrack Resources
Strategic Planning: Understanding Financial
Sustainability “Mission-Money Matrix”
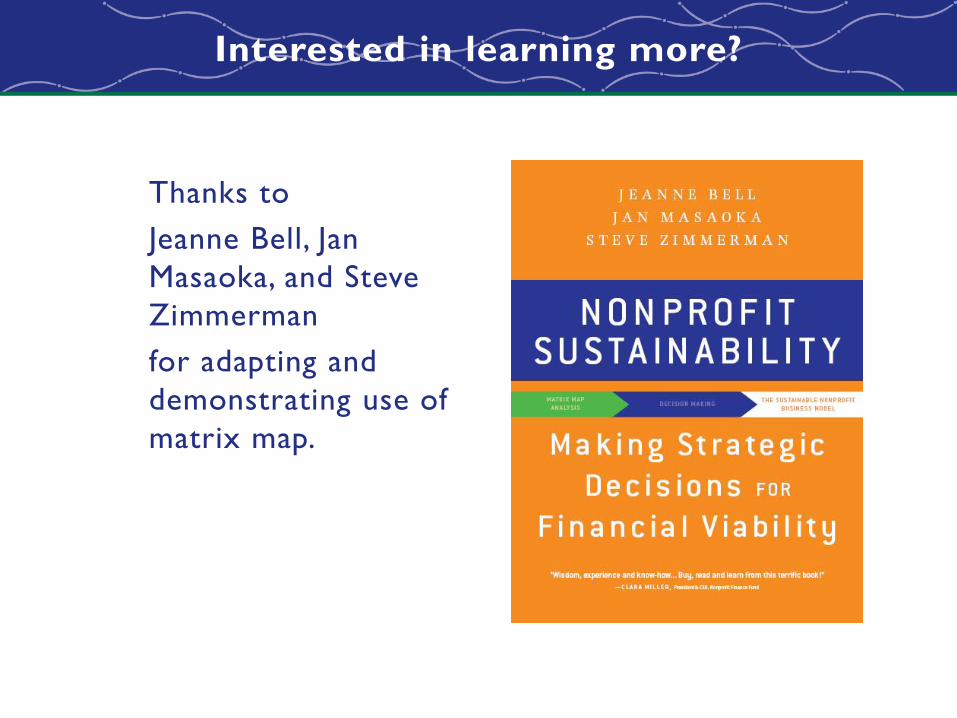
Interested in learning more?
Thanks to Jeanne Bell, Jan Masaoka, and Steve Zimmerman
for adapting and demonstrating use of matrix map.

Questions?
Thank You!
Kate Barr, Executive Director [email protected] TrixieAnn Golberg, President/CEO [email protected]
Patti Cullen, President/CEO [email protected]