the balanced scorecard framework aiding retail investment
TRANSCRIPT

The Balanced Scorecard framework aiding retail investment
decision making processes
Mduduzi Nsibande
20306602
A research project submitted to the Gordon Institute of Business
Science, University of Pretoria, in partial fulfilment of the requirements
for the degree of Master of Business Administration.
25 January 2014
© 2014 University of Pretoria. All rights reserved. The copyright in this work vests in the University of Pretoria

i | P a g e
Abstract
Current real estate investment decision making frameworks fail to recognise
differences posited by the retail sector. The investment decision stage concerned
with forecasting expected returns relies on financial and quantitative models such as
those derived from the Modern Portfolio Theory. In a shopping mall environment,
however, future performance is driven by nonfinancial factors, for example tenant
mix and superior customer experience. Therefore, forecasting expected returns in a
retail environment requires a nuanced approach relative to other commercial
property sectors.
Using a Balanced Scorecard framework, this study investigated the usefulness of
nonfinancial factors in forecasting expected returns in retail. An electronically
administered survey using a sample of institutional investors that contributed to
South Africa’s SAPOA/IPD Index for 2012 was conducted. Only officials occupying
investment decision making positions were invited to participate in the survey.
Nonfinancial factors identified from the literature were presented to the respondents
on a Likert-Style scale. In aggregate, participants to the survey possessed 156 years
of commercial property experience and 56 years of retail experience. Mean scores
obtained from participants’ responses were used to analyse the research findings.
The study found nonfinancial factors useful when forecasting expected returns in a
retail investment decision environment. Further, the study suggested the use of a
Balanced Scorecard framework in order to guide developments in the area of retail
investment decisions. In conclusion, the study gave direction for future research in
the retail sector.
List of key words
Investment Decision Making, Nonfinancial Factors, Institutional Investors, Shopping
Mall /Centre, and Balanced Scorecard
© 2014 University of Pretoria. All rights reserved. The copyright in this work vests in the University of Pretoria

ii | P a g e
Declaration
I declare that this research project is my own work. It is submitted in partial fulfilment
of the requirements for the degree of Master of Business Administration at the
Gordon Institute of Business Science, University of Pretoria. It has not been
submitted before for any degree or examination in any other University. I further
declare that I have obtained the necessary authorisation and consent to carry out
this research.
Signature: _____________________
Name: Mduduzi Nsibande
Date: 25 January 2014.
© 2014 University of Pretoria. All rights reserved. The copyright in this work vests in the University of Pretoria

iii | P a g e
Acknowledgements
I would like to give credit and appreciation to the individuals who contributed and
made this dissertation possible.
To my supervisor Dr Douw Boshoff, whose insightful guidance and coaching
resulted in the successful completion of this project.
To my wife Rejoice, my pillar of strength, for being able to successfully play a
dual parental role in the lives of our children, while I was away, but physically
present. I could not have done this without your support.
To the staff at the GIBS Information Centre, thank you so much for your ever
willingness to assist.
To my classmates, especially the MBA Full-Time group, thank you for
shaping my thinking during the initial stages of the project.
To all my former colleagues at Menlyn Park Shopping Centre, your
assistance has been quite invaluable.
To the property practitioners who participated in my study, thank you for
making the time to respond to my questionnaires.
And above all, to the Almighty Father, from whom all things are made
possible. Thank you Lord for giving me this chance.
© 2014 University of Pretoria. All rights reserved. The copyright in this work vests in the University of Pretoria

iv | P a g e
Dedication
In Loving Memory of
Daliya Bernard Mabaso,
Our family will forever be indebted to the sacrifices you made for us
You are and always will be our Giant
Thank You.
© 2014 University of Pretoria. All rights reserved. The copyright in this work vests in the University of Pretoria
v | P a g e
Table of Contents
1 Chapter 1 - Definition of the Problem .............................................................. 1
1.1 Introduction ............................................................................................................................ 1
1.2 Research Problem ............................................................................................................... 1
1.3 Research Aims ..................................................................................................................... 2
1.4 Research Scope ................................................................................................................... 2
1.5 Research Motivation ............................................................................................................ 3
1.6 Definition of Terms ............................................................................................................... 6
1.7 Conclusion ............................................................................................................................. 7
2 Chapter 2 - Theory and Literature Review ....................................................... 8
2.1 Commercial Property ........................................................................................................... 8
2.2 Globalisation and Commercial Property ......................................................................... 14
2.3 Retail Commercial Property .............................................................................................. 16
2.4 Real Estate Investment Decision Making ....................................................................... 19
2.5 The Balanced Scorecard ................................................................................................... 23
2.6 Conclusion ........................................................................................................................... 28
3 Chapter 3 - Research Hypotheses .................................................................. 29
3.1 Introduction .......................................................................................................................... 29
3.2 Research Hypotheses ....................................................................................................... 30
4 Chapter 4 – Research Methodology ............................................................... 31
4.1 Choice of Methodology ...................................................................................................... 31
4.2 Population ............................................................................................................................ 35
4.3 Sampling and Sampling Unit ............................................................................................ 36
4.4 Data Analysis ...................................................................................................................... 37
4.5 Assumptions ........................................................................................................................ 40
4.6 Research Limitations ......................................................................................................... 40
4.7 Validity and Reliability ........................................................................................................ 42
4.8 Summary ............................................................................................................................. 42
5 Chapter 5 – Research Results ........................................................................ 44
5.1 Introduction to Results ....................................................................................................... 44
5.2 Documentation of Response Rate ................................................................................... 44
© 2014 University of Pretoria. All rights reserved. The copyright in this work vests in the University of Pretoria
vi | P a g e
5.3 Sample Characteristics ..................................................................................................... 45
5.4 Hypothesis 1: Prioritisation of Investment Decision Stages ........................................ 47
5.5 Hypothesis 2: Usefulness of Nonfinancial factors ......................................................... 50
5.6 Hypothesis 3: Subjectivity of Professional Valuation Services ................................... 55
5.7 Hypothesis 4: Factors Influencing Diversification Strategies ....................................... 61
5.8 Relevance of Financial Information ................................................................................. 70
5.9 Overall Results ................................................................................................................... 73
6 Chapter 6 – Discussion of Findings ............................................................... 75
6.1 Introduction .......................................................................................................................... 75
6.2 Hypothesis 1: Prioritisation of Investment Decision Stages ........................................ 75
6.3 Hypothesis 2: Usefulness of Nonfinancial Factors ........................................................ 78
6.4 Hypothesis 3: Subjectivity of Professional Valuation Services ................................... 81
6.5 Hypothesis 4: Factors Influencing Diversification Strategies ....................................... 84
6.6 Relevance of Financial Information ................................................................................. 89
6.7 Summary ............................................................................................................................. 94
7 Chapter 7 - Conclusion ................................................................................... 95
7.1 Introduction .......................................................................................................................... 95
7.2 Research Background and Objectives ............................................................................ 95
7.3 Key Insights from Research Results ............................................................................... 96
7.4 Conclusion ........................................................................................................................... 97
7.5 Direction of Future Research............................................................................................ 98
8 References ..................................................................................................... 102
9 Appendices .................................................................................................... 111
9.1 SAPOA/IPD SA Property Index Contributors for 2012 ............................................... 111
9.2 JSE Listed Property Funds (31 Dec 2012) ................................................................... 112
9.3 Africa’s Projected GDP growth rates (% change y/y 2012 -2017) ............................ 114
9.4 Africa’s Rise to Middle Class .......................................................................................... 115
9.5 Roberts & Henneberry’s Decision Framework............................................................. 116
9.6 Parker’s Decision Framework ........................................................................................ 117
9.7 Farragher & Savage’s Decision Framework ................................................................ 118
9.8 Classification Hierarchy of Tenants ............................................................................... 119
9.9 Draft Research Questionnaire ........................................................................................ 120
© 2014 University of Pretoria. All rights reserved. The copyright in this work vests in the University of Pretoria

vii | P a g e
9.10 ICSC Shopping Centre Classification ........................................................................... 127
9.11 Covering Letter to Questionnaire ................................................................................... 128
© 2014 University of Pretoria. All rights reserved. The copyright in this work vests in the University of Pretoria

viii | P a g e
ABBREVIATIONS, ACRONYMS, AND GLOSSARY
BSC Balanced Scorecard
C & I Commercial and Industrial
CIO Chief Investment Officer
E & Y Ernst and Young
FDI Foreign Direct Investment
GIBS Gordon Institute of Business Science
GLA Gross Lettable Area
GDP Gross Domestic Product
ICSC International Council of Shopping Centres
IPD Investment Property Databank
IRR Internal Rate of Return
JSE Johannesburg Stock Exchange
MBA Master of Business Administration
MNPC Multinational Property Company
MPT Modern Portfolio Theory
MV Market Value
PV Professional Valuation
REIT Real Estate Investment Trust
SA South Africa
SAPOA South African Property Owners Association
UK United Kingdom
© 2014 University of Pretoria. All rights reserved. The copyright in this work vests in the University of Pretoria

1 | P a g e
1 Chapter 1 - Definition of the Problem
1.1 Introduction
Today shopping malls of various types and sizes are ubiquitous in both urban
and rural areas of our societies. Due to the capital intensity associated with
ownership, it is widely reported that ownership of these retail assets is relatively
limited to institutional investors, for instance, insurance and pension fund
institutions (Kaiser, 2005; Parker, 2013). Ownership of commercial property is
usually facilitated through investment decision making frameworks. In the real
estate industry, investment decision making frameworks that aid acquisition
decisions have been the subject of study for decades. To date, however, there
is no universally agreed decision making framework (Sah, 2011).
1.2 Research Problem
Current normative decision making frameworks vary in terms of the decision
stages involved in the entire decision making process. In a study conducted by
Farragher and Savage (2008), the investment stage concerned with forecasting
expected returns was identified by a sample of institutional investors as most
important. In order to forecast expected returns, rational investment frameworks
presently make use of financial as well as mathematical information. The
investment stage concerned with forecasting expected returns, therefore, is
biased towards financial information at the expense of nonfinancial.
Downplaying the important role of nonfinancial in driving future performance
makes present decision making frameworks inadequate for the retail sector.
According to Mittal, Huppertz, and Khare (2008), retail performance is generated
by the nonfinancial attribute of superior customer experience. There is therefore
a need to incorporate nonfinancial factors into retail decision making
frameworks.
© 2014 University of Pretoria. All rights reserved. The copyright in this work vests in the University of Pretoria

2 | P a g e
Kaplan and Norton (1996) introduced the Balanced Scorecard (BSC) in order to
prevent the tendency of bias in favour of financial information when forecasting
future performance. According to Drury (2009), the BSC framework retains
financial indicators (lagging indicators), but only in so far as aiding the
understanding of the drivers of such performance (lead indicators). For purposes
of investment decision making in retail, therefore, using a BSC framework might
offer invaluable insights when forecasting expected returns.
1.3 Research Aims
The study uses a South African environment to test academic theory, and had
the following aims:
To understand the views of South African institutional investors on the
usefulness of nonfinancial information during the investment decision stage
concerned with forecasting expected returns in a retail environment.
To gain an understanding of the decision making stages that are prioritised
by South African institutional investors.
To understand the extent to which South African institutional investors would
place reliance on the work of the professional valuer in market value
determination when faced with an investment decision.
1.4 Research Scope
The research focussed mainly on soliciting views of institutional investors on the
usefulness of nonfinancial information in forecasting expected returns in a retail
environment. In order to test the proposed hypotheses, the study used an
electronic questionnaire method to obtain the views of key players in the South
African real estate industry. Respondents were drawn from a list of contributors
to the SAPOA/IPD South Africa Annual Property Index for 2012 (Appendix 9.1).
These contributors represented a capital value of R206bn in commercial
© 2014 University of Pretoria. All rights reserved. The copyright in this work vests in the University of Pretoria

3 | P a g e
property holdings. For the same period, according to McGregor BFA the total
market capitalisation of the Listed Property Sector on the JSE was about
R231bn (Appendix 9.2). Retail property accounted for about 60 per cent of the
total value of R206bn (Figure 1.1). Therefore, the group of institutional investors
selected for the study was considered to be quite representative of the entire
South African property market.
Figure 1.1: SAPOA/IPD Index 2012: Capital Values
1.5 Research Motivation
1.5.1 Why Retail Investment Decision Making
The primary purpose of this report was to investigate the usefulness of
nonfinancial factors when forecasting expected returns in a retail investment
decision making setting. Current investment decision making frameworks are
designed to apply across all property sectors, and put emphasis on financial
factors when forecasting expected returns. A number of studies, however,
suggest that the retail sector’s future financial performance is dependent on
122370 59%
46221 23%
27503.4 13%
10066.2 5%
Capital Value R'000
Retail
Office
Industrial
Other
© 2014 University of Pretoria. All rights reserved. The copyright in this work vests in the University of Pretoria

4 | P a g e
nonfinancial factors (Meija and Benjamin, 2002; Kaiser, 2005; Allard, Babin, and
Chebat, 2009). Therefore, based on these studies, retail investment decision
processes need to incorporate nonfinancial factors into the decision framework.
It was therefore expected that the results of this study will contribute towards the
understanding of retail investment decision making frameworks.
1.5.2 Why Africa?
Africa’s retail sector looks set to gain increased investment interest from global
institutional investors. According to E&Y (2012), the continent’s retail sector
remains grossly underdeveloped, save for South Africa which boasts of shopping
centres that meet world standards. Globally-renowned real estate consultancy
firm Knight Frank (2013), however, reported that the continent is set for an
unprecedented growth in retail in the years ahead. As infrastructure development
continues to improve across the continent, quality shopping malls will emerge,
and therefore likely to stimulate investment interest from international investors.
According to Knight Frank (2013), the investment climate and consumer income
levels are improving across Africa. This is further supported by research
projections conducted by E&Y (2012) on Gross Domestic Product (GDP) and the
profile of the middle class population across the continent (See Appendix 9.3 &
9.4). To this end, the consultancy firm concluded that this will accelerate the
pace at which the quality of retail assets improves, and likely to provoke strong
diversification interest by global institutional investors.
The IMF (2012) reported that seven of the fastest growing economies in the
world are located in Africa. While the Human Development Index (HDI) indicated
widespread challenges across the continent (UNDP, 2012), The World Bank and
IFC (2013) reported significant progress on the ease of doing business ranking
by the countries identified to be among the fastest growing economies in the
world. All these positive attributes bode well to engender global investor
confidence on the African continent.
© 2014 University of Pretoria. All rights reserved. The copyright in this work vests in the University of Pretoria

5 | P a g e
1.5.3 Why SA’s Retail Sector
The African continent as a whole has been the major focus of foreign investors
since the global recession. For South Africa, according to Games (2012), foreign
investors consider the country to be the gateway to the rest of the continent
given its relatively investor-friendly business conditions. At position 39 on the
global ease of doing business index (The World Bank and IFC, 2013), South
Africa ranks First on the Index when measured against other African countries.
According to E&Y (2012), the country also ranks highest in attracting Foreign
Direct Investment (FDI) since 2003 (Figure 1.2), and this has seen major
retailers such as Walmart enter the local shores. On this backdrop, it can be
argued that the local economy is viewed in good light by the global investment
community.
Figure 1.2: Top 10 African FDI destinations since 2003 (E&Y, 2012)
From a real estate perspective, South Africa’s real estate industry has
undergone major improvements since the dawn of democracy in 1994.
According to Knight Frank (2013), in the year 2000 the country had only 240
shopping centres compared to over 1500 in the year 2013. In terms of property
returns, South Africa’s real estate industry has measured well against property
returns registered elsewhere in developed markets. According to the
SAPOA/IPD South Africa Annual Property Index (2007), the country’s Total Real
Estate Return of 31% was the highest in the world in the year 2007, and such
stellar performance was quite a commendable achievement given that it came
from an emerging economy. Structurally, in 2013 the listed sector introduced the
Real Estate Investment Trust (REIT) investment vehicle. The REIT is a globally
renowned investment vehicle (Parker, 2013), and therefore such move is likely to
© 2014 University of Pretoria. All rights reserved. The copyright in this work vests in the University of Pretoria

6 | P a g e
generate even more investment traction into the economy, particularly by
multinational property companies (MNPCs).
While retail construction activity is reportedly gaining momentum across the
African continent (Beattie, 2013), South Africa remains the only country in Africa
with shopping centres that meet global standards (Knight Frank, 2013). In terms
of performance, the country’s Eight Super Regional Centres delivered a strong
total return performance in 2012 (17.7%), up from 10 percent the previous year
(Viruly, 2013). Total return for the entire real estate industry, however, was softer
at 15.2 per cent, with the retail sector outperforming other sectors at 17.1 per
cent (SAPOA/IPD South Africa Annual Property Index, 2012). Notwithstanding
the fact that the industry’s performance falls short when compared with
performance levels achieved in 2007. The buoyant performance by the retail
sector looks set to stimulate global investment interest. In light of the foregoing
discuss, from a research perspective SA’s commercial property industry is fertile
ground for conducting quality research that might reshape global thinking in real
estate.
1.6 Definition of Terms
The terms listed below are important for this study and their meaning in the
context of this study is briefly explained:
o Centre management
The term refers to the site management team in a shopping mall responsible
for its administration, either as landlord, or agents appointed by the landlord.
o Institutional investors
This refers to contributors to the SAPOA/IPD South Africa Property Index.
o Investment decision making
The term refers to the entire decision making processes that confront
investors when faced with a decision to acquire commercial property.
© 2014 University of Pretoria. All rights reserved. The copyright in this work vests in the University of Pretoria
7 | P a g e
o Listed property sector
In the context of this study, listed property sector refers to property funds
listed on the Johannesburg Stock Exchange (JSE).
o Shopping centre / mall
‘A group of retail and other commercial establishments that is planned,
developed, owned and managed as a single property single, typically with on-
site parking provided’ (Dawson and Lord, 2012, p.1).
1.7 Conclusion
This study investigates the usefulness of nonfinancial factors in aiding
investment decision making frameworks, in particular, in forecasting expected
returns in a retail environment. To this end, the study proposes the use of a BSC
framework to assist current retail investment decision making processes.
The research report is divided into Seven Chapters: Chapter 1 discusses the
research problem and also outlines the purpose of the study. Chapter 2 provides
an overview of theory and literature within which the research problem is framed.
The research hypotheses are presented in Chapter 3. The research
methodology adopted in addressing the problem is detailed in Chapter 4. The
results of the study are presented in Chapter 5, and the analysis of results
occurs in Chapter 6. Chapter 7 is the conclusion which also presents
recommendations and the direction of future research. References and
Appendices are presented after Chapter 7.
© 2014 University of Pretoria. All rights reserved. The copyright in this work vests in the University of Pretoria

8 | P a g e
2 Chapter 2 - Theory and Literature Review
The literature review below takes the form of three broad commercial property
discussions. Firstly, a section dealing with the attributes of commercial property
as an asset class is presented. Under this section, scholarly work addressing
demand – supply factors, globalisation, and differences posited by the retail
sector, is covered. Secondly, there is focus on the theory covering real estate
investment decision making frameworks. The last section deals with the BSC in
the context of retail investment decision making processes.
The literature review supports the need for research in the area of retail sector
investment decision making processes. To this end, this leads to the research
questions presented in Chapter Three.
2.1 Commercial Property
2.1.1 Introduction
Investment participation in commercial property, according to Doppegieter and
Rode (2002), is viewed from two perspectives: direct and the indirect property
markets. In the direct market, the investor directly holds the physical assets,
hence has the opportunity to influence the operational aspects. Indirect
investment, conversely, refers to securitised commercial property, usually
through portfolio investment, and the investor has no window of opportunity to
influence operations in as far as the portfolio of assets constituting the portfolio is
concerned.
A number of studies document institutional investors’ dominance in real estate
ownership, and such dominance is also reported to be gaining momentum
(Newell and Seabrook, 2006; Lieser and Groh, 2011; Clayton, Ling, and Naranjo,
2009). Most studies attribute this paradigm to the need by institutional investors
to diversify their portfolios on a global scale.
© 2014 University of Pretoria. All rights reserved. The copyright in this work vests in the University of Pretoria
9 | P a g e
Jackson (2006) conducted a study to explore the relationship between town
planning affecting retail property and investment by institutional investors. In the
study it was argued that access to town planning policies by institutional
investors contributes toward creating a performing and functional retail market.
The study stated that institutional investors tended to factor important town
planning information into their investment strategies.
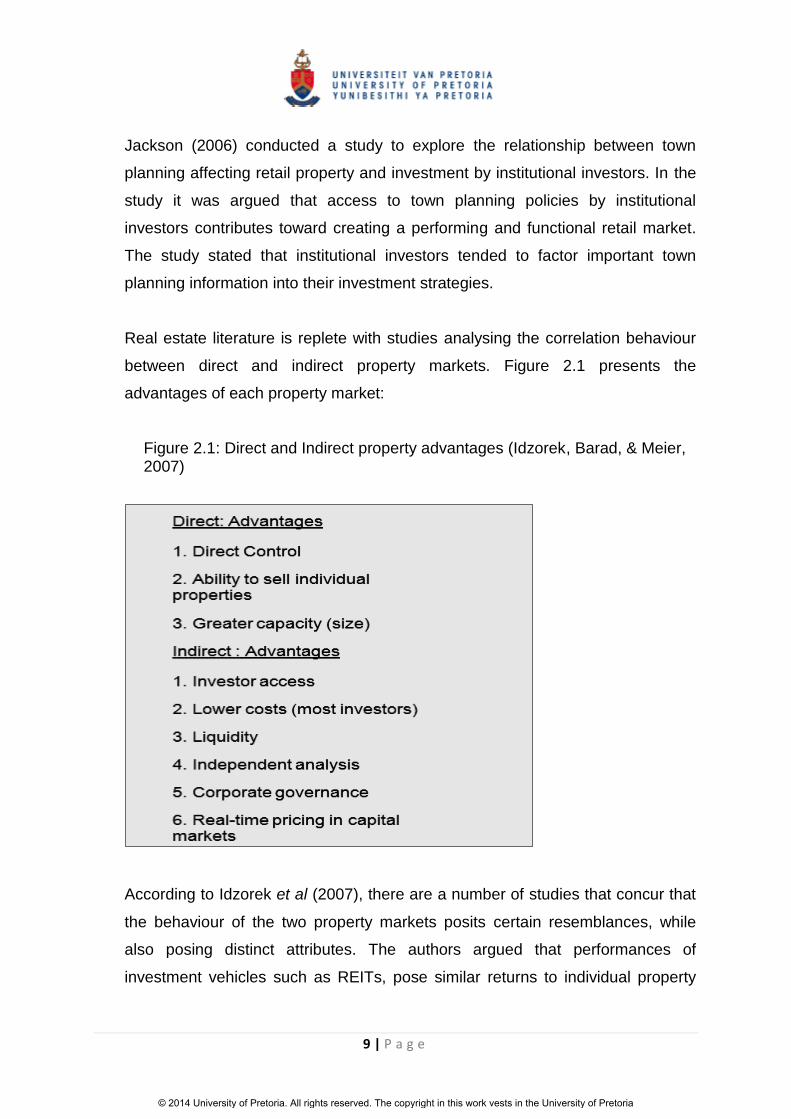
Real estate literature is replete with studies analysing the correlation behaviour
between direct and indirect property markets. Figure 2.1 presents the
advantages of each property market:
Figure 2.1: Direct and Indirect property advantages (Idzorek, Barad, & Meier, 2007)
According to Idzorek et al (2007), there are a number of studies that concur that
the behaviour of the two property markets posits certain resemblances, while
also posing distinct attributes. The authors argued that performances of
investment vehicles such as REITs, pose similar returns to individual property
© 2014 University of Pretoria. All rights reserved. The copyright in this work vests in the University of Pretoria
10 | P a g e
returns due to the fact that both markets are influenced by one set of property
fundamentals factors.
Niskanen and Falkenbach (2010) examined the behaviour of European REITs
relative to other asset classes like equity and bonds. Evidence of a positive
correlation between REITs and equities was found, while a negative correlation
was observed with fixed income securities. The authors also noted that the REIT
structure and tax regimes applicable to each specific region tended to create
unique characteristics of the indirect market.
A number of studies have analysed the performance of real estate investments
from the perspective of ownership structure, in particular, shareholder activism
by institutional investors (Chan, Leung, and Wang, 1998; Kaiser, 2005). Chan et
al (1998) found REITs shares which had a higher institutional-investor ownership
to be performing better relative to those with less. This was attributed to the
institutional investor’s ability to take control of the asset, particularly direct
property. It was also concluded that institutional investors often possess the
required skill and financial power, to enable the implementation of any intended
control and monitoring mechanisms that would result in higher performance.
Kaiser (2005) stated that shareholder activism in direct property can involve a
myriad of control mechanisms, such as being involved in operational decisions
that pertain to refurbishments, redevelopments, tenanting, and changing the
composition of Centre Management. The purpose of the study was to analyse
real estate portfolio returns, and the study concluded that managerial control in
direct property investments may be the biggest driver of performance relative to
the usual two portfolio theory factors of beta and alpha. In a study seeking to
determine the sources of excess returns, however, Fuss, Richt, and Thomas
(2012) found no evidence to support active property management by institutional
investors as a source of excess portfolio returns. Therefore, the efficacy of
shareholder involvement in driving positive portfolio performance remains
inconclusive.
© 2014 University of Pretoria. All rights reserved. The copyright in this work vests in the University of Pretoria

11 | P a g e
2.1.2 Supply and Demand
DiPasquale and Wheaton (1992) divided the real estate sector into two markets:
the market for real estate space (Demand) and the market for real estate assets
(Supply), and then offered an explanation on the connection between these
markets. Attractive rental levels tend to stimulate demand for retail assets and in
order to meet this demand, developers respond by entering into asset-
construction phase. The time lag between delivery and actual demand,
however, causes the market to go into disequilibrium, a phenomenon also
consistent with the economic laws of supply and demand. On the contrary, an
oversupply of assets has the effect of depressing rental levels which in turn
causes property assets to be unattractive to own. According to the authors, this
marks the main connection between these markets.
The property sector has ‘experienced more pronounced cycles than the general
economy’ (O’Neill, 2009, p.44). Therefore, given the challenges associated with
the lag associated with the restoration of the equilibrium point as a
consequence of demand-supply fluctuations, investment decisions in property
need to have a long term perspective. Institutional investors, according to a
number of studies such as Kaiser (2005), already adopt a long-term perspective
when making investment decisions.
2.1.3 Market Value (MV) Determination
Compared with other asset classes, such as equity securities and bonds, the
challenge facing two interacting parties wishing to conclude a property
transaction lies in the determination of the market price (Boshoff, 2008). With
respect to other asset classes, MVs are determined through market forces
prevalent in the capital markets. Real estate, however, suffers from infrequency
of trade, heterogeneity, and hence pricing is often determined using prices at
which comparable assets trade (Levy and Schuck, 2005). According to Levy and
Schuck (2005), the subjective nature of the valuation process in real estate has
created the emergence of market valuation services (the professional valuer).
© 2014 University of Pretoria. All rights reserved. The copyright in this work vests in the University of Pretoria
12 | P a g e
Professional Valuation (PV) differs from investment-financial valuation (IFV).
According to Artemnkov, Mikerin, and Artemnekov (2008), PV is concerned with
the valuation of illiquid assets such as real estate, while IFV relates to assets
traded on capital markets (efficient or near-efficient) and uses valuation methods
flowing out of the MPT. Due to the fact that PV is broader in scope, in a market
that is far from perfect, Artemnkov et al (2008) argue that the attribute of
subjectivity during the market value determination processes marks the main
difference between these valuation approaches.
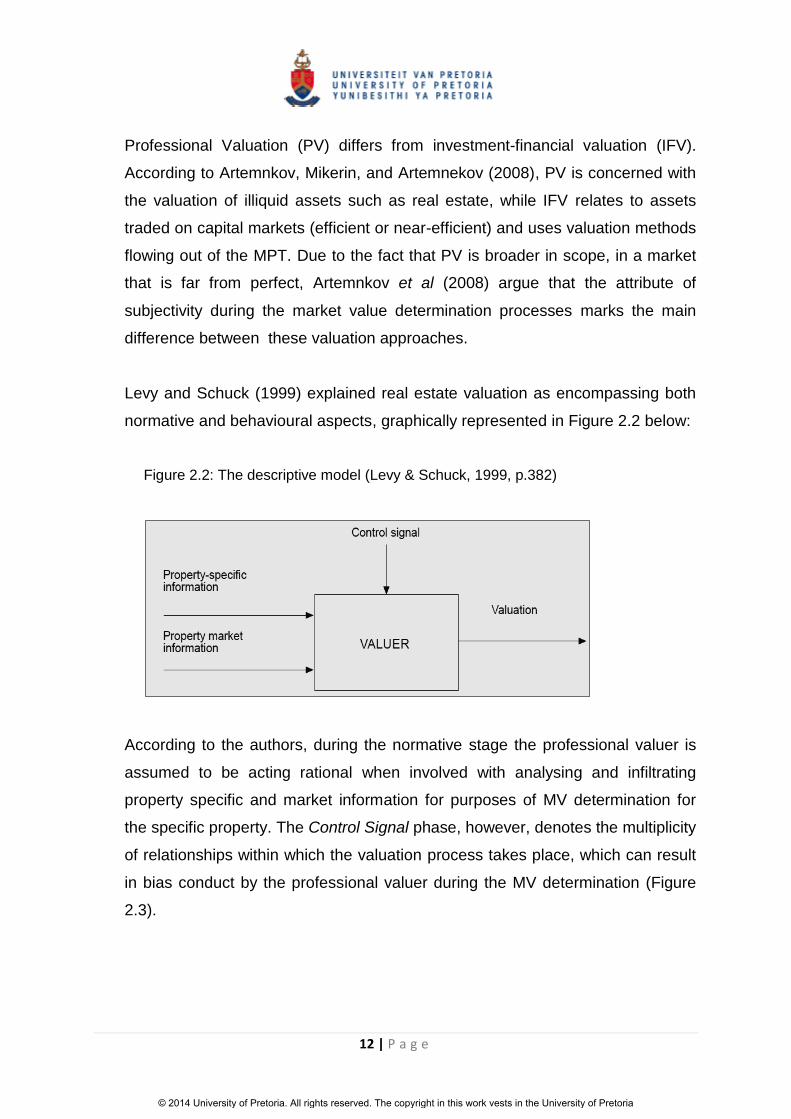
Levy and Schuck (1999) explained real estate valuation as encompassing both
normative and behavioural aspects, graphically represented in Figure 2.2 below:
Figure 2.2: The descriptive model (Levy & Schuck, 1999, p.382)
According to the authors, during the normative stage the professional valuer is
assumed to be acting rational when involved with analysing and infiltrating
property specific and market information for purposes of MV determination for
the specific property. The Control Signal phase, however, denotes the multiplicity
of relationships within which the valuation process takes place, which can result
in bias conduct by the professional valuer during the MV determination (Figure
2.3).
© 2014 University of Pretoria. All rights reserved. The copyright in this work vests in the University of Pretoria

13 | P a g e
Figure 2.3: Valuation within the commercial environment (Levy & Schuck, 1999, p.383)
Academic literature is littered with cases documenting biases related to
professional valuation assignments. Biases in PV can either be endogenous,
that is arising out of the professional valuer’s own internal professional know-
how, or exogenous, which pertains to bias behaviour triggered by the
environment within which the valuation process happens (Levy & Schuck, 1999).
In a study conducted in New Zealand by Halvitigala, Murphy, and Levy (2011),
the authors found that professional valuers tended to avoid valuation
assignments that are occasioned by non-standard lease structures. According
to the authors, such paradigm results from the tendencies of markets being
dominated by one lease structure, which in turn deprives professional valuers
the experience on other lease structures.
Professional valuers have also been found to be influenced by their assignment
clients, for example, the study by Crosby, Lizieri, and McAllister (2010). The
study was conducted in the UK, and sought to test the level of influence by
clients on valuations where properties had covenant-linked MVs. The study was
conducted around the second half of 2007 when the UK property market was on
the decline. Leveraged property owners, therefore, had a motive to hold back
© 2014 University of Pretoria. All rights reserved. The copyright in this work vests in the University of Pretoria

14 | P a g e
falling property values in order to circumvent violation of loan-to-value
covenants. In this study, the professional valuers were found to have acceded to
influences of their clients, and thus resulting in inflated property values.
One factor that seems to promote the above malpractice is the various valuation
practices evident in a number of countries. In the UK and Australia, for instance,
the valuation process involves discussions with the client before finalisation of
the MV, and this paradigm creates the platform for the generation of bias
behaviour (Levy and Schuck, 1999; Crosby et al, 2010). In this regard, therefore,
the final value of a property becomes the subject of a negotiated settlement
between the professional valuer and the client.
In conclusion, the literature reviewed in this section suggests that professional
valuation services cannot always be relied on to produce reliable MVs that aid
investment decision making processes. There is therefore uncertainty around the
derived MVs, and according to Dhar and Goetzmann (2006), uncertainty – as
opposed to risk – negatively affects investor appetite in real estate.
2.2 Globalisation and Commercial Property
There is a strand of literature documenting globalisation activity by multinational
property companies (MNPCs) (Newell and Seabrook 2006; Topintzi, Chin, and
Hobbs, 2008; Lieser and Groh, 2011). Globalisation is defined within the context
of foreign MNPCs permeating local markets in search for new investment
opportunities and returns. According to Too, Harvey, and Too (2010), companies
that have opted not to immerse themselves in the global market place are not
precluded from the business impact caused by globalisation. In order to compete
meaningfully with MNPCs on local shores, all competitors would be required to
conjure up global strategies that will minimise the effects of competition as a
result of new entrants into the local market. Therefore, MNPCs cause
competition to intensify and this is facilitated by a strong financial capability.
© 2014 University of Pretoria. All rights reserved. The copyright in this work vests in the University of Pretoria

15 | P a g e
According to Kaiser (2005), MNPCs also possess the necessary skills required
to influence investment performance.
In a study conducted by Dhar and Goetmann (2006), real estate institutional
investors entering foreign markets were found to be mostly motivated by the
benefits of diversification. De Wit (2010) attributed the global increase in
diversification by Multinational Property Companies (MNPCs) to the decrease in
information asymmetry as companies like the Investment Property Databank
(IPD), Jones Lang LaSalle (JLL), and others, started providing property
performance benchmarks across real estate markets on a global scale. There is
an ongoing global re-convergence of property vehicles that are in use across
markets, in particular, the pervasive adoption of the Real Estate Investment
Trust (REIT) by emerging markets, an investment vehicle quite common in
developed markets (Idzorek et al, 2007). According to Moshirian (2008), the
advancement in technology has also facilitated the ease of information flow
across markets.
Economic factors such as rising income levels and increasing GDP also fuel the
advent of globalisation by MNPCs (Too et al, 2010; Lieser and Groh, 2011).
Lieser and Groh (2011) also found MNPCs able to amass a number of relatively
cheaper investment properties due to the strength of their home currency. De
Wit (2010) argued that the size of the local market, relative to the foreign, is
another economic factor that propels MNPCs to explore offshore investment
opportunities.
Acemoglu and Robinson (2012) referred to a stable political climate as a
necessary factor in drawing foreign investment into a country. The authors
argued that, globally there is a move towards the creation of stable political
institutions, which in turn has brought about a climate in which widespread
property rights are safeguarded. This phenomenon is reportedly rife in emerging
economies such as those located in Africa. The authors though also throw
caution against some other key countries which are still failing to transform.
© 2014 University of Pretoria. All rights reserved. The copyright in this work vests in the University of Pretoria

16 | P a g e
Uncertainty as a result of an unstable political climate therefore negatively
affects investment decisions.
2.3 Retail Commercial Property
2.3.1 Growth
Shopping malls are ubiquitous in both urban and rural locations. In the UK based
study by Jackson (2006), relative to other property classes, retail investment was
found to be increasingly dominating investment portfolios of institutional
investors. The retail sector therefore features quite strongly in investment
strategies of institutional investors, hence a need to bring better understanding of
current retail investment frameworks.
According to Reinartz, Dellaert, Krafft, Kumar, and Varadarajan (2011), there is a
growing trend of retailers from developed markets entering emerging economies.
These retailers are reportedly attracted by new growth opportunities in those
markets, in particular improving economic conditions such as GDP and income
levels. From this study, it can be concluded that as a result of globalisation the
quality of shopping mall property assets in emerging markets is set to improve.
2.3.2 Retail Difference
Any investment decision, according to DiPascale and Wheaton (1992),
represents the purchase of current and future income streams. According to
Robins (2007, p. 21), ‘commercial property is all about leases and tenants.’
Therefore, a lease agreement forms the basis of the process of future expected
returns’ determination.
According to Pitt and Musa (2009), however, the structure of the retail lease is
different from that of other property classes, for example, Commercial and
Industrial (C&I). In delineating the structural nature of a retail lease, Carter
(2009) pointed out that a retail lease has two rental sources; a fixed rental
© 2014 University of Pretoria. All rights reserved. The copyright in this work vests in the University of Pretoria
17 | P a g e
portion which escalates in terms of the stipulated contractual escalation rate, and
a variable rental portion (Turnover Rental). Turnover rental is a function of total
sales generated by the tenant such that the higher the sales achieved by the
tenant the higher the variable rental and vice-versa. A trade-off, however, exists
between these two rental types. The fixed rental is based on a minimum
threshold sales amount, and therefore the percentage rental phenomenon only
triggers upon the tenant reaching the minimum threshold. In retail, minimum
threshold is referred to as breakpoint (Wheaton, 2000).
The advantage of a variable rental payment therefore makes retail assets
attractive over other property classes. This advantage, however, can only be
realised if the centre management team is successful in creating a climate where
tenants can excel and deliver turnover figures that surpass breakpoint. The retail
sector is dynamic and highly competitive (Jackson and Watkins, 2011).
Therefore, in order to match the ever changing consumer demands in an
intensely competitive environment, the centre management team will also be
required to come up with competitive and relevant strategies that match
challenges presented by the operating environment. The location factor only is
no longer a guarantee for future property performance (Allard et al, 2009).
Porter (1996) presented differentiation as one of three strategies an
organisation can use to compete in the marketplace. In a retail environment, the
tenant mix serves as a source of differentiation for the shopping centre. Burnaz
and Topcu (2011) defined tenant mix as the clustering of tenants in a shopping
mall such that the overall volume of foot-traffic is enhanced. Allard et al (2009)
argued that a tenant mix strategy makes the shopping mall unique in its offering,
and therefore fosters competitiveness.
The foregoing discussion highlighted the importance of tenant sales in driving
shopping centre performance. On the same vein, the uniqueness of the retail
sector lease relative to other sectors was discussed. The next paragraph
presents the main challenge confronting centre management in ensuring the
© 2014 University of Pretoria. All rights reserved. The copyright in this work vests in the University of Pretoria

18 | P a g e
completeness of tenant sales, in furtherance of the objective of maximising
turnover rental income for the shopping mall.
Yuan and Krishna (2008) dealt with the challenge of sales leakage, that is,
tenant sales generated through the internet platform which elude the variable
rental calculation net, intentionally or otherwise. The challenge facing the centre
management team, therefore, is how to track internet generated sales. In order
to circumvent such challenge, Yuan and Krishna (2008) suggested that it might
be a safer option for the landlord to consider this risk during the process of fixed
rental determination given that there is a trade-off between these two rental
streams. Nonetheless, such inability by the centre management team to
confidently account for all sales amounts generated by each tenant has the
potential to negate property performance.
2.3.3 Conclusion
The investment community, largely dominated by institutional investors, faces
enormous challenges when faced with a property investment decision. Decision
making happens under imperfect conditions given the nature of property as an
asset class. Furthermore, the nuanced characteristics of the retail sector
compound the situation of uncertainty. As discussed above, such paradigm
might result in suboptimal decision making by investors.
The investment stage concerned with forecasting expected returns in a retail
environment therefore cannot be premised only on financial and mathematical
information. In this regard, cognisance of the fact that retail performance is
driven by nonfinancial factors must be brought to the fore by the professional
valuer during the process of MV determination. Processes that rely purely on
quantitative data will result in an uncertain decision making climate which in turn,
as argued by Dhar and Goetzmann (2006), reduces the demand for investment
property.
© 2014 University of Pretoria. All rights reserved. The copyright in this work vests in the University of Pretoria
19 | P a g e
2.4 Real Estate Investment Decision Making
2.4.1 Introduction
Academic literature reviewed to this point has dealt with the context and climate
within which real estate investment decisions happen. This section reviews real
estate investment frameworks presently used in the process of decision making.
Firstly, the work covers studies dealing with rational frameworks, before
concluding the discussion by referring to decision making models dealing with
the behavioural aspects of decision making processes.
2.4.2 Rational Frameworks
Rational or normative decision making frameworks are based on the notion that
the individual investor is a utility maximiser, or profit-maximiser in the case of
corporates. The investor is therefore assumed to be acting rationally when faced
with an investment decision (MacCowen and Orr, 2008; Atherton, French, and
Gabrielli 2008). The notion of rationality is further perpetuated in portfolio
allocation theories such as MPT and Capital Asset Pricing Model (Dhar and
Goetzmann, 2006).
According to Jackson and Watkins (2011), to date research literature is littered
with several variants of rational real estate investment decision models. The
authors further observed that such models are in essence summarised versions
of the model contained in the study by Roberts and Henneberry (2007). In order
to come up with their rational decision model, Roberts and Henneberry (2007)
also analysed and combined previous real estate investment decision models. In
their study, the authors presented a 10 step normative decision making
framework (Appendix 9.5), which to date is widely reported to be the basis of
current rational decision frameworks (Sah, Gallimore, and Clements, 2010; Sah,
2011; Jackson and Watkins, 2011). The study by Roberts and Henneberry
(2007) concluded by stating that decision frameworks have to be stylised in
order to suit each country.
© 2014 University of Pretoria. All rights reserved. The copyright in this work vests in the University of Pretoria

20 | P a g e
Attracted by the size of the unlisted property market in Australia, Parker (2013)
conducted a similar study to the above with a purpose to investigate the use of
investment decision frameworks in the real estate industry. Using a 20 step
framework (Appendix 9.6), the study concluded that the decision making process
is multi-step, linear and sequential. Apart from the increased investment stages,
this study’s framework did not materially differ from that of Roberts and
Henneberry (2007).
In order to investigate investment decision making processes by equity
investors, Farragher and Savage (2008) varied Roberts and Henneberry’s
(2007) model and produced a nine step model (Appendix 9.7). The study
concluded that respondents ranked the following three investment decision
stages as most important (p.29):
o Searching for investment opportunities
o Forecasting expected returns; and
o Evaluating expected returns
In terms of evaluation measure, the study found the following measures as
important:
o Internal Rate of Return (IRR)
o Cash-on-Cash Rate Return; and
o Payback
The study also identified a number of variables likely to influence investor
diversification strategies, from which respondents had to indicate their selection.
Geographical location and the property type were preferred by the
respondents over other factors, namely economic location, tenant type,
property size, and property age.
Arising out of constructs of behavioural finance, a number of studies have
emerged that deal with the question of efficacy of rational frameworks in property
investment decision making processes. In the midst of uncertainty, an investor is
© 2014 University of Pretoria. All rights reserved. The copyright in this work vests in the University of Pretoria
21 | P a g e
required to make a decision based on arbitrary judgement and that may not
coincide with the assumption of rationality (French, 2001; MacCowan and Orr,
2008). Therefore, when faced with the prospect of forecasting expected returns
in a retail environment, there is a strong argument that reliance on purely rational
information may not result in an optimal decision. Instead, consideration ought to
be given to other irrational information, such as making a judgement call as to
what influence the quality of centre management bears on the shopping centre’s
performance.
2.4.3 Behavioural Aspects
Clayton et al (2009) offered reasons why investors often deviate from rational
frameworks when faced with a real estate investment decision. Aspects of
behaviour in decision making are a result of the factors of complexity, illiquidity,
and information asymmetry of property markets. The study also observed that
investors sometimes base decisions on sentiment and not on property
fundamentals.
In the study by Jackson (2006) mentioned earlier, the author argued from the
perspective of institutional investor involvement in town planning decisions. The
study therefore supports the argument that behaviour influences investment
decision making. Investment decisions have also been found to be dependent on
comments by brokers (Fogel and Berry, 2006).
Sah (2011) conducted a study between experts and novices (trained but not yet
experienced) in order to analyse if any behavioural aspects influenced their
decision making processes. The author found that the experience possessed by
experts had an impact on their decision processes although such finding was not
found by the author to be conclusive.
In summary, the Sections 2.4.2 and 2.4.3 above highlighted the complexities
within which investment decisions are taken in real estate. A number of studies
© 2014 University of Pretoria. All rights reserved. The copyright in this work vests in the University of Pretoria

22 | P a g e
presented rational frameworks as a plausible approach to taking investment
decisions, while the influence of behavioural finance challenged this approach to
decision making. To date, therefore, it is perhaps understandable why there is no
universally agreed decision making framework (Sah et al, 2010).
2.4.4 Retail Sector Implication
The retail sector as discussed above posits key performance bearing differences
and therefore, current investment decision making frameworks in their present
form are inadequate. There is a strand of academic literature that supports
reliance on leading indicators (nonfinancial) as opposed to lagging indicators
(financial) of performance when seeking to drive future returns (Ittner and
Larcker, 1998; Grewal, Levy, and Kumar, 2009). Preceding sections of this
report elaborated on the integral role played by nonfinancial factors in the
context of driving future returns. Therefore, in a retail setting, investment
processes failing to incorporate such important levers of future performance
seem likely to result in suboptimal investment decisions.
The investment decision stages concerned with forecasting expected returns
and the evaluation of expected returns rank highly in the investment decision
process of institutional investors (Farragher and Savage, 2008). In a C&I
environment, forecasting expected returns presents less difficulty given that the
fixed-rental structure of the lease agreement permits this process with
mathematical ease. Also, under such rental structure, the evaluation of expected
returns only involves the process of probability apportionment of the risk
connected with payment default by the tenant.
On the contrary, the process of forecasting expected returns in a retail
environment goes further than simply taking into consideration the fixed-rental
portion of the rental income. In order to optimally forecast expected returns, the
© 2014 University of Pretoria. All rights reserved. The copyright in this work vests in the University of Pretoria

23 | P a g e
process needs to provide an estimate forecast of tenant sales that will allow the
calculation of the variable rental component as a result of tenant sales
surpassing breakpoint. The estimate on forecast sales levels can only be
possible if the decision maker is appraised with the factors that propel tenant
sales. In this regard, reliance on purely financial data and mathematical models
in order to forecast expected returns looks set to yield suboptimal investment
decisions.
Given the foregoing discussion on the challenges posed by current decision
frameworks in the context of forecasting expected returns in retail, the next
section advances a case for the use of a BSC framework in order to aid current
decision frameworks. Reference is also made to some literature that has
heralded the success of the BSC framework in refocusing investor attention to
the drivers of future performance, rather than purely on financial information.
2.5 The Balanced Scorecard
2.5.1 Introduction
According to Drury (2009), the BSC was developed by Kaplan and Norton (1996,
2001) in response to the absence of an integrated performance measurement
system that combined both financial and nonfinancial factors in the context of
driving future performance. Prior to the introduction of the BSC, performance
measurement systems in existence then were dominated by financial measures,
and in cases where nonfinancial factors were included, such inclusion was
fragmented (Kaplan and Norton, 1996). The introduction of the BSC, therefore,
ushered renewed focus on the role of nonfinancial indicators in driving future
performance.
The BSC has Four perspectives (Financial, Customer, Internal business
process, & Learning and growth), and these perspectives are underpinned by
© 2014 University of Pretoria. All rights reserved. The copyright in this work vests in the University of Pretoria

24 | P a g e
their interconnectedness in that they all have a ‘cause and effect’ relationship
(Kaplan and Norton, 2001). Further, the model consists of two performance
measures, lagging and leading measures, versus traditional measures which
have a bias towards financial measures (Drury, 2009). In forecasting future
performance, the framework therefore recognises the input of both financial and
nonfinancial factors with increased focus on nonfinancial information which
drives future financial performance.
In the context of retail, and using the framework of a BSC, decision frameworks
seeking to forecast expected returns cannot be biased towards lagging
measures of performance, but rather leading indicators of performance. The use
of a BSC framework, therefore, should result in improved investment decisions in
retail. Decisions based on the biases towards historical seem likely to result in
poor investment decisions, and as stated by Lim, Berry, and Sieraki (2013), ‘past
returns are never a guarantee of future investment returns’ (p.264).
The perspectives of the BSC, in the context of retail performance, are discussed
below:
2.5.2 Financial Perspective
The financial perspective of the BSC specifies the economic financial objectives
expected as a result of achievement of measures set on the other perspectives
(Kaplan and Norton, 2001). Revenue growth and mix, cost reduction, and asset
utilization are three core financial themes that are identified as enabling business
success (Kaplan and Norton, 2001).
In a retail environment, the interest of landlords in driving growth in turnover
levels achievable by the individual tenants stems from the concept of turnover-
based rental. Increases in achievable sales by tenants result in reaching
breakpoint levels, which ultimately therefore translates into the generation of
variable rental. The Urban Land Institute (ULI) (Appendix 9.8) presents tenant
© 2014 University of Pretoria. All rights reserved. The copyright in this work vests in the University of Pretoria

25 | P a g e
categories which can be used to track and forecast turnover growth from
different angles within the shopping centre.
Meija and Benjamin (2002) attributed the growth of turnover levels in a shopping
centre to aspects such as tenant mix and the image of individual retailers.
According Grewal et al (2009), however, higher turnover is a function of superior
customer experience and superior customer experience is defined as including
every point at which the shopper interfaces with the product or service as
connected to the mall. Grewal et al (2009), therefore, offers a broader
perspective which, by implication, includes not just harder factors such as the
number of reputable retailers present in the mall, but also softer factors such the
entire service experience enjoyed during the journey of shopping.
On the theme of cost reduction, according to Resilient Property Fund (2013),
operating costs remain topical in the retail environment, the implication being
that of earnings’ erosion if costs’ increases are not properly managed. Efficiency
in operations helps in reducing overall costs of running the shopping centre. The
aspect of innovation in the area of facilities management, for example energy
saving initiatives, impacts the process of cost reduction. According to
Franceschini, Galetto and Turina (2013), the learning and growth perspective of
the BSC, in the form of research and development initiatives, promotes
innovation.
Positive asset utilization measures are dependent on the attainment of rental
growth rates that exceed expenditure growth rates. According to Drury (2009),
asset utilization measures include measures such as Return on Investment
(ROI) and Economic Value Added (EVA).
2.5.3 Customer Perspective
According to Drury (2009), this perspective is concerned with identifying
measures that will promote superior customer experience. As stated by Grewal
© 2014 University of Pretoria. All rights reserved. The copyright in this work vests in the University of Pretoria

26 | P a g e
et al (2009), attainment of superior customer experience results in positive
economic benefits and by implication the attainment of increased variable rental
levels.
In analysing the influence of Centre Management on retail performance, Kaiser
(2005) stated that, in order to attain asset performance, institutional investors
need to choose their centre managers carefully. Verhoef, Lemon, Parasuraman,
Roggeveen, Tsiros, and Schlesinger (2009) pointed out that superior customer
experience is a function of both controllable and uncontrollable factors.
Therefore, the appointment of a quality centre management team is expected to
result in the optimal selection of performance-enhancing strategic initiatives, for
example, a competitive tenant mix strategy.
The efficacy of a tenant mix strategy is something that is within the influence of
the centre management team. This can be achieved through careful selection of
tenants for the target consumer segment (differentiation) during the process of
filling out vacancies in the mall (Allard et al, 2009). According to Meija and
Benjamin (2002), tenant mix is about both the image of the tenants assembled
as well as the mix.
Apart from clustering and dispersion, which refers to the agglomeration of
tenants across the shopping mall, Carter and Haloupek (2002) stated that there
is a common sense dimension to tenant mix. In order to preserve the mix of
tenants, for instance, the centre management team might stagger lease expiry
dates so as to minimise risk of vacation by same category tenants. The
successful execution of this strategic initiative is likely to result in enhanced
future expected returns.
2.5.4 Internal Business Process
In the context of retail, the internal business process perspective of the BSC
requires the centre management team to identify critical internal business
© 2014 University of Pretoria. All rights reserved. The copyright in this work vests in the University of Pretoria

27 | P a g e
processes that will impact the financial and customer perspective (Drury, 2009).
The attainment of this objective, however, will rely strongly on the judgement of
the centre management team.
With regards to this perspective, any judgement by the centre management team
needs to be aligned to the attainment of superior customer experience. Internal
business processes, for instance, must be capable of highlighting customer
complaints, and according to Mittal et al (2008), businesses are interested in the
antecedents of customer complaints. A customer compliant serves as an
opportunity to the landlord to address any shortcomings that could have
otherwise resulted in customer loss to competitors. Therefore, in order to protect
the future performance of a business, complaints identification mechanisms must
be functional.
2.5.5 Learning and Growth
This perspective is concerned with the entity’s infrastructural development
(people, systems, and organisational procedures), and seeks to facilitate the
accomplishment of the other three perspectives (Drury, 2009). Therefore, this
perspective is concerned with the creation of a retail environment where
innovation thrives in order to meet the ever changing customer needs.
According to Grewal et al (2009), a cardinal aspect to retailing is that of making a
connection with customers in order to understand and satisfy their needs.
As discussed before, Yuan and Krishna (2008) highlighted the problem of the
increasing incidents of sales leakage as very topical in the retail environment.
Therefore, one challenge confronting landlords is how to protect retail
performance in the form of devising innovative ways that will curb the incidence
of sales leakage.
Internal business processes might also identify customer complaints that affect
tenants’ staff. This paradigm might require the centre management team to
© 2014 University of Pretoria. All rights reserved. The copyright in this work vests in the University of Pretoria
28 | P a g e
prescribe customer-facing training programmes for tenants’ staff. The attainment
of this perspective, however, relies on good judgement by the centre
management team.
2.6 Conclusion
Chapter Two established a theoretical framework of reference that informed this
commercial property investment decision making study. The chapter explored a
body of literature addressing the inherent risks associated with investment
decision making processes. Decision making frameworks currently in use were
also reviewed.
The focus of the study is on retail investment decision making processes in
particular, the investment decision stage concerned with forecasting expected
returns. In this regard, it was argued that current frameworks are inadequate for
retail investment decision making processes. In forecasting expected returns,
decision making frameworks currently in use rely on quantitative information. Yet
the antecedents of performance in a shopping mall are nonfinancial factors that
are centred on delivering superior customer experience.
This research study therefore seeks to fill the gap in retail investment decisions
frameworks as a result of the reliance on financial factors when forecasting
expected returns. In order to test proposed hypotheses, the study uses the BSC
framework, in a South African context. To this end, the following chapter,
Chapter Three, presents the research hypotheses.
© 2014 University of Pretoria. All rights reserved. The copyright in this work vests in the University of Pretoria

29 | P a g e
3 Chapter 3 - Research Hypotheses
3.1 Introduction
The main aim of this study was to ascertain whether the use of nonfinancial
measures of performance, using a BSC framework, can aid investment decision
when forecasting retail future returns. To conduct the study, individuals with
asset management oversight were selected from contributors to the SAPOA /
IPD South Africa Annual Property Index as at December 2012.
The literature reviewed in Chapter Two discussed why institutional investors
dominate when it comes to investment in commercial property. In order to
execute investment decisions, however, institutional investors rely on the
investment skills possessed by the individuals selected for this study.
The literature reviewed in Chapter Two also highlighted the following about
institutional investors:
o The investment decision stage concerned with forecasting expected
returns ranks highly in normative decision making frameworks;
o Institutional investors globalise because of the need to diversify their
portfolios; and
o Market Values (MVs) obtained through the services of a professional
valuer are subjective due to the influence of bias behaviour during the
process of valuation.
To this end, in addition to the main aim of the study, the above points were also
investigated.
© 2014 University of Pretoria. All rights reserved. The copyright in this work vests in the University of Pretoria

30 | P a g e
3.2 Research Hypotheses
Hypothesis 1: Institutional investors perceive the stage concerned with
forecasting expected returns important in investment decision
making processes.
Hypothesis 2: Nonfinancial factors are regarded as important by institutional
investors when forecasting expected returns in retail decision
making processes.
Hypothesis 3: Institutional investors perceive Market Values (MVs) derived
through professional valuation processes as subjective.
Hypothesis 4: Institutional investors diversify portfolios based on geographic
location and the property type.
Based on the theories and literature presented in Chapter two, a total of four (4)
hypotheses were formulated for investigation in this chapter. The research
methodology followed in order to test the above hypotheses is explained in the
following chapter, Chapter four.
© 2014 University of Pretoria. All rights reserved. The copyright in this work vests in the University of Pretoria

31 | P a g e
4 Chapter 4 – Research Methodology
4.1 Choice of Methodology
In order to achieve the objectives of the study, this research followed a
quantitative descriptive approach using a questionnaire research tool, distributed
electronically using SurveyMonkey. Appendix 9.9 presents the Draft
Questionnaire used for the research and Figure 4.1 presents an overview of the
research process adopted for the study.
Figure 4.1: Overview of research methodology (Zikmund, 2003)
4.1.1 Use of Survey Method
According to Saunders and Lewis (2012), a questionnaire is tool of data
collection which asks each participant the same set of questions in the same
order. Leedy and Ormond (2010) posit that a questionnaire method has the
© 2014 University of Pretoria. All rights reserved. The copyright in this work vests in the University of Pretoria

32 | P a g e
ability of being sent to a large number of people efficiently and in a cost effective
manner. Given the limited time available to conduct the study, coupled with
budgetary constraints, the data collection method and instrument chosen for the
study was therefore considered appropriate.
In the property decision making paradigm, a number of surveys were conducted
using the questionnaire method of data collection. French (2001) used a survey
to solicit the opinions and expectations of respondents regarding inflation,
property returns and the correlations with other assets classes such bonds and
equity. Farragher and Savage (2008) used a survey to conduct research on the
whole decision making framework. In the study, 188 questionnaires were mailed
to respondents, and a response rate of 23 percent was obtained.
This study posits certain similarities with the research conducted by Farragher
and Savage (2008). The authors surveyed institutional investors using
questionnaires which were mailed to participants. As discussed above, the study
by these authors focussed on the entire decision making framework. In this
study, however, the focus was on the investment stage concerned with
forecasting expected returns. The study also distributed questionnaires
electronically using SurveyMonkey as opposed to mailing participants.
Furthermore, this study was centred on the retail sector as opposed to the
broader real estate industry.
Consideration was given by the researcher to conduct face-to-face interviews
with the participants. Leedy and Ormond (2010) argued that data collected
through the internet yields comparable results to that collected face-to-face.
Therefore, apart conducting the study under time and budgetary constraints, the
choice of method selected was deemed appropriate to achieve the stated
objectives.
© 2014 University of Pretoria. All rights reserved. The copyright in this work vests in the University of Pretoria

33 | P a g e
4.1.2 Questionnaire Development
The questionnaire was designed in manner that helps achieve the objectives of
the study. Before sending out the questionnaire to participants, a pilot study was
conducted using one of the participants. According to Saunders and Lewis
(2012), the advantage of conducting a pilot study is that the process helps in
testing the understanding of the questions being posed to participants hence
validate the instrument.
The institutional investor selected for the pilot study was selected because it was
a major local player in the retail sector, and had a significant shareholding in
Three of the only Nine Super Regional Malls in South Africa (See Appendix 9.10
for Shopping Centre classification). This institution also differentiated itself in that
it only invested in local retail property, and therefore had no investment interest
in the other property sectors. No amendments were made to the questionnaire
during the process of conducting the pilot study.
A covering letter was also emailed to participants together with the questionnaire
(See Appendix 9.11). The purpose of the covering letter was to seek permission
for participation by respondents while also clarifying the aims of the study and
the criteria used to identify participants to the study.
4.1.3 Contents of the Questionnaire
The questionnaire was designed with brevity so as to enable ease of completion
by respondents and was divided into four (4) parts.
Part 1 – Personal Information: Part 1 of the questionnaire was designed to
ensure that the individual selected to participate in the survey possessed the
requisite investment decision making authority. The questionnaire included
open-ended and closed-ended questions on the respondent’s job title, brief
description of functions of current position, years in the commercial property
© 2014 University of Pretoria. All rights reserved. The copyright in this work vests in the University of Pretoria

34 | P a g e
industry, years in retail at the current institution, and the level of academic
achievement by the respondent.
Part 2 – Portfolio Information: Part 2 of the questionnaire was designed to
obtain information about the commercial property portfolio of the institution. This
section contained only closed-ended questions, and covered the size of the
portfolio, global geographical split of the portfolio, the property sectors invested
in, and the size of retail investment. Respondents were also asked to profile their
institution’s diversification strategy.
Part 3 – Investment Decision Making: Part 3 of the questionnaire centred on
the investment process followed when faced with a decision to acquire a
shopping centre asset. As discussed in Chapter Two, the work of professional
valuation forms an integral part in the process of MV determination. Question 12,
therefore, was meant to solicit views of respondents on the work of a
professional valuer, and posed some closed-ended questions. For Question 13 –
16, respondents were asked to assume that they were faced with an investment
decision concerning the acquisition of a Community Shopping Centre. Question
13 asked respondents to pick the Top 4 important investment decision stages in
Farragher and Savage’s (2008) framework. The rationale behind Question 13
was to assess if the investment stage concerned with forecasting expected
returns will be prioritised as important by the respondents. Question 14 dealt with
financial ratios that indicate future financial performance, and Question 15 gave
respondents an opportunity to suggest any other ratios not mentioned in
Question 14. Question 16 dealt with the importance of the tenant mix concept, as
well as the role of Centre Management in influencing future retail performance.
Part 4 – Conclusion: Part 4 formed the conclusion and asked respondents to
suggest any other retail areas that warrant future research. Lastly, respondents
were thanked for their participation in the study.
© 2014 University of Pretoria. All rights reserved. The copyright in this work vests in the University of Pretoria
35 | P a g e
4.2 Population
According to Saunders and Lewis (2012), a population is any complete group of
members with similar characteristics and need not be persons. The study aimed
to investigate investment decision making processes of South African
institutional investors, who also happen to be significant players in the local retail
property market. Therefore, the population and population criteria were set in
order to meet the objectives of the study.
According to Zikmund (2000), when conducting a study the target population is
often different from the sampling frame (also referred to as the working
population). The working population provides a list that can be used to conduct
the study operationally. The following characteristics define the working
population selected for this study:
The population consisted of all companies and funds that were contributors to
the SAPOA/IPD South Africa Property Index for the year 2012. Contribution
to the Index was not mandatory and therefore it was anticipated that some
institutional would not be represented on the Index. For instance, a number of
institutional investors with a presence on the Listed Sector were not part of
the contributors to the SAPOA/IPD Index (See Appendix 9.2). MNPCs make
use of the IPD Index to compare global performance trends across markets
(De Wit, 2010), and therefore the population chosen for the study was
justified.
The total capital value of property to the Index was R206bn compared to a
market capitalisation of about R231bn on the Listed Sector, according to
McGregor BFA (See Appendix 9.1 & 9.2). Further, insight obtained from
websites of some of these players revealed global property investment
interests in Australia, Europe, and Africa. About 60 per cent of the total
capital value to the Index represented retail property investment.
© 2014 University of Pretoria. All rights reserved. The copyright in this work vests in the University of Pretoria

36 | P a g e
The total initial number of contributors to the Index was 21; however, a
subsequent ownership verification exercise revealed the existence of dual
ownership in some of the funds and properties. Therefore, after taking into
account funds owned by the same owner(s), the population size was reduced
to only 16 participants. Furthermore, it was established that one contributor
represented a Super Regional Centre that was owned in a Joint Venture
structure (JV) by two other companies who were already individual
contributors to the Index. Finally, for purposes of the study, the population
size was reduced to only 15 participants.
4.3 Sampling and Sampling Unit
According to Saunders and Lewis (2012), a sample is a group of elements
selected from the population. For purposes of this study, however, the working
population of 15 contributors was used as the sample for the study. The study
therefore followed a nonprobability purposive method because the researcher
concluded that the list of contributors to the Index was information-rich enough to
allow the study to proceed, as justified under Section 4.2 above.
Zikmund (2000) defined a sampling unit as a single element or a group of
elements within a sample that is /are subject to selection. The study assumed
that for purposes of making an investment decision in a retail setting, a group of
individuals are usually collectively involved in the process given the relatively
high cost associated with shopping mall acquisition. Therefore, only individuals
judged to be part of each institution’s investment decision making processes
were invited to participate in the study.
Out of the working population of 15 contributors, only 12 contributors were
emailed invites to participate to the survey. In order to increase the chances of a
higher response rate, it was planned that questionnaires will be sent to two
participants in each institution, and thus a total of 24 questionnaires were
planned to be emailed through SurveyMonkey. Four institutional investors
© 2014 University of Pretoria. All rights reserved. The copyright in this work vests in the University of Pretoria

37 | P a g e
declined to allow another individual to participate in the study, hence a total
number of 20 questionnaires were actually sent out.
As mentioned above, only 12 institutions were sent questionnaires out of the
working population of 15 contributors to the Index. In an effort to establish the
profile of the Three institutions which were left out of the study, it was
established that the one contributor was made up of a scheme by some high net-
worth individuals investing in shopping centres, the management of which was
subcontracted to one of SA’s top property management company. The other two
contributors to the Index simply declined to participate to the study. IPD South
Africa also declined to reveal any information on the commercial property values
of these non-partaking contributors due to confidentiality agreements signed with
contributors to the Index.
4.4 Data Analysis
According to Fowler (2009), raw data collected through a survey needs to be
translated into an appropriate form in order to facilitate meaningful analyses of
the results. In this study, the data obtained was downloaded from SurveyMonkey
into an Excel format file, which in turn facilitated the upload into Statistical
Package for Social Sciences software package (SPSS). Statistical techniques
were then used to analyse the data.
Hitherto, there is a plethora of statistical techniques that can be used to aid the
analysis of data. For purposes of this study, however, only the following
techniques were utilised to test the statistical relevance of the variables.
Cronbach’s Alpha
Shapiro-Wilk
Descriptive Statistics
The individual statistical techniques are explained herein below:
© 2014 University of Pretoria. All rights reserved. The copyright in this work vests in the University of Pretoria

38 | P a g e
4.4.1 Cronbach’s Alpha
Cronbach’s Alpha is a measure of internal consistency of a list of items within a
group. According to Tavakol and Dennick (2011), because researchers are
worried about the accuracy of their assessment and evaluation, there is
therefore a need to check for validity and reliability of a measurement instrument.
According to Julie (2007), Cronbach’s Alpha is concerned with the extent to
which items within a scale ‘hang together’, namely that all the items within a
scale measure the same construct.
The number of items in a group, their inter-relatedness, and their dimensionality
affects the value of alpha (Julie, 2007; Tavakol and Dennick, 2011). An increase
in the number of items in a group leads to an increase in the value of alpha,
however, a lower inter-item correlation reduces the value of alpha. Therefore, a
group with a high number of inter-related items will result in a higher value of
alpha. Julie (2007) posits that the ideal value of alpha should be above 0.7.
According to Tavakol and Dennick (2011), however, an alpha value that is close
to 0.6 is still acceptable, and thus making the group items valid for statistical
interpretation.
It is imperative to calculate the Cronbach’s Alpha coefficient where a study
utilises Likert-Style questions (Gliem and Gliem, 2003). In this study, there are a
number of questions posed to respondents that assume the Likert-Style format.
4.4.2 Shapiro-Wilk
The sample used in this study was less than 30 (n<30) because of the smaller
number of participants in the South African commercial property market.
According to Weiers (2011), where a sample size of less than 30 is used, there
is a requirement to assume that the population is normally distributed.
The Shapiro-Wilk Test was developed by Shapiro and Wilk (1965), the purpose
of which was to test for the complete normality of a sample. Shapiro and Wilk
© 2014 University of Pretoria. All rights reserved. The copyright in this work vests in the University of Pretoria

39 | P a g e
(1965) reasoned that many statistical procedures were based on the assumption
of normality, hence a need to develop a tool that will test the normality of a
sample. If the normality assumption is violated, the interpretation and inferences
made on the study may not be reliable and valid (Razali and Wah, 2011).
According to Razali and Wah (2011), the test was initially designed to cater for
smaller samples (n<50), however, subsequent improvements made by other
researchers have also catered for larger samples (n>50). In their study, where
the power of the different available normality tests were compared, Razali and
Wah (2011) concluded that the Shapiro-Wilk Test was the most powerful test for
all types of distribution and sample sizes.
The value of the test (W) lies between 0 and 1. Values of W approaching the
value of 1 result in the acceptance of normality, while small vales of W lead to
the rejection of normality.
4.4.3 Descriptive Statistics
In order to give meaning to the data, categorical as well as continuous variables
descriptive statistics were used in this study. Categorical variables make use of
frequencies (Julie, 2007), and in this study the Job Tiles and Job Functions
occupied by respondents were cross-tabulated together with other important
data. According to Julie (2007), continuous variables aid the researcher by
providing summary statistics, for instance the mean, median, and standard
deviation. In this study, mean scores were calculated in order to obtain the
positional view of respondents on the questions asked. Some categorical
variables were collapsed into smaller groupings in order to allow for shorter, but
still insightful, interpretation of the data.
Farragher and Savage (2008) used descriptive statistics in order to investigate
the whole investment decision making framework. This study used descriptive
statistics in order to make conclusions about the stage concerned with
© 2014 University of Pretoria. All rights reserved. The copyright in this work vests in the University of Pretoria
40 | P a g e
Forecasting expected returns in the investment decision framework. Therefore,
the choice of data analysis tools employed in this study was justified.
4.5 Assumptions
The following assumptions are applicable to the study:
That the respondents to the study answered the questionnaire truthfully, and
without any form of bias, in particular where both respondents in the one
institution returned the completed questionnaire. At the time of conducting the
study, the GIBS MBA brand had also made strides in international rankings
compared to other business schools in the continent (Financial Mail, 2013).
Therefore, an assumption was also made that such recognition did not
influence the answers given by respondents; and
That SA’s institutional investors employ rational investment frameworks
similar to Farragher and Savage’s (2008) when faced with an investment
decision and that behavioural influence, as discussed in Chapter Two, play
an insignificant role when making the investment decision.
4.6 Research Limitations
The following limitations were identified as applicable to the study:
The main limitation to the study relates to the sample size (n=12). In spite of
South Africa’s position as the gateway to Africa, the country is an emerging
economy still in the process of reintegrating itself into the world economy
following years of political isolation as a result of past repressive laws.
Therefore, the number of commercial property institutional investors in the
country is quite limited. Furthermore, in the recent past, media reports have
reported heightened mergers and acquisitions activity in the real estate
industry locally (eProp, 2013), which in turn will further reduce the number of
investors in the market. Nevertheless, the fact that the value of commercial
© 2014 University of Pretoria. All rights reserved. The copyright in this work vests in the University of Pretoria

41 | P a g e
property held by contributors to the Index stood at R206bn, when the Listed
Sector was at R231bn, rendered the data both presentable and reliable. The
size of the sample, however, presented limitations to the number of statistical
measures employed to interpret the results of the study.
In the study by Farragher and Savage (2008), certain differences were
identified between institutional investors and private investors. Private
investors were defined to be relatively small investors as opposed to financial
behemoths like insurance and pension funds. The South African property
market is replete with a number of influential private investors; however, none
was represented in the list of contributors to the Index. Therefore, there might
be an argument that the results of the study lack the investment views of
private investors, which views might offer invaluable insights into the
understanding of SA’s commercial property market.
The study was conducted during the last quarter of the calendar year, which
was also the last quarter of the financial year for most of the participating
institutions, according to information gathered during questionnaire follow-up
with respondents. Therefore, it could be possible that not the full attention to
the process was given by respondents, as was perhaps viewed as a
distraction to year end tasks.
A number of the institutional investors selected for the study also had in-
house professional valuation departments yet the questionnaire did not solicit
such indication from participants. It could be argued that Institutional
investors with professional valuation services in-house might have taken a
less critical view on the services of the professional valuer.
Lastly, it was discovered during the research process that a number of cross-
shareholdings existed among South African property institutions. In this
regard, it can be argued that there could be a convergence of investment
philosophies among these investors, and therefore result in the lack of
variance in the responses provided by participants.
© 2014 University of Pretoria. All rights reserved. The copyright in this work vests in the University of Pretoria
42 | P a g e
4.7 Validity and Reliability
According to Saunders and Lewis (2012), validity is concerned with the question
of whether or not the methods employed for the research measure what they
were intended to measure. As mentioned earlier, Part 1 of the questionnaire
dealt with background information of the participant. In this regard, in order to
ensure validity, only responses from participants occupying investment decision
making positions were included in the results.
Saunders and Lewis (2012) define reliability in relation to the ability of the
research methods used in producing consistent findings. According to Zikmund
(2000), questions posed to respondents which are unclear, ambiguous, or
leading in nature, can jeopardise the reliability of research work, and efforts to
prevent such pitfall were taken in this study. Prior to the pretesting of the
reliability of the questionnaire with the institutional investor mentioned under
Section 4.1.2 above, the researcher personally answered the questionnaire
through the use of a dummy email address, and a number of corrections were
made. Further, in order to eliminate the occurrence of missing data on key
sections, selected questions of the questionnaire were made compulsory.
Farragher and Savage’s (2008) research work found certain differences between
the investment philosophies of institutional investors and private investors. As
mentioned earlier, this study focussed only on institutional investors and
therefore cannot be generalised to also include private investors. In summary,
therefore, the validity and reliability of this study is only limited to SA’s
institutional investors.
4.8 Summary
In conclusion, this chapter discussed the methodology adopted in testing the
hypotheses presented in Chapter Three. Contributors to the SAPOA/IPD Index
defined the working population for the study. The South African property market,
however, is characterised by the presence of a few players in the commercial
© 2014 University of Pretoria. All rights reserved. The copyright in this work vests in the University of Pretoria

43 | P a g e
property space. In this regard, and in order to analyse the data, the small
number of investors limited the study to a select few statistical techniques. The
research findings and interpretations thereto are presented in the following two
chapters respectively.
© 2014 University of Pretoria. All rights reserved. The copyright in this work vests in the University of Pretoria
44 | P a g e
5 Chapter 5 – Research Results
5.1 Introduction to Results
Chapter Four presented a description of the methodology adopted by this study
to test the hypotheses outlined in Chapter Three. In this chapter, the results of
the study are presented in accordance with the statistical methods outlined in
Chapter Four. Following this chapter is Chapter Six which analyses the results
presented in Chapter Five, while also synthesising theory and literature
discussed in Chapter Two.
5.2 Documentation of Response Rate
As discussed under Section 4.3 above, a total of 20 questionnaires were
emailed to respondents representing 12 contributors to the Index. A total of 11
questionnaires representing 11 contributors were completed by respondents. Of
the 11 questionnaires received from respondents, 64 per cent (7) of the
respondents had skipped at least one of the only two optional questions in the
questionnaire (Question 15 and 17).
Measured against the total of 20 questionnaires emailed to respondents, the
response rate of 11 respondents represented a 55 percent response rate. One
questionnaire emailed to a CIO was completed by an Analyst employee behalf of
the initially targeted respondent. Therefore, this feedback was discarded as it did
not meet the criteria of a respondent outlined in Chapter Four. This further
dropped the response rate to 50 percent (10). Efforts to increase the response
rate in this regard were met with a common answer across respondents, namely
that a dual response amounts to duplication. An 83 percentage response rate,
however, was achieved when measured against the 12 contributors emailed
questionnaires for the study. The response rate, therefore, was considered to be
acceptably representative of the sample selected for the study.
© 2014 University of Pretoria. All rights reserved. The copyright in this work vests in the University of Pretoria

45 | P a g e
5.3 Sample Characteristics
5.3.1 The Respondents
Question 1 and Question 2 of the questionnaire were open-ended compulsory
questions that solicited the Job Title, and a brief Job Description of the
respondent respectively. Responses obtained from participants in Question 2
were categorised into Two (2) areas of responsibility:
Category 1: The responsibility to drive retail performance through other
managers; and
Category 2: The responsibility to drive retail performance through other
managers, including decision-making on retail acquisitions,
sales, extensions and redevelopment.
Table 5.1: Job Title and Job Function of Respondents
Job Title
Job
Function
Frequency
%age
Chief Investment Officer Category 2 2 20
Fund Manager Category 2 3 30
Asset Manager Category 1 5 50
Total 10
100%
Table 5.2: Profile of Achieved Highest Academic Qualification
Job Title
Frequency
%age
Matric 2 20
Undergraduate 4 40
Postgraduate 4 40
Total 10
100%
© 2014 University of Pretoria. All rights reserved. The copyright in this work vests in the University of Pretoria

46 | P a g e
Table 5.1 reflects an even split of Five individuals between the Two Categories,
while Table 5.2 reflects that 80 percent of the participants had at least an
undergraduate degree.
Table 5.3: Experience Descriptive Statistics of Respondents
Experience (years)
n
Mean
Median
Mode
Standard deviation
Min
Max
Commercial Property 10 15.4 15.5 6* 5.719 6 25
Retail 10 8.4 9.5 4* 3.627 3 14
*multiple modes exist, smallest value reported
For commercial property experience, the aggregate total experience of
respondents equals 154 years, while retail experience amounts to 56 years.
5.3.2 The Institutional Investors
All 10 institutions operate in the South African market, while only Four institutions
also have representation elsewhere in Africa, and a further Three institutions
also operating outside of Africa. All 10 institutions have a retail component in
their portfolios, while 80 percent of institutions also operate in C&I Sectors, the
balance of 20 percent also investing in other property sectors, such as Leisure
and Residential.
The total global retail investment exposure by these institutional investors is
presented in Tables 5.4 and 5.5 below:
© 2014 University of Pretoria. All rights reserved. The copyright in this work vests in the University of Pretoria
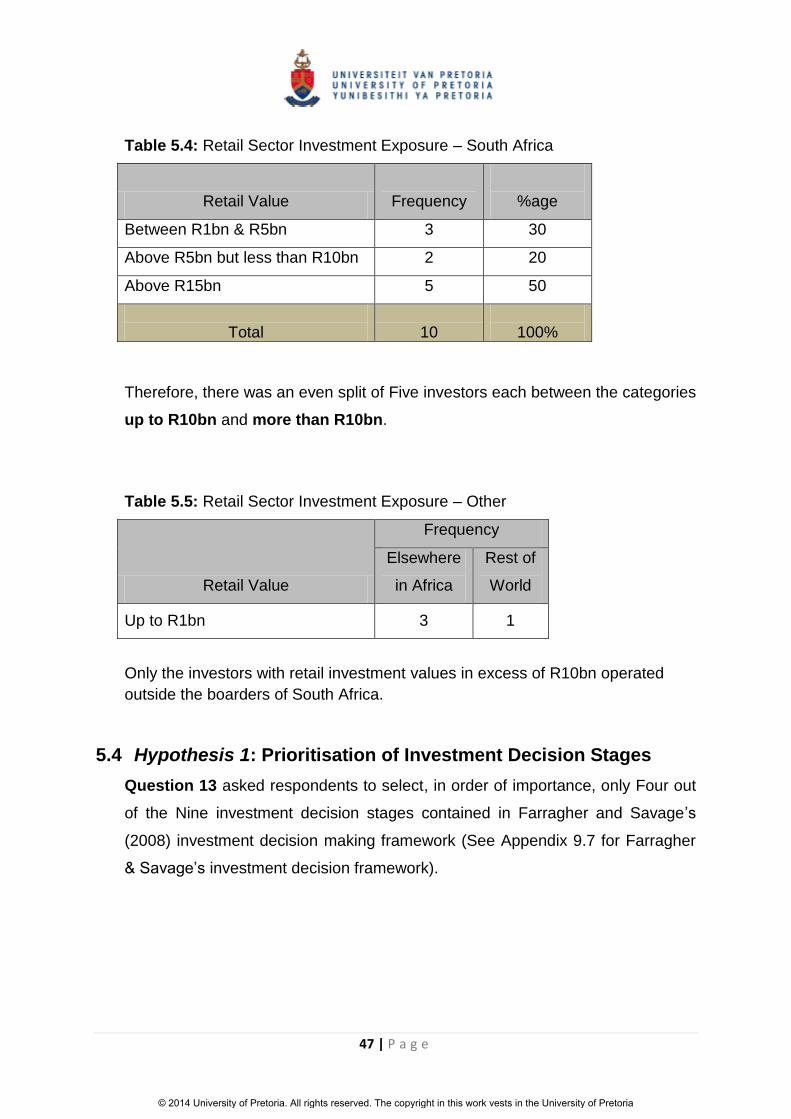
47 | P a g e
Table 5.4: Retail Sector Investment Exposure – South Africa
Retail Value
Frequency
%age
Between R1bn & R5bn 3 30
Above R5bn but less than R10bn 2 20
Above R15bn 5 50
Total 10
100%
Therefore, there was an even split of Five investors each between the categories
up to R10bn and more than R10bn.
Table 5.5: Retail Sector Investment Exposure – Other
Retail Value
Frequency
Elsewhere
in Africa
Rest of
World
Up to R1bn 3 1
Only the investors with retail investment values in excess of R10bn operated
outside the boarders of South Africa.
5.4 Hypothesis 1: Prioritisation of Investment Decision Stages
Question 13 asked respondents to select, in order of importance, only Four out
of the Nine investment decision stages contained in Farragher and Savage’s
(2008) investment decision making framework (See Appendix 9.7 for Farragher
& Savage’s investment decision framework).
© 2014 University of Pretoria. All rights reserved. The copyright in this work vests in the University of Pretoria

48 | P a g e
Table 5.6: Distribution of Investment Stage Rankings by Respondents
Stage No.
Detail
Top
Priority
Priority No. 2
Priority No. 3
Priority No. 4
Total
1
Setting Strategy
8
0
0
0
8
2 Establishing Return/Risk
Objectives 0 5 3 0 8
3 Searching for Investment
Opportunities 0 2 2 0 4
4 Forecasting Expected
Returns 2 1 2 1 6
5 Evaluating Forecasts 0 2 0 0 2
6 Assessing & Adjusting
for Risk 0 0 2 3 5
7 Decision-Making 0 0 1 4 5
8 Implementing Accepted
Proposals 0 0 0 1 1
9 Auditing Operating
Performance 0 0 0 0 1
The table below records the frequencies of each Stage’s selection, but split by
the investor’s exposure to the Retail sector.
Table 5.7: Rankings Split by RETAIL Property Value
Retail Value
n
Investment Stage Stage 4
Excluded
(Frequency)
1
2
3
4
5
6
7
8
9
Up to R10bn
5
5
4
3
1
0
3
3
1
0
4
More than R10bn
5
3
4
1
5
2
2
2
0
1
0
Overall 10 8 8 4 6 2 5 5 1 1 4
© 2014 University of Pretoria. All rights reserved. The copyright in this work vests in the University of Pretoria
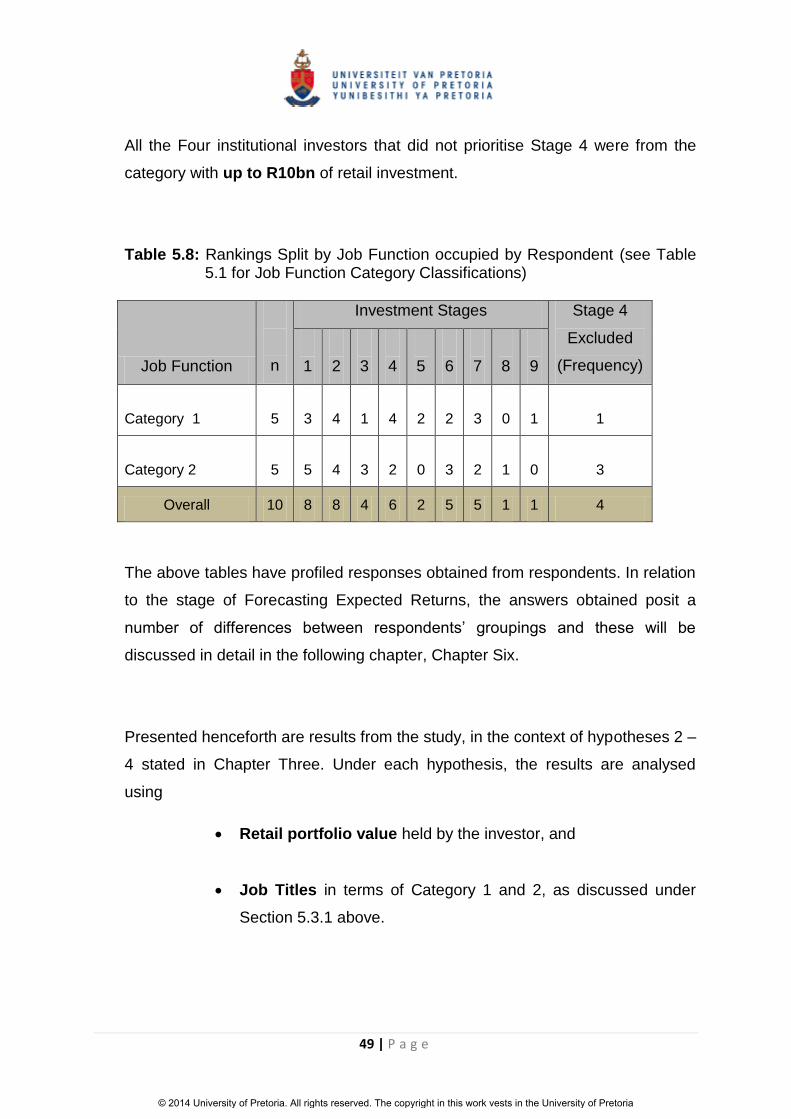
49 | P a g e
All the Four institutional investors that did not prioritise Stage 4 were from the
category with up to R10bn of retail investment.
Table 5.8: Rankings Split by Job Function occupied by Respondent (see Table 5.1 for Job Function Category Classifications)
Job Function
n
Investment Stages Stage 4
Excluded
(Frequency)
1
2
3
4
5
6
7
8
9
Category 1
5
3
4
1
4
2
2
3
0
1
1
Category 2
5
5
4
3
2
0
3
2
1
0
3
Overall 10 8 8 4 6 2 5 5 1 1 4
The above tables have profiled responses obtained from respondents. In relation
to the stage of Forecasting Expected Returns, the answers obtained posit a
number of differences between respondents’ groupings and these will be
discussed in detail in the following chapter, Chapter Six.
Presented henceforth are results from the study, in the context of hypotheses 2 –
4 stated in Chapter Three. Under each hypothesis, the results are analysed
using
Retail portfolio value held by the investor, and
Job Titles in terms of Category 1 and 2, as discussed under
Section 5.3.1 above.
© 2014 University of Pretoria. All rights reserved. The copyright in this work vests in the University of Pretoria
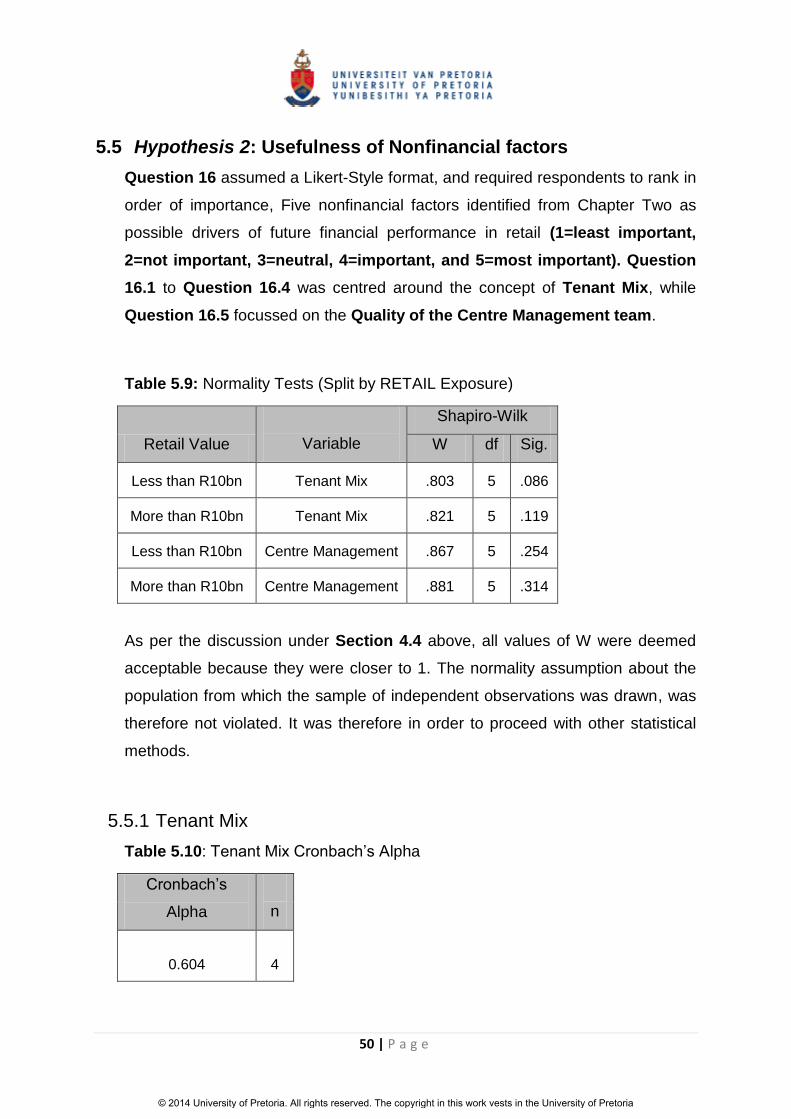
50 | P a g e
5.5 Hypothesis 2: Usefulness of Nonfinancial factors
Question 16 assumed a Likert-Style format, and required respondents to rank in
order of importance, Five nonfinancial factors identified from Chapter Two as
possible drivers of future financial performance in retail (1=least important,
2=not important, 3=neutral, 4=important, and 5=most important). Question
16.1 to Question 16.4 was centred around the concept of Tenant Mix, while
Question 16.5 focussed on the Quality of the Centre Management team.
Table 5.9: Normality Tests (Split by RETAIL Exposure)
Retail Value
Variable
Shapiro-Wilk
W df Sig.
Less than R10bn Tenant Mix .803 5 .086
More than R10bn Tenant Mix .821 5 .119
Less than R10bn Centre Management .867 5 .254
More than R10bn Centre Management .881 5 .314
As per the discussion under Section 4.4 above, all values of W were deemed
acceptable because they were closer to 1. The normality assumption about the
population from which the sample of independent observations was drawn, was
therefore not violated. It was therefore in order to proceed with other statistical
methods.
5.5.1 Tenant Mix
Table 5.10: Tenant Mix Cronbach’s Alpha
Cronbach’s
Alpha
n
0.604
4
© 2014 University of Pretoria. All rights reserved. The copyright in this work vests in the University of Pretoria

51 | P a g e
As discussed under Section 4.4, because the Cronbach’s Alpha coefficient was
above the 0.60 benchmark, reliability in the group of Tenant Mix questions was
achieved.
Table 5.11: Tenant Mix Scores (1=least important, 2=not important, 3=neutral, 4=important, & 5=most important)
Question
No.
n
Mean
Median
Mode
Standard
Deviation
Min
Max
Q16.1
10
5.00
5.00
5
.000
5
5
Q16.2 10 4.10 4.00 4 .568 3 5
Q16.3 10 3.30 3.00 3 .675 2 4
Q16.4 10 3.90 4.00 4 .568 3 5
Overall 10 4.08 4.13 4* .355 2 5
*multiple modes exist, smallest value reported
Figure 5.1: Tenant Mix Boxplot (Split by RETAIL Exposure) (1=least important, 2=not important, 3=neutral, 4=important, & 5=most important)
© 2014 University of Pretoria. All rights reserved. The copyright in this work vests in the University of Pretoria
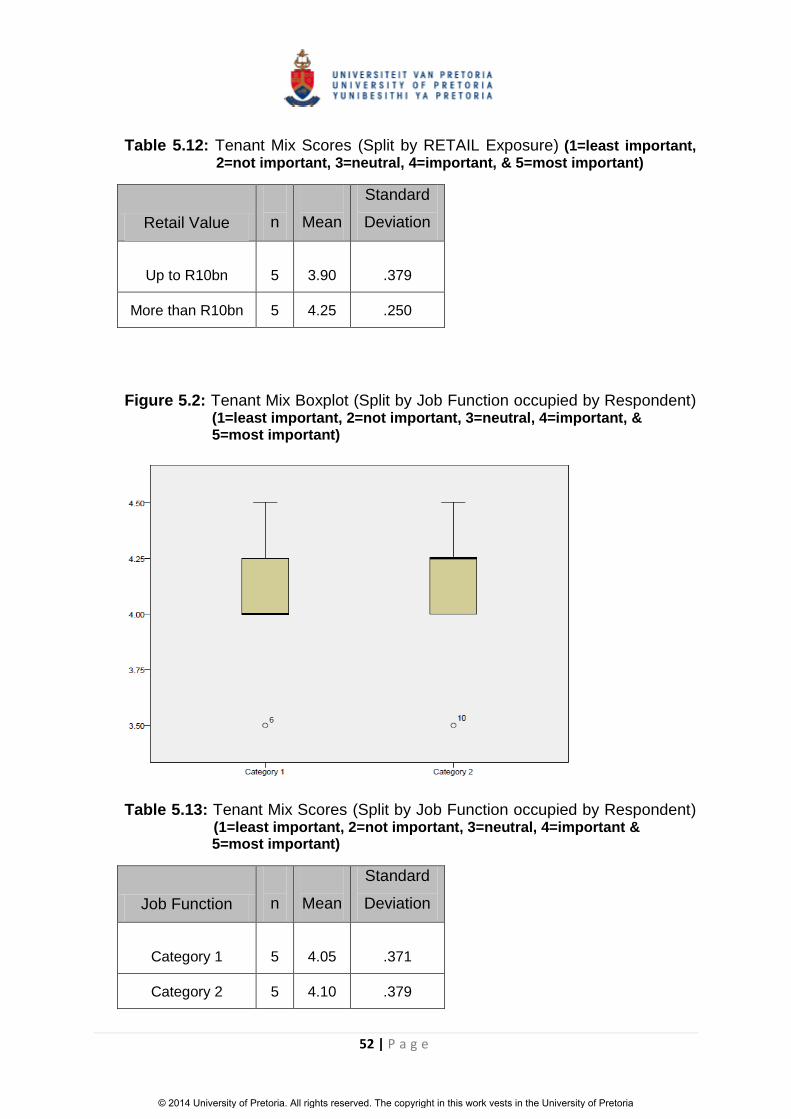
52 | P a g e
Table 5.12: Tenant Mix Scores (Split by RETAIL Exposure) (1=least important, 2=not important, 3=neutral, 4=important, & 5=most important)
Retail Value
n
Mean
Standard
Deviation
Up to R10bn
5
3.90
.379
More than R10bn 5 4.25 .250
Figure 5.2: Tenant Mix Boxplot (Split by Job Function occupied by Respondent) (1=least important, 2=not important, 3=neutral, 4=important, & 5=most important)
Table 5.13: Tenant Mix Scores (Split by Job Function occupied by Respondent) (1=least important, 2=not important, 3=neutral, 4=important & 5=most important)
Job Function
n
Mean
Standard
Deviation
Category 1
5
4.05
.371
Category 2 5 4.10 .379
© 2014 University of Pretoria. All rights reserved. The copyright in this work vests in the University of Pretoria

53 | P a g e
5.5.2 Quality of Centre Management
Question 16.5 covered a rating on the quality of the Centre Management team,
and the scores by respondents are summarised below:
Table 5.14: Centre Management Scores (1=least important, 2=not important, 3=neutral, 4=important, & 5=most important)
Question
No.
n
Mean
Median
Mode
Standard
Deviation
Min
Max
Q16.5
10
3.80
4
5
1.398
1
5
Figure 5.3: Centre Management Boxplot (Split by RETAIL Exposure) (1=least important, 2=not important, 3=neutral, 4=important, & 5=most important)
© 2014 University of Pretoria. All rights reserved. The copyright in this work vests in the University of Pretoria

54 | P a g e
Table 5.15: Centre Management Scores (Split by RETAIL Exposure) (1=least important, 2=not important, 3=neutral, 4=important, & 5=most important)
Retail Value
n
Mean
Standard
Deviation
Up to R10bn
5
3.40
1.817
More than R10bn 5 4.20 .837
Figure 5.4: Centre Management Boxplot (Split by Job Function occupied by Respondent) (1=least important, 2=not important, 3=neutral, 4=important, & 5=most important)
Table 5.16: Centre Management Scores (Split by Job Function occupied by Respondent) (1=least important, 2=not important, 3=neutral, 4=important, & 5=most important)
Job Function
n
Mean
Standard
Deviation
Category 1
5
3.80
1.304
Category 2 5 3.80 1.643
© 2014 University of Pretoria. All rights reserved. The copyright in this work vests in the University of Pretoria
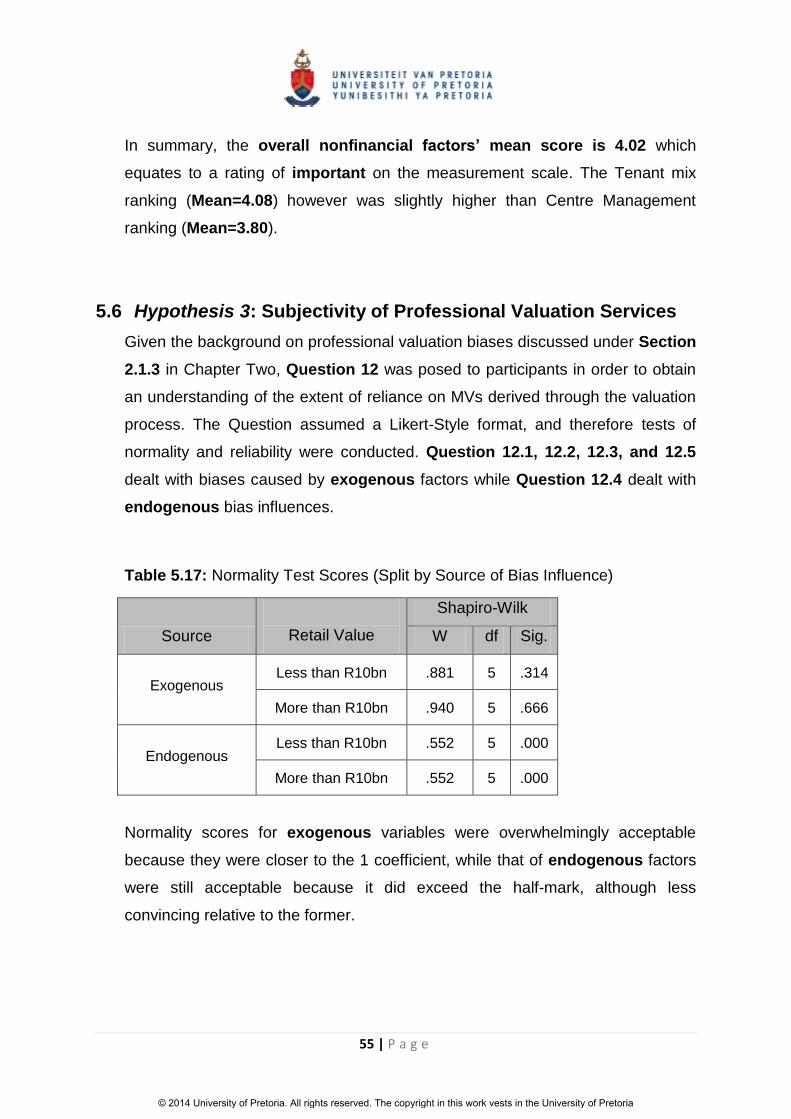
55 | P a g e
In summary, the overall nonfinancial factors’ mean score is 4.02 which
equates to a rating of important on the measurement scale. The Tenant mix
ranking (Mean=4.08) however was slightly higher than Centre Management
ranking (Mean=3.80).
5.6 Hypothesis 3: Subjectivity of Professional Valuation Services
Given the background on professional valuation biases discussed under Section
2.1.3 in Chapter Two, Question 12 was posed to participants in order to obtain
an understanding of the extent of reliance on MVs derived through the valuation
process. The Question assumed a Likert-Style format, and therefore tests of
normality and reliability were conducted. Question 12.1, 12.2, 12.3, and 12.5
dealt with biases caused by exogenous factors while Question 12.4 dealt with
endogenous bias influences.
Table 5.17: Normality Test Scores (Split by Source of Bias Influence)
Source
Retail Value
Shapiro-Wilk
W df Sig.
Exogenous Less than R10bn .881 5 .314
More than R10bn .940 5 .666
Endogenous Less than R10bn .552 5 .000
More than R10bn .552 5 .000
Normality scores for exogenous variables were overwhelmingly acceptable
because they were closer to the 1 coefficient, while that of endogenous factors
were still acceptable because it did exceed the half-mark, although less
convincing relative to the former.
© 2014 University of Pretoria. All rights reserved. The copyright in this work vests in the University of Pretoria

56 | P a g e
5.6.1 Exogenous Bias Influences
Table 5.18: Exogenous Bias Influences’ Cronbach’s Alpha
Cronbach’s
Alpha
n
0.688
4
The coefficient of Cronbach’s Alpha was therefore considered appropriate
because it was in line with the benchmark discussed under Section 4.4.1.
Table 5.19: Exogenous Bias Influences’ Scores (1=strongly agree, 2=agree, 3=neutral, 4=disagree, & 5= strongly disagree)
Question
No.
n
Mean
Median
Mode
Standard
Deviation
Min
Max
Q12.1 10 2.90 2.50 2.00 1.101 2.00 5.00
Q12.2 10 2.90 2.50 2.00 1.287 1.00 5.00
Q12.3 10 2.50 2.00 1.00* 1.434 1.00 5.00
Q12.5 10 2.90 3.00 3.00 .738 2.00 4.00
Overall 10 2.80 2.38 2.25 .840 1.00 5.00
*multiple modes exist, smallest value reported
© 2014 University of Pretoria. All rights reserved. The copyright in this work vests in the University of Pretoria
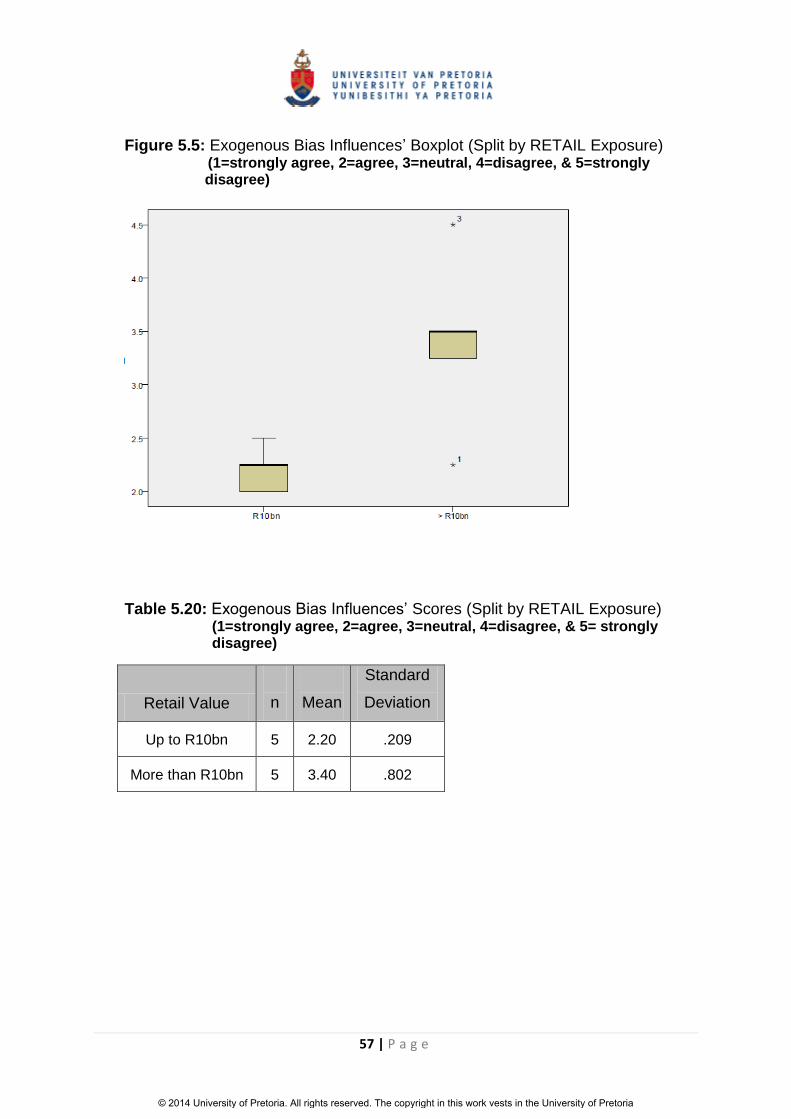
57 | P a g e
Figure 5.5: Exogenous Bias Influences’ Boxplot (Split by RETAIL Exposure) (1=strongly agree, 2=agree, 3=neutral, 4=disagree, & 5=strongly disagree)
Table 5.20: Exogenous Bias Influences’ Scores (Split by RETAIL Exposure) (1=strongly agree, 2=agree, 3=neutral, 4=disagree, & 5= strongly disagree)
Retail Value
n
Mean
Standard
Deviation
Up to R10bn 5 2.20 .209
More than R10bn 5 3.40 .802
© 2014 University of Pretoria. All rights reserved. The copyright in this work vests in the University of Pretoria

58 | P a g e
Figure 5.6: Exogenous Bias Influences’ Boxplot (Split by Job Function occupied by Respondent) (1=strongly agree, 2=agree, 3=neutral, 4=disagree, & 5= strongly disagree)
Table 5.21: Exogenous Bias Influences’ Scores (Split by Job Function occupied by Respondent) (1=strongly agree, 2=agree, 3=neutral, 4=disagree, & 5= strongly disagree)
Job Function
n
Mean
Standard
Deviation
Category 1
5
3.15
1.025
Category 2 5 2.45 .481
5.6.2 Endogenous Bias Influences
Table 5.22: Endogenous Bias Influences’ Scores (1=strongly agree, 2=agree, 3=neutral, 4=disagree, & 5= strongly disagree)
Question
No.
n
Mean
Median
Mode
Standard
Deviation
Min
Max
Q12.4 10 2.6 2.5 2 .699 2 4
© 2014 University of Pretoria. All rights reserved. The copyright in this work vests in the University of Pretoria

59 | P a g e
Figure 5.7: Endogenous Bias Influences Boxplot (Split by RETAIL Exposure) (1=strongly agree, 2=agree, 3=neutral, 4=disagree, & 5= strongly disagree)
Table 5.23: Endogenous Bias Influences’ Scores (Split by RETAIL Exposure) (1=strongly agree, 2=agree, 3=neutral, 4=disagree, & 5= strongly disagree)
Retail Value
n
Mean
Standard
Deviation
Up to R10bn 5 2.40 .894
More than R10bn 5 2.80 .447
© 2014 University of Pretoria. All rights reserved. The copyright in this work vests in the University of Pretoria
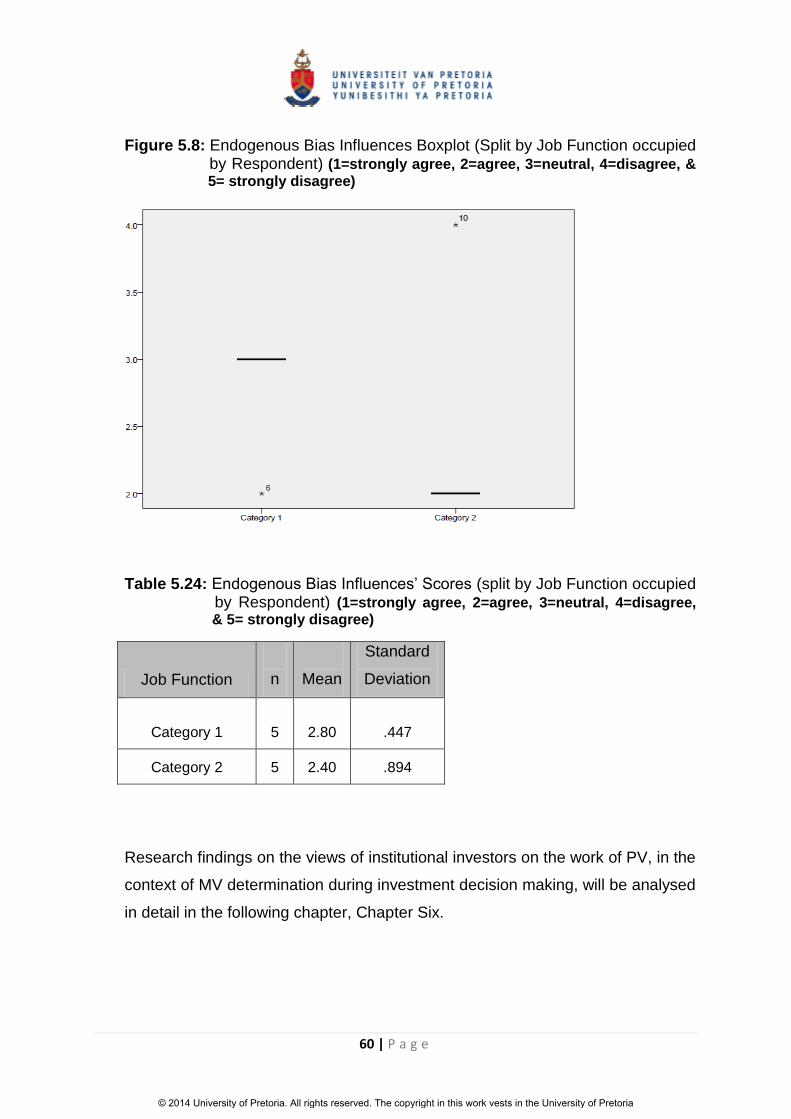
60 | P a g e
Figure 5.8: Endogenous Bias Influences Boxplot (Split by Job Function occupied by Respondent) (1=strongly agree, 2=agree, 3=neutral, 4=disagree, & 5= strongly disagree)
Table 5.24: Endogenous Bias Influences’ Scores (split by Job Function occupied by Respondent) (1=strongly agree, 2=agree, 3=neutral, 4=disagree, & 5= strongly disagree)
Job Function
n
Mean
Standard
Deviation
Category 1
5
2.80
.447
Category 2 5 2.40 .894
Research findings on the views of institutional investors on the work of PV, in the
context of MV determination during investment decision making, will be analysed
in detail in the following chapter, Chapter Six.
© 2014 University of Pretoria. All rights reserved. The copyright in this work vests in the University of Pretoria
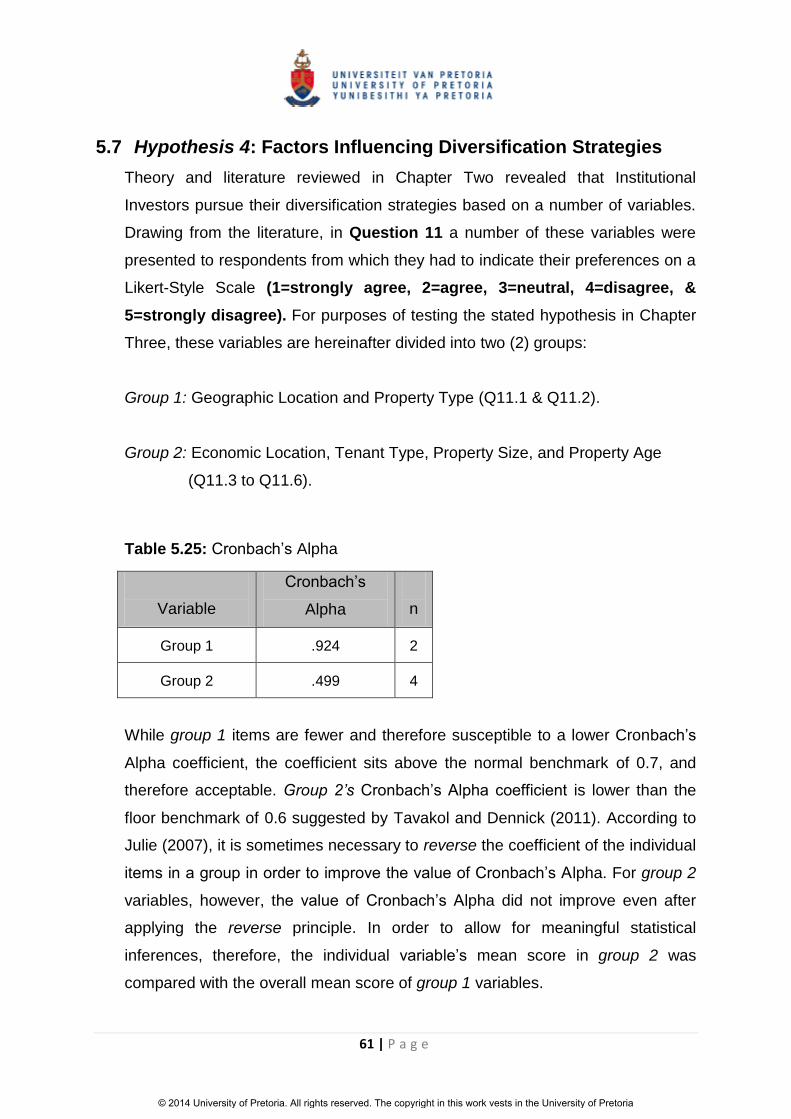
61 | P a g e
5.7 Hypothesis 4: Factors Influencing Diversification Strategies
Theory and literature reviewed in Chapter Two revealed that Institutional
Investors pursue their diversification strategies based on a number of variables.
Drawing from the literature, in Question 11 a number of these variables were
presented to respondents from which they had to indicate their preferences on a
Likert-Style Scale (1=strongly agree, 2=agree, 3=neutral, 4=disagree, &
5=strongly disagree). For purposes of testing the stated hypothesis in Chapter
Three, these variables are hereinafter divided into two (2) groups:
Group 1: Geographic Location and Property Type (Q11.1 & Q11.2).
Group 2: Economic Location, Tenant Type, Property Size, and Property Age
(Q11.3 to Q11.6).
Table 5.25: Cronbach’s Alpha
Variable
Cronbach’s
Alpha
n
Group 1 .924 2
Group 2 .499 4
While group 1 items are fewer and therefore susceptible to a lower Cronbach’s
Alpha coefficient, the coefficient sits above the normal benchmark of 0.7, and
therefore acceptable. Group 2’s Cronbach’s Alpha coefficient is lower than the
floor benchmark of 0.6 suggested by Tavakol and Dennick (2011). According to
Julie (2007), it is sometimes necessary to reverse the coefficient of the individual
items in a group in order to improve the value of Cronbach’s Alpha. For group 2
variables, however, the value of Cronbach’s Alpha did not improve even after
applying the reverse principle. In order to allow for meaningful statistical
inferences, therefore, the individual variable’s mean score in group 2 was
compared with the overall mean score of group 1 variables.
© 2014 University of Pretoria. All rights reserved. The copyright in this work vests in the University of Pretoria

62 | P a g e
Table 5.26: Normality Test Scores (Split by Diversification variable)
Variable
Retail Value
Shapiro-Wilk
W df Sig.
Group 1 Less than R10bn .881 5 .314
More than R10bn .750 5 .030
Group 2
Economic
Location
Less than R10bn .684 5 .006
More than R10bn .867 5 .254
Tenant
Type
Less than R10bn .771 5 .046
More than R10bn .552 5 .000
Property
Size
Less than R10bn .902 5 .421
More than R10bn .767 5 .042
Property
Age
Less than R10bn .883 5 .325
More than R10bn .828 5 .135
All normality scores for both groups of variables were found to be acceptable
because they were closer to the 1 coefficient.
5.7.1 Group 1 (Geographic Location and Property Type)
Table 5.27: Group 1 Scores (1=strongly agree, 2=agree, 3=neutral, 4=disagree, & 5= strongly disagree)
Question No.
n
Mean
Median
Mode
Standard
Deviation
Min
Max
Geographic
Location
Q11.1
10 2.00 2.00 2.00 1.155 1.00 5.00
Property Type
Q11.2 10 1.80 1.50 1.00 1.229 1.00 5.00
Overall 10 1.90 1.50 1.50 1.499 1.00 5.00
© 2014 University of Pretoria. All rights reserved. The copyright in this work vests in the University of Pretoria

63 | P a g e
Figure 5.9: Group 1 Variables’ Boxplot (Split by RETAIL Exposure) (1=strongly agree, 2=agree, 3=neutral, 4=disagree, & 5= strongly disagree)
Table 5.28: Group 1 Variables’ Scores (Split by RETAIL Exposure) (1=strongly agree, 2=agree, 3=neutral, 4=disagree, & 5= strongly disagree)
Retail Value
n
Mean
Standard
Deviation
Up to R10bn 5 1.60 .418
More than R10bn 5 2.20 1.605
© 2014 University of Pretoria. All rights reserved. The copyright in this work vests in the University of Pretoria
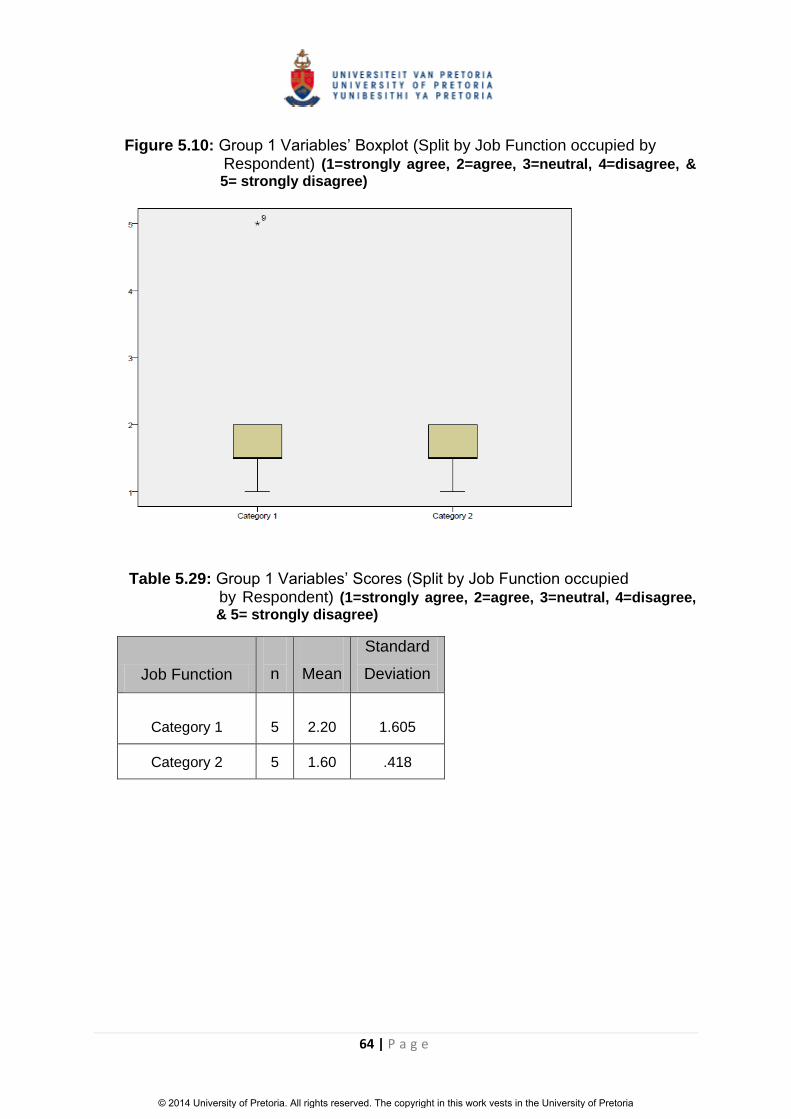
64 | P a g e
Figure 5.10: Group 1 Variables’ Boxplot (Split by Job Function occupied by Respondent) (1=strongly agree, 2=agree, 3=neutral, 4=disagree, & 5= strongly disagree)
Table 5.29: Group 1 Variables’ Scores (Split by Job Function occupied by Respondent) (1=strongly agree, 2=agree, 3=neutral, 4=disagree, & 5= strongly disagree)
Job Function
n
Mean
Standard
Deviation
Category 1
5
2.20
1.605
Category 2 5 1.60 .418
© 2014 University of Pretoria. All rights reserved. The copyright in this work vests in the University of Pretoria
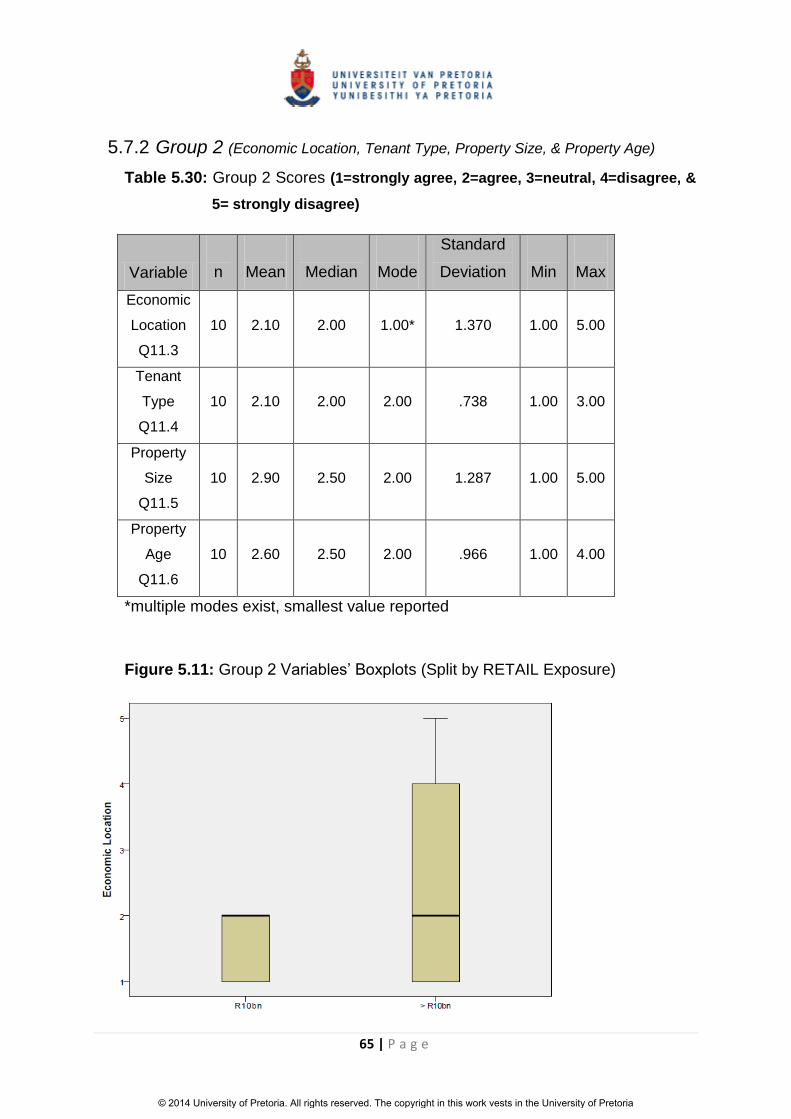
65 | P a g e
5.7.2 Group 2 (Economic Location, Tenant Type, Property Size, & Property Age)
Table 5.30: Group 2 Scores (1=strongly agree, 2=agree, 3=neutral, 4=disagree, &
5= strongly disagree)
Variable
n
Mean
Median
Mode
Standard
Deviation
Min
Max
Economic
Location
Q11.3
10 2.10 2.00 1.00* 1.370 1.00 5.00
Tenant
Type
Q11.4
10 2.10 2.00 2.00 .738 1.00 3.00
Property
Size
Q11.5
10 2.90 2.50 2.00 1.287 1.00 5.00
Property
Age
Q11.6
10 2.60 2.50 2.00 .966 1.00 4.00
*multiple modes exist, smallest value reported
Figure 5.11: Group 2 Variables’ Boxplots (Split by RETAIL Exposure)
© 2014 University of Pretoria. All rights reserved. The copyright in this work vests in the University of Pretoria

66 | P a g e
© 2014 University of Pretoria. All rights reserved. The copyright in this work vests in the University of Pretoria

67 | P a g e
Table 5.31: Group 2 Variables’ Scores (Split by RETAIL Exposure) (1=strongly agree, 2=agree, 3=neutral, 4=disagree, & 5= strongly disagree)
Variable Retail Value
n
Mean
Standard
Deviation
Economic Location
Q11.3
Up to R10bn
5
1.60
.548
More than R10bn 5 2.60 1.817
Tenant Type
Q11.4
Up to R10bn 5 2.40 .894
More than R10bn 5 1.80 .447
Property Size
Q11.5
Up to R10bn 5 2.80 1.304
More than R10bn 5 3.00 1.414
Property Age
Q11.6
Up to R10bn 5 3.00 .707
More than R10bn 5 2.20 1.095
© 2014 University of Pretoria. All rights reserved. The copyright in this work vests in the University of Pretoria
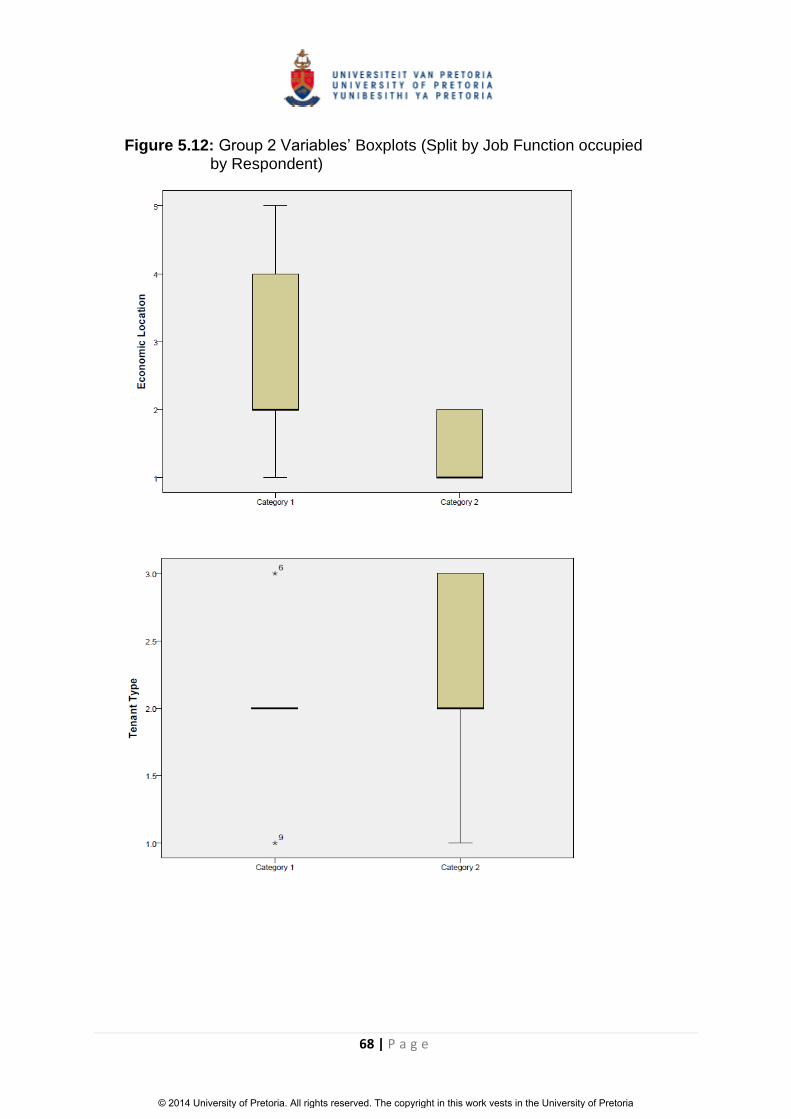
68 | P a g e
Figure 5.12: Group 2 Variables’ Boxplots (Split by Job Function occupied by Respondent)
© 2014 University of Pretoria. All rights reserved. The copyright in this work vests in the University of Pretoria

69 | P a g e
© 2014 University of Pretoria. All rights reserved. The copyright in this work vests in the University of Pretoria

70 | P a g e
Table 5.32: Group 2 Variables’ Scores (Split by Job Function occupied by Respondent) (1=strongly agree, 2=agree, 3=neutral, 4=disagree, & 5= strongly disagree)
Variable Job Function
n
Mean
Standard
Deviation
Economic Location
Q11.3
Category 1 5 2.80 1.643
Category 2 5 1.40 .548
Tenant Type
Q11.4
Category 1 5 2.00 .707
Category 2 5 2.20 .837
Property Size
Q11.5
Category 1 5 3.20 1.304
Category 2 5 2.60 1.342
Property Age
Q11.6
Category 1 5 2.40 1.14
Category 2 5 2.80 .837
5.8 Relevance of Financial Information
In line with the principles embedded in the structure of a Balanced Scorecard
(BSC), namely that both financial and nonfinancial information form the basis of
projecting future performance, Question 14 required respondents to rate certain
financial ratios identified as indicators of future financial performance. Question
15 was a follow up on Question 14 by soliciting for any other financial ratios
respondents felt were also important in this regard. The results of the survey are
presented below (1=least important, 2=not important, 3=neutral, 4=important
& 5=most important):
© 2014 University of Pretoria. All rights reserved. The copyright in this work vests in the University of Pretoria

71 | P a g e
Table 5.33: Financial Ratios Cronbach’s Alpha
Cronbach’s
Alpha
n
0.636
5
The coefficient of Cronbach’s Alpha was therefore considered appropriate
because it was in line with the benchmark discussed under Section 4.4.1.
Table 5.34: Financial Ratios Score Rankings (1=least important, 2=not important, 3=neutral, 4=important, & 5=most important)
Financial
Ratio
n
Mean
Median
Mode
Standard
Deviation
Min
Max
Efficiency
Ratio
10
4.20
4.50
5.00
.919
3
5
Turnover
Growth
Ratios
10
4.00
4.00
4.00
.816
2
5
Net Rental
over
Turnover
10
4.30
4.00
4.00
.675
3
5
Gross
Property
Income over
Turnover
10
3.80
4.00
4.00
1.229
1
5
Spend per
Head Ratio
10
3.30
3.00
2.00*
1.160
2
5
Overall 10 3.92 3.90 3.80* .6268 1 5
*multiple modes exist, smallest value reported
© 2014 University of Pretoria. All rights reserved. The copyright in this work vests in the University of Pretoria

72 | P a g e
The above financial ratios all but one (Efficiency Ratio) deal directly with the
question of measuring aggregate turnover levels achieved by the shopping mall.
The Spend per head ratio is derived using the formula below:
Spend per head = Turnover / Foot-traffic
For example, if the Total Turnover registered by a Community Shopping Mall in a
given month stands at R100m, and the total foot-traffic for the same month
stands at 200 000 people, the spend per head is therefore R500.
Table 5.35: Financial Ratios Score Rankings (Split by Job Function occupied by Respondent) (1=least important, 2=not important, 3=neutral, 4=important, & 5=most important)
Job Function
n
Mean
Standard
Deviation
Category 1 5 4.24 .684
Category 2 5 3.60 .400
5.8.1 Other suggested Financial ratios
As mentioned above, Question 15 was a follow up question on Question 14 by
asking respondents to offer suggestions on other relevant ratios not mentioned
in Question 14. The question was an optional open-ended question and below is
a summary of answers obtained from respondents:
© 2014 University of Pretoria. All rights reserved. The copyright in this work vests in the University of Pretoria

73 | P a g e
Table 5.36: Other Suggested Financial Ratios
Financial Ratio
n
1) Trading Densities (Turnover / GLA) 3
2) Utility Recovery Ratios (Excluding Rates) 1
3) Rates Recovery Ratios 1
4) IPD Performance benchmark Ratios 1
5) Total Utility Recovery Ratios (Rates & Other combined) 1
6) Cost to Income Ratios 1
7) Net Expense Growth Ratios 1
8) Capitalisation Rates Trends 1
While the question required respondents to assign a rating on the level of
importance on each suggested ratio, most respondents did not make use of the
rating. Therefore, for purposes of these results, it was assumed overall that all
ratios were important to respondents; otherwise they would not have been put
forward for suggestion.
5.9 Overall Results
The results from a total of 10 respondents were presented above. As mentioned,
these respondents were well experienced to answer the questions posed – 154
years of commercial property experience; 56 years of retail sector experience.
The institutional investors represented by these participants control a sizeable
asset base in the South African real estate industry. A summary of the supported
hypotheses in the study is presented in Table 5.37 below:
© 2014 University of Pretoria. All rights reserved. The copyright in this work vests in the University of Pretoria

74 | P a g e
Table 5.37: Summary of Results Analysis
No
Hypothesis
Hypothesis
Status
Outcome
H₁
Investment stage concerned
with Forecasting expected
returns important to
institutional investors
Supported
Ranked 2nd; In line
with ranking
obtained by
Farragher and
Savage (2008)
H₂
Nonfinancial factors important
when Forecasting expected
returns in retail
Supported
Tenant
Mix(Mean=4.08,
important)
Centre
Management(Mea
n=3.80, important)
H₃
Market Values derived through
Professional Valuation are
subjective
Not Supported
Exogenous
Factors(Mean=2.8,
neutral);
Endogenous
Factors
(Mean=2.6,
neutral)
H₄ Portfolio Diversification based
on Geographic location and
Property type
Supported
Group 1
(Mean=1.90,
agree); Group 2
(Means leaning
towards neutral)
The following chapter presents an analysis of the results presented in Chapter
Five.
© 2014 University of Pretoria. All rights reserved. The copyright in this work vests in the University of Pretoria

75 | P a g e
6 Chapter 6 – Discussion of Findings
6.1 Introduction
This chapter discusses the results of the research as presented in the previous
chapter, Chapter Five. Hypotheses were formulated in Chapter Three, and this
chapter analyses the results in the context of the stated hypotheses.
Conclusions on each hypothesis are also stated, while in the process
synthesising findings of past research work already discussed in Chapter Two.
6.2 Hypothesis 1: Prioritisation of Investment Decision Stages
6.2.1 Introduction
Question 13 required respondents to prioritise the Top 4 decision making stages
out of Farragher and Savage’s (2008) investment decision framework. The
rationale behind this question was to find out if the sample of institutional
investors selected for the study prioritised Forecasting Expected Returns (Stage
4) as important when faced with an investment decision. Prioritisation of Stage 4
presents no further implications in so far as other commercial property sectors
like C&I are concerned. For the retail sector, however, as discussed in Chapter
Two, future returns are driven by nonfinancial factors, such as tenant mix and
customer experience. In order to enhance the quality of the investment decision,
therefore, these drivers of future performance must be incorporated into the
decision process.
Hypothesis 1 hypothesised that Forecasting expected returns in investment
decision making processes is important to SA’s institutional investors. In this
regard, the results of the survey investigation presented in Chapter Five are
discussed below. The overall results obtained are discussed first, before
analysing responses in terms of the size of the retail portfolio held by the
investor, and also reclassifying responses in accordance with the job function
of the position occupied by the respondents.
© 2014 University of Pretoria. All rights reserved. The copyright in this work vests in the University of Pretoria

76 | P a g e
6.2.2 Discussion of Research Results
An overview of the choices made by investors is presented in Table 5.6. Both
Setting strategy and Establishing return/risk objectives were selected by 80
percent of the respondents, followed by Forecasting expected returns (60%),
both Assessing and adjusting for risk, and Decision making at 50 percent, and
Searching for investment opportunities at 40 percent. The least selected
investment stages were Evaluating forecasts (20%), and Implementing Accepted
Proposals and Auditing operating performance both at 10 percent.
While the most favoured investment stages were Setting strategy and
Establishing return/risk objectives (both 80%), Setting strategy was ranked top
priority by all Eight respondents, versus the Establishing return/risk objectives’
stage where Five respondents awarded priority 2 status, and the balance of
Three respondents awarded a priority 3 status. The only stage to have been
selected on all priority rankings was Forecasting expected return (See Table
5.6).
The study by Farragher and Savage (2008) reported that investors identified the
Top 3 Stages of the process as Searching for investment opportunities;
Forecasting expected returns, and Evaluating expected returns. Consistent with
their findings, forecasting expected returns ranks second in both studies. In this
study, there were two instances where decision stages received an equal
ranking by respondents and this could be attributed to the small size of the
sample. While Farragher and Savage’s (2008) received a low response rate
(23%) compared to this study (83%), their study received a total of 188
responses compared to the 10 for this study.
Table 5.7 presents the results of this section according to the size of the retail
portfolio held by each institutional investor, that is, Up to R10bn and More than
R10bn. The number of investors in both categories was even (5). The
Forecasting expected returns’ stage was more important to investors in the band
‘more than R10bn’ (50%) relative to the band ‘up to R10bn’ (10%). Therefore, all
© 2014 University of Pretoria. All rights reserved. The copyright in this work vests in the University of Pretoria
77 | P a g e
four investors that did not prioritise Stage 4 as important in the decision process
were from the ‘up to R10bn’ band. In the study by Farragher and Savage (2008),
results were not sorted using the commercial property value parameter because
no material differences were found amongst the investment values. This study
also did not find any material differences to warrant conducting such an analysis.
Table 5.8 presents the results of the survey sorted by Job Function occupied
by respondents, that is, Category 1 and Category 2 (as discussed in Section
5.3.1 above). As presented in Table 5.1, the number of respondents in each
category is even at five per category. Category 1 respondents valued the
Forecasting expected returns’ stage more (40%) relative to Category 2
respondents (20%). Therefore, only one respondent from Category 1 did not
rank Stage 4 as the most important stage in the process, relative to Three from
Category 2 respondents. In conclusion, the results show that Asset Managers,
people who are entrusted with the responsibility of driving shopping mall
performance through an oversight role on the duties of the Centre Management
team, value the forecasting stage more relative to Fund Managers and Chief
Investment Officers (CIOs). The duties of Fund Managers and CIOs extend
beyond just driving shopping centre performance as explained under Section
5.3.1. In order to understand drivers of future performance in a decision making
setting, however, it is logical to expect Fund Managers and CIOs to rely on the
insightful knowledge of Asset Managers, given that these individuals focus only
on performance matters, versus Fund Managers and CIOs, who become
inundated with other tasks, such as portfolio rebalancing strategies.
6.2.3 Conclusion
According to results of the survey analysed above, Forecasting expected returns
was identified as most important by SA’s institutional investors. Therefore, the
Hypothesis 1 stated in Chapter Three is accepted.
© 2014 University of Pretoria. All rights reserved. The copyright in this work vests in the University of Pretoria
78 | P a g e
6.3 Hypothesis 2: Usefulness of Nonfinancial Factors
6.3.1 Introduction
Meija and Benjamin (2002) discussed the important role played by anchor
tenants, and the presence of substitute and complementary tenants in moulding
a differentiation strategy (Tenant mix) in a shopping centre environment. An
effective Tenant mix strategy, as discussed in Chapter Two, drives turnover
rental in a shopping centre. Increased sales levels achieved by tenants facilitate
surpassing breakpoint, and attainment of breakpoint triggers the application of
the turnover rental clause of the lease agreement. Given this background,
Question 16 presented to respondents for rating on a Likert-Style Scale, a list
nonfinancial indicators of future performance that were identified from the
literature.
Hypothesis 2 stated that institutional investors do consider the nonfinancial
factors alluded to above important in a decision process. In order to evaluate this
hypothesis, the results of the survey presented in Chapter Five are discussed
below. The nonfinancial factors are discussed under the concept of Tenant Mix
and the Quality of Centre Management team. An overview of both sections is
presented first, before conducting an analysis based on retail portfolio value,
and the job function occupied by the respondent on both Tenant Mix and the
Quality of the Centre Management team.
6.3.2 Discussion of Research Results
Table 5.11 presents the results of the variables supporting the Tenant Mix
concept, and Table 5.14 presents results on Centre Management. The overall
Tenant Mix mean score was 4.08 which indicate that respondents view the
variables presented as important. Respondents think the variable presence of
anchors to be most important (Mean=5; Std Deviation=0.00), while adopting an
indifferent stance on the variable presence of franchised & independent stores
(Mean=3.30; Std Deviation=0.675). On the Quality of the Centre Management
© 2014 University of Pretoria. All rights reserved. The copyright in this work vests in the University of Pretoria
79 | P a g e
team, respondents also rated this variable as important (Mean=3.80; Std
Deviation=1.398), although on a lesser scale relative to Tenant Mix. Therefore,
overall nonfinancial factors’ mean score was 4.02 which equates to a rating of
important on the measurement scale.
Tenant Mix
In Figure 5.1 and Table 5.12 the results of this section are presented using
retail portfolio value. While both groups of Up to R10bn (Mean=3.90;
Median=4.00) and More than R10bn (Mean=4.25; Median=4.25) consider the
Tenant Mix variables important indicators of future expected returns, the latter
group has a relatively higher scoring.
The mean scores of Asset Managers (Mean=4.05; Median=4.00), and CIOs and
Fund Managers (Mean=4.10; Median=4.25) are quite close though when the
results are analysed by job function (Figure 5.2 & Table 5.13). In each group,
however, there was one outlier respondent.
The size of the sample was small (n=12), which therefore could make the results
to be not representative of the views of SA’s commercial property institutional
investors. Notwithstanding the foregoing comment, given that all respondents in
this study concurred with the important role of the tenant mix variables presented
to them in forecasting expected returns, the conclusions made about the study
can therefore be considered valid.
Centre Management
The importance of the Centre Management team in driving future performance
can explained using the perspectives of a Balanced Scorecard (Kaplan and
Norton, 2001). Under the Customer perspective, for example, in order to
enhance the superior customer experience which ultimately results in turnover
rental through increased tenant sales (Huppertz and Khare, 2008), the team
would be required to deal decisively with any complaints raised by shoppers.
© 2014 University of Pretoria. All rights reserved. The copyright in this work vests in the University of Pretoria
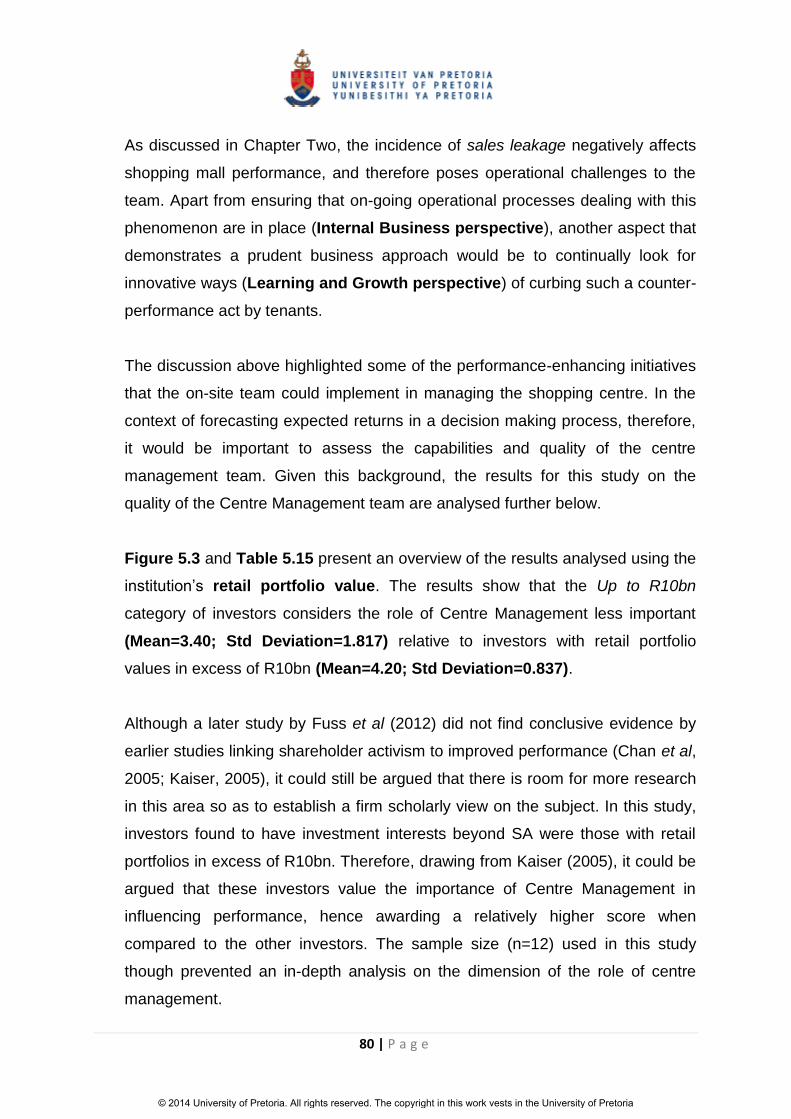
80 | P a g e
As discussed in Chapter Two, the incidence of sales leakage negatively affects
shopping mall performance, and therefore poses operational challenges to the
team. Apart from ensuring that on-going operational processes dealing with this
phenomenon are in place (Internal Business perspective), another aspect that
demonstrates a prudent business approach would be to continually look for
innovative ways (Learning and Growth perspective) of curbing such a counter-
performance act by tenants.
The discussion above highlighted some of the performance-enhancing initiatives
that the on-site team could implement in managing the shopping centre. In the
context of forecasting expected returns in a decision making process, therefore,
it would be important to assess the capabilities and quality of the centre
management team. Given this background, the results for this study on the
quality of the Centre Management team are analysed further below.
Figure 5.3 and Table 5.15 present an overview of the results analysed using the
institution’s retail portfolio value. The results show that the Up to R10bn
category of investors considers the role of Centre Management less important
(Mean=3.40; Std Deviation=1.817) relative to investors with retail portfolio
values in excess of R10bn (Mean=4.20; Std Deviation=0.837).
Although a later study by Fuss et al (2012) did not find conclusive evidence by
earlier studies linking shareholder activism to improved performance (Chan et al,
2005; Kaiser, 2005), it could still be argued that there is room for more research
in this area so as to establish a firm scholarly view on the subject. In this study,
investors found to have investment interests beyond SA were those with retail
portfolios in excess of R10bn. Therefore, drawing from Kaiser (2005), it could be
argued that these investors value the importance of Centre Management in
influencing performance, hence awarding a relatively higher score when
compared to the other investors. The sample size (n=12) used in this study
though prevented an in-depth analysis on the dimension of the role of centre
management.
© 2014 University of Pretoria. All rights reserved. The copyright in this work vests in the University of Pretoria
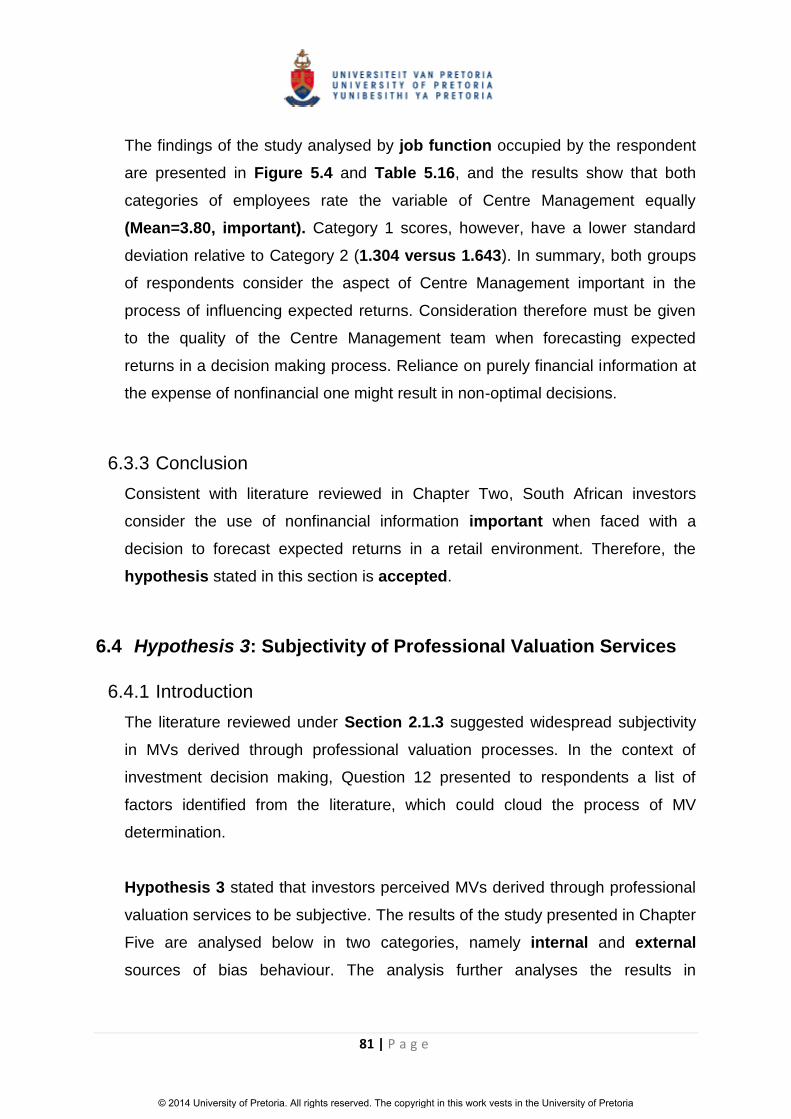
81 | P a g e
The findings of the study analysed by job function occupied by the respondent
are presented in Figure 5.4 and Table 5.16, and the results show that both
categories of employees rate the variable of Centre Management equally
(Mean=3.80, important). Category 1 scores, however, have a lower standard
deviation relative to Category 2 (1.304 versus 1.643). In summary, both groups
of respondents consider the aspect of Centre Management important in the
process of influencing expected returns. Consideration therefore must be given
to the quality of the Centre Management team when forecasting expected
returns in a decision making process. Reliance on purely financial information at
the expense of nonfinancial one might result in non-optimal decisions.
6.3.3 Conclusion
Consistent with literature reviewed in Chapter Two, South African investors
consider the use of nonfinancial information important when faced with a
decision to forecast expected returns in a retail environment. Therefore, the
hypothesis stated in this section is accepted.
6.4 Hypothesis 3: Subjectivity of Professional Valuation Services
6.4.1 Introduction
The literature reviewed under Section 2.1.3 suggested widespread subjectivity
in MVs derived through professional valuation processes. In the context of
investment decision making, Question 12 presented to respondents a list of
factors identified from the literature, which could cloud the process of MV
determination.
Hypothesis 3 stated that investors perceived MVs derived through professional
valuation services to be subjective. The results of the study presented in Chapter
Five are analysed below in two categories, namely internal and external
sources of bias behaviour. The analysis further analyses the results in
© 2014 University of Pretoria. All rights reserved. The copyright in this work vests in the University of Pretoria
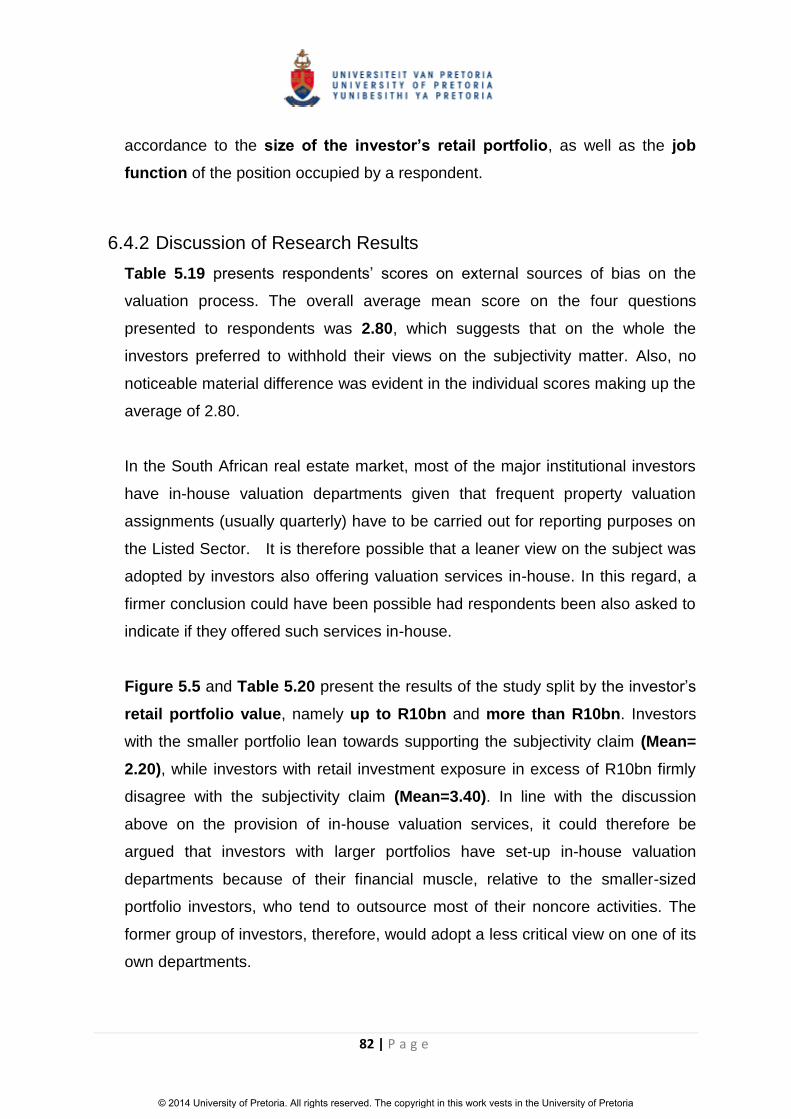
82 | P a g e
accordance to the size of the investor’s retail portfolio, as well as the job
function of the position occupied by a respondent.
6.4.2 Discussion of Research Results
Table 5.19 presents respondents’ scores on external sources of bias on the
valuation process. The overall average mean score on the four questions
presented to respondents was 2.80, which suggests that on the whole the
investors preferred to withhold their views on the subjectivity matter. Also, no
noticeable material difference was evident in the individual scores making up the
average of 2.80.
In the South African real estate market, most of the major institutional investors
have in-house valuation departments given that frequent property valuation
assignments (usually quarterly) have to be carried out for reporting purposes on
the Listed Sector. It is therefore possible that a leaner view on the subject was
adopted by investors also offering valuation services in-house. In this regard, a
firmer conclusion could have been possible had respondents been also asked to
indicate if they offered such services in-house.
Figure 5.5 and Table 5.20 present the results of the study split by the investor’s
retail portfolio value, namely up to R10bn and more than R10bn. Investors
with the smaller portfolio lean towards supporting the subjectivity claim (Mean=
2.20), while investors with retail investment exposure in excess of R10bn firmly
disagree with the subjectivity claim (Mean=3.40). In line with the discussion
above on the provision of in-house valuation services, it could therefore be
argued that investors with larger portfolios have set-up in-house valuation
departments because of their financial muscle, relative to the smaller-sized
portfolio investors, who tend to outsource most of their noncore activities. The
former group of investors, therefore, would adopt a less critical view on one of its
own departments.
© 2014 University of Pretoria. All rights reserved. The copyright in this work vests in the University of Pretoria

83 | P a g e
Figure 5.6 and Table 5.21 present the results of the study according to the two
job functions identified under Section 5.3.1 in Chapter Five. Assets Managers
registered a rather neutral score (Mean=3.15), although the spread of results
was relatively wider as evidenced by a standard deviation of 1.025. CIOs and
Fund Managers, on the other hand, leaned towards agreeing with the statement
that MVs derived through valuation processes are subjective (Mean=2.45). It
could be that, relative to Asset Managers, CIOs and Fund Managers spend more
time negotiating acquisition deals, and therefore have more experience on the
frailties associated with MV determination.
There was only one question pertaining to internal factors influencing
professional valuation biases and the results of the study are presented in Table
5.22. A mean score of 2.60 was registered for this type of question, which was
more towards a neutral stance, even though a mean score of 2.00 (agree) was
registered for at least one of the respondents.
In terms of an analysis based on retail portfolio value, as presented in Figure
5.7 and Table 5.23, the results show no material differences from the mean
score of 2.6 above. Both bands had an outlier, however the up to R10bn
category had a mean score of 2.40 (more on agree) versus the more than
R10bn category score of 2.80 (closer to neutral).
An analysis based on the job function of the position occupied by the
respondent is presented in Figure 5.8 and Table 5.24. The scoring trend in this
area assumes a similar fashion to that observed under external factors. Asset
Managers once again adopted a more neutral stance (Mean=2.80), while CIOs
and Fund Managers tended to lean towards agreeing with the argument of
subjectivity (Mean=2.40).
© 2014 University of Pretoria. All rights reserved. The copyright in this work vests in the University of Pretoria

84 | P a g e
6.4.3 Conclusion
Chapter Two presented a strand of literature demonstrating the subjectivity
associated with MV determination through the services of PV. These studies
were conducted in a number of developed real estate markets. No similar
studies coming out of emerging economies like South Africa were identified
during literature review. While South Africa is considered relatively developed
when compared to other African countries, as an emerging economy, it would
however be expected that it will still possess some of the institutional voids
associated with such markets (Acemoglu and Robinson, 2012). Therefore, it
might rather be incomprehensible that a group of investors possessing a total of
154 years of commercial property experience find such market free of the
professional valuation challenges widely reported in developed real estate
markets.
The results though gave a slightly different perspective when analysed in terms
of retail portfolio value and the job function of the position occupied by the
respondent. Therefore, this might be an indication that an in-depth study with a
larger sample size would present different results.
In conclusion, the results of the survey failed to support the stated hypothesis
that institutional investors perceive MVs derived through PV services to be
subjective. Therefore, hypothesis 3 is rejected.
6.5 Hypothesis 4: Factors Influencing Diversification Strategies
6.5.1 Introduction
According to Business Day (2013), a growing number of South African property
companies seem to be infiltrating the rest of the African continent in search for
new growth opportunities. While the continent is reportedly lagging behind in
terms of availability of quality shopping centres (Knight Frank, 2013), Beattie
(2013) reported widespread construction activity of malls meeting world
standards across most of the continent’s economic hubs, for example in Nigeria,
© 2014 University of Pretoria. All rights reserved. The copyright in this work vests in the University of Pretoria

85 | P a g e
Ghana, Kenya, and others. The emergence of quality retail assets there looks
set to stimulate acquisition activity across markets in the continent. To this end,
Question 11 of the questionnaire aimed at obtaining views of institutional
investors on the factors that influence their diversification strategies, as they
infiltrate the rest of the continent in search of better investment opportunities.
Based on the study by Farragher and Savage (2008), hypothesis 4 stated that
institutional investors’ diversification strategies were based on geographic
location, and the property type. The results of the study presented in Chapter
Five are analysed below.
6.5.2 Discussion of Research Results
The following summary presents an overview of the results in this study
alongside the findings of Farragher and Savage (2008).
Table 6.1: Summary Mean Scores
Variable
Study
Farragher &
Savage
Score Ranking Score Ranking
Geographic Location 2.00 2 87% 1
Property Type 1.80 1 81% 2
Economic Location 2.10 3 50% 4
Tenant Type 2.10 3 44% 5
Property Size 2.90 5 59% 3
Property Age 2.60 4 31% 6
(1=strongly agree, 2=agree, 3=neutral, 4=disagree, & 5= strongly disagree)
In Table 5.27, the results of variables geographic location and property type
are presented under the theme group 1 variables. The average mean score for
© 2014 University of Pretoria. All rights reserved. The copyright in this work vests in the University of Pretoria

86 | P a g e
the Two variables was 1.90, which lies between strongly agree and agree on the
rating scale, although leaning more towards agree. Compared with the rest of
the variables, Table 6.1 shows that these variables occupied the top two
positional rankings in both studies.
Diversification based on geographic location seems plausible for SA’s
institutional investors. As reported by Knight Frank (2013), the country has
experienced an unprecedented increase in shopping centres since the dawn of
democracy in 1994. With the local market nearing saturation, property
companies have seemingly resorted to local acquisition strategies in an effort to
boost earnings (For example, See eProp, 2013). Consolidation though presents
limited opportunities, hence South African companies are reportedly infiltrating
new geographies beyond the local boarders (Business Day, 2013), where
income levels are rising. With a strong emergence of a middle class population
as a result of the rising income levels, Beattie (2013) reported that such section
of the population has aspirations, yet remaining chronically underserviced. As
stated in Chapter One, 60 percent of the capital value of properties held by the
institutions used for this study is retail and therefore it can be reasonably
expected that these investors would gravitate towards the retail property type. As
discussed earlier, the variable rental structure presents relatively attractive
investment opportunities for returns- seeking landlords.
Chapter Four elaborated on the limitations associated with the small size of the
sample used in this study. In this vein, the results show that an analysis on these
variables (geographic location and property type) based on retail value (Figure
5.9 and Table 5.28), or job function of position occupied by respondent (Figure
5.10 and Table 5.29), give no useful dimension to the study, hence no further
commentary has been provided.
The results of group 2 factors are presented in Figure 5.11 & 5.12, and Table
5.30 & 5.31. Respondents in the study rated economic location and tenant
type equally (Mean=2.10 which approximates an ‘agree’ rating), while next was
© 2014 University of Pretoria. All rights reserved. The copyright in this work vests in the University of Pretoria
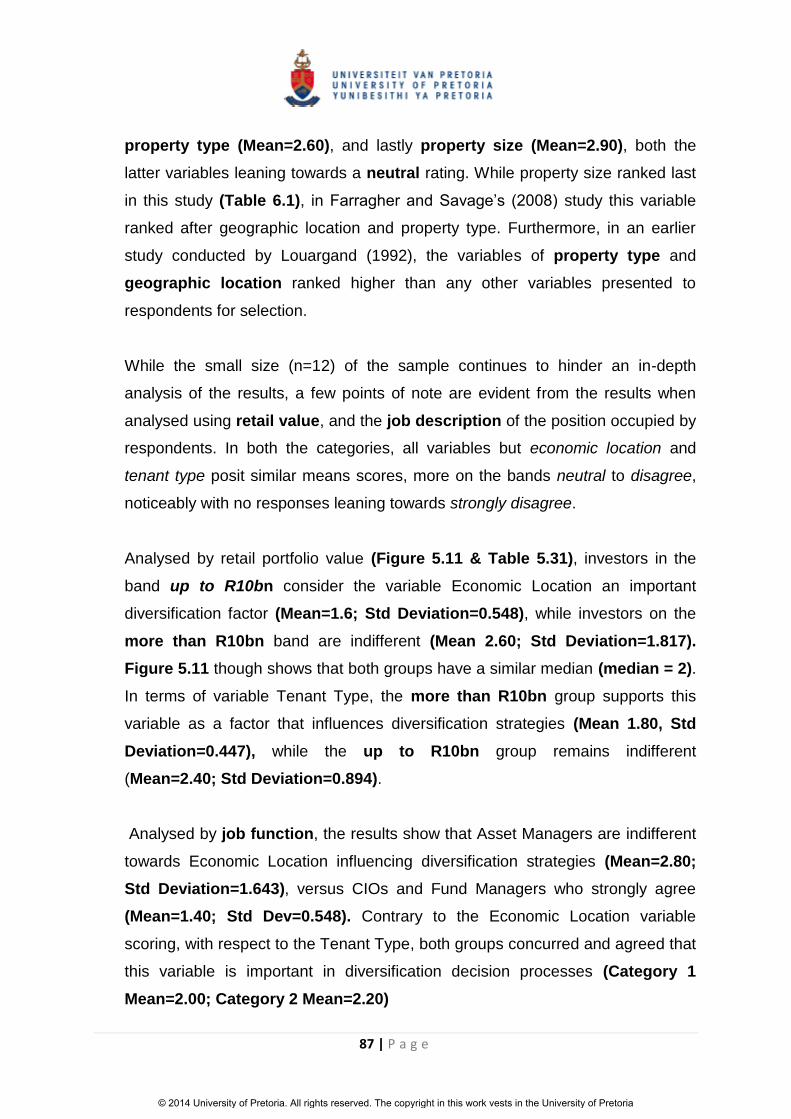
87 | P a g e
property type (Mean=2.60), and lastly property size (Mean=2.90), both the
latter variables leaning towards a neutral rating. While property size ranked last
in this study (Table 6.1), in Farragher and Savage’s (2008) study this variable
ranked after geographic location and property type. Furthermore, in an earlier
study conducted by Louargand (1992), the variables of property type and
geographic location ranked higher than any other variables presented to
respondents for selection.
While the small size (n=12) of the sample continues to hinder an in-depth
analysis of the results, a few points of note are evident from the results when
analysed using retail value, and the job description of the position occupied by
respondents. In both the categories, all variables but economic location and
tenant type posit similar means scores, more on the bands neutral to disagree,
noticeably with no responses leaning towards strongly disagree.
Analysed by retail portfolio value (Figure 5.11 & Table 5.31), investors in the
band up to R10bn consider the variable Economic Location an important
diversification factor (Mean=1.6; Std Deviation=0.548), while investors on the
more than R10bn band are indifferent (Mean 2.60; Std Deviation=1.817).
Figure 5.11 though shows that both groups have a similar median (median = 2).
In terms of variable Tenant Type, the more than R10bn group supports this
variable as a factor that influences diversification strategies (Mean 1.80, Std
Deviation=0.447), while the up to R10bn group remains indifferent
(Mean=2.40; Std Deviation=0.894).
Analysed by job function, the results show that Asset Managers are indifferent
towards Economic Location influencing diversification strategies (Mean=2.80;
Std Deviation=1.643), versus CIOs and Fund Managers who strongly agree
(Mean=1.40; Std Dev=0.548). Contrary to the Economic Location variable
scoring, with respect to the Tenant Type, both groups concurred and agreed that
this variable is important in diversification decision processes (Category 1
Mean=2.00; Category 2 Mean=2.20)
© 2014 University of Pretoria. All rights reserved. The copyright in this work vests in the University of Pretoria

88 | P a g e
Overall, the study presented a mixed set of results when compared with findings
by Louargand (1992), and Farragher and Savage (2008). Although not the same
factors, both these studies revealed that respondents favoured by far two of the
diversification factors presented to them. As discussed, the top two factors
identified as important by SA investors were similar to the study by Farragher
and Savage (2008). SA’s investors, on the contrary, did not rate poorly the other
diversification factors relative to the study by these authors.
6.5.3 Conclusion
The following conclusions can be drawn from the results of this section of the
study:
Two groups of variables were presented to respondents for selection by
this study: group 1 (Geographic Location and Property Type) and group 2
(Economic Location, Tenant Type, Property Size, and Property Age).
Participants to the study supported group 1 variables (Mean 1.90) over
group 2’s (Mean 2.43).
On the Likert-Style type Scale used for this section, the group 1 mean
score equates to an agree ranking, while group 2 mean leans towards a
neutral ranking by the investors. Noteworthy in group 2, the variables
Property Size (Mean 2.90) and Property Age (Mean 2.60) were much
closer to the neutral ranking, relative to Economic Location and Tenant
Type (both Mean=2.10).
The study concurred with findings by Farragher and Savage (2008),
however not with earlier findings by Louargand (1992).
Therefore, given the results discussed above, hypothesis 4 is accepted.
© 2014 University of Pretoria. All rights reserved. The copyright in this work vests in the University of Pretoria
89 | P a g e
6.6 Relevance of Financial Information
6.6.1 Introduction
Relative to other fragmented systems, according to Norreklit (2000), the BSC
possesses the advantage of linking all performance drivers of an entity as a
result of its cause-and-effect principle. Therefore, the framework forces an entity
to consider other areas of business when forecasting expected returns versus
placing unfettered reliance on historical financial information. Discussed in this
section, are financial ratios that assist in the process of projecting future financial
performance, but only in concert with the other there perspectives of the BSC
already discussed herein above. In this context, the suggested financial ratios by
respondents are also incorporated.
6.6.2 Discussion of Research Results
Table 6.2 below presents an overview of the financial ratios used for the survey,
combined with other relevant ratios suggested by respondents:
© 2014 University of Pretoria. All rights reserved. The copyright in this work vests in the University of Pretoria
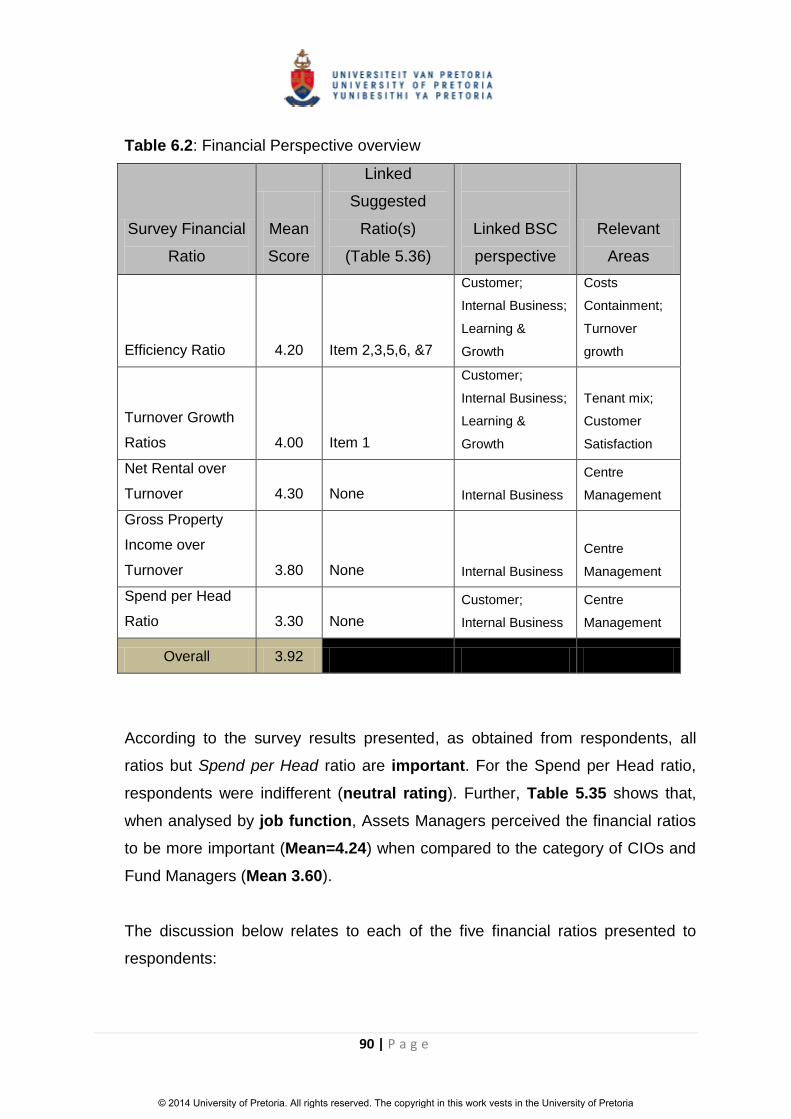
90 | P a g e
Table 6.2: Financial Perspective overview
Survey Financial
Ratio
Mean
Score
Linked
Suggested
Ratio(s)
(Table 5.36)
Linked BSC
perspective
Relevant
Areas
Efficiency Ratio
4.20 Item 2,3,5,6, &7
Customer;
Internal Business;
Learning &
Growth
Costs
Containment;
Turnover
growth
Turnover Growth
Ratios
4.00 Item 1
Customer;
Internal Business;
Learning &
Growth
Tenant mix;
Customer
Satisfaction
Net Rental over
Turnover
4.30 None Internal Business
Centre
Management
Gross Property
Income over
Turnover
3.80 None Internal Business
Centre
Management
Spend per Head
Ratio
3.30 None
Customer;
Internal Business
Centre
Management
Overall 3.92
According to the survey results presented, as obtained from respondents, all
ratios but Spend per Head ratio are important. For the Spend per Head ratio,
respondents were indifferent (neutral rating). Further, Table 5.35 shows that,
when analysed by job function, Assets Managers perceived the financial ratios
to be more important (Mean=4.24) when compared to the category of CIOs and
Fund Managers (Mean 3.60).
The discussion below relates to each of the five financial ratios presented to
respondents:
© 2014 University of Pretoria. All rights reserved. The copyright in this work vests in the University of Pretoria

91 | P a g e
Efficiency Ratio (Expenses over Income)
According to Hays, Lurgio, and Gilbert (2009), the Efficiency Ratio is the most
used ratio in business and looks at the level of expense needed to support one
monetary unit of operating revenue. The ratio therefore, can be improved by
either reducing costs levels or increasing revenue levels. From an investment
decision making perspective, a healthy Efficiency Ratio gives comfort to the
investor to project favourable future returns. The healthy Efficiency Ratio
position, however, is driven by performances in the other Three BSC
perspectives.
Excellence in offering superior customer experience results in increased tenant
sales (leads to turnover rental). For purposes of attainment of this position, the
BSC framework posits that the centre’s internal processes (internal business
perspective) must identify and drive the levers enabling such position. For
instance, costs containment might be a result of specifically initiated innovative
ways by centre management designed to achieve targeted profitability levels.
Therefore, the attainment of a healthy Efficiency Ratio position can only be
achieved through excellence in the other BSC perspective and so investment
decision makers must be in a position to make this cause-and-effect connection
if optimal decisions are to be made.
Respondents rated this ratio highly (Mean=4.20) and further suggested other
ratios that (Table 6.2), in this report, it is argued that they already form part of
the Efficiency Ratio.
Turnover Growth Ratios
Turnover growth ratios are designed to assess the effectiveness of a tenant mix
strategy, as well as attainment of superior customer experience. Turnover
growth can be measured on three levels, namely
- Month-on-month growth (m/m)
- Year-on-year growth (y/y)
© 2014 University of Pretoria. All rights reserved. The copyright in this work vests in the University of Pretoria

92 | P a g e
- Growth at tenant level
In this report, the important role of a tenant mix strategy and superior customer
experience, in driving shopping centre financial performance has been well
elaborated on using academic theory from a number of authors (Meija and
Benjamin, 2002; Grewal et al, 2009; Verhoef et al, 2009). Under the financial
perspective, the emphasis is on obtaining a scorecard on the effectiveness of the
other perspectives (nonfinancial). Overall, softer turnover growth percentages
reflect the ineffectiveness of tenant mix and superior customer experience
initiatives by Centre Management. In an investment decision context, this would
result in a softer position on future expected returns.
Respondents rated this ratio as important (Mean=4), however also suggested
the Trading Density ratio. In this report, it is argued that the suggested ratio
facilitates comparisons of turnover performances, at the level of tenants
belonging to a specified category (See Appendix 9.8 for tenant categories). For
instance, when all other pertinent factors likely to affect tenant trade are
considered by Centre Management, disparities between Trading Density ratios
of tenants in the same category might highlight issues for further investigation on
the underperforming tenant. One issue could be the existence of sales leakage
practices.
Net Rental over Turnover
No scholarly work was identified in this study that covers this ratio. In terms of
performance, however, it could be considered prudent for Centre Management
to compare this ratio with industry benchmarks, such as provided by the IPD. A
softer ratio, however, could indicate low rentals charged to tenants in relation to
the turnover generated by those tenants. Therefore, in terms of the BSC
perspective on Internal Business, such a position could warrant a review by
Centre Management of the operational systems. Respondents awarded the
highest ranking to this ratio (Mean=4.30) relative to the other financial ratios
presented to them.
© 2014 University of Pretoria. All rights reserved. The copyright in this work vests in the University of Pretoria

93 | P a g e
Gross Property Income over Turnover
This ratio is similar to the one discussed above, save for the inclusion of other
income streams, for instance, Signage Income, and Exhibition Income. It can be
argued that a quality Centre Management team would have the capacity to
identify other income streams that assist to propel the financial performance of
the shopping centre. In an investment decision process, when forecasting
expected returns the decision maker must be cognisant of the different income
streams in a shopping centre (present and potential). Although still considered
important, respondents awarded the second-lowest rating to this ratio
(Mean=3.80).
Spend per Head
Using the facility of foot count equipment, this ratio calculates the turnover spend
per customer that visits the shopping mall, mathematically represented as
follows:
Spend per Head = Turnover divided by Footcount
Generally, a high ratio indicates positive performance. However, caution must be
exercised on literal implication without understanding the drawbacks associated
with ratio analysis. For instance, a drop in foot count (triggered by failure to
provide superior customer experience) improves the Spend per Head ratio. The
use of this ratio therefore must be viewed in the context of all factors driving
shopping centre performance. Investment decisions taken purely on the basis of
a healthy Spend per Head ratio could be suboptimal. A comparison with
benchmarks from the IPD might prove insightful in this regard. Respondents
rated this ratio poorly relative to the rest of the other financial ratios presented to
them (Mean=3.30).
6.6.3 Conclusion
From an investment decision making point of view, the financial ratios discussed
above do not drive financial performance. Their value is embedded in providing
© 2014 University of Pretoria. All rights reserved. The copyright in this work vests in the University of Pretoria

94 | P a g e
insightful feedback on the effectiveness of the strategic imperatives contained in
the other perspectives of the BSC. Forecasting expected returns, therefore,
happens under the financial perspective of the BSC. To achieve a credible
forecast in a retail environment demands that a clear appreciation of the drivers
of future performance be made.
6.7 Summary
In this chapter, the results presented in Chapter Five were explained, while in the
process also synthesizing scholarly work covered in Chapter Two. A total of four
hypotheses were presented for investigation, and only one was not supported.
The results showed the complexity within which property investment decisions
are taken. For retail, the arguments presented demonstrated that such
challenges are even harder in this commercial property sector.
The following chapter draws conclusions based on the findings of this study.
© 2014 University of Pretoria. All rights reserved. The copyright in this work vests in the University of Pretoria

95 | P a g e
7 Chapter 7 - Conclusion
7.1 Introduction
This chapter gives an overview and summary of the research work carried out in
this study. Key insights coming out of the study are briefly discussed before
highlighting some areas for future research which are judged to be interwoven
with the main areas of investigation by this study.
7.2 Research Background and Objectives
As mentioned in Chapter One, to date there is no universally accepted
investment decision framework in real estate (Sah, 2011). While this debate
continues, decision frameworks currently in use fail to account for the nuanced
differences driving retail performance. Therefore, in the context of the retail
sector, forecasting expected returns without this consideration is likely to yield
suboptimal investment decisions.
The last economic meltdown has limited investment opportunities globally.
Reports, however, suggest that investment opportunities are abound in emerging
markets, such as in Africa (E&Y, 2012). Africa’s economic situation is improving,
with seven of the world’s fastest economies located on the continent (IMF,
2012). Therefore, with the European crisis remaining firmly a topical matter in
investment circles, emerging economies like those located in Africa look
destined to being preferred investment destinations globally.
The objectives of this study were to investigate retail decision frameworks that
aid shopping centre acquisitions. Africa’s retail sector remains grossly
underdeveloped, and its shopping centres are below par in terms of meeting
world standards (Knight Frank, 2013). Nonetheless, the situation is vastly
improving given the move by world-class retailers infiltrating the continent
(Reinartz et al, 2011). There is also flaring construction activity across the
continent which also perpetuates infrastructural improvement (Beattie, 2013). On
© 2014 University of Pretoria. All rights reserved. The copyright in this work vests in the University of Pretoria
96 | P a g e
this backdrop, the years ahead are likely to be punctuated by heightened activity
in the area of mall acquisition transactions, as traction develops as a result of the
availability of world-class mall stock. The acquisition activity is likely to be
dominated by Institutional investors such as MNPCs, as they try and diversify
their portfolios (Kaiser, 2005; Lieser and Groh, 2011).
This study was based on the views of South African institutional investors on the
efficacy of decision frameworks currently in use. The South African commercial
property industry is comparable to other markets elsewhere in developed
markets, and therefore the market was well suited for conducting this study.
Local MNPCs though are underrepresented in retail on the African continent
(Table 5.5). In order to increase their footprint, acquisition entry seems likely to
be the most viable option. Given the high investment risk reportedly associated
with such markets (Acemoglu and Robinson, 2012; Beattie, 2013), there is
therefore an added need to improve current investment decision frameworks.
The findings in this study represent only the views of institutional investors, in a
South African context. Other types of investors have been found to hold different
investment views from those held by institutional investors (Farragher and
Savage, 2008). Therefore, the study cannot be generalised.
7.3 Key Insights from Research Results
The following key insights can be drawn from the study:
Farragher and Savage (2008) found that institutional investors consider the
investment decision stage concerned with forecasting expected returns
important. In this study, SA’s institutional investors also concurred with this
finding.
The services of professional valuation remain important between contracting
parties, through the process of market value determination. Real estate
© 2014 University of Pretoria. All rights reserved. The copyright in this work vests in the University of Pretoria

97 | P a g e
literature is littered with studies alluding to bias behaviour during the process
of market value determination. The literature covered in Chapter two on the
bias behaviour therefore suggested that MVs obtained through the valuation
process must be treated with caution. From a business viewpoint, the theory
calls for treading with caution when dealing with MVs derived through the
process of PV. Notwithstanding such widespread scholarly work documenting
bias practices in the profession, SA’s institutional investors do not associate
professional valuation services with bias behaviour.
The common practice of bias in favour of financial information at the expense
of nonfinancial information is perpetuated in current retail investment decision
making processes. Failure to incorporate nonfinancial information during the
stage concerned with forecasting expected returns is likely to result in
suboptimal decision making. On this vein, there is a need to improve current
investment decision processes when dealing with the retail sector. This report
posits that using a Balanced Scorecard framework would offer invaluable
decision making insights.
7.4 Conclusion
This study highlighted the nuanced approach required in investment decision
making when considered in the context of the retail sector. While there is
ongoing debate in the area of finding a universally accepted decision framework
(Sah, 2011), decision making frameworks presently in use fail to consider the
unique performance-related attributes of the retail sector. In such a fiercely-
contested economic environment, as a result of the recent economic meltdown,
therefore, there is a need to improve current real estate investment decision
making processes. This study suggested the use of a Balanced Scored
framework to aid current retail investment decision processes.
© 2014 University of Pretoria. All rights reserved. The copyright in this work vests in the University of Pretoria

98 | P a g e
7.5 Direction of Future Research
The study mainly investigated the usefulness of nonfinancial factors in retail
decision making frameworks, using South African data to test the proposed
hypotheses. While there was progress made into gaining insight on retail
decision processes in a South African context, the study also touched on other
areas of interest which might warrant further scholarly investigation.
This study investigated the usefulness of nonfinancial information in the
context of informing investment decisions, in particular, forecasting expected
returns in a retail setting. In this regard, the study found nonfinancial
information to be of invaluable input. Subsequent studies could pursue this
area further, and design a Balanced Scorecard to aid retail decision making
processes.
According to Knight Frank (2013), there are over 1500 shopping centres in
South Africa today. Due to a number of constraints alluded to earlier in this
study regarding attainment of a bigger sample size, this report focussed only
on a small sample of institutional investors. Given the high number of
shopping centres in the country, it would be useful to obtain a much more
broader view on the issues investigated by this study. In particular, it would
be interesting to emulate the study by Farragher and Savage (2008) and also
solicit the input of private investors.
The area of sales leakage warrants further investigation given that sales
figures eluding the turnover calculation net can result in an understatement of
the shopping mall’s variable rental income. In a South African context, where
the number of shopping malls has grown tremendously since 1994, increased
competition will continue to be a key feature of business in the real estate
industry. Using Porter’s (1996) framework of strategy, attractive returns as
generated by rising turnover levels seem likely to come from differentiation, in
the form of a tenant mix strategy. Increased sales, however, will not translate
into variable/turnover rental if the adage of sales leakage is not adequately
© 2014 University of Pretoria. All rights reserved. The copyright in this work vests in the University of Pretoria

99 | P a g e
addressed by landlords. Therefore, there is a need to understand the factors
that perpetuate the incidence of sales leakage in shopping malls. The current
practice by South African landlords is to engage the services of external
auditors in order to identify transgressors within tenants in a shopping mall.
To some extent, such audits might serve as a deterrent for tenants to refrain
from such counter-performance practices, particularly as a consequence of
the stiff penalties imposed by landlords on offenders. Audits, however, are by
nature reactive, and therefore fall short in so far as advancing an
understanding of the antecedents of such incongruent tenant behaviour.
There is a myriad of operational challenges facing landlords in the South
African real estate market. On the income side, one obvious challenge is that
of how to control the incidence of sales leakage as discussed above. Yet on
the costs side, a seemingly common theme evident in a number of property
company’s financial reports is that of flaring operational costs (See Figure
7.1, for example). All such factors have a negative impact on financial
performance. To date, such challenges have on the whole been tackled at
firm level, yet they do not seem to subside as they are persistently reported
on in yearly reports. Reid (2009) advances the concept of open innovation
as a possible solution to common problems faced by an industry. Open
innovation is defined in the context of competing firms joining forces in order
to address an industry-wide challenge. Therefore, given this common costs
challenge encountered by SA landlords, an investigation into how the
concept of open innovation can be embraced by competing landlords is
perhaps warranted.
© 2014 University of Pretoria. All rights reserved. The copyright in this work vests in the University of Pretoria
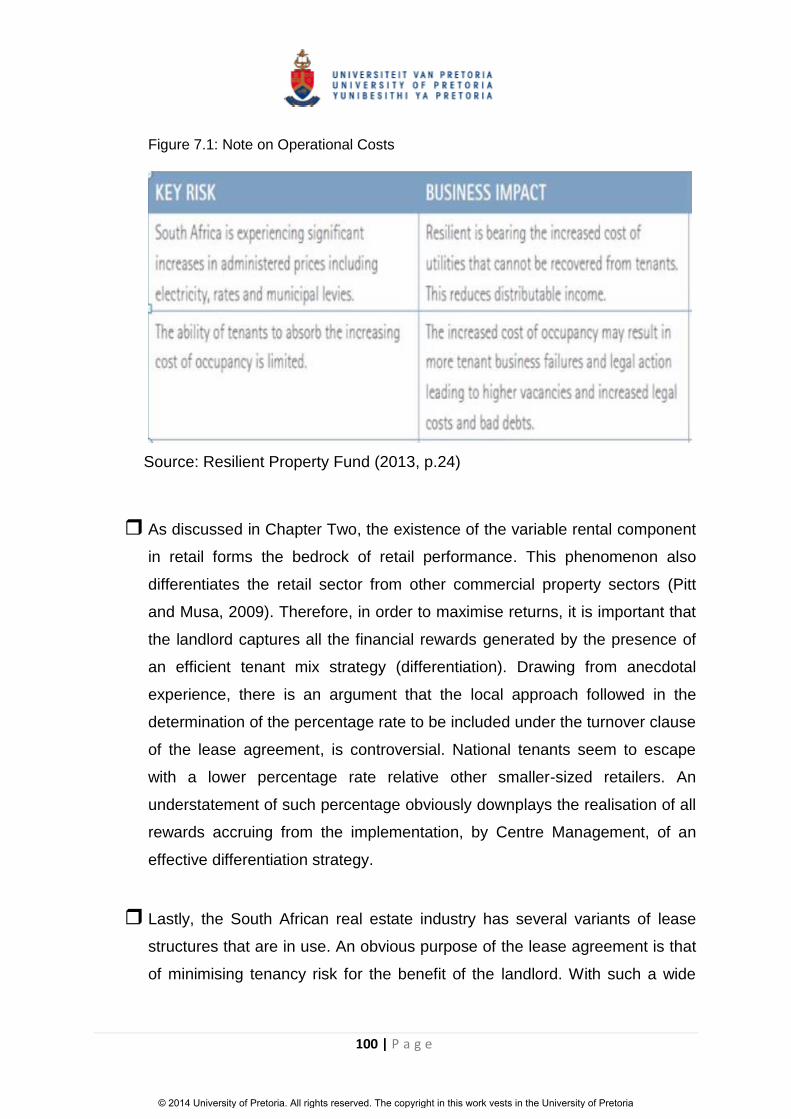
100 | P a g e
Figure 7.1: Note on Operational Costs
Source: Resilient Property Fund (2013, p.24)
As discussed in Chapter Two, the existence of the variable rental component
in retail forms the bedrock of retail performance. This phenomenon also
differentiates the retail sector from other commercial property sectors (Pitt
and Musa, 2009). Therefore, in order to maximise returns, it is important that
the landlord captures all the financial rewards generated by the presence of
an efficient tenant mix strategy (differentiation). Drawing from anecdotal
experience, there is an argument that the local approach followed in the
determination of the percentage rate to be included under the turnover clause
of the lease agreement, is controversial. National tenants seem to escape
with a lower percentage rate relative other smaller-sized retailers. An
understatement of such percentage obviously downplays the realisation of all
rewards accruing from the implementation, by Centre Management, of an
effective differentiation strategy.
Lastly, the South African real estate industry has several variants of lease
structures that are in use. An obvious purpose of the lease agreement is that
of minimising tenancy risk for the benefit of the landlord. With such a wide
© 2014 University of Pretoria. All rights reserved. The copyright in this work vests in the University of Pretoria

101 | P a g e
array of lease structures in operation, perhaps an investigation into which
lease structure(s) are appropriate for which property sector(s) is warranted.
© 2014 University of Pretoria. All rights reserved. The copyright in this work vests in the University of Pretoria

102 | P a g e
8 References
Acemoglu, D. & Robinson, J.A. (2012). The making of prosperity and poverty. Why
Nations Fail: The Making of Power, Prosperity and Poverty, New York: Crown
Publishers, 70 – 95.
Artemenkov, A. I., Mikerin, G. I., & Artemenkov, I. L. (2008). Professional Valuation
and Investment-Financial Valuation: Distinctions in Valuations for Private and
Public Markets. The Appraisal Journal, 76(4), 355 - 370.
Allard, T., Babin, B.J. & Chebat, J. (2009). When income matters: Customers
evaluation of shopping malls’ hedonic and utilitarian orientations. Journal of
Retailing and Consumer Services, 16, 40 – 49.
Atherton, E., French, N., & Gabrielli, L. (2008). Decision theory and real estate
development: A note on uncertainty. Journal of European Real Estate
Research, 1(2), 162-182.
Beattie, A. (2013). African opportunities: Balancing risk and reward.
Retrieved from
http://www.financialmail.co.za/specialreports/propertyhandbook/2013/07/26/af
rican-opportunities-balancing-risk-and-reward [Accessed: 19 August 2013].
Boshoff, D. G. (2008). Valuing Real Estate as Contractual Cash-Flow with a Put-
Option. economics, 356 - 357.
Burnaz, S. & Topcu, Y.L. (2011). A decision support on planning retail tenant mix in
shopping malls. Procedia Social and Behavioural Sciences, 24, 317 – 324.
Business Day, (2013). There are opportunities for property investors and developers
to achieve high returns in Africa, says head of Africa at property consultancy
Knight Frank.
Retrieved from
http://www.eprop.co.za/news/item/15712-developers-heed-irresistible-draw-
of-malls.html [Accessed 7 October 2013].
© 2014 University of Pretoria. All rights reserved. The copyright in this work vests in the University of Pretoria
103 | P a g e
Carter, C.C. (2009). What we know about shopping centers. Journal of Real Estate
Literature,17(2), 165 – 180.
Carter, C. C., & Haloupek, W. J. (2002). Dispersion of stores of the same type in
shopping malls: theory and preliminary evidence. Journal of Property
Research, 19(4), 291-311.
Chan, S.H., Leung, W.K., & Wang, K. (1998). Institutional investment in REITs:
evidence and implications. Journal of Real Estate Research, 16(3), 357-374.
Clayton, J., Ling, D.C. & Naranjo, A. (2009). Commercial real estate valuation:
Fundamentals versus investor sentiment. Journal of Real Estate Financial
Economics, 38, 5 - 37.
Crosby, N., Lizieri, C., & McAllister, P. (2010). Means, motive and opportunity?
Disentangling client influence on performance measurement appraisals.
Journal of Property Research, 27(2), 181-201.
Dawson, J., & Lord, D. (Eds.). (2012). Shopping Centre Development (RLE Retailing
and Distribution). Routledge.
De Wit, I. (2010). International diversification strategies for direct real estate. The
Journal of Real Estate Finance and Economics, 41(4), 433-457.
Dhar, R., & Goetzmann, W. N. (2006). Institutional perspectives on real estate
investing. The Journal of Portfolio Management, 32(4), 106-116.
DiPasquale, D., & Wheaton, W. C. (1992). The markets for real estate assets and
space: a conceptual framework. Real Estate Economics, 20(2), 181-198.
Doppegieter, J., & Rode, E. (2002). Capitalisation rates and property yields: an
analysis of the South African commercial property market. School of Business
Administration.
Retrieved from
http://0citeseerx.ist.psu.edu.innopac.up.ac.za/viewdoc/download?doi=10.1.1.1
98.6432&rep=rep1&type=pdf [Accessed: 30 September 2013]
© 2014 University of Pretoria. All rights reserved. The copyright in this work vests in the University of Pretoria

104 | P a g e
Drury, C. (2009). Management Accounting for Business. Hampshire: Cengage
Learning.
eProp, (2013). Acquisition opportunities returning to listed property sector.
Retrieved from
http://www.eprop.co.za/news/item/15589-acquisition-opportunities-returning-
to-listed-property-sector.html [Accessed 28 August 2013].
Ernst and Young. (2012). Africa getting down to business.
Retrieved from
http://www.ey.com/ZA/en/Issues/Business-environment/2012-Africa-
attractiveness-survey [Accessed: 4 November 2013].
Farragher, J. & Savage, A. (2008). An investigation of real estate investment
decision-making practices. Journal of Real Estate Practice and Education,
11(1), 29 – 40.
Financial Mail (2013). The Rankings: MBAs.
Retrieved from
http://www.financialmail.co.za/coverstory/2013/09/26/the-rankings-
mbas [ Accessed: 25 October 2013].
Fogel, S., & Berry, T. (2006). The Disposition Effect and Individual Investor
Decisions: The Roles of Regret and Counterfactual Alternatives. Journal of
Behavioral Finance, 7(2), 107-116.
Fowler, F.J. (2009). Survey research methods. (4th Ed.). California: Sage.
Franceschini, F., Galetto, M., & Turina, E. (2013). Techniques for impact evaluation
of performance measurement systems. International Journal of Quality &
Reliability Management, 30(2), 197-220.
French, N. (2001). Decision theory and real estate investment: An analysis of the
decision-making processes of real estate investment fund managers.
Managerial and Decision Economics, 22, 399 – 410.
© 2014 University of Pretoria. All rights reserved. The copyright in this work vests in the University of Pretoria
105 | P a g e
Fuss, R., Richt, J., & Thomas, M. (2012). Excess return sources of active property
management: A case study. Journal of Property Investments and Finance,
30(4), 354 – 374.
Games, G. (2012). Business in Africa: Corporate insights. Rosebank: Penguin
Books.
Gliem, J. A., & Gliem, R. R. (2003). Calculating, interpreting, and reporting
Cronbach’s alpha reliability coefficient for Likert-type scales. Midwest
Research-to-Practice Conference in Adult, Continuing, and Community
Education.
Retrieved from
http://www.alumnisu.org/midwest/midwest%20papers/Gliem%20%26%20Glie
m--Done.pdf [ Accessed: 23 December 2013].
Grewal, D., Levy, M. & Kumar, V. (2009). Customer experience management in
retailing: An organizing framework. Journal of Retailing, 85(1),1 – 14.
Halvitigala, D., Murphy, L., & Levy, D. (2011). Dominant and non-dominant lease
structures and their effect on place-based valuation practices. Journal of
Property Investment & Finance, 29(6), 595-611.
Hays, F. H., De Lurgio, S. A., & Gilbert, A. (2009). Efficiency ratios and community
bank performance. Journal of Finance and Accountancy, 1, 1-15.
Idzorek, T. M., Barad, M., & Meier, S. L. (2007). Global commercial real estate. The
Journal of Portfolio Management, 33(5), 37-52.
International Monetary Fund (2012). World economic outlook database
Retrieved from
http://macromon.wordpress.com/2012/11/13/top-30-fastest-and-slowest-
growing-economies/ [Accessed: 30 September 2013]
© 2014 University of Pretoria. All rights reserved. The copyright in this work vests in the University of Pretoria

106 | P a g e
Ittner, C. D., & Larcker, D. F. (1998). Are nonfinancial measures leading indicators of
financial performance? An analysis of customer satisfaction. Journal of
accounting research, 36, 1-35.
Jackson, C. (2006). Retail planning and institutional property investment. Regional
Studies, 40(5), 555-561.
Jackson, C. & Watkins, C. (2011). Planning policy and retail property investment in
the UK. Urban Studies, 48(11), 2321 - 2338.
Julie, P. (2007). SPSS Survival manual: A step by step guide to data analysis using
SPSS for Windows Version 15. Open University Press, UK.
Kaiser, R. W. (2005). Analyzing real estate portfolio returns. The Journal of Portfolio
Management, 31(5), 134-142.
Kaplan, R. S., & Norton, D. P. (1996). Using the balanced scorecard as a strategic
management system. Harvard business review, 74(1), 75-85.
Kaplan, N.S. & Norton, D.P., (2001). Transforming the Balanced Scorecard from
performance measurement to strategic management: Part 1. Accounting
Horizons, 15(1), 87 – 104.
Knight Frank, (2013). Africa report.
Retrieved from
http://my.knightfrank.co.uk/research/?regionid=3 [Accessed: 25 July 2013].
Leedy, P. & Ormrod, J. E. (2010). Practical Research: Planning and Design, 9th Ed,
New Jersey: Pearson Education International.
Levy, D., & Schuck, E. (1999). The influence of clients on valuations. Journal of
Property Investment & Finance, 17(4), 380 - 400.
Levy, D., & Schuck, E. (2005). The influence of clients on valuations: the clients'
perspective. Journal of Property Investment & Finance, 23(2), 182-201.
© 2014 University of Pretoria. All rights reserved. The copyright in this work vests in the University of Pretoria
107 | P a g e
Lieser, K. & Groh, A.P. (2011). The attractiveness of 66 countries for institutional real
estate investments. Journal of Real Estate Portfolio Management, 17(3), 191
– 211.
Lim, L.C., Berry, J. & Sieraki, K. (2013). Prime versus secondary real estate: When
to buy and sell. Journal of Property Investments and Finance, 31(3), 254 –
266.
Louargand, M. A. (1992). Survey of pension fund real estate portfolio risk
management practices. Journal of Real Estate Research, 7(4), 361-73.
MacCowan, R. J., & Orr, A. M. (2008). A behavioural study of the decision processes
underpinning disposals by property fund managers. Journal of Property
Investment & Finance, 26(4), 342-361.
McGregor BFA (2013).
Retrieved from
https://expert.mcgregorbfa.com [Accessed: 25 July 2013].
Mittal, V., Huppertz, J.W., & Khare, A. (2008). Customer complaining: The role of tie
strength and information control. Journal of Retailing, 84(2), 195–204.
Mejia, L. C., & Benjamin, J. D. (2002). What do we know about the determinants of
shopping center sales? Spatial vs. non-spatial factors. Journal of Real Estate
Literature, 10(1), 1-26.
Moshirian, F. (2008). Globalisation, growth and institutions. Journal of Banking and
Finance, 32, 472–479.
Newell, G. & Seabrook, R. (2006). Factors influencing hotel investment decision
making. Journal of Property Investment & Finance, 24(4), 279–294.
Niskanen, J., & Falkenbach, H. (2010). REITs and correlations with other asset
classes: A European perspective. Journal of Real Estate Portfolio
Management, 16(3), 227-239.
© 2014 University of Pretoria. All rights reserved. The copyright in this work vests in the University of Pretoria

108 | P a g e
Norreklit, H. (2000). The balance on the balanced scorecard a critical analysis of
some of its assumptions. Management accounting research, 11(1), 65-88.
O’Neill, F. (2009). The property cycle. Accountancy Ireland, 41(1), 44–45.
Parker, D. (2013). Unlisted property fund decision making: Decision maker survey
preliminary findings. 19th Annual Pacific-Rim Real Estate Society Conference.
Melbourne Australia, 13-16 January.
Pitt, M. & Musa, Z.N. (2009). Towards defining shopping centres and their
management systems. Journal of Retail and Leisure Property, 8(1), 39 - 55.
Porter M. (1996). What is strategy? Harvard Business Review, 74(6), 61–80.
Razali, N. M., & Wah, Y. B. (2011). Power comparisons of shapiro-wilk, kolmogorov-
smirnov, lilliefors and anderson-darling tests. Journal of Statistical Modeling
and Analytics, 2(1), 21-33.
Reid, P.M. (2009). Open innovation: An evolving entrepreneurial technique.
International Review of Entrepreneurship, 7(1), 83-96.
Reinartz, W., Dellaert, B., Krafft, M., Kumar, V., & Varadarajan, R. (2011). Retailing
innovations in a globalizing retail market environment. Journal of Retailing, 87,
S53-S66.
Resilient Property Fund (2013). Interim Financial Statements as at 30 June.
Retrieved from
http://www.resilient.co.za/FileBrowser/EditorFiles/Resilient%20-
%202013%20Integrated%20Report.pdf [Accessed: 1 October 2013]
Roberts, C. & Henneberry, J. (2007). Exploring office investment decision-making in
different European contexts. Journal of Property Investment & Finance,
25(3), 289–305.
Robins, E. (2007). Measuring performance. The Property Handbook, Rosebank:
Johnnic Publishing Media Services, 20–21.
© 2014 University of Pretoria. All rights reserved. The copyright in this work vests in the University of Pretoria
109 | P a g e
Sah, V., Gallimore, P., & Clements, J.S. (2010). Experience and real estate
investment decision-making: A process tracing investigation. Journal of
Property Research, (27)3, 207–219.
Sah, V. (2011). Asset acquisition criteria: A process tracing investigation into real
estate investment decision making. Journal of Property Investment & Finance,
29(1), 7–18.
SAPOA/IPD South African Annual Property Index (2007). Results for the year to
December 2007. Morningside, South Africa: Investment Property Databank.
SAPOA/IPD South African Annual Property Index (2012). Results for the year to
December 2012. Morningside, South Africa: Investment Property Databank.
Saunders, M. & Lewis, P. (2012). Doing Research in Business & Management.
Essex: Person Education Limited.
Shapiro, S. S., & Wilk, M. B. (1965). An analysis of variance test for normality
(complete samples). Biometrika, 52(3/4), 591-611.
Tavakol, M., & Dennick, R. (2011). Making sense of Cronbach's alpha. International
Journal of Medical Education, 2, 53-55.
The World Bank, & International Finance Corporation. (2013). Doing business 2013,
smarter regulations for small and medium sized enterprises. 10th Ed.
Washington: doi:10.1596/978-0-8213-9615-5.
Too, L., Harvey, M., & Too, E. (2010). Globalisation and corporate real estate
strategies. Journal of Corporate Real Estate, 12(4), 234–248.
Topintzi, E., Chin, H., & Hobbs, P. (2008). Moving towards a global real estate index.
Journal of Property Investment & Finance, 26(4), 286-303.
UNDP (2012). Human Development Report.
Retrieved from
http://hdr.undp.org/en/media/HDR_2013_EN_complete.pdf [Accessed: 4
June 2013]
© 2014 University of Pretoria. All rights reserved. The copyright in this work vests in the University of Pretoria

110 | P a g e
Urban Land Institute, (2008). Dollars and Cents of Shopping Centers. The Land
Urban Land Institute. Washington, DC.
Verhoef, P.C., Lemon, K.N., Parasuraman, A., Roggeveen, A., Tsiros, M., &
Schlesinger, L.A. (2009). Customer experience creation: Determinants,
dynamics, and management strategies. Journal of Retailing, 85(1), 31–41.
Viruly, F. (2013). Property investment: Tread with more restraint
Retrieved from
http://www.financialmail.co.za/specialreports/propertyhandbook/2013/07/26/pr
operty-investment-tread-with-more-restraint [Accessed: 15 August 2013]
Weiers, R.M. (2011). Introductory Business Statistics. South-Western: Cengage
Learning Limited.
Wheaton, W. C. (2000). Percentage Rent in Retail Leasing: The Alignment of
Landlord–Tenant Interests. Real Estate Economics, 28, 185–204.
Yuan, H. & Krishna, A. (2008). Pricing of mall services in the presence of sales
leakage. Journal of Retailing, 84(1), 95–117.
Zikmund, W. G. (2000). Business research methods (6th Ed). Dryden London:
Harcourt Brace.
Zikmund, W.G. (2003). Business research methods (7th Ed). Oklahoma: South
Western.
© 2014 University of Pretoria. All rights reserved. The copyright in this work vests in the University of Pretoria

111 | P a g e
9 Appendices
9.1 SAPOA/IPD SA Property Index Contributors for 2012
1) Atterbury Investment Holdings
2) Business Venture Investments No 1360 ◄
3) Capital Property Fund►
4) Community Property Fund
5) Emira Property Fund
6) Fountainhead Property Trust
7) Growthpoint Properties Limited
8) Hyprop Investments
9) Liberty Life Property Portfolio
10) Metropolitan Life Properties♥
11) Momentum Property Investment Portfolio♥
12) Old Mutual Direct Property Fund╘
13) Old Mutual Triangle Core Fund╘
14) Pareto Limited
15) Rapfund▲
16) Redefine Income Fund Limited
17) Resilient Property Income Fund
18) Retail Africa Direct Fund▲
19) SA Corporate Real Estate
20) Vukile Property Fund Limited
21) Wingspan▲
Source: IPD South Africa Notes ◄ Jointly owned by Old Mutual & Pareto Limited ▲ Funds owned by Retail Africa (Pty) Ltd ► Owned by Resilient Properties ♥ Owned by Momentum Health (FirstRand Group) ╘ Owned by Old Mutual Property
© 2014 University of Pretoria. All rights reserved. The copyright in this work vests in the University of Pretoria

112 | P a g e
9.2 JSE Listed Property Funds (31 Dec 2012)
Fund Name Market Capitalisation
R
1 REB - Rebosis Property Fund Lt
2,887,621,831
2 ACP - Acucap Properties Ltd
8,258,172,968
3 BNT - Bonatla Property Hldgs
35,567,138
4 ANA - Adrenna Property Grp Ltd
19,570,180
5 ITU - Intu Properties Plc
42,207,787,848
6 ARD - Ardor Sa Ltd
3,259,184
7 FFA - Fortress Inc Fund Ltd A
4,389,059,322
8 FFB - Fortress Inc Fund Ltd B
2,157,080,349
9 VIF - Vividend Income Fund Ltd
1,062,379,424
10 HYP - Hyprop Inv Ltd
17,747,261,337
11 ING - Ingenuity Property Inv
546,527,000
12 NEP - New Europe Prop Inv Plc
7,867,737,284
13 OCT - Octodec Invest Ltd
2,110,385,881
14 ORE - Orion Real Estate Ltd
201,823,580
15 PNG - Pinnacle Point Group Ltd
83,111,224
16 PPR - Putprop Ltd
207,309,319
17 RES - Resilient Prop Inc Fund
14,787,255,622
18 VKE - Vukile Property Fund Ltd
7,444,064,582
19 AWA - Arrowhead Properties A
1,193,470,881
20 AWB - Arrowhead Properties B
1,170,069,491
21 IPF - Investec Property Fund L
4,574,003,000
22 SGA - Synergy Inc Fund Ltd A L
496,724,609
23 SGB - Synergy Inc Fund Ltd B L
690,228,828
24 VPF - Vunani Prop Inv Fund Ltd
1,157,933,568
© 2014 University of Pretoria. All rights reserved. The copyright in this work vests in the University of Pretoria

113 | P a g e
25
DIA - Dipula Income Fund A
1,720,854,954
26 DIB - Dipula Income Fund B
1,219,955,555
27 CCO - Capital&Counties Prop Pl
25,229,781,400
28 FVT - Fairvest Property Hldgs
381,543,387
29 GRT - Growthpoint Prop Ltd
43,306,287,195
30 HPA - Hospitality Prop Fund A
1,890,135,073
31 HPB - Hospitality Prop Fund B
437,912,482
32 MSP - Mas Real Estate Inc.
471,215,140
33 PMM - Premium Properties Ltd
2,790,561,340
34 QPG - Quantum Prop Group Ltd
29,065,076
35 RDF - Redefine Properties Ltd
26,003,913,193
36 TDH - Tradehold Ltd
1,143,177,015
37 ANP - Annuity Properties Ltd
1,029,231,043
38 AIA - Ascension Prop Ltd A
760,883,245
39 AIB - Ascension Prop Ltd B
742,258,736
40 ROC - Rockcastle Global Real E
1,498,000,000
41 OPI - Osiris Properties Int Lt
8,966,430
42 DLT - Delta Property Fund Ltd
1,385,457,066
Total Market Capitalization
231,347,602,780
Source: McGregor BFA
© 2014 University of Pretoria. All rights reserved. The copyright in this work vests in the University of Pretoria

114 | P a g e
9.3 Africa’s Projected GDP growth rates (% change y/y 2012 -2017)
Source: E & Y, 2012.
© 2014 University of Pretoria. All rights reserved. The copyright in this work vests in the University of Pretoria
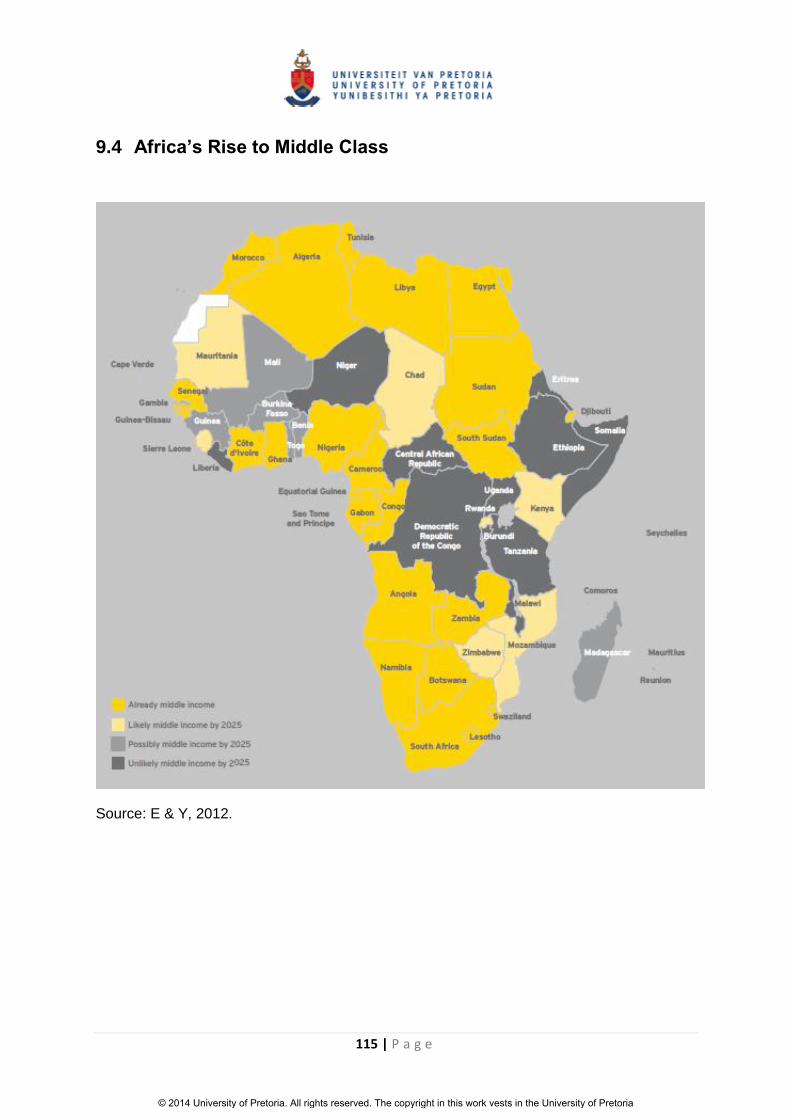
115 | P a g e
9.4 Africa’s Rise to Middle Class
Source: E & Y, 2012.
© 2014 University of Pretoria. All rights reserved. The copyright in this work vests in the University of Pretoria

116 | P a g e
9.5 Roberts & Henneberry’s Decision Framework
Source: Roberts & Henneberry (2007, p.298)
© 2014 University of Pretoria. All rights reserved. The copyright in this work vests in the University of Pretoria

117 | P a g e
9.6 Parker’s Decision Framework
Source: Parker (2013, p.3-4)
© 2014 University of Pretoria. All rights reserved. The copyright in this work vests in the University of Pretoria

118 | P a g e
9.7 Farragher & Savage’s Decision Framework
Source: Farragher & Savage (2008, p.32)
© 2014 University of Pretoria. All rights reserved. The copyright in this work vests in the University of Pretoria

119 | P a g e
9.8 Classification Hierarchy of Tenants
Source: ULI – abbreviated, 2008.
© 2014 University of Pretoria. All rights reserved. The copyright in this work vests in the University of Pretoria

120 | P a g e
9.9 Draft Research Questionnaire
Questionnaire
1.) Respondent Number………………..
Please indicate the most accurate answer(s) by ticking the appropriate box / boxes.
Part I - PERSONAL INFORMATION
2.) What is your current Job Title?
1.1 Chief Executive Officer
1.2 Chief Investment Officer
1.3 Acquisitions Manager
1.4 Asset Manager
1.5 Portfolio Manager
1.6 Other______________________________________
3.) Please briefly describe the key functions of your current position?
______________________________________________________________
______________________________________________________________
______________________________________________________________
______________________________________________________________
______________________________________________________________
4.) For how many years have you been in the COMMERCIAL PROPERTY industry, in a decision-making position?
…………………
© 2014 University of Pretoria. All rights reserved. The copyright in this work vests in the University of Pretoria

121 | P a g e
5.) For how many years have you been in the RETAIL property sector where you currently work (in a decision-making position)?
…………………
6.) Please indicate your highest academic qualification:
Matric
Undergraduate
Postgraduate
Part II - PORTFOLIO INFORMATION
7.) What is the approximate size of commercial property investment held by your institution?
≤ R1bn
> R1bn ≤ R5bn
> R5bn ≤ R10bn
> R10bn ≤ R15bn
> R15bn
© 2014 University of Pretoria. All rights reserved. The copyright in this work vests in the University of Pretoria

122 | P a g e
8.) In which geographical market(s) does your institution invest?
South Africa
Other African countries
Rest of the world
9.) In what property types does your institution invest in?
Commercial (Offices)
Industrial (Warehouses)
Residential
Retail
Other
10.) What is the approximate total exposure to RETAIL property by your institution?
South Africa
Other African Countries
Rest of the world
≤ R1bn
> R1bn ≤ R5bn
> R5bn ≤ R10bn
> R10bn ≤ R15bn
> R15bn
© 2014 University of Pretoria. All rights reserved. The copyright in this work vests in the University of Pretoria

123 | P a g e
11.) In your institution, portfolio diversification is based on the following factors:
(1=Strongly Agree; 2=Agree; 3=Neutral; 4=Disagree; 5=Strongly Disagree)
Statement 1 2 3 4 5
Geographic location
Property type
Economic location
Tenant type
Property size
Property age
Part III – INVESTMENT DECISION MAKING
12.) The purpose of the Professional Valuer (PV) is to establish the Market Value (MV) of the property. Please rate the following statements?
(1=Strongly Agree; 2=Agree; 3=Neutral; 4=Disagree; 5=Strongly Disagree)
Statement 1 2 3 4 5
PVs sometimes compromise their professional integrity by providing MVs in line with client requests
PVs earning a disproportionate fee from one client are likely to succumb to client influence
PVs from larger firms are likely to resist client influence relative to those from smaller firms
PVs sometimes compromise MVs through lack of experience in certain lease structures
Big clients (e.g. Banks) are more likely to influence PVs relative to small clients
© 2014 University of Pretoria. All rights reserved. The copyright in this work vests in the University of Pretoria

124 | P a g e
For purposes of answering Questions 13 – 15, assume that your institution is faced with an investment decision to acquire a Community shopping mall
13.) The following list represents a 9 stage, linear investment decision-making framework.
Stage Description
1 Setting strategy
2 Establishing return/risk objectives
3 Searching for investment opportunities
4 Forecasting expected returns
5 Evaluating forecasts
6 Assessing and adjusting for risk
7 Decision-making
8 Implementing accepted proposals
9 Auditing operating performance
Listed in order of importance, in your opinion, which top four (4) stages will be considered important to the investment decision?
Ranking Stage Description
1st
2nd
3rd
4th
© 2014 University of Pretoria. All rights reserved. The copyright in this work vests in the University of Pretoria

125 | P a g e
14.) When forecasting future financial performance, please rate the importance of the following historical financial performance information to the investment decision?
(1= least important, 2=important, 3=neutral, 4=important, and 5= most important).
Statement 1 2 3 4 5
Efficiency Ratio (Expenses over Income)
Turnover Growth Ratios
Net Rental over Turnover
Gross Property Income over Turnover
Spend per head
Other (please specify)
15.) When forecasting future financial performance, please rate the importance of the following nonfinancial information to the investment decision?
(1= least important, 2=important, 3=neutral, 4=important, and 5= most important).
Statement 1 2 3 4 5
Presence of Anchor tenants in the Mall
Presence of Substitute and Complimentary tenants in the Mall
Presence of Franchised versus Independent stores in the Mall
Brand image of Mall tenants
Quality of Mall management
© 2014 University of Pretoria. All rights reserved. The copyright in this work vests in the University of Pretoria

126 | P a g e
Part IV – CONCLUSION
16.) What other areas of research do you think need to be explored in the South African retail property sector? (Please list)
______________________________________________________________
______________________________________________________________
______________________________________________________________
______________________________________________________________
______________________________________________________________
______________________________________________________________
______________________________________________________________
______________________________________________________________
______________________________________________________________
______________________________________________________________
End.
Thank you for taking time to complete this questionnaire.
© 2014 University of Pretoria. All rights reserved. The copyright in this work vests in the University of Pretoria
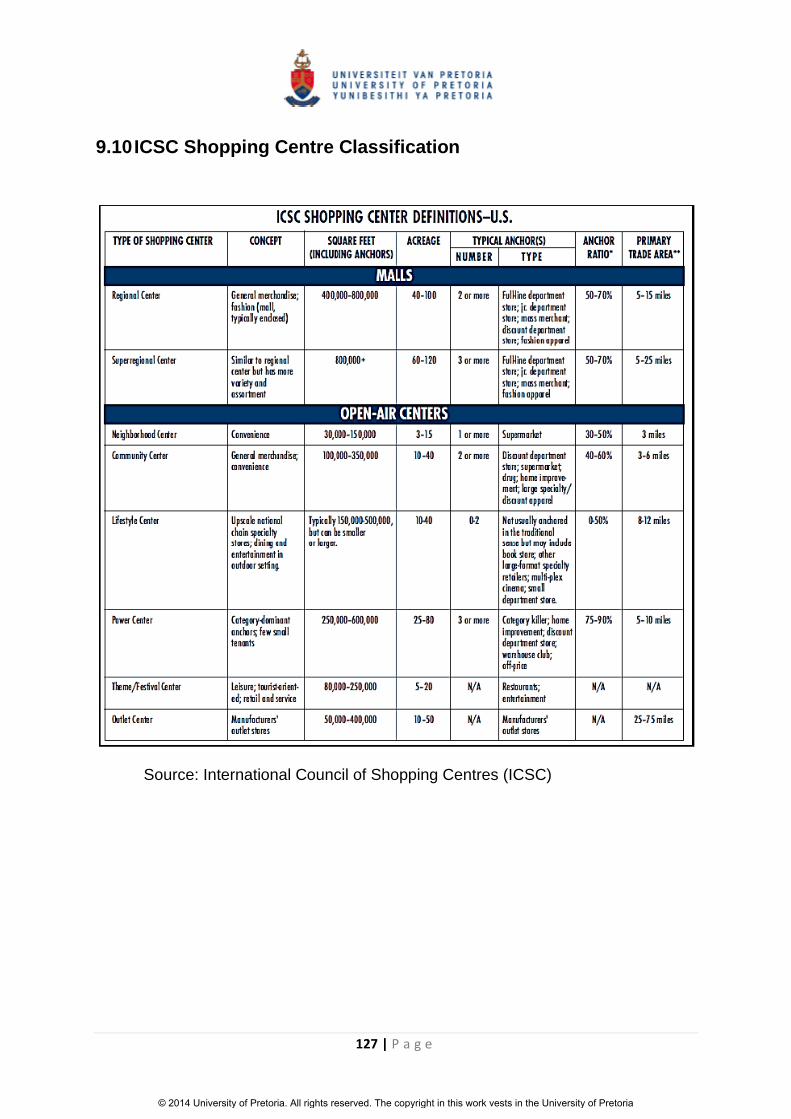
127 | P a g e
9.10 ICSC Shopping Centre Classification
Source: International Council of Shopping Centres (ICSC)
© 2014 University of Pretoria. All rights reserved. The copyright in this work vests in the University of Pretoria

128 | P a g e
9.11 Covering Letter to Questionnaire
Dear Sir / Madam
REQUEST FOR ASSISTANCE IN RESEARCH: RETAIL INVESTMENT DECISION
MAKING FRAMEWORKS
I am an MBA Student at The Gordon Institute of Business Science (GIBS),
University of Pretoria. The goal of my research is to investigate the role of
nonfinancial information in a retail investment decision making setting.
An electronic Questionnaire was compiled after studying the appropriate Real Estate
decision making literature and theories. The Questionnaire is being distributed to
contributors to the SAPOA/IPD South Africa Property Index for 2012.
If my request meets your approval, please click on the link below to complete the
questionnaire, which will take approximately 15 minutes to complete. The first
question requires your Respondent Number which is also provided below.
Your participation in the study is voluntary and you can withdraw at any time. All
participants will remain anonymous throughout the research, and once the
questionnaire has been completed, all data will be confidential.
Please complete and submit the survey by …………………………….
If you have any concerns, please contact me or my research supervisor (details
below).
Researcher Supervisor
Name Mdu Nsibande Dr Douw Boshoff
Cell Number 076 176 1849 083 287 2639
Email [email protected] [email protected]
LINK: ………………………………………….
Respondent Number: ……………………..
Best Regards
Mdu Nsibande (Project Researcher)
© 2014 University of Pretoria. All rights reserved. The copyright in this work vests in the University of Pretoria