the australian national university centre for economic
TRANSCRIPT
The Australian National University
Centre for Economic Policy Research DISCUSSION PAPER
Do Coresidency with and Financial Transfers from Children Reduce the Need for Elderly Parents to Work in
Developing Countries?
Lisa A. Cameron * and Deborah Cobb-Clark**
DISCUSSION PAPER NO. 508 December 2005
ISSN: 1442-8636 ISBN: 0 7315 3578 2
* Lisa A. Cameron, Department of Economics, University of Melbourne ** Deborah Cobb-Clark, Social Policy Evaluation, Analysis and Research Centre, and Economics Program, Research School of Social Sciences, Australian National University and Institute for Labor Studies (IZA)
Direct correspondence to Deborah Cobb-Clark, SPEAR Centre, RSSS, Building 9, Australian National University, Canberra, ACT 0200, Australia. phone: (612) 6125-3267. Fax: (612) 6125-0182. Email: [email protected] Acknowledgements
We thank Patricia Apps, Robert Breunig, Denise Doiron, Mardi Dungey, Thomas Crossley, Bo Honore, Cordelia Reimers and two anonymous referees for helpful comments. This research was funded by
Australian Research Council Grant No. S79813009.

ABSTRACT
What drives the labor supply decisions of the elderly in developing countries? To what
extent do elderly parents use coresidence with or financial transfers from children to
reduce their own labor supply in old age? These questions are increasingly important
because populations in many developing countries are rapidly aging. A clear
understanding of the relationships between different means of support in old age is
crucial to the development of sensible policy responses. This paper is one of only a few
studies that seeks to formally model elderly labor supply in the context of a developing
country while taking into account coresidency with and financial transfers from children.
We find little evidence that support from children – either through transfers or
coresidency – substitutes for elderly parents’ need to work. Thus, as in developed
countries, there is a role for public policy to enhance the welfare of the elderly
population.
Keywords: Intergenerational transfers, Old-age support, Elderly labor supply JEL-Code: J226, J22, J14
ii

1. Introduction Like the populations of industrialized nations, the populations of many developing countries
are also aging rapidly. The experience of industrialized nations may tell us very little about
the consequences of population aging for developing countries, however, because the policy
context differs so dramatically. Pension plans, for example, are rare and when they do exist,
are generally only available to the elite. Without widely available pension schemes, the
majority of the elderly in developing countries must depend on their own labor market
income – in combination with often meager asset stocks, financial transfers from children, or
coresidency with children – to support them in old age. Unfortunately, any reliance on
support from children may become strained as elderly dependency ratios increase.
Little is known about the determinants of elderly individuals’ labor supply or about the
link between transfer behavior and coresidency patterns on the one hand and labor supply
behavior on the other. In particular, what drives the labor supply decisions of the elderly in
developing countries? To what extent do elderly parents use coresidence with or financial
transfers from children to reduce their labor supply in old age? Finally, are transfers and
coresidency targeted in the sense of being responsive to the needs of parents and the ability
of children to give? As labor supply, coresidency and financial transfers are not likely to be
determined in isolation, we adopt an empirical estimation strategy in which labor supply is
determined taking into account coresidency and the receipt of transfers. The use of
particularly detailed data on Indonesia’s elderly population from the Indonesian Family Life
Survey (IFLS) makes estimating such a model possible. The IFLS is unique in that it
provides information on all of the living children of elderly individuals — whether they live
with the parent or not — including the amount of financial transfers from non-coresident
children.

2
Indonesia provides an especially interesting case study of the labor supply of the
elderly. Indonesia has the third largest population over the age of 65 in the world and the
number of elderly Indonesians is projected to increase by 400 percent between 1990 and
2025 resulting in an expected doubling of the dependency ratio (Adlakha and Rudolph,
1994). At the same time, both public and private pensions are virtually non-existent outside
of the government sector. The majority of elderly Indonesians live with one or more adult
children and more than half receive financial transfers from non-coresident children.
Despite these forms of support, labor force participation remains high well into old age.
Labor supply, coresidency, and financial transfers all appear to be important mechanisms
through which elderly Indonesians maintain their living standards in old age.
An understanding of these alternative forms of support is crucial to the development of
policies that seek to improve the welfare of elderly populations in developing countries.
Calls for governments to provide support for the elderly in lower-income countries are likely
to increase as the elderly become a larger proportion of the total population especially if
economic growth and modern markets weaken traditional systems of family support.1
Making sensible choices about potential policy strategies — for example, public pension
schemes or the provision of old-age care — requires an understanding of the linkages
between different forms of support. This is the one of only a few studies of which we are
aware that seeks to formally model elderly labor supply in the context of a developing
country and the only one of which we are aware to examine labor supply in conjunction with
coresidency and financial transfers from children.
Our results indicate that coresidency and the provision of financial transfers do not
reduce the elderly parent’s own labor supply. The exception is non-coresiding women who
do decrease their labor supply slightly as their children’s transfers increase. Rather than an

3
explicit form of old-age support, coresidency with adult children appears to be a form of
household structure that simply evolves over the life cycle. Moreover, financial transfers
also do not appear to be motivated primarily by the desire to provide old age support in that
they are not strongly related to parental need or the ability to give. Overall then, our results
provide little support for the view that traditional family-support mechanisms in developing
countries substantially reduce the need for additional policies aimed at improving the living
standards of the elderly.
2. Existing Literature and the Indonesian Context
Despite a growing interest in the welfare of the elderly in developing countries — and an
established literature on retirement in developed countries — very little has been written on
the labor supply of the elderly in the developing world.2 We are aware of only two other
studies that seek to formally model elderly labor supply in a developing country. Mete and
Schultz (2002) examine elderly labor supply in Taiwan. Their main focus is the
responsiveness of labor supply to the introduction of a national health insurance scheme and
they do not examine other forms of support for the elderly. Kochar (2000) is closer to our
study in that she examines the relationship between days worked by coresiding fathers and
the incomes of their coresiding sons in Pakistan. She finds that these are negatively
correlated and concludes that one of the main benefits of coresidency is the provision of
household public goods by children. A number of other studies provide descriptive accounts
and statistics of elderly labor supply. Adlakha and Rudolph (1994) for example provide
some descriptive statistics of average hours worked by Indonesian elderly that show that
1 The impact of modernization on support for the elderly is a point of empirical debate, for example see
Frankenberg and Kuhn (2003) and Beard and Cartmill (2003). 2 There is a literature that assesses the impact of familial transfers on labor supply in developed countries. For
example, Joulfaian and Wilhelm (1994) and Holtz-Eakin, Joulfaian, and Rosen (1993) study the effect of inheritances on labor supply, while Rosenzweig and Wolpin (1993) model the effect of parental support –

4
two-thirds of older men and one-third of older women remain economically active.3 (See
also Cain (1991), Hugo (2000), Chen and Jones (1992).) Economic activity among the
elderly remains high in other Asian countries as well. Although the availability of public
pensions (mainly to civil servants) does contribute to retirement in some cases, the primary
factor underlying retirement is poor health (Hermalin, 2000).
More has been written on the other forms of support for the elderly — i.e., coresidency
and transfers. There is a small but expanding literature on coresidency, particularly in Asia.
DaVanzo and Chan (1994) examined coresidency in Malaysia, and Cameron (2000) and
Frankenberg, Beard and Saputra (1999) for Indonesia. Frankenberg, Chan and Ofstedal
(2002) examine transitions in and out of coresidency in three Asian countries: Indonesia,
Singapore and Taiwan. Martin (1989) also conducts a cross-country comparison of
coresidency behavior in Fiji, Korea, Malaysia and the Philippines, while Frankenberg, Chan,
and Ofstedal (2002) study living arrangements in Indonesia, Singapore and Taiwan.4
While DaVanzo and Chan (1994) find that coresidency responds to economic variables
such as the parent’s income and housing prices, Cameron (2000) and Martin (1989) find
only very small effects of economic variables on coresidency. Frankenberg, Beard and
Saputra (1999), using panel data, also found that economic factors did not play a significant
role in the transition to coresidency in Indonesia.5 At the same time, Frankenberg, Chan,
and Ofstedal (2002) find that only two characteristics of the respondent are associated with
living with a child: health and work status. Individuals who live independently are more
likely to be in excellent or good (as opposed to fair or poor) health and to work.
through both co-residence and financial transfers – on the human capital investment and labor-supply decisions of young, adult sons.
3 Niehof (1995), although not dealing directly with labor supply, presents an interesting overview of the experiences of elderly Indonesians.
4 Special issues of the Asia-Pacific Population Journal were devoted to coresidency in September 1992 and December 1997. These papers are largely descriptive. See also Hermalin (2002) who reports the results of a 10-year study of ageing in Taiwan, Singapore, Thailand, and the Philippines.

5
The literature on intergenerational transfer behavior in developing countries is the
most developed. Research on transfers for both developed and developing countries has, to a
large extent, focused on differentiating between various theories of transfer behavior and
examining whether public pensions crowd out private transfers.6 In addition to old-age
income support, the main motives that have been invoked to explain transfer behavior are:
altruism amongst family members (Becker 1974, 1991 and 1993); payments for services
(such as child care) provided by family members (Bernheim, Shleifer and Summers, 1985);
insurance mechanism to promote consumption smoothing across family members; and
repayment to parents for their earlier investment in the child, for example educational
expenditure.7
The attempts to empirically differentiate between these theories have met with limited
success. Lillard and Willis (1997) find strong evidence of the parental repayment hypothesis
in Malaysian data, but weak evidence of all of the other motives. Frankenberg, Lillard and
Willis (2002) find similar evidence of the parental repayment hypothesis for Indonesia and
that transfers serve as a form of insurance for family members. Secondi (1997) and
Hoddinott (1992) find evidence that transfers are consistent with the exchange motive in
China and Kenya respectively. Other studies of Kenya (Knowles and Anker, 1981) and
Botswana (Lucas and Stark, 1985) have been inconclusive.8 Finally, Ravallion and Dearden
(1988) find that transfers on the Indonesian island of Java are generally targeted towards the
5 See Hoerger, Picone and Sloan (1996) and Pezzin and Schone (1999) for papers that examine elderly living
arrangements in the United States. 6 See Cox and Jimenez (1992) and Jensen (2004) for example. Khemani (1999) takes a different approach and
examines whether intergenerational transfers in Indonesia are explained by bargaining between husbands and wives over how much to transfer to their respective parents.
7 Lillard and Willis (1997) provide more extensive descriptions of each of these motives. 8 Results from developed countries have been just as indecisive. For example, Cox (1987) and Cox and Rank
(1992) reject altruism on the basis that transfers in the United States are positively correlated with recipient’s incomes, while McGarry and Schoeni (1995) and Altonji, Hayashi and Kotlikoff (1997) find the opposite correlation and conclude in favour of altruism. There have also been attempts to examine transfers within households, see Kochar (1999) and Pezzin and Schone (1997).

6
disadvantaged, i.e., the sick, elderly, or unemployed, although there are large and important
differences between transfers in rural and urban areas.
This study, although shedding some light on this debate, does not aim to differentiate
between possible motives for intergenerational transfers. Instead the focus is on elderly
labor supply, which is jointly determined with both transfers and coresidency, and hence we
model them simultaneously.9
The Indonesian Context
Indonesian society consists of hundreds of different ethnic groups with their respective
cultural practices. For example, the Javanese (who are the dominant Indonesian ethnic
group) prefer to live with their adult children in extended households while, in contrast, the
Batak Karo of North Sumatra consider it important for children to establish separate
households (Beard and Kunharibowo, 2001). It is thus not straightforward to generalize
about social norms with regard to the elderly in Indonesia. Further, unlike South Asia,
parental support is not uniformly assigned to children of a specific gender or birth order.10
Nevertheless, traditional law for almost all ethnic groups in Indonesia obligates children to
care for their older parents (Frankenberg and Kuhn, 2003). Our aim in this study is to
uncover the relationships that determine the level of support and the extent to which elderly
individuals support themselves. By aggregating across households as we do here we will
identify the “average” relationships between the variables of interest. This information is
9 In a previous paper (Cameron and Cobb-Clark, 2002) we modeled labor and transfers jointly but treated
coresidency as being exogenous. 10 Most South-east Asian countries are like Indonesia in this respect (Friedman, Knodel, Cuong and Anh, 2003).

7
important in terms of characterizing relationships relevant to national policy but does not
negate the usefulness of studies at a more micro level.11
3. The Indonesian Family Life Survey
The IFLS is a general household survey collected by RAND and Lembaga Demografi of the
University of Indonesia. The survey provides data for 1993 on a random sample of 7,224
households across the Indonesian provinces in Java, Sumatra, Bali, West Nusa Tenggara,
Kalimantan and Sulawesi.12 This study will focus on Indonesians aged 60 years or over13
and within these 7,224 households there are 2,625 individuals in this age category.
Information was gathered on all household members, however more detailed information
was collected for selected householders (respondents).14 These more detailed data are
available for 1891 elderly individuals.15 Because we are interested in examining the
relationship between the labor supply of the elderly and the amount of financial support they
receive from their children, we will focus on the sample of 1507 individuals who report
having at least one living child over the age of 18. Dropping observations that have missing
values for one or more of the explanatory variables results in a sample size of 1,429 elderly
parents.
The IFLS asks respondents how many hours they worked last week, how many hours
they usually work per week and how many weeks they usually work per year. We thus have
three potential measures of the elderly parent’s labor supply: hours last week, normal hours
11 We have no direct way of controlling for ethnicity given our data. We initially included provincial dummies
in the estimating equations as a proxy for ethnicity but found that they were statistically insignificant. This is not particularly surprising as there are normally several ethnic groups within a single province.
12 A second round of the survey was conducted in 1997 but the data on labor supply were not available at the time of writing. A third round was collected in 2000.
13 In 1993 the average life expectancy in Indonesia was 63 (World Bank, 1995). 14 Each household has a maximum of four adult respondents. Where this maximum was binding the selection
rules resulted in a relatively high probability that the elderly household members would be chosen.
8
per week and a constructed measure of annual hours (normal hours per week multiplied by
normal weeks per year).16 All three measures produced very similar results. In the empirical
results discussed below, we focus on normal weekly hours because this measure is less
sensitive to any seasonality effects reflected in hours last week and does not confound the
effects of hours per week with weeks worked per year.17
The IFLS also provides information about the labor market sector (self-employed,
government, private industry, not employed) in which the parent worked 20 years ago. This
variable is useful because unlike current sector of employment, this variable is not a function
of current labor supply, but is likely to reflect both the availability of current employment
opportunities and aspects of the elderly individual’s taste parameters that may not be
captured by education and the other demographic variables in the analysis.
The most unusual and attractive feature of the IFLS is that it provides relatively
detailed data on all of the living non-coresiding children of respondents, including
information about the amount of money children have transferred to their parents in the 12
months preceding the survey (including monetized in-kind transfers).18 It is this
information, which is not available in any other survey of which we are aware, that makes
this study possible. Most previous studies have examined parent/child pairs and ignored the
existence of other children. In contrast, the IFLS allows us to examine how parental labor
supply responds to total transfers from non-coresiding children, not just those from an
15 These are elderly individuals who were able to provide information on non-coresiding children. These data
are only available for the elderly who could answer the questions themselves. Our sample may thus under-represent the elderly who were particularly frail or disabled.
16 Specifically, normal hours per week is the response to the following question “Normally what is the approximate total number of hours you work per week?”
17 The IFLS asks people about the hours they normally worked on their primary job and their secondary job. We summed these two figures to arrive at the total hours normally worked. A small but not insignificant percentage of the sample reported working long hours on both jobs such that the total hours worked was not feasible. As a result normal hours worked was top-coded at 84 hours per week. We experimented with allowing for this upper censoring in the estimation and found that it made little difference. The MLE results below control for lower censoring only.
18 Respondents are asked the monetary value of help received in the form of money, tuition, health care, food or other goods.

9
individual child. In addition, the IFLS includes data on the age, gender, marital status,
educational attainment of the non-coresiding children and whether they live in the same
province as the parent.19 These general demographic data are also available for the parent
and all members of the parent’s household—including coresiding children. We are thus able
to construct variables that reflect the number of coresiding and non-coresiding children in
gender, marital status and educational status categories for each elderly individual in our
sample. Summary statistics and variable definitions are shown in Tables A1 and A2 in the
appendix.
Table 1 shows the living arrangements of the elderly in Indonesia. The majority
(62.5 percent) of Indonesian parents over the age of 60 are living with one or more of their
children. These are the parents who we will designate as “coresiding”. Of those that are
“not coresiding”, 21.3 percent are living with their spouse, 9.0 percent are living with others
(this includes other relatives, friends and servants) and only 7.0 percent are actually living
alone. Thus, our definition of “non-coresiding” is not synonymous with living alone.
Ideally one may want to differentiate between elderly individuals who live alone and those
who live with others. To evaluate the attractiveness of living with “others” however requires
information on all of the possible “others”. Our data do not provide us with information
about the friends and more extended family members with whom an elderly individual might
potentially reside. Thus, in the interests of empirical tractability, we focus here on residency
with and financial transfers from children for whom we do have data. This seems
appropriate as children are the most important source of residency options and financial
transfers.
19 Indonesia had 27 provinces in 1993.
10
Table 1 here
Table 2 provides summary statistics of transfers from non-coresiding children to
elderly parents. Overall, more than half of the elderly parents in the sample received a
positive transfer from their children in the previous year, with mothers more likely to receive
them than fathers. Although on average the sums of money transferred are not very large (on
average the equivalent of US$71), they are a large proportion of mean household income and
an even larger proportion of mean personal income.
Table 2 here
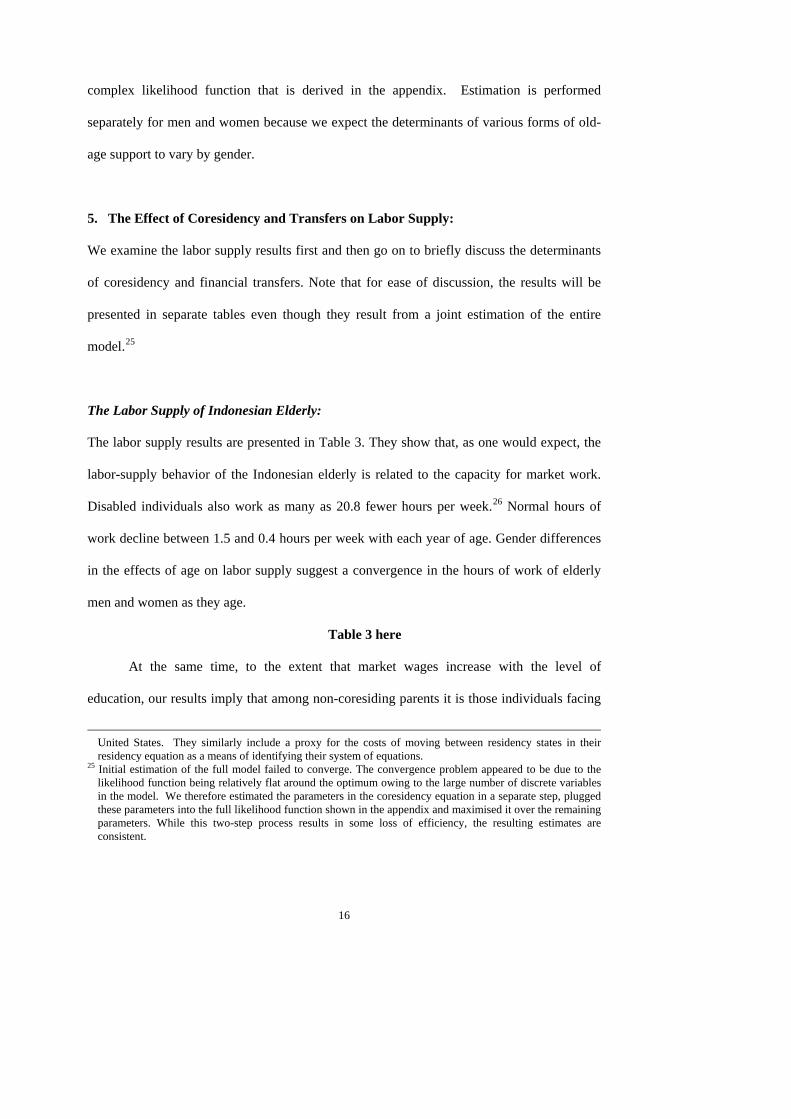
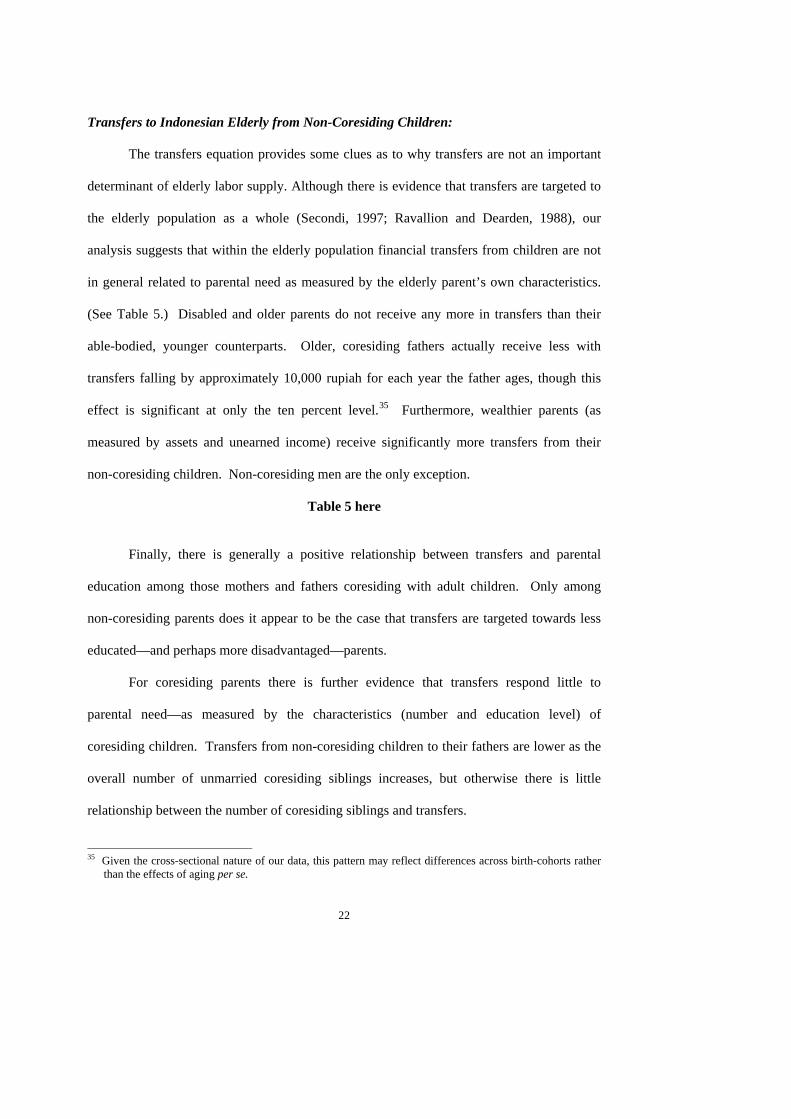
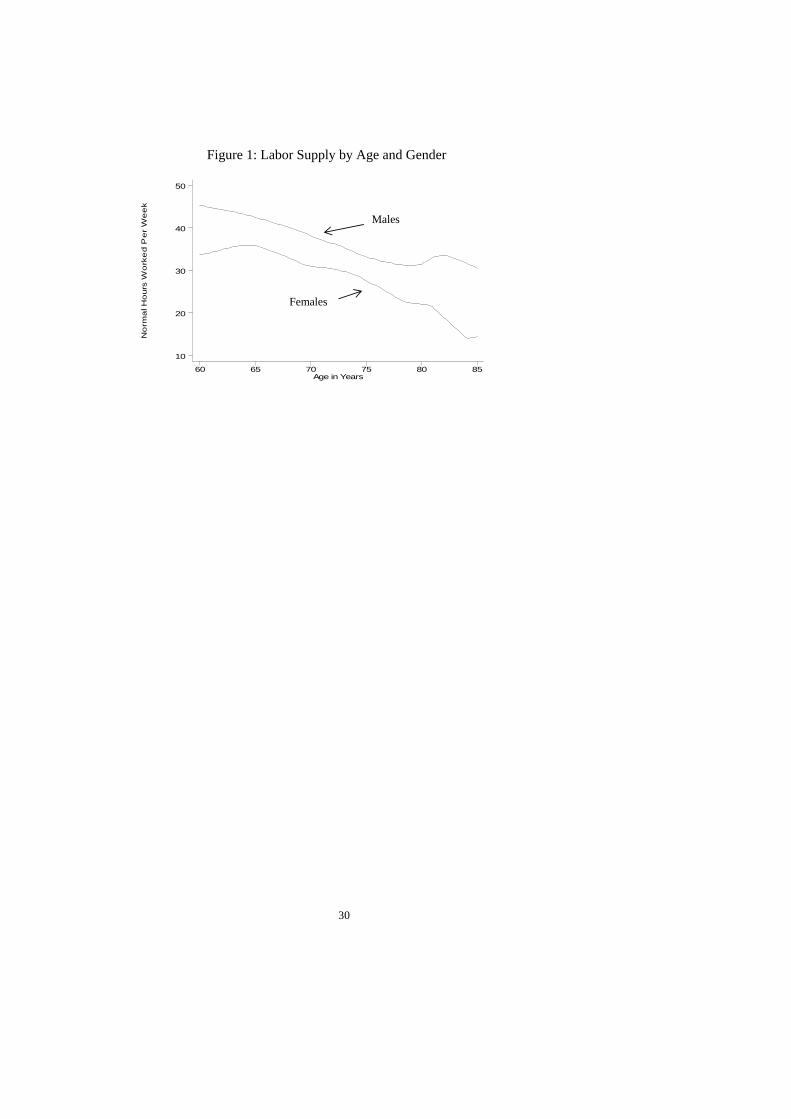
Table 2 also provides information about the normal weekly hours of work of
Indonesia elderly. These results indicate that many Indonesian men and women remain
economically active into their old age. Not surprisingly, elderly men work on average more
hours than elderly women, and younger age-cohorts are working slightly more hours than are
older age-cohorts (See Figure 1). Men who do not live with one or more of their children
normally work an average of 34.0 hours each week, slightly more than coresiding men who
work 30.0 hours on average. Indonesian women work on average about half the hours
worked by men, which translates into a smaller gap between coresiding women (13.4 hours
per week) and non-coresiding women (17.6 hours per week).
Figure 1 here
4. The Empirical Framework
Our objective is to formally examine the labor supply of elderly Indonesians taking into
account coresidency with and financial transfers from children. In particular, we are
interested in understanding whether coresidency and transfers are complements to or
substitutes for the elderly person’s own labor income and in establishing whether transfers

11
and coresidency are “targeted” in the sense of being responsive to the needs of the parents
and the ability of the children to give.

12
The Estimation Strategy:
Equations (1)-(3) below set out the system of estimating equations to be jointly estimated
using maximum likelihood estimation. We estimate a structural labor supply equation and
thus are able to identify the direct effect of transfers from children on elderly labor supply.
At the same time, the difficulty of finding valid exclusion restrictions restricts us to
estimating reduced-form transfers and coresidency equations. The effect of coresidency
status on labor supply is captured by the estimation of separate labor supply equations that
depend on coresidency status. Similarly, the transfer equation also depends on whether or
not the parent coresides with one of his or her children. Finally, we allow the errors in all
three equations to be correlated with one another.
The Labor Supply Model:
We begin by considering the labor supply decision. The labor supply decisions of elderly
Indonesians are assumed to depend on both market and reservation wages in the standard
way. Given this, transfers from non-coresiding children – a form of unearned income – may
affect parental labor supply decisions by altering the parent’s budget constraint. Parents who
coreside with one or more of their children may make household, rather than individual,
labor supply decisions and thus it is important to take the characteristics of those coresiding
children into account. Consequently, the labor supply of parents ( piLS ) is given by:
0 1 1 1max( ,0) 0P Pi n n i n i i iLS Z TR if Cβ β γ ε= + + + = (1a)
0 1 2 1 2max( ,0) 1P P CCi n r i r i r i i iLS Z Z TR if Cβ β β γ ε= + + + + = (1b)
where (1a) and (1b) are the labor supply equations for coresiding and non-coresiding parents
respectively. ZP is a vector of parental characteristics associated with market and reservation
13
wages, the characteristics of coresiding children are given by ZCC and TRi are transfers from
non-coresiding children.20
Given that the provision of transfers is likely to be motivated by concerns about
parental welfare – which in turn depends on the parent’s ability to work – we are unable to
find an exclusion restriction that would allow us to identify the structural parameters of the
transfer equation. Instead we estimate the following reduced-form equation:
0)0,max( 12 =+++= iiPin
NCiinoni CifuZZTR πππ (2a)
1)0,max( 232 =++++= iiCCir
Pir
NCiirori CifuZZZTR ππππ (2b)
which can be thought of as the reduced form of a structural transfers equation that includes
labor supply as an explanatory variable.21 As parents’ coresidency status is likely to affect
transfers, we estimate separate transfer equations for coresiding and non-coresiding parents
allowing us to include different explanatory variables in the two equations. In particular, it
seems likely that, if the parent lives with one or more children, the total transfers the elderly
parent receives from her non-coresiding children will be affected by the resources that
coresiding siblings are able to provide. Transfers (either financial or in-kind) from coresiding
children are not observed in the data, however we use coresiding children’s characteristics to
act as a proxy for these resources. Thus, the sum of transfers received from non-coresiding
children (TR ) is modeled as being a function of the parent’s characteristics (ZP), the non-
20Consistent with standard labor supply models, labor market conditions influence the labor supply decision
through market wages, i.e. through the return to productivity-related characteristics (like education) that are captured in ZP. In Indonesia, demand-side constraints are likely to be relatively unimportant as the majority of elderly individuals are not employees, but are engaged in some form of self-employment.
21 The IFLS also provides information on transfers to children from parents. These are quantitatively much less important. We experimented with subtracting this amount from transfers from children and using a net measure of transfers in the estimation. It, however, seems that the motivations for these two types of transfers differ significantly. Using the net measure of transfers instead of the gross measure significantly reduced the predictive power of the transfers equation. We hence elected to use gross transfers to parents as our measure of transfers. Lee, Parish and Willis (1994) similarly focus just on transfers flowing towards parents and Frankenberg, Lillard and Willis (2002) recognise that the determinant of these two types of transfers differ and estimate separate equations for provision and receipt of transfers.

14
coresiding children’s characteristics (ZNC) and in the case of coresiding parents, also the
characteristics of coresiding children (ZCC).
Finally, we turn to consider the issue of coresidency itself. When an elderly
individual chooses whether or not to coreside s/he compares the utility derived from living
alone to that received from living separately. This involves consideration of both transfers
from noncoresiding children and ones own labor supply behavior under each residency
scenario. Our coresidency equation is reduced form, and like the transfer equation, can be
thought of as deriving from a structural equation that includes both labor supply and
transfers. Hence, the propensity to coreside ( *C ) is modeled as a function of all of the
exogenous variables in the system as follows:
iiCi
Pii HZZC νηηηη ++++= 3210
* . (3a)
*
*
1 if 0
= 0 if 0i i
i
C C
C
= >
≤ (3b)
where i indexes individuals, ZP is a vector of parental characteristics, and ZC is a vector of all
children’s (i.e., both coresiding and noncoresiding) characteristics. Specifically, we control
for the parents’ demographic characteristics, non-labor income, asset levels, disability status,
and previous work status, as well as the number of children in each marital status and
education (primary, secondary, and tertiary) category.22 Moreover, we control for the
transactions costs associated with switching between residency states. In Indonesia, home
ownership rates are high and the transactions costs associated with alternative living
arrangements are likely to be correlated with house prices, H. Although the underlying
22 We considered a number of alternative ways of characterizing children and found marital status and
education to be the most appropriate for our analysis. We do not specifically consider the age of the children because the “children” of our sample of elderly Indonesians are in fact themselves adults. Only 2.2 percent of the sample have children younger than 18 and only 27.6 percent have children between the ages of 18 and 25. Consequently, the age of these “children” is unlikely to be the most important factor driving parental labor supply. We originally also controlled for the gender of children, but found it to be insignificant. This is not so surprising because unlike South Asia, for example, gender roles are less well-defined in Indonesia and elsewhere in South East Asia.

15
propensity to coreside )( *C , is not observed we do observe whether an elderly parent does
in fact coreside with at least one adult child (C).23
Identification
The structural labor supply equation is identified by the exclusion of housing prices (which
proxy the cost of changing residency state in the coresidency equation) and non-coresiding
children’s characteristics from that equation.24 While the characteristics of the children who
are providing the transfers would clearly be expected to be a major determinant of transfers,
it would be unusual to include non-coresiding family members’ characteristics in the labor
supply equation. It seems more reasonable to assume that non-coresiding children affect
their parent’s propensity to work via their provision of financial support, but having taken
that into account, their other attributes would be irrelevant to the parent’s labor supply
decision.
Estimation
Equations (1) – (3) form the basis of our estimation model. In particular, the error terms in
these three equations are assumed to be jointly distributed as follows:
⎟⎟⎟
⎠
⎞
⎜⎜⎜
⎝
⎛
⎟⎟⎟
⎠
⎞
⎜⎜⎜
⎝
⎛
2
2
1,
000
~
ε
ε
ε
σσσσσ
ε
ν
uu
vvu
i
i
i
Nu
where vu vu uσ ρ σ= , εεε σσρσ uuu = , and v vε ε εσ ρ σ= . Joint estimation of equations (1) –
(3)—taking this error structure and the censoring into account—requires estimation of a
23 In models of developed countries, nursing home care might be included as an additional potential living
arrangement, for example, as in Pezzin and Schone (1999). Such care is very rarely available in Indonesia and so is not considered here.
24Our approach is not dissimilar to that of Pezzin and Schone (1999) who model elderly living arrangements, daughters’ provision of informal care to elderly parents and daughters’ labor supply in the context of the
16
complex likelihood function that is derived in the appendix. Estimation is performed
separately for men and women because we expect the determinants of various forms of old-
age support to vary by gender.
5. The Effect of Coresidency and Transfers on Labor Supply:
We examine the labor supply results first and then go on to briefly discuss the determinants
of coresidency and financial transfers. Note that for ease of discussion, the results will be
presented in separate tables even though they result from a joint estimation of the entire
model.25
The Labor Supply of Indonesian Elderly:
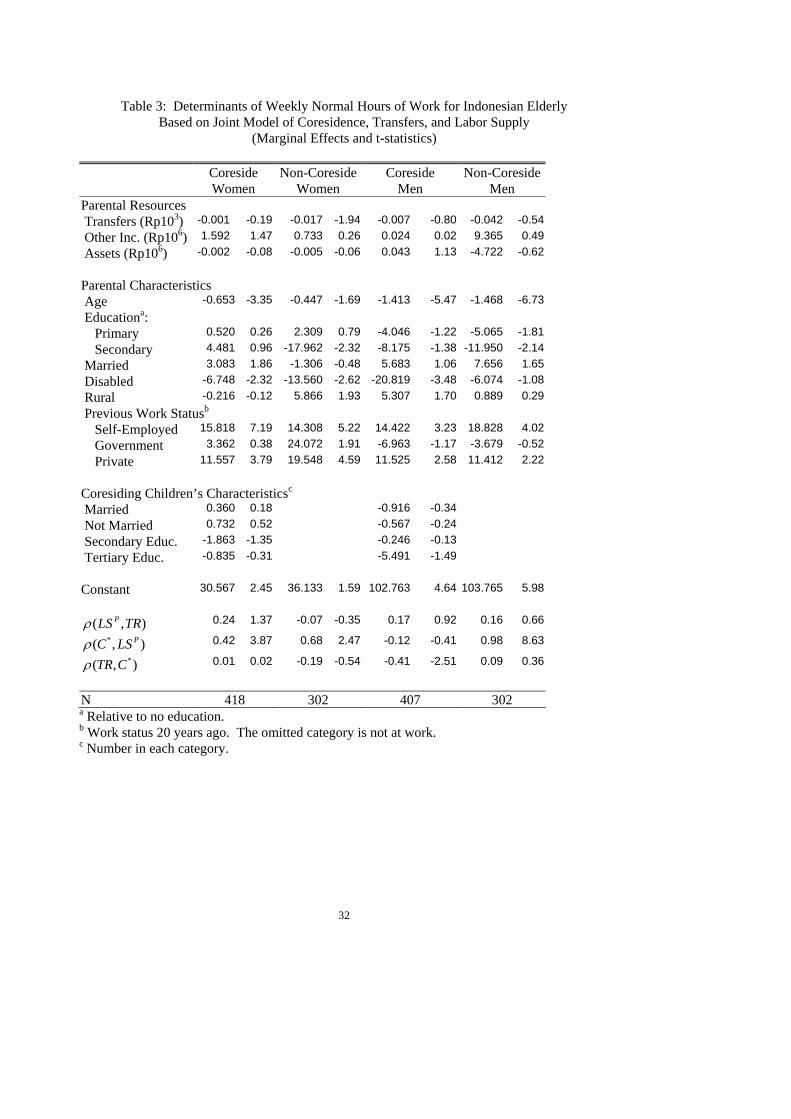
The labor supply results are presented in Table 3. They show that, as one would expect, the
labor-supply behavior of the Indonesian elderly is related to the capacity for market work.
Disabled individuals also work as many as 20.8 fewer hours per week.26 Normal hours of
work decline between 1.5 and 0.4 hours per week with each year of age. Gender differences
in the effects of age on labor supply suggest a convergence in the hours of work of elderly
men and women as they age.
Table 3 here
At the same time, to the extent that market wages increase with the level of
education, our results imply that among non-coresiding parents it is those individuals facing
United States. They similarly include a proxy for the costs of moving between residency states in their residency equation as a means of identifying their system of equations.
25 Initial estimation of the full model failed to converge. The convergence problem appeared to be due to the likelihood function being relatively flat around the optimum owing to the large number of discrete variables in the model. We therefore estimated the parameters in the coresidency equation in a separate step, plugged these parameters into the full likelihood function shown in the appendix and maximised it over the remaining parameters. While this two-step process results in some loss of efficiency, the resulting estimates are consistent.

17
the lowest returns to market work (but perhaps the greatest need) who continue to work into
their old age. Specifically, non-coresiding men with no education at all are predicted to work
12.0 hours more per week than non-coresiding men with at least a secondary school
education. Among non-coresiding women the difference is even higher (18.0 hours). In
contrast, coresiding parents’ hours of work do not vary significantly with education. Thus
the support offered by coresidency might be important in allowing elderly individuals to
lower their hours of work.
With regard to the other main source of support considered here – transfers - the
results show that financial transfers from Indonesian children do not seem to be a substitute
for the income provided by the elderly parent’s own labor supply. Transfers from children
are an insignificant determinant of parental labor supply for coresiding and non-coresiding
men and for coresiding women. Transfers are negatively and significantly related to normal
weekly hours of work only for non-coresiding mothers (p-value=0.056) and this effect is
small—increasing transfers by Rp100,000 (mean transfers are Rp217,200) leads to a 1.7
hour reduction in normal weekly hours.
Like transfers, asset levels and unearned income also appear to play little part in the
labor-supply decisions of elderly Indonesians. Elderly individuals with higher asset levels or
with more unearned income do not enjoy significantly more leisure in their old age. To
some extent these results may reflect that in Indonesia access to pension income is restricted
almost exclusively to government officials. The impact of pension income on hours worked
might thus be captured by the coefficients on the previous work status variables. Being a
government employee 20 years ago significantly reduces the hours worked in old age for
both men and women. Coresiding women (men) who were previously employed in the
26Individuals are classified as disabled if they report having difficulty standing from sitting, dressing or going
to the bathroom by themselves. Mete and Schultz (2002) similarly found that elderly labor supply in Taiwan was responsive to health status.

18
government work on average 12.5 (21.4) hours per week less in their old age than women
who were self-employed and 8.2 (18.5) hours less than women who were private employees.
Previous labor market sector may also proxy for access to opportunities for continued
employment. For example, self-employed individuals may be able to continue running their
businesses into their old age, while public- and private-sector employees may find
themselves forced to retire. Rural/urban status is likely to further capture both the
opportunity for and returns to employment. Everything else equal, non-coresiding elderly
women and coresiding elderly men work more hours in rural labor markets than in urban
areas.
For both men and women the characteristics of coresiding children have no effect on
the number of hours their parents work each week. This is particularly striking since it
seems to suggest that overall household resources—as reflected by the numbers of adult
children and their education levels—are unrelated to the labor-supply decisions of elderly
parents. Controlling for the number of adult coresiding children (i.e., the number of married
and non-married children), elderly parents who live with children who are relatively better
educated (and therefore presumably have higher earnings) do not work less in their old
age.27
The Interdependencies Between Various Forms of Old-Age Support
The estimated correlations between the error terms in each of the equations are shown at the
bottom of Table 3. The significance of some of the correlations validates the effort to jointly
27Interactions between children’s marital status and gender were insignificant. We also experimented with
including the number of grandchildren living in the household of coresiding elderly parents in the labor supply equations. (This information is available while the number of children of non-coresiding children is not.) We had hypothesised that elderly women might be involved in child care and so less likely to work. The number of grandchildren coresiding was however consistently insignificant

19
model the forms of old-age support.28 The degree of correlation differs across the pairs of
equations though. In no case is the correlation between the errors in the labor supply and
transfers equation significant. This adds further support to our previous finding that transfers
are not an important determinant of labor supply. Transfers and labor supply do not appear
to be as closely related as might initially have been expected.
In contrast, the correlation between the errors in the coresidency and labor supply
equations are positive and significant (except for coresiding men). Hence, for example, a
woman whose unobservable characteristics make her more likely to coreside is also more
likely to be working. This is not what one would expect from the descriptive data which
shows that prior to controlling for the observed characteristics of parents and children,
coresidency was associated with lower working hours. It is, however, consistent with
coresidency having more to do with adult children’s decisions to move out than being an
explicit form of support for the elderly, which is what is suggested by the findings from the
coresidency equation below. Hence, many coresiding parents may need to work to support
the household.29
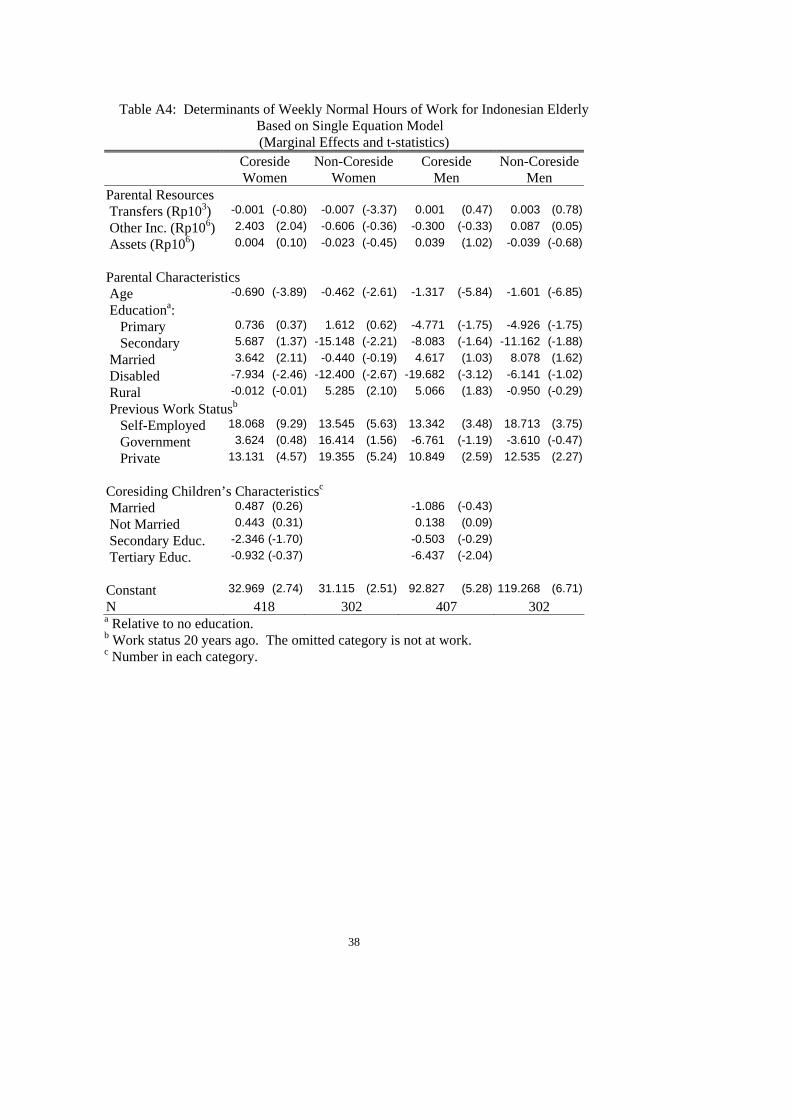
28For the purpose of comparison, results assuming these forms of support are unrelated are presented in
Appendix tables A3 and A4. The marginal effects differ slightly across the jointly and independently estimated equations, as does the significance of some of the variables—most noticeably, transfers are strongly significant in the non-coresiding women’s labor supply equation (t=3.37) but only marginally so once we allow for their endogeneity (t-1.91). The effect is quantitatively small in both cases though. The qualitative results of both sets of results are largely the same.
29 The correlation between the error in the transfers equation and coresidency equation is also insignificant in most cases. For coresiding men though it is significant and negative. Hence men whose unobservable traits make them more likely to coreside are less likely to receive transfers. It is not unusual for Indonesian men to marry much younger women and so to have relatively young children even when they are over the age of 60. Thus this result may be explained by men who live with a young spouse who works being less likely to receive transfers and more likely to be coresiding with one of their youngish children.

20
Coresidency Among Indonesian Elderly:
We define elderly individuals to be coresiding (C = 1) if they live with one or more adult
children and non-coresiding (C = 0) otherwise.30 For ease of interpretation we focus on the
resulting marginal effects (calculated at the means) rather than the coefficient estimates.
In Indonesia coresidency seems to be a household structure that evolves over the life
cycle rather than an explicit form of old-age support. (See Table 4.) In particular, elderly
men and women are both more likely to be living with unmarried children than married
children and there is a strongly significant, negative effect of age on the probability that
women coreside. Aging ten years decreases the probability of elderly women coresiding by
more than ten percentage points.31 This negative relationship suggests that as mothers (and
children) age, children are more likely to get married and move out. Indonesian children
may thus be more often living with their mothers than the converse. This may not show up
for men because divorce is not uncommon in Indonesia and older men often remarry younger
women and have relatively young families.32
Table 4 here
That the characteristics of the elderly parent’s children seem to play a greater role in
determining coresidency than the parent’s characteristics further suggests that coresidency is
not an explicit form of old-age support. For example, parent’s educational status, marital
30 Similarly, children are defined to be coresiding if they live with the parent, and non-coresiding if not. A
non-coresiding child can thus have a coresiding parent. This simply implies that the parent lives with one of the child’s siblings.
31We tried including a quadratic in age in the model but it was insignificant. 32The IFLS data tell us who owns the home in which the household lives but this does not allow us to
accurately establish who is living with whom. For example, a parent at age 85 may no longer play an active role in household decisions (and so be dependent on his or her children in this sense) but may legally remain the owner of the home. Even if we knew a lot more about the household this would be difficult to ascertain because responsibility is likely to gradually shift from the parent to the child over time.32 It is also possible that—given the nature of the data—we are capturing the effects of birth-cohorts rather than aging. Frankenberg, Beard and Saputra (1999) however used panel data for Indonesia and similarly found age to be negatively related to the transition to coresidency.
Deleted: do not allow us to establish
Deleted: over time we would expect that r
Deleted: would shift
Deleted: in either case.

21
status, and, for men, age are insignificant determinants of coresidency. Mothers’ assets33
and unearned income are negatively related to their probability of coresiding—suggesting an
ability to buy privacy—but the effect is very small in magnitude. An extra Rp200,000 of
unearned income (approximately doubling the average) decreases the probability of
coresiding by less than 2 percentage points.34
Children’s educational status is however an important determinant of coresidency.
Mothers are significantly more likely to be coresiding, the more children they have with a
secondary education, compared with children with a lower education. This could indicate
that coresidency may respond to children’s income and that more educated children are
better able to afford having their parents live with them. Cameron (2000) however examined
this issue directly and found no evidence that Indonesian parents tend to live with wealthier
children. This interpretation is further confounded by the fact that fathers are significantly
less likely to coreside if they have tertiary educated children.
Our results on coresidency are in line with those of Frankenberg, Chan and Ofstedal
(2002) who found that the interests of the younger generation rather than those of the older
generation are often the primary motivation behind coresidence.
Importantly for the identification of the system of equations, the average house price
in the parent’s locality is significantly related to the probability of coresidence (at the one
percent level for men and the ten percent level for women) and has a positive sign. The
transaction’s costs associated with moving out of the parental home will be larger in regions
with more expensive housing and this may dissuade children from doing so.
33 We treat assets as a pre-determined variable. It can be argued that assets are actually endogenous as the
parent may run them down if s/he does not receive income support from other sources. We examined the asset data however and found no evidence of asset values changing systematically, either increasing or decreasing, with age over 60. We also estimated the entire system of equations without the inclusion of the asset variable and found none of the other parameters to be affected by its presence. We chose to present the results that include the asset variable because theoretically wealth could play an important role in the choices elderly individuals make regarding their income support.
34 The Indonesian currency is the Rupiah. In 1993 US$1 bought approximately Rp2500.
22
Transfers to Indonesian Elderly from Non-Coresiding Children:
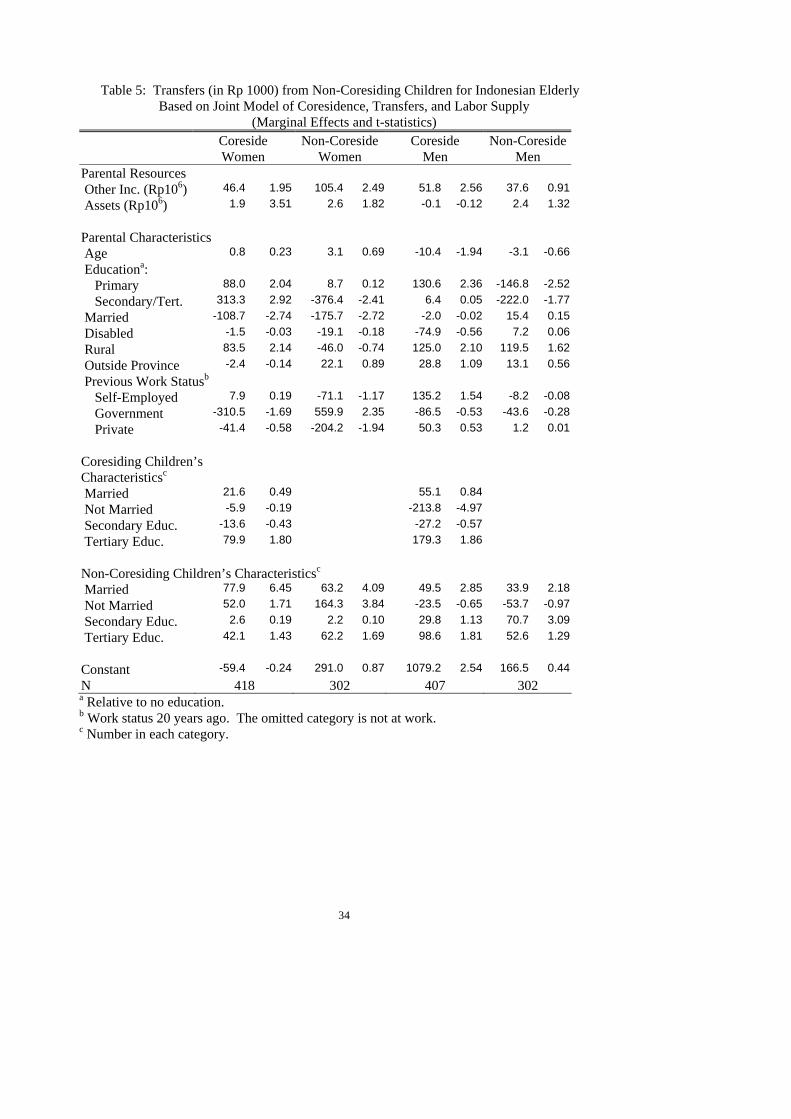
The transfers equation provides some clues as to why transfers are not an important
determinant of elderly labor supply. Although there is evidence that transfers are targeted to
the elderly population as a whole (Secondi, 1997; Ravallion and Dearden, 1988), our
analysis suggests that within the elderly population financial transfers from children are not
in general related to parental need as measured by the elderly parent’s own characteristics.
(See Table 5.) Disabled and older parents do not receive any more in transfers than their
able-bodied, younger counterparts. Older, coresiding fathers actually receive less with
transfers falling by approximately 10,000 rupiah for each year the father ages, though this
effect is significant at only the ten percent level.35 Furthermore, wealthier parents (as
measured by assets and unearned income) receive significantly more transfers from their
non-coresiding children. Non-coresiding men are the only exception.
Table 5 here
Finally, there is generally a positive relationship between transfers and parental
education among those mothers and fathers coresiding with adult children. Only among
non-coresiding parents does it appear to be the case that transfers are targeted towards less
educated—and perhaps more disadvantaged—parents.
For coresiding parents there is further evidence that transfers respond little to
parental need—as measured by the characteristics (number and education level) of
coresiding children. Transfers from non-coresiding children to their fathers are lower as the
overall number of unmarried coresiding siblings increases, but otherwise there is little
relationship between the number of coresiding siblings and transfers.
35 Given the cross-sectional nature of our data, this pattern may reflect differences across birth-cohorts rather
than the effects of aging per se.

23
The main difference between the transfers received by elderly men and women is that
women who are currently living with their spouse receive significantly fewer transfers than
women who are either divorced, separated, widowed or never married. Men are more likely
than women to work into old age. They are likely also to have more assets at their disposal.
Hence, women with partners are less often in need of support from children.
Transfers also appear to be only loosely related to the ability of children to give.
While unmarried children (who most likely have fewer dependents) transfer more each year
to their non-coresiding mothers than do their married siblings, they make smaller transfers to
their fathers and coresiding mothers.36 There is little relationship between non-coresiding
children’s education levels and the transfers they provide mothers and fathers. Although the
coefficients on the variable indicating the number of tertiary educated children is large and
positive in each case, it is never significant at the five percent level (and is significant at the
ten percent level only for coresiding men).
The results above are consistent with some of the findings from Lillard and Willis’s
(1997) work on the motives for intergenerational transfers in Malaysia. With the elderly
couple the unit of analysis, they find only limited support for the view that the provision of
old-age security is the motive behind the transfers received from non-coresiding children.
This suggests that other cultural factors like filial piety may be the main motivating force
behind transfers.
6. Conclusions:
36 Ideally we would have also controlled for the number of children that each of the non-coresiding children
have (that is, grandchildren of the elderly individual) as they may constitute a competing demand on the non-coresiding child’s resources. The IFLS however does not provide these data for all non-coresiding children.

24
In this paper we estimate the determinants of elderly labor supply taking into account the
receipt of transfers from and coresidency with children, thus formally acknowledging the
interdependency of these alternative forms of support in old age. Our goals were to first,
identify the determinants of elderly labor supply; second, to examine the relationship
between these three forms of support; and finally, to establish whether transfers and
coresidency are responsive to the needs of the parents and the ability of the children to give,
Our results indicate that coresidency, financial transfers, and labor supply are all
quantitatively important forms of old-age support for elderly Indonesians. However
coresidency appears to be a result of a household structure that evolves over the life cycle,
rather than an explicit form of support for elderly parents. Transfers from non-coresiding
Indonesian children to their elderly parents do not seem to be strongly related to parental
need as captured by the parent’s own characteristics and the characteristics of coresiding
siblings. Nor do transfers appear to be strongly related to the ability to give as measured by
non-coresiding children’s characteristics.
Possibly the most important finding is that financial transfers from Indonesian children
do not appear to be a substitute for the income support provided by the elderly parent’s own
labor market work. Only non-coresiding women reduce their hours of work as their
children’s transfers become more generous and this effect is relatively small. The labor
supply of coresiding elderly parents is also unrelated to the characteristics of their coresiding
children. This suggests that the labor supply decision of elderly parents may be unrelated to
overall household resources.
We can only speculate as to why transfers from children do not result in parents devoting
less hours to the labor market. It may be that transfers are too unpredictable to be relied upon
or that they are not large enough to affect an elderly person’s labor supply. Alternatively,
there may be either cultural or emotional motivations for continuing to work into old age.

25
There is little to suggest that the pressure for elderly individuals to continue to work to
support themselves in Indonesia and in other developing countries will decrease in the
future. As the size of the elderly population increases, the resources needed to support them
also increases. Many developing nations are banking on traditional family support
mechanisms to take the strain thus negating the need for the public pension schemes seen in
most developed countries. Some countries (Malaysia and Singapore, for example) are using
tax incentives to children to shore up these forms of support. Our results suggest that these
transfers are not a substitute for parents own earnings. Coresidency similarly does not seem
to reduce elderly parents’ need to work. The increasing internal migration seen in many
developing countries—driven by greater labor market mobility—will also put downward
pressure on coresidency rates. Thus, we predict the public provision of old-age support will
become an increasingly important issue for policymakers in the developing world.

26
REFERENCES
Adlakha A, Rudolph D (1994) Aging Trends: Indonesia. Journal of Cross-Cultural Gerontology 9:99-108.
Altonji JF, Hayashi F, Kotlikoff L (1997) Parental Altruism and Inter Vivos Transfers:
Theory and Evidence. Journal of Political Economy 105(6):1121-66. Beard V, Cartmill R (2003) The Effects of Economic Development on Support for the
Elderly in Indonesia. Unpublished paper, University of Wisconsin-Madison. Beard V, Kunharibowo Y (2001) Living Arrangements and Support Relationships Among
Elderly Indonesians: Case Studies from Java and Sumatra. International Journal of Population Geography 7:17-33.
Becker G (1974) A Theory of Social Interactions. Journal of Political Economy 82(6):1063-
1093. Becker G (1991) Becker G (1993) A Treatise on the Family. Cambridge, MA: Harvard University Press. Bernheim D, Shleifer A, Summers, L (1985) The Strategic Bequest Motive. Journal of
Political Economy 93:1045-1076. Cain M (1991) The Activities of the Elderly in Rural Bangladesh. Population Studies
45:189-202. Cameron L (2000) The Residency Decision of Elderly Indonesians: A Nested Logit
Analysis. Demography 37(1):17-27. Cameron L, Cobb-Clark, D (2002) Old-Age Labour Supply in the Developing World.
Applied Economics Letter 9(10): 649-52. Chen AJ, Jones, G (1989) Ageing in ASEAN: Its Socio-economic Consequences. Institute
of Southeast Asian Studies, Singapore. Cox D (1987) Motives for Private Income Transfers. Journal of Political Economy
95(3):508-543. Cox D, Jimenez E (1992) Social Security and Private Transfers in Developing Countries:
The Case of Peru. World Bank Economic Review 6(1):155-169. Cox D, Rank M (1992) Inter-vivos Transfers and Intergenerational Exchange. Review of
Economics and Statistics, May, 74(2):305-14. DaVanzo J, Chan A (1994) Living Arrangements of Older Malaysians: Who Coresides with
Their Children? Demography 31(1):95-113.

27
Frankenberg E, Chan A, Ofstedal MB (2002) “Stability and Change in Living Arrangements in Indonesia, Singapore, and Taiwan, 1939 – 99 “ Population Studies, 56, p. 201-213.
Frankenberg E, Beard V, Saputra M (1999) The Kindred Spirit: The Ties that Bind
Indonesian Children and their Parents. Southeast Asian Journal of Social Science 27(2):65-86.
Frankenberg E, Chan A, Ofstedal MB (2002) Stability and Change in Living Arrangements
in Indonesia, Singapore and Taiwan, 1993-99. Population Studies, 56:201-213. Frankenberg E, Kuhn R (2003) The Implications of Family Systems and Economic Context
for Intergenerational Transfers in Indonesia and Bangladesh. Institute of Behavioral Science Working Paper Mo. PAC2003-0003 University of Colorado at Boulder.
Frankenberg E, Lillard L, Willis R (2002) Patterns of Intergenerational Transfers in
Southeast Asia. Journal of Marriage and Family 64(3):627-641. Friedman J, Knodel J, Cuong BT, Anh, TS (2003) Gender Dimensions of Support for the
Elderly in Vietnam. Research on Aging 25(6):587-630. Hermalin, A (2002) The Well-Being of the Elderly in Asia: A Four Country Comparative
Study. A Hermalin (ed.). Ann Arbor: University of Michigan Press. Hermalin, A (2000) “Ageing in Asia: Facing the Crossroads”, Comparative Study of the
Elderly in Asia Research Report 00-55, Population Studies Center, University of Michigan.
Hoddinott J (1992) Rotten Kids or Manipulative Parents: Are Children Old Age Security in
Western Kenya? Economic Development and Cultural Change 40:545-566. Hoerger T, Picone G, Sloan F (1996) Public Subsidies, Private Provision of Care and Living
Arrangements of the Elderly. Review of Economics and Statistics 78(3):428-440. Holtz-Eakin D, Joulfaian D, Rosen HS (1993) The Carnegie Conjecture: Some Empirical
Evidence. The Quarterly Journal of Economics 108(2):413-435 Hugo G (2000) Lansia – Elderly People in Indonesia at the Turn of the Century. In: Phillips
D (ed) Ageing in the Asia-Pacific Region: Issues, policies and future trends. Routledge, London.
Jensen R (2004) Do Private Transfers `Displace’ the Benefits of Public Transfers? Evidence
from South Africa. Journal of Public Economics 88(1-2):89-112. Joulfaian D, Wilhelm, MO (1994) Inheritance and Labor Supply; Journal of Human
Resources 29(4):1205-1234. Khemani S (1999) Inter-generational Transfers and Intra-household bargaining: evidence
from Indonesia. unpublished paper pp1-44.
28
Knowles J, Anker R (1981) An Analysis of Income Transfers in a Developing Country: The Case of Kenya. Journal of Development Economics 8(2): 205-26.
Kochar A (2000) Parental Benefits from Intergenerational Coresidence: Empirical Evidence
from Rural Pakistan. Journal of Political Economy 108(6):1184-1209. Kochar A (1999) Evaluating Familial Support for the Elderly: The Intra-Household
Allocation of Medical Expenditures in Rural Pakistan. Economic Development and Cultural Change 47(3):620-656.
Lee YJ, Parish W, Willis R (1994) Sons, Daughters, and Intergenerational Support in
Taiwan. American Journal of Sociology 99:1010-1041. Lillard L, Willis R (1997) Motives for Intergenerational Transfers: Evidence from Malaysia.
Demography 34(1):115-134. Lucas R, Stark, O (1985) Motivations to Remit: Evidence from Botswana. Journal of
Political Economy October 93(5):901-18. Martin L (1989) Living Arrangements of the Elderly in Fiji, Korea, Malaysia and the
Philippines. Demography 26:627-44. McGarry K, Schoeni R (1995) Transfer Behavior in the Health and retirement Study:
Measurement and the Redistribution of Resources within the Family. Journal of Human Resources,XXX, : S186-S226.
Mete C, Schultz TP (2002) Health and Labor Force Participation of the Elderly in Taiwan.
Yale University Economic Growth Center Discussion Paper No. 846:1-46 Niehof A. (1995) Ageing and the Elderly in Indonesia: Identifying the Key Issues. Bijdragen
tot de Taal, Land en Volkenkunde (BKI) 151(3):422-37. Pezzin L, Schone, B (1999) Intergenerational Household Formation, Female Labor Supply
and Informal Caregiving: A Bargaining Approach. Journal of Human Resources. 34(3):475-503.
Pezzin L, Schone B (1997) The Allocation of Resources in Intergenerational Households:
Adult Children and Their Elderly Parents. American Economic Review, AEA Papers and Proceedings 87(2):460-464.
Ravallion M, Dearden L (1988) Social Security in a `Moral Economy’: An Empirical
Analysis for Java. Review of Economics and Statistics 70:36-44. Rosenzweig M, Wolpin K (1993) Intergenerational Support and the Life-Cycle Incomes of
Young Men and Their Parents: Human Capital Investments, Coresidence, and Intergenerational Transfers. Journal of Labor Economics 11(1):84-112.
Secondi G (1997) Private Monetary Transfers in Rural China. Are Families Altruistic?
Journal of Development Studies 33(4):487-511.
Deleted: 

29
World Bank (1995) The World Development Report. New York: A World Bank Publication,
Oxford University Press.
30
Labour Supply by Age
No
rma
l Ho
urs
Wo
rke
d P
er
We
ek
Age in Years60 65 70 75 80 85
10
20
30
40
50
Figure 1: Labor Supply by Age and Gender
Males
Females

31
Table 1: Living Arrangements of the Indonesian Elderly
Living Arrangement (N=2625) Percentage of elderly (%) Living with adult children 62.51 Living with spouse and others (not children) 7.60 Living with others (not spouse or children) 9.02 Living with spouse only 13.67 Living alone 7.03
* Appropriate sampling weights were used to derive the figures in this table. Source: Cameron (2000).
Table 2: Mean Transfers, Proportion Receiving Transfers, and Hours of Work by Coresidency Status and Gender
Women Men Coreside Coreside No Yes No Yes Mean Annual Transfers (Rp 103) 217.2 160.0 186.2 185.4 Proportion Receiving Transfers (%) 70.2 52.9 66.6 48.9 Mean Transfers/Mean Household Income (%) 35.6 6.8 28.2 9.9 Mean Transfers/Mean Individual Income (%) 115.5 34.9 33.8 16.9 Proportion Working (%) 55.6 39.0 83.4 72.0 Mean Normal Weekly Hours Worked 17.6 13.4 34.0 30.3 Mean Normal Weekly Hours Worked if >0 31.6 34.4 40.1 42.1 Unless otherwise indicated these means are calculated over the full sample, including zero values.
32
Table 3: Determinants of Weekly Normal Hours of Work for Indonesian Elderly
Based on Joint Model of Coresidence, Transfers, and Labor Supply (Marginal Effects and t-statistics)
Coreside Non-Coreside Coreside Non-Coreside Women Women Men Men Parental Resources Transfers (Rp103) -0.001 -0.19 -0.017 -1.94 -0.007 -0.80 -0.042 -0.54 Other Inc. (Rp106) 1.592 1.47 0.733 0.26 0.024 0.02 9.365 0.49 Assets (Rp106) -0.002 -0.08 -0.005 -0.06 0.043 1.13 -4.722 -0.62 Parental Characteristics Age -0.653 -3.35 -0.447 -1.69 -1.413 -5.47 -1.468 -6.73 Educationa: Primary 0.520 0.26 2.309 0.79 -4.046 -1.22 -5.065 -1.81 Secondary 4.481 0.96 -17.962 -2.32 -8.175 -1.38 -11.950 -2.14 Married 3.083 1.86 -1.306 -0.48 5.683 1.06 7.656 1.65 Disabled -6.748 -2.32 -13.560 -2.62 -20.819 -3.48 -6.074 -1.08 Rural -0.216 -0.12 5.866 1.93 5.307 1.70 0.889 0.29 Previous Work Statusb Self-Employed 15.818 7.19 14.308 5.22 14.422 3.23 18.828 4.02 Government 3.362 0.38 24.072 1.91 -6.963 -1.17 -3.679 -0.52 Private 11.557 3.79 19.548 4.59 11.525 2.58 11.412 2.22 Coresiding Children’s Characteristicsc
Married 0.360 0.18 -0.916 -0.34 Not Married 0.732 0.52 -0.567 -0.24 Secondary Educ. -1.863 -1.35 -0.246 -0.13 Tertiary Educ. -0.835 -0.31 -5.491 -1.49 Constant 30.567 2.45 36.133 1.59 102.763 4.64 103.765 5.98
( , )PLS TRρ 0.24 1.37 -0.07 -0.35 0.17 0.92 0.16 0.66*( , )PC LSρ 0.42 3.87 0.68 2.47 -0.12 -0.41 0.98 8.63
*( , )TR Cρ 0.01 0.02 -0.19 -0.54 -0.41 -2.51 0.09 0.36
N 418 302 407 302 a Relative to no education. b Work status 20 years ago. The omitted category is not at work. c Number in each category.

33
Table 4: The Determinants of Coresidency for Elderly Indonesians
(Probit Marginal Effects and t-statistics)
Women Men Marginal
Effect t-statistic Marginal
Effect t-statistic
Parents Income Other Income (Rp106) -0.096 (-3.71) -0.022 (-1.16) Assets (Rp106) -0.001 (-1.91) 0.001 (1.39) Parents Characteristics Age -0.011 (-3.41) -0.001 (-0.16) Married -0.067 (-1.57) -0.005 (-0.08) Disabled 0.083 (1.24) -0.046 (-0.50) Primary Education -0.029 (-0.58) -0.018 (-0.42) Secondary/Tertiary Education
-0.074 (-0.72) 0.008 (0.09)
Rural -0.083 (-1.73) -0.028 (-0.54) Previous Work Status Self-Employed -0.068 (-1.57) -0.140 (-2.17) Government 0.037 (0.21) -0.109 (-1.04) Private -0.100 (-1.40) -0.084 (-1.14) Children’s Characteristics Married -0.002 (-0.17) 0.016 (1.53) Not Married 0.150 (6.45) 0.177 (8.69) Secondary Education 0.037 (2.61) 0.003 (0.20) Tertiary Education -0.023 (-0.93) -0.054 (-2.16) Local Housing Market Average House Price (Rp106) 0.036 (1.73) 0.080 (3.80) N 720 709
34
Table 5: Transfers (in Rp 1000) from Non-Coresiding Children for Indonesian Elderly Based on Joint Model of Coresidence, Transfers, and Labor Supply
(Marginal Effects and t-statistics) Coreside Non-Coreside Coreside Non-Coreside Women Women Men Men Parental Resources Other Inc. (Rp106) 46.4 1.95 105.4 2.49 51.8 2.56 37.6 0.91 Assets (Rp106) 1.9 3.51 2.6 1.82 -0.1 -0.12 2.4 1.32 Parental Characteristics Age 0.8 0.23 3.1 0.69 -10.4 -1.94 -3.1 -0.66 Educationa: Primary 88.0 2.04 8.7 0.12 130.6 2.36 -146.8 -2.52 Secondary/Tert. 313.3 2.92 -376.4 -2.41 6.4 0.05 -222.0 -1.77 Married -108.7 -2.74 -175.7 -2.72 -2.0 -0.02 15.4 0.15 Disabled -1.5 -0.03 -19.1 -0.18 -74.9 -0.56 7.2 0.06 Rural 83.5 2.14 -46.0 -0.74 125.0 2.10 119.5 1.62 Outside Province -2.4 -0.14 22.1 0.89 28.8 1.09 13.1 0.56 Previous Work Statusb Self-Employed 7.9 0.19 -71.1 -1.17 135.2 1.54 -8.2 -0.08 Government -310.5 -1.69 559.9 2.35 -86.5 -0.53 -43.6 -0.28 Private -41.4 -0.58 -204.2 -1.94 50.3 0.53 1.2 0.01 Coresiding Children’s Characteristicsc
Married 21.6 0.49 55.1 0.84 Not Married -5.9 -0.19 -213.8 -4.97 Secondary Educ. -13.6 -0.43 -27.2 -0.57 Tertiary Educ. 79.9 1.80 179.3 1.86 Non-Coresiding Children’s Characteristicsc Married 77.9 6.45 63.2 4.09 49.5 2.85 33.9 2.18 Not Married 52.0 1.71 164.3 3.84 -23.5 -0.65 -53.7 -0.97 Secondary Educ. 2.6 0.19 2.2 0.10 29.8 1.13 70.7 3.09 Tertiary Educ. 42.1 1.43 62.2 1.69 98.6 1.81 52.6 1.29 Constant -59.4 -0.24 291.0 0.87 1079.2 2.54 166.5 0.44 N 418 302 407 302 a Relative to no education. b Work status 20 years ago. The omitted category is not at work. c Number in each category.

35
Table A1: Variable Definitions Definition Dependent Variables Coresidency = 1 if parent lives with a child aged over 18, 0 otherwise. Transfers Sum of transfers received from all non-coresiding children in the 12 months prior to the survey. Labor Supply Normal weekly hours of work (including wage and non-wage work). Parental Characteristics Other Income Sum of pension income, asset income and any other non-labor income received by the individual in the
12 months prior to the survey (other than transfer income). Assets The asset owned by the individual (including the appropriate percentage of shared assets). Includes
houses/buildings, land, animals, savings, stocks, receivables, jewelry and any other assets. Age Age in years at time of survey. Married Dummy variable =1 if currently married, =0 if never married, divorced, separated or widowed. Disabled =1 if the individual has difficulty standing from sitting, dressing or going to the bathroom by themselves,
0 otherwise. Education Categories Dummy variables reflecting the highest level of schooling attended. For example, Primary =1 if highest
level of schooling attended was secondary school or higher, 0 otherwise. Omitted category is no schooling.
Rural = 1 if parent lives in a rural area, 0 otherwise Previous work status Dummy variables reflecting the sector of employment 20 years ago. Omitted category is “not working 20
years ago”. Outside Province The number of children who live in a different province from the parent. Average House Price Average house price in the parent’s village as reported by the village head. Children’s Characteristics Married # children who are currently married. Not married # children who have never been married, are separated, divorced or widowed. Education Categories # children in education categories. For example, secondary = # children whose highest level of education
attended is secondary school. Omitted category is # children with primary school education or less.

36
Table A2: Mean Parental and Child Characteristics by Gender and Coresidency
Women Men Non-
Coresiding
Coresiding Non-
Coresiding
Coresiding Parental Income/Wealth
Other Income(Rp105) Rp1.270 Rp1.650 Rp1.412 Rp2.757 Assets(Rp106) Rp3.838 Rp5.255 Rp3.723 Rp7.866 Parent’s Characteristicsa Age (years) 67.3 65.1 66.9 66.0 Primary 0.23 0.26 0.55 0.55 Secondary/Tertiary 0.05 0.04 0.07 0.12 Married 0.42 0.46 0.91 0.91 Disabled 0.09 0.10 0.05 0.05 Rural 0.66 0.54 0.74 0.58 Previous Employment Sectora Self-Employed 0.42 0.31 0.65 0.53 Government 0.01 0.01 0.06 0.10 Private 0.10 0.08 0.19 0.23 Not Employed 0.47 0.60 0.10 0.14 Non-Coresiding Children’s Characteristicsb Married 3.3 2.7 3.3 2.8 Not Married 0.4 0.3 0.6 0.4 Primary Education 2.5 1.7 2.5 1.7 Secondary Education 0.9 1.1 1.1 1.2 Tertiary Education 0.3 0.2 0.3 0.2 Out of Province 0.9 0.7 1.0 0.7 Coresiding Children’s Characteristicsb Married 0.6 0.5 Not Married 0.8 1.2 Primary Education 0.7 0.8 Secondary Education 0.6 0.7 Tertiary Education 0.1 0.1 Local Housing Market Average House Price(Rp106) Rp 8.275 Rp13.400 Rp 6.173 Rp 14.200 N 302 418 302 407
a Unless otherwise specified, these are dummy variables. b Numbers of children in each category.

37
Table A3: Transfers from Non-Coresiding Children for Indonesian Elderly Based on Single Equation Model
(Tobit Marginal Effects and t-statistics) Coreside Non-Coreside Coreside Non-Coreside Women Women Men Men Parental Resources Other Inc. (Rp106) 24.712 (0.86) 157.681 (3.22) 35.999 (2.04) 28.573 (0.81) Assets (Rp106) 1.907 (2.21) 2.988 (1.90) 0.326 (0.44) 1.844 (1.48) Parental Characteristics Age -3.898 (-1.06) 6.746 (1.30) -6.871 (-1.52) -3.163 (-0.66) Educationa: Primary 82.558 (1.71) 30.436 (0.37) 70.216 (1.24) -153.667 (-2.63) Secondary 278.218 (2.81) -330.425 (-1.84) -30.896 (-0.31) -213.905 (-1.69) Marriedb -118.664 (-2.76) -110.894 (-1.51) 84.425 (0.90) 8.940 (0.09) Disabled 29.374 (0.45) -42.426 (-0.34) -58.448 (-0.51) 3.880 (0.03) Rural 62.667 (1.44) 15.122 (0.20) 14.087 (0.25) 111.318 (1.60) Outside 3.855 (0.20) 24.796 (0.86) -6.014 (-0.26) 15.899 (0.67) Previous Work Statusb Self-Employed 2.272 (0.05) -27.456 (-0.39) 28.855 (0.38) -13.692 (-0.14) Government -293.847 (-1.47) 504.717 (1.78) -53.855 (-0.50) -43.171 (-0.28) Private -39.443 (-0.52) -94.005 (-0.81) 42.740 (0.52) 4.143 (0.04) Coresiding Children’s Characteristicsc
Married 16.736 (0.36) 70.637 (1.43) Not Married 33.251 (0.99) 12.922 (0.38) Secondary Educ. -9.929 (-0.29) -16.499 (-0.43) Tertiary Educ. 59.763 (0.92) 93.943 (1.54) Non-Coresiding Children’s Characteristicsc Married 71.633 (5.67) 67.844 (3.82) 59.779 (3.94) 33.216 (2.17) Not Married 79.218 (2.51) 102.731 (2.10) 79.903 (2.50) -43.883 (-1.22) Secondary Educ. 3.626 (0.22) 4.522 (0.17) 26.080 (1.21) 77.383 (3.53) Tertiary Educ. 21.109 (0.58) 22.629 (0.50) 37.295 (0.95) 41.694 (1.06) Constant -9.780 (-0.04) -408.573 (-1.10) 19.110 (0.05) 213.975 (0.58) N 418 302 407 302 a Relative to no education. b Work status 20 years ago. The omitted category is not at work. c Number in each category.
38
Table A4: Determinants of Weekly Normal Hours of Work for Indonesian Elderly
Based on Single Equation Model (Marginal Effects and t-statistics)
Coreside Non-Coreside Coreside Non-Coreside Women Women Men Men Parental Resources Transfers (Rp103) -0.001 (-0.80) -0.007 (-3.37) 0.001 (0.47) 0.003 (0.78) Other Inc. (Rp106) 2.403 (2.04) -0.606 (-0.36) -0.300 (-0.33) 0.087 (0.05) Assets (Rp106) 0.004 (0.10) -0.023 (-0.45) 0.039 (1.02) -0.039 (-0.68) Parental Characteristics Age -0.690 (-3.89) -0.462 (-2.61) -1.317 (-5.84) -1.601 (-6.85) Educationa: Primary 0.736 (0.37) 1.612 (0.62) -4.771 (-1.75) -4.926 (-1.75) Secondary 5.687 (1.37) -15.148 (-2.21) -8.083 (-1.64) -11.162 (-1.88) Married 3.642 (2.11) -0.440 (-0.19) 4.617 (1.03) 8.078 (1.62) Disabled -7.934 (-2.46) -12.400 (-2.67) -19.682 (-3.12) -6.141 (-1.02) Rural -0.012 (-0.01) 5.285 (2.10) 5.066 (1.83) -0.950 (-0.29) Previous Work Statusb Self-Employed 18.068 (9.29) 13.545 (5.63) 13.342 (3.48) 18.713 (3.75) Government 3.624 (0.48) 16.414 (1.56) -6.761 (-1.19) -3.610 (-0.47) Private 13.131 (4.57) 19.355 (5.24) 10.849 (2.59) 12.535 (2.27) Coresiding Children’s Characteristicsc Married 0.487 (0.26) -1.086 (-0.43) Not Married 0.443 (0.31) 0.138 (0.09) Secondary Educ. -2.346 (-1.70) -0.503 (-0.29) Tertiary Educ. -0.932 (-0.37) -6.437 (-2.04) Constant 32.969 (2.74) 31.115 (2.51) 92.827 (5.28) 119.268 (6.71) N 418 302 407 302 a Relative to no education. b Work status 20 years ago. The omitted category is not at work. c Number in each category.
39
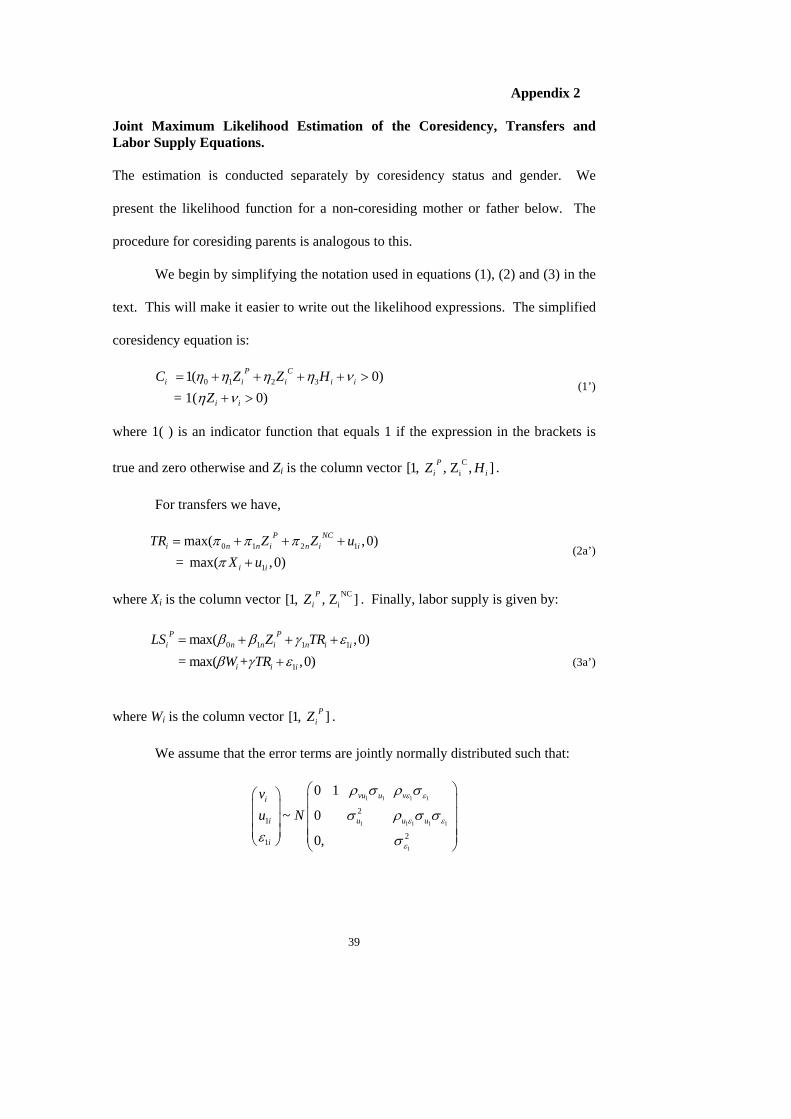
Appendix 2
Joint Maximum Likelihood Estimation of the Coresidency, Transfers and Labor Supply Equations. The estimation is conducted separately by coresidency status and gender. We
present the likelihood function for a non-coresiding mother or father below. The
procedure for coresiding parents is analogous to this.
We begin by simplifying the notation used in equations (1), (2) and (3) in the
text. This will make it easier to write out the likelihood expressions. The simplified
coresidency equation is:
0 1 2 31( 0) = 1( 0)
P Ci i i i i
i i
C Z Z HZ
η η η η νη ν
= + + + + >+ >
(1’)
where 1( ) is an indicator function that equals 1 if the expression in the brackets is
true and zero otherwise and Zi is the column vector Ci[1, , Z , ]P
i iZ H .
For transfers we have,
0 1 2 1
1
max( ,0) = max( ,0)
P NCi n n i n i i
i i
TR Z Z uX u
π π ππ
= + + ++
(2a’)
where Xi is the column vector NCi[1, , Z ]P
iZ . Finally, labor supply is given by:
0 1 1 1
1
max( ,0) = max( + ,0)
P Pi n n i n i i
i i i
LS Z TRW TRβ β γ εβ γ ε
= + + +
+ (3a’)
where Wi is the column vector [1, ]PiZ .
We assume that the error terms are jointly normally distributed such that:
1 1 1 1
1 1 1 1 1
1
21
21
0 1
~ 0
0,
vu u vi
i u u u
i
vu N
ε ε
ε ε
ε
ρ σ ρ σ
σ ρ σ σε σ
⎛ ⎞⎛ ⎞ ⎜ ⎟⎜ ⎟ ⎜ ⎟⎜ ⎟ ⎜ ⎟⎜ ⎟ ⎜ ⎟⎝ ⎠ ⎝ ⎠

40
Deriving the Likelihood Function
The elderly non-coresiding individual can be in one of four states. Below we list the
states and the expression for the associated probability of being in each state.
1. Coresiding (Ci=1)
The probability associated with being in this state is written:
1 Pr( 1) = Pr( ) 1 ( )
i i
i i
i
L Cv z
zη
η
= => −
= −Φ −
where Φ is the normal cumulative distribution function. Note that we are following
the convention of using upper case letters to represent the random variables and
lower case to represent the realization of that variable.
2. Non-coresiding, receiving positive transfers and having positive labor supply.
(Ci=0, TRi>0, LSPi>0)
2
1 1
1 1
2
Pr( 0, , )
Pr Pr 0 = Pr( , ) Pr( | , ) ( ,
Pi i i i i i
P Pi i i i i i i i i
i i i i i i i
i i i i i i i i i
i i i i i
L C TR tr LS ls
(TR tr ,LS ls ) (C |TR tr ,LS ls )u tr x ls w tr
v z u tr x ls w trtr x ls w tr
π ε β γη π ε β γ
ϕ π β γ
= = = =
= = = × = = == − = − −
× < − = − = − −= − − − )
( | , )i i i i i iz tr x ls w trη π β γ× Φ − − − −
2where is the bivariate normal density function.ϕ
3. Non-coresiding, receiving positive transfers and not working.
(Ci=0, TRi>0, LSPi=0)
3
1 1 1
2
Pr( 0, 0, )
= Pr( ) Pr( 0, 0 | ) = Pr( ) Pr( , | ) = ( ) ( , | )
Pi i i i i
Pi i i i i i
i i i i i i i i i i i
i i i i i i i
L C LS TR tr
TR tr LS C TR tru tr x z w tr u tr x
tr x z w tr tr xπ ν η ε β γ π
φ π η β γ π
= = = =
= × = = == − × < − < − − = −
− ×Φ − − − −

41
2where is the normal probability density function and is the bivariate normal cumulative distribution function.
φ Φ
4. Non-coresiding, receiving no transfers, working.
(Ci=0, TRi=0,LSPi>0)
4
1 1
Pr( 0, 0, )
Pr( ).Pr( 0, 0 | )
Pr Pr , |
( ). ( , | )
Pi i i i i
P Pi i i i i i
i i i i i i i i i i i i
i i i B i i i i i
L C TR LS ls
LS ls TR C LS ls
(u ls w tr ). (u x v z ls w tr )
ls w tr x z ls w tr
β γ π η ε β γ
φ β γ π η β γ
= = = =
= = = = =
= = − − < − < − = − −
= − − Φ − − − −
5. Non-coresiding, receiving no transfers and not working.
(Ci=0, LSPi=0, TRi=0)
5
1 1
3
Pr( 0, 0, 0) Pr( , , ) ( , , )
Pi i i i
i i i i i i i
i i i i
L C LS TRv z w tr u x
z w tr xη ε β γ π
η β γ π
= = = == < − < − − < −= Φ − − − −
3where is the trivariate normal cumulative distribution function.Φ
Log Likelihood Function:
The log likelihood is thus written as:
logLi=1(Ci=1).logL1i + 1(Ci=0, TRi>0,LSi>0).logL2i + 1(Ci=0,TRi>0,
LSi=0).logL3i + 1(Ci=0, TRi=0, LSi>0).logL4i + 1(Ci=0, TRi=0, LSi=0).logL5i
The analogous states for the coresiding case are the probabilities associated with:
1) non-coresiding; 2) coresiding, receiving positive transfers and working; 3)
coresiding, receiving positive transfers and not working; 4) coresiding, receiving no
transfers and working; and 5) coresiding, receiving no transfers and not working.
The set of explanatory variables in the transfers and labor supply equations differ in
the coresiding case, as shown in equations (1) and (2).