the australian group on antimicrobial resistance · quinupristin-dalfopristin is a combination...
TRANSCRIPT

AGAR
The Australian Group on Antimicrobial Resistance http://www.antimicrobial-resistance.com
Enterococcus species Survey
2009 Antimicrobial Susceptibility Report Clinical Professor Keryn Christiansen Microbiology & Infectious Diseases PathWest Laboratory Medicine, WA Royal Perth Hospital Perth, WA
Professor John Turnidge Laboratory Medicine SA Pathology Women’s & Children’s Hospital North Adelaide, SA
A/ Professor Thomas Gottlieb Department of Microbiology and Infectious Diseases Concord Hospital Concord, NSW Jan Bell Microbiology & Infectious Diseases SA Pathology Women’s & Children’s Hospital North Adelaide, SA
Narelle George Microbiology, Pathology Queensland Central Laboratory Herston Hospitals Complex Brisbane, QLD
Julie Pearson Microbiology & Infectious Diseases PathWest Laboratory Medicine, WA Royal Perth Hospital Perth, WA
On behalf of the Australian Group for Antimicrobial Resistance (AGAR)
Address correspondence to: Ms Julie Pearson c/- AGAR


2
Antimicrobial Susceptibility Report of Enterococcus Isolates from the Australian Group on Antimicrobial Resistance (AGAR)
2009 Surveillance Report


3
Table of Contents
1 EXECUTIVE SUMMARY ..................................................................................................................................... 4
2 INTRODUCTION ............................................................................................................................................... 5
2.1 OBJECTIVE OF THE PROGRAMME ............................................................................................................................... 5 2.2 IMPORTANCE OF ENTEROCOCCUS SPP ......................................................................................................................... 5 2.3 ANTIMICROBIALS TESTED AND RESISTANCE .................................................................................................................. 6
2.3.1 ß‐lactams .......................................................................................................................................................... 6 2.3.2 Glycopeptides .................................................................................................................................................... 6 2.3.3 Aminoglycosides ................................................................................................................................................ 6 2.3.4 Oxazolidinones .................................................................................................................................................. 6 2.3.5 Streptogramins ................................................................................................................................................. 6
3 METHODS ........................................................................................................................................................ 6
3.1 SPECIES IDENTIFICATION .......................................................................................................................................... 6 3.2 SUSCEPTIBILITY TESTING METHODOLOGY .................................................................................................................... 7 3.3 QUALITY CONTROL ................................................................................................................................................. 7
4 DEMOGRAPHICS .............................................................................................................................................. 7
4.1 REGIONAL SOURCE OF ISOLATES ................................................................................................................................ 7 4.2 AGE AND SEX DISTRIBUTION ..................................................................................................................................... 8
5 SPECIMEN SOURCE .......................................................................................................................................... 8
6 SUSCEPTIBILITY TESTING RESULTS: 2009 STUDY AND TREND DATA .................................................................. 8
6.1 AMPICILLIN ........................................................................................................................................................... 8 6.2 VANCOMYCIN ........................................................................................................................................................ 9 6.3 AMINOGLYCOSIDES ............................................................................................................................................... 12
6.3.1 Gentamicin ...................................................................................................................................................... 12 6.3.2 Streptomycin ................................................................................................................................................... 13
6.4 LINEZOLID ........................................................................................................................................................... 14 6.5 QUINUPRISTIN/DALFOPRISTIN ................................................................................................................................. 15
7 CROSS RESISTANCE ........................................................................................................................................ 15
8 LIMITATIONS OF THE STUDY .......................................................................................................................... 16
9 DISCUSSION .................................................................................................................................................. 16
10 REFERENCES .................................................................................................................................................. 17


4
1 Executive Summary Fifteen institutions around Australia conducted a period prevalence study of key resistances in isolates of Enterococcus species causing clinical disease amongst in- and outpatients in 2009. Each site collected up to 100 consecutive isolates and tested them for susceptibility to commonly used antimicrobials using standardised methods. Results were compared to similar surveys conducted in 1995, 1999, 2003, 2005 and 2007. In the 2009 survey, E. faecalis (1,116 strains) and E. faecium (213 strains) made up 98.7% of the 1,346 isolates tested. Ampicillin resistance was very common (90.6%) in E. faecium and absent for E. faecalis. Non susceptibility to vancomycin was 35.2 % in E. faecium (up from 15.4% in the 2007 survey) and 0.3% in E. faecalis. The vanB gene was detected in 75 E. faecium and two E. faecalis isolates. The vanA gene was detected in one E. faecium. High-level resistance to gentamicin was 33.5% in E. faecalis and 63.8% in E. faecium. A subset of isolates was tested against high-level streptomycin, linezolid and quinupristin/dalfopristin. High-level streptomycin resistance was 7.1% in E. faecalis and 40.3% in E. faecium. Linezolid resistance was below 5% in E. faecalis (4.0%) and E. faecium (2.1%). 21.9% of E. faecium were resistant to quinupristin/dalfopristin (E. faecalis is intrinsically resistant).
It is important to have an understanding of the occurrence of VRE and high level aminoglycoside resistance in Australia to guide infection control practices, antibiotic prescribing policies and drug regulatory matters.

5
2 Introduction
2.1 Objective of the Programme
The objective of the 2009 surveillance program was to determine the proportion of antimicrobial resistance in clinical isolates of Enterococcus species throughout Australia, with particular emphasis on:
1. Assessing susceptibility to ampicillin
2. Assessing susceptibility to glycopeptides
3. Assessing changes in resistance patterns over time using data collected in previous AGAR surveys
AGAR commenced surveillance of antimicrobial resistance in Enterococcus species in 1995. Similar surveys were conducted in 1999, 2003, 2005 and 2007.1,2,3,4
2.2 Importance of Enterococcus Species
Enterococci are part of the normal flora of the gastrointestinal tract. They can give rise to endogenous infections such as urinary tract infections outside of hospitals. In hospitals they can be transmitted through poor infection control practices and can give rise to a wide variety of infections usually in patients with co-morbidities. The two main species causing infections in humans are Enterococcus faecalis and Enterococcus faecium with only a very small number of other species being isolated from clinical specimens. Enterococci are recognised as significant nosocomial pathogens causing urinary tract, blood stream, sterile site and wound infections. Although resistant to many antibiotics enterococci have been generally susceptible to amoxycillin and vancomycin. Enterococcus faecium has become increasingly resistant to ampicillin/amoxycillin making vancomycin the treatment of choice for severe infections caused by this organism. Since 1988 resistance to vancomycin has emerged and increased worldwide and is now widespread in Europe and the USA. Recent reports from the USA indicate that rates of VRE in hospitalised adults are increasing at a rapid rate.5 For device-associated infections the incidence is particularly high: the National Healthcare Safety Network (NHSN) reported 78.9% vancomycin resistance in E. faecium from central line-associated bloodstream infections6. The first vancomycin resistant enterococcal isolate (VRE) was reported in Australia in 19947 and a report on the emergence and epidemiology of VRE in Australia was described in 19988 when 69 isolates had been documented. Prevalence or incidence rates of VRE in Australian hospitals are not routinely collected although there have been reports of individual hospital outbreaks of VRE infections and associated colonisation of other patients.9,10,11,12,13,14 The clinical impact of vancomycin resistance in enterococci has been reported to result in increases in mortality, length of stay and hospital costs.15,16,17 Infection control measures can be used to eradicate the organism from a hospital in an outbreak setting and to help prevent it from becoming established.9 Once prevalent in the hospital environment, cleaning of wards with bleach or hydrogen peroxide vapour has been shown to reduce VRE environmental contamination 18,19,20 providing a valuable tool for hospitals in reducing hospital-acquired infections.
Enterococci cause 5-18% of all cases of endocarditis, involving both prosthetic and normal heart valves.21,22,23 Combination therapy of a ß-lactam and an aminoglycoside (gentamicin or streptomycin)24,25,26 has been the standard treatment for endocarditis as use of ß-lactams alone are associated with high relapse rates (30-60%). Aminoglycosides are not routinely used to treat other enterococcal infections but in endocarditis the synergy between the two agents provides a cure. Synergy does not occur if the organism has high level gentamicin or streptomycin resistance (MIC> 500mg/L).
It is important to have an understanding of the occurrence of VRE and high level aminoglycoside resistance in Australia to guide infection control practices, antibiotic prescribing policies and drug regulatory matters.

6
2.3 Antimicrobials Tested and Resistance
2.3.1 ß-lactams
Penicillin (IV benzylpenicillin) and ampicillin/amoxycillin (oral and IV) are the principle therapeutic agents used for the treatment of infections caused by enterococci.
Ampicillin: Testing of this agent is used to predict susceptibility to penicillin and amoxycillin. Resistance to penicillin/ampicillin most commonly results from alterations to penicillin binding proteins. Resistance is rarely mediated by a ß-lactamase.27
2.3.2 Glycopeptides
Vancomycin resistance is mediated by one of a number of gene clusters carried either on a transposon or on the chromosome. Organisms with a VanA phenotype are resistant to both vancomycin and teicoplanin whereas organisms with the VanB phenotype are resistant to vancomycin only. Both these phenotypes are located on transmissible genetic elements. Resistance is due to changes in the ligase gene that results in an alteration of the glycopeptide binding site. Several other genes in the cluster potentiate this alteration.
Resistance can be detected by the use of a screening plate or routine susceptibility testing. The result is confirmed by detection of the vanA or vanB genes by PCR.
2.3.3 Aminoglycosides
High level resistance to aminoglycosides (MIC >500–2000mg/L) is mediated by plasmid borne aminoglycoside modifying enzymes (most commonly a fused 6’-acetyltransferase-2’-phosphotransferase for gentamicin, tobramycin, amikacin and a 6-adenylyltransferase for streptomycin). Possession of these enzymes eliminates synergy between the aminoglycoside and the ß-lactam.
2.3.4 Oxazolidinones
The first of the new drug class of oxazolidinones (linezolid) was introduced into clinical practice in Australia in the middle of the first decade of this century. It has a novel mechanism of action, and there is no cross-resistance with other drug classes. With a strictly Gram-positive spectrum, it is a valuable reserve agent for the treatment of patients with (i) infections caused by Gram-positives resistant to, or (ii) who are intolerant of other drug classes.
2.3.5 Streptogramins
Quinupristin-dalfopristin is a combination antibiotic of members of the streptogramin B and A antibiotic classes. The agents act synergistically, and the combination is active even in the presence of resistance to the streptogramin B class, which is common and linked to macrolide and lincosamide resistance. The combination is active against many Gram-positive species, including those resistant to other drug classes. E. faecalis is intrinsically resistant. It as used occasionally when resistance to other classes is a problem.
3 Methods Fifteen institutions from all Australian states and the Australian Capital Territory (ACT) participated in the Enterococcus species survey. Commencing on the 1st July 2009 each participating laboratory collected 100 consecutive, significant, clinical isolates of enterococci. Only one isolate per patient was tested unless a different antibiogram was observed from routine susceptibility results. For each isolate the following information was obtained: date of collection, age, sex, specimen source, and inpatient or outpatient status.
3.1 Species Identification
All isolates were tested for pyrrolidonyl arylamidase (PYR) and esculin hydrolysis in the presence of bile with optional testing for growth in 6.5% NaCl, Group D antigen and growth at 45oC. Isolates were identified to species level by one of the following methods: API 20S, Vitek 2, Phoenix, PCR, or conventional biochemical tests. If biochemical testing was performed, the minimum tests necessary for identification were: motility, pigment production, methyl--D-glucopyranoside (MGP), fermentation of 1% raffinose, 1% arabinose, 1% xylose and pyruvate utilisation.

7
3.2 Susceptibility Testing Methodology
Participating laboratories performed antimicrobial susceptibility tests according to each laboratory’s routine standardised methodology28,29,30,31 (CDS or CLSI disc diffusion, Vitek 2, agar dilution or Etest). Ampicillin and vancomycin were tested by all laboratories. In addition, 1,342 (99.7%) were screened for high level gentamicin resistance, 885 (65.8%) were tested against linezolid, 754 (56.0%) were tested against quinupristin/dalfopristin and 343 (25.5%) were screened for high level streptomycin resistance.
One third (452, 33.6%) of isolates was tested for ß-lactamase production using nitrocefin.
3.3 Quality Control
Additional quality control was not performed for this survey. As all participating laboratories are NATA accredited, routine QC testing of antimicrobial susceptibility test methods is an integral part of routine procedures. However, isolates that were resistant to vancomycin were referred to the appropriate state National VRE Network (NaVREN) laboratory for molecular testing to confirm resistance genotype. All isolates were stored at -70°C for further testing if required by AGAR.
4 Demographics
4.1 Regional Source of Isolates
Both public (14) and private (1) laboratories participated in this study. Participants included New South Wales (4), ACT (1), Queensland (4), Victoria (1), South Australia (3) and Western Australia (2). There were 1,346 isolates from 15 institutions (Table 1). E. faecalis was the most frequently isolated species (82.9%) followed by E. faecium (15.8%) (Table 2). Data from NSW and ACT have been combined.
Table 1. Isolates by Region
Region Participating Laboratories (n)
Isolates (n) %
New South Wales/Australian Capital Territory (NSW/ACT)
5 452 33.6
Queensland (Qld) 4 400 29.7
South Australia (SA) 3 194 14.4
Victoria (Vic) 1 100 7.4
Western Australia (WA) 2 200 14.9
Total 15 1,346 100
Table 2. Species by Region
Region E. faecalis E. faecium Other spp. or unspeciated
Total
NSW/ACT 361 89 2 452
Qld 358 36 6 400
SA 154 35 5 194
Vic 77 22 1 100
WA 166 31 3 200
Aus 1,116 (82.9%) 213 (15.8%) 17 (1.3%) 1,346

8
4.2 Age and Sex Distribution
The age distribution of patients reflect the association of infection with other predisposing medical conditions more commonly seen in the elderly or very young. Isolation of enterococci was more common in men (53.7%). 802 (59.6%) patients were classified as hospital inpatients at time of collection and 320 (23.8%) were outpatients. Hospitalisation status was not available for 224.
Table 3. Age and Sex Distribution by Species
Age Range E. faecalis E. faecium Other spp. or unspeciated
Total (%)
<2 37 2 2 41 (3.0)
2-4 13 0 0 13 (1.0)
5-14 15 1 0 16 (1.2)
15-29 76 11 0 87 (6.5)
30-59 265 53 5 323 (24.0)
≥60 710 146 10 866 (64.3)
Female 507 110 6 623 (46.3)
Male 609 103 11 723 (53.7)
5 Specimen Source The majority of isolates (68.4%) were from the urinary tract (Table 4). These were predominantly E. faecalis (87.5%). Invasive (blood and sterile cavity) isolates comprised 12.0% of the total number collected. E. faecium was disproportionately represented in the invasive group (29.8%). Of the E. faecalis isolates, 9.7% were invasive compared to 22.5% of E. faecium.
Table 4. Source of Isolates
Source E. faecalis E. faecium Other spp. or unspeciated
Total
Urine 806 108 7 921 (68.4%)
SSTI 198 53 5 256 (19.0%)
Blood 77 33 4 114 (8.5%)
Sterile Body Cavity 31 15 1 47 (3.5%)
Other 4 4 0 8 (0.6%)
Total 1,116 213 17 1,346
Invasive 108 48 5 161 (12.0%)
Non-invasive 1,008 165 12 1,185 (88.0%)
6 Susceptibility Testing Results: 2009 Study and Trend Data
6.1 Ampicillin
Resistance to ampicillin was common in the E. faecium isolates (Table 5). Resistance in E. faecium was due to penicillin binding protein changes. No ampicillin resistance was found amongst the E. faecalis strains. 452 (33.6%) of the isolates were tested for ß-lactamase; none was positive.

9
Trend data for E. faecium show an initial increase in ampicillin resistance between 1995 and 1999 with a plateau from 1999 to 2005. Resistance increased significantly (P=0.0002) between 2005 and 2009. Resistance in invasive strains has risen significantly (P<0.0001) since 1995 and is now equal to that of non-invasive strains (Figure 1).
Table 5. Ampicillin Resistance. Number Resistant/Total (%)
NSW/ACT QLD SA VIC WA AUS
E. faecalis 0/361
(0.0)
0/358
(0.0)
0/154
(0.0)
0/77
(0.0)
0/166
(0.0)
0/1,116
(0.0)
invasive 0/46
(0.0)
0/14
(0.0)
0/22
(0.0)
0/8
(0.0)
0/18
(0.0)
0/108
(0.0)
E. faecium 78/89
(87.6)
35/36
(97.2)
30/35
(85.7)
22/22
(100)
28/31
(90.3)
193/213
(90.6)
invasive 14/16
(87.5)
5/6
(83.3)
10/11
(90.9)
8/8
(100)
6/7
(85.7)
43/48
(89.6)
Figure 1. Ampicillin Resistance: E. faecium
1995: invasive n=26, non-invasive n= 55, overall n=81. 1999: invasive n=30, non-invasive n= 152, overall n=182. 2003: invasive
n=51, non-invasive n= 81, overall n=132. 2005: invasive n=43, non-invasive n= 137, overall n=180. 2007: invasive n=51, non-invasive n= 98, overall n=156. 2009: invasive n=48, non-invasive n= 165, overall n=213
6.2 Vancomycin
Resistant and intermediate resistant isolates have been combined and referred to as non-susceptible (NS). All isolates were tested for susceptibility to vancomycin and if NS tested for the presence of van genes. In addition 11 vancomycin susceptible E. faecium and 92 susceptible E. faecalis were tested for the presence of van genes as it is routine practice in one laboratory to perform PCR on all enterococci and in several laboratories to perform PCR on E. faecium from sterile sites regardless of vancomycin susceptibility.
Resistance to vancomycin was uncommon in E. faecalis (0.3%) (Table 6). Of the three NS E. faecalis, two were the vanB genotype and one with intermediate resistance as tested by disc diffusion did not possess either vanA or vanB (Table 7).
A total of 35.2% of E. faecium were vancomycin NS, more than double that of the 2007 survey (15.4%, P<0.0001) (Figure 2). Vancomycin NS E. faecium were detected in all regions except Western Australia. Vancomycin NS in the other regions ranged from 13.9% in Queensland to 63.6% in Victoria (Table 6). All of the vancomycin NS E. faecium were confirmed as VRE by PCR and were predominantly (74/75, 98.7%) of the vanB genotype. In addition, one
0%
20%
40%
60%
80%
100%
1995 1999 2003 2005 2007 2009
Invasive Non‐Invasive Overall

10
vancomycin susceptible E. faecium (MIC 4mg/L) from a urine specimen had a vanB genotype. In 2009 more than one third of urine, wound, blood and sterile body cavity E. faecium were VRE. The average age of a patient with a confirmed VRE was 66 years (median 68 years) and the genders were equally represented (56% male). Trend data for E. faecium show that after no vancomycin resistance was detected in 1995 there has been a marked increase, particularly since 2003 (Figure 2). The proportion of NS E. faecium in both invasive and non-invasive isolates increased significantly (P=0.004 and P=0.003 respectively) since the 2007 survey. Vancomycin resistant E. faecium have occurred in all 5 regions over the six survey periods, with all regions except WA showing increases in VRE over time (Figure 3).
Table 6. Vancomycin non-susceptible. Number/Total (%)
NSW/ACT QLD SA VIC WA AUS
E. faecalis 0/361
(0.0)
0/358
(0.0)
1/154
(0.7)
2/77
(2.6)
0/166
(0.0)
3/1,116
(0.3)
invasive 0/46
(0.0)
0/14
(0.0)
1/22
(4.5)
0/8
(0.0)
0/18
(0.0)
1/108
(0.9)
E. faecium 41/89
(46.1)
5/36
(13.9)
15/35
(42.9)
14/22
(63.6)
0/31
(0.0)
75/213
(35.2)
invasive 7/16
(43.8)
1/6
(16.7)
5/11
(45.5)
5/8
(62.5)
0/7
(0.0)
18/48
(37.5)
Table 7. Vancomycin Resistant Enterococci: van gene PCR results
E. faecalis E. faecium
Specimen vanA vanB vanA/B not detected vanA vanB vanA/B not detected
Urine 2 1 36
Wound 20*
Blood 1 12
Sterile body cavity 6
Other 1
Total 2 1 1 75
*One vanB E. faecium wound isolate had a vancomycin MIC in the susceptible range.

11
Figure 2. Vancomycin Resistance: E. faecium
1995: invasive n=26, non-invasive n= 55, overall n=81. 1999: invasive n=30, non-invasive n= 152, overall n=182. 2003: invasive n=51, non-invasive n= 81, overall n=132. 2005: invasive n=43, non-invasive n= 137, overall n=180. 2007: invasive n=51, non-invasive n= 98, overall n=156. 2009: invasive n=48, non-invasive n= 165, overall n=213
Figure 3. Regional Location of Vancomycin Resistant E. faecium 1995, 1999, 2003, 2005, 2007 and 2009
Note: No Tasmanian laboratories contributed isolates in 2009
0%
10%
20%
30%
40%
1995 1999 2003 2005 2007 2009
Invasive Non‐Invasive Overall
0
5
10
15
20
25
30
35
40
45
NSW/ACT Qld SA Vic/Tas WA
1995
1999
2003
2005
2007
2009

12
6.3 Aminoglycosides 6.3.1 Gentamicin
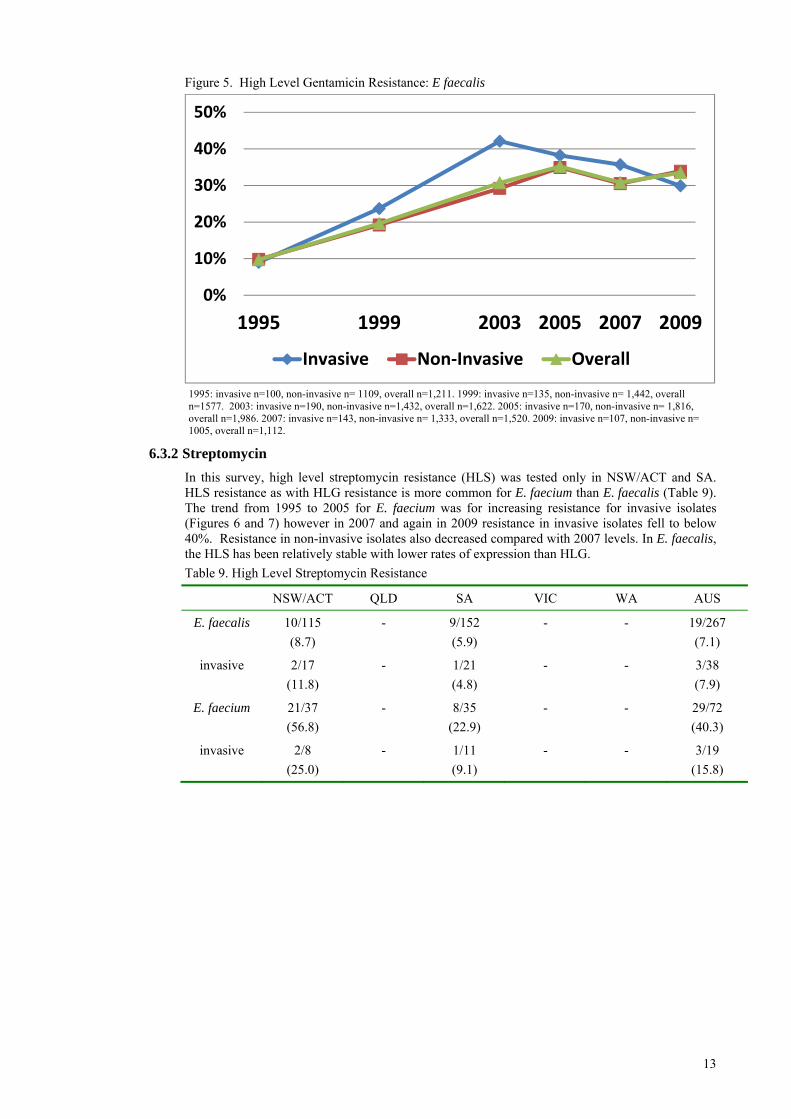
High level gentamicin (HLG) resistance was seen in both E. faecalis (33.5%) and E. faecium (63.8%) (Table 8). Trend data for 1995 to 2009 (Figures 4 and 5) show after an initial increase in HLG, resistance rates for E. faecium have been stable since 1999 whilst in E. faecalis resistance continued to increase until 2005 and then stabilised. HLG resistance in invasive isolates reached a peak of 42% in 2003 but has decreased slightly over the past three surveys.
Table 8. High Level Gentamicin Resistance
NSW/ACT QLD SA VIC WA AUS
E. faecalis 145/361
(40.2)
126/356
(35.4)
33/152
(21.7)
25/77
(32.5)
44/166
(26.5)
373/1,112
(33.5)
invasive 16/46
(34.8)
3/14
(21.4)
7/21
(33.3)
1/8
(12.5)
5/18
(27.8)
32/107
(29.9)
E. faecium 57/89
(64.0)
27/36
(75.0)
21/35
(60.0)
15/22
(68.2)
16/31
(51.6)
136/213
(63.8)
invasive 9/16
(56.3)
3/6
(50.0)
6/11
(54.5)
5/8
(62.5)
3/7
(42.9)
26/48
(54.2)
Figure 4. High level Gentamicin Resistance: E. faecium
1995: invasive n=23, non-invasive n= 50, overall n=73. 1999: invasive n=30, non-invasive n= 152, overall n=182. 2003: invasive n=51, non-invasive n= 81, overall n=132. 2005: invasive n=43, non-invasive n= 137, overall n=180. 2007: invasive n=51, non-invasive n= 98, overall n=156. 2009: invasive n=48, non-invasive n= 165, overall n=213.
0%
20%
40%
60%
80%
1995 1999 2003 2005 2007 2009
Invasive Non‐Invasive Overall
13
Figure 5. High Level Gentamicin Resistance: E faecalis
1995: invasive n=100, non-invasive n= 1109, overall n=1,211. 1999: invasive n=135, non-invasive n= 1,442, overall n=1577. 2003: invasive n=190, non-invasive n=1,432, overall n=1,622. 2005: invasive n=170, non-invasive n= 1,816, overall n=1,986. 2007: invasive n=143, non-invasive n= 1,333, overall n=1,520. 2009: invasive n=107, non-invasive n= 1005, overall n=1,112.
6.3.2 Streptomycin
In this survey, high level streptomycin resistance (HLS) was tested only in NSW/ACT and SA. HLS resistance as with HLG resistance is more common for E. faecium than E. faecalis (Table 9). The trend from 1995 to 2005 for E. faecium was for increasing resistance for invasive isolates (Figures 6 and 7) however in 2007 and again in 2009 resistance in invasive isolates fell to below 40%. Resistance in non-invasive isolates also decreased compared with 2007 levels. In E. faecalis, the HLS has been relatively stable with lower rates of expression than HLG.
Table 9. High Level Streptomycin Resistance
NSW/ACT QLD SA VIC WA AUS
E. faecalis 10/115
(8.7)
- 9/152
(5.9)
- - 19/267
(7.1)
invasive 2/17
(11.8)
- 1/21
(4.8)
- - 3/38
(7.9)
E. faecium 21/37
(56.8)
- 8/35
(22.9)
- - 29/72
(40.3)
invasive 2/8
(25.0)
- 1/11
(9.1)
- - 3/19
(15.8)
0%
10%
20%
30%
40%
50%
1995 1999 2003 2005 2007 2009
Invasive Non‐Invasive Overall

14
Figure 6. High Level Streptomycin: E. faecium
1995: invasive n=19, non-invasive n= 44, overall n=63. 1999: invasive n=18, non-invasive n= 83, overall n=101. 2003: invasive n=30, non-invasive n= 44, overall n=74. 2005: invasive n=22, non-invasive n= 72, overall n=94. 2007: invasive n=25, non-invasive n= 43, overall n=73. 2009: invasive n=19, non-invasive n=53, overall n=72.
Figure 7. High Level Streptomycin: E. faecalis
1995: invasive n=61, non-invasive n= 916, overall n=979. 1999: invasive n=92, non-invasive n= 916, overall n=1008. 2003: invasive n=102, non-invasive n=715, overall n=817. 2005: invasive n=80, non-invasive n= 1012, overall n=1092. 2007: invasive n=197, non-invasive n= 783, overall n=913. 2009: invasive n=38, non-invasive n= 229, overall n=267.
6.4 Linezolid
Linezolid non-susceptibility was present in 4.0% of E. faecalis (down from 4.8% in 2007) and in 2.1% (none detected in 2007) of E. faecium. Thirty of the 32 NS isolates had an MIC in the intermediate resistant category (classified as susceptible using EUCAST guidelines); only two were classified as resistant (MIC ≥8mg/L). The majority (75%) of the non-susceptible isolates were from NSW/ACT. Two isolates were tested against linezolid in Victoria and only one isolate was tested in Western Australia.
0%
20%
40%
60%
80%
1995 1999 2003 2005 2007 2009
Invasive Non‐Invasive Overall
‐5%
5%
15%
25%
35%
45%
1995 1999 2003 2005 2007 2009
Invasive Non‐Invasive Overall

15
Table 10. Linezolid Non-susceptibility. Number Resistant/Total (%)
NSW/ACT QLD SA VIC WA AUS
E. faecalis 21/361
(5.8)
8/270
(3.0)
0/97
(0.0)
- 0/1
(0.0)
29/729
(4.0)
invasive 4/46
(8.7)
0/9
(0.0)
0/18
(0.0)
- 0/1
(0.0)
4/74
(5.4)
E. faecium 3/89
(3.4)
0/25
(0.0)
0/30
(0.0)
0/2
(0.0)
- 3/146
(2.1)
invasive 1/16
(6.3)
0/6
(0.0)
0/11
(0.0)
0/2
(0.0)
-
1/35
(2.9)
6.5 Quinupristin/dalfopristin
E. faecalis are intrinsically resistant to quinupristin/dalfopristin (Q/D). 21.9% of the E. faecium were NS (up from 9.8% in 2007) with 24 of the 25 NS isolates having an MIC in the resistant range (MIC >2 mg/L). As was the case in 2007, all quinupristin/dalfopristin NS cases were identified in isolates originating in NSW/ACT. No isolates were tested against Q/D in South Australia or Victoria and only one isolate was tested in Western Australia.
Table 11. Quinupristin/dalfopristin Non-susceptibility. Number Resistant/Total (%)
NSW/ACT QLD SA VIC WA AUS
E. faecalis 300/361
(83.1)
259/270
(95.9)
-
- 0/1
(0.0)
559/632
(88.5)
invasive 39/46
(84.8)
8/9
(88.9)
- - 0/1
(0.0)
47/56
(83.9)
E. faecium 25/89
(28.1)
0/25
(0.0)
- - - 25/114
(21.9)
invasive 3/16
(18.8)
0/6
(0.0)
- - -
3/22
(13.6)
7 Cross Resistance Cross resistance to other agents was examined in vancomycin resistant strains of enterococci (Table 12). Resistance to ampicillin, high levels of streptomycin and gentamicin, and linezolid was more common in resistant E. faecium. Resistance in Q/D was similar for VRE and non-VRE.
Table 12. Cross Resistance in VRE Species Vancomycin
Status Ampicillin
R (%) Gentamicin
R (%) Streptomycin
R (%) Linezolid IR (%)
Q/D IR (%)
E. faecalis Not VRE 0/1,114
(0.0)
372/1,110
(33.5)
19/267
(7.1)
29/729
(4.0)
559/632
(88.5)
VRE 0/2
(0.0)
1/2
(50.0)
- - -
E. faecium Not VRE 117/137
(85.4)
80/137
(58.4)
9/36
(25.0)
0/86
(0.0)
14/68
(20.6)
VRE 76/76
(100)
56/76
(73.7)
20/36
(55.6)
3/60
(5.0)
11/46
(23.9)
Q/D: Quinupristin/dalfopristin.

16
8 Limitations of the Study The enterococci in this study were tested against a limited range of antimicrobials. In part this was driven by the presence of intrinsic resistances in this genus. Enterococci are intrinsically resistant to cephalosporins, macrolides, lincosamides and conventional therapeutic levels of aminoglycosides when used alone. Other agents which are usually active against enterococci in urinary tract infection, including fluoroquinolones and nitrofurantoin, were not examined largely because few clinical treatment problems have been encountered up to now with enterococcal UTI.
It is likely that the number of wound isolates in this study is under-represented, as it is common for microbiology laboratories not to proceed with identification of enterococci when they are found in mixed cultures from wound infections.
As only a maximum of 100 isolates were collected per institution only a portion of actual clinical isolates are represented.
There have been changes in participating laboratories in the AGAR Enterococcus surveys over time from 1995 through to 2009 with the more recent inclusion of a number of private pathology laboratories. This may have influenced trend data.
9 Discussion It is clear from this study and the examination of trends over the last 15 years that resistance is increasing significantly in E. faecium. Furthermore, this species is accounting for an increasing proportion of invasive disease. Treatment options for this species are becoming ever more limited as resistance to ampicillin and other penicillins is now very high, and glycopeptide resistance is increasing. In some instances only expensive and/or potentially toxic treatment options such as linezolid, quinupristin-dalfopristin, tigecycline or daptomycin are available.
In E. faecium, ampicillin resistance is the result of changes in penicillin-binding proteins. This is also true for most strains of E. faecalis, although ß-lactamase production has been seen rarely (3 known instances in Australia in the last two decades).26 No ß-lactamase-producing strains of enterococci were detected in this survey. This survey has shown that ampicillin resistance is now the norm in E. faecium but is still uncommon in E. faecalis. Ampicillin resistance in enterococci presents considerable challenges when infections are serious, as the strains will not be susceptible to any ß-lactam, and the drug of choice becomes vancomycin, which is only slowly bactericidal. Further, for endocarditis the combination of vancomycin with an aminoglycoside creates significant toxicity problems.
Unfortunately vancomycin resistance in enterococci is increasing in Australia particularly over the past two years. It has been seen in all states and territories although rates in each region vary considerably. It is widely recognised that rates of colonisation far exceed the rates of infection with VRE, and thus the amount of VRE seen in our survey does not truly reflect the size of the VRE reservoir. The survey results are also consistent with the previous Australian experience that the dominant type of resistance is encoded by the vanB complex,4,32 in contrast with the situation in Europe and the USA where vanA dominates. Vancomycin-resistant strains causing serious infection are very challenging to treat. The choices are linezolid, quinupristin-dalfopristin, tigecycline and daptomycin. Each of these agents presents its own challenges for treatment as well.
High-level resistance to gentamicin has reached a plateau but is still very high, greatly compromising the ability to treat enterococcal endocarditis effectively.
The data provided by this survey will be useful in informing microbiologists, infectious diseases physicians and infection control practitioners about the increasing importance of VRE in Australia. It will help to guide prescribers treating presumptive enterococcal infections in empirical choices; e.g. ampicillin/amoxycillin still being active against the vast majority of strains of E. faecalis when treating infections caused by this organism. Finally, the data will assist regulators and the pharmaceutical industry on the growing importance of VRE in Australia, and guide decision makers about controls that might be required on reserve antibiotics.

17
10 References 1. Bell J, Fernandes L, Coombs G, Fernandes C. Prevalence of antimicrobial resistance in
enterococci in Australian teaching hospitals. 11th European Congress of Clinical Microbiology and Infectious Diseases. Clin Micr Infect 2001;S1:24.
2. Nimmo G, Bell J, Collignon P, on behalf of the Australian Group for Antimicrobial Resistance (AGAR). Fifteen years of surveillance by the Australian Group for Antimicrobial Resistance (AGAR). Commun Dis Intell 2003;27:547-54.
3. Christiansen K, Turnidge J, Bell J, George N, Pearson J and the Australian Group on Antimicrobial Resistance (AGAR). Prevalence of antimicrobial resistance in Enterococcus isolates in Australia 2005: Report from the Australian group on Antimicrobial Resistance. Commun Dis Intell, 2007; 31:392-397.
4. Pearson J, Christiansen K, Turnidge J, Bell J, Gottlieb T and George N on behalf of the Australian Group on Antimicrobial Resistance (AGAR). Vancomycin resistant enterococci in Australia: results of the AGAR surveys 1995 to 2010. Antimicrobials, Melbourne, 2011.
5. Ramsey A, Zilberberg M. Secular trends of hospitalization with vancomycin-resistant Enterococcus infection in the United States, 2000-2006. Infect Control Hosp Epidemiol 2009;30:184-186.
6. Hidron A, Edwards J, Patel J, Horan T, Sievert D, Pollock D et al, for the National Healthcare Safety Network Team and participating National Healthcare Safety Network facilities. Antimicrobial-resistant pathogens associated with healthcare-associated infections: annual summary of data reported to the National Healthcare Safety Network at the Centers for Disease Control and Prevention, 2006-2007. Infect Control Hosp Epidemiol 2008;29:996-1011.
7. Kamarulzaman, A, Tosolini FA, Boquest AL, Geddes JE, Richards MJ. Vancomycin-resistant Enterococcus faecium in a liver transplant patient. Aust NZ J Med 1995;25:560.
8. Bell J, Turnidge J, Coombs G, O’Brien F. Emergence and epidemiology of vancomycin-resistant enterococci in Australia. Commun Dis Intell 1998;22:249-52.
9. Christiansen KJ, Tibbett PA, Beresford B, Pearman J, Lee R, Coombs G et al. Eradication of a large outbreak of a single strain of vanB vancomycin-resistant Enterococcus faecium at a major Australian teaching hospital. Infect Control Hosp Epidemiol 2004;25:384-90.
10. Cooper E, Paull A, O’Reilly M. Characteristics of a large cluster of vancomycin-resistant enterococci in an Australian hospital. Infect Control Hosp Epidemiol 2002;23:151-3.
11. Bartley PB, Schooneveldt JM, Looke DF, Morton A, Johnson DW, Nimmo GR. The relationship of a clonal outbreak of Enterococcus faecium vanA to methicillin-resistant Staphylococcus aureus incidence in an Australian hospital. J Hosp Infect 2001;48:43-54.
12. MacIntyre C, Empson M, Boardman C, Sindhusake D, Lokan J, Brown G. Risk factors for colonisation with vancomycin-resistant enterococci in a Melbourne hospital. Infect Control Hosp Epidemiol 2001;22:624-9.
13. Padiglione A, Grabsch E, Olden D, Hellard M, Sinclair M, Fairley C et al. Fecal colonization with vancomycin-resistant enterococci in Australia. Emerg Infect Dis 2000;6:534-6.
14. Johnson P, Ballard S, Grabsch E, Stinear T, Seemann T, Young H et al. A sustained hospital outbreak of vancomycin-resistant Enterococcus faecium bacteraemia due to emergence of vanB E. faecium sequence type 203. J Infect Dis 2010;202:1278-86.
15. Joels C, Matthews B, Sigmon L, Hasan R, Lohr C, Kercher K et al. Clinical characteristics and outcomes of surgical patients with vancomycin-resistant enterococcal infections. Am Surg 2003;69:514-9.
16. DiazGranados C, Zimmer S, Klein M, Jernigan J. Comparison of mortality associated with vancomycin-resistant and vancomycin susceptible enterococcal bloodstream infections: A meta-analysis. Clin Infect Dis 2005;41:327-33.
17. DiazGranados C, Jernigan J. Impact of vancomycin resistance on mortality among patients with neutropenia and enterococcal bloodstream infection. J Infect Dis 2005;191:588-95.

18
18. Otter J, Cummins M, Ahmad F, van Tonder C, Drabu Y. Assessing the biological efficacy and rate of recontamination following hydrogen peroxide vapour decontamination. J Hosp. Infect. 2007;67:125-8.
19. Chan H-T, White P, Sheorey H, Cocks J, Waters M-J. Evaluation of the biological efficacy of hydrogen peroxide vapour decontamination in wards of an Australian Hospital. J Hosp. Infect. 2011;79:182-8.
20. Grayson M, Mahony A, Grabsch E, Cameron D, Martin R, Heland M et al. Marked reductions in rates of vancomycin resistant enterococci (VRE) colonization & disease associated with introduction of a routine hospital-wide bleach cleaning program. International conference on prevention & infection control. BMC Proceedings 2011, 5(Suppl 6).
21. Kazanjian P. Infective endocarditis: Review of 60 cases treated in community hospitals. Infect Dis Clin Pract 1993;5:41.
22. Serra P, Brandimarte C, Martino P et al. Synergistic treatment of enterococcal endocarditis. Arc Intern Med 1977;137:1562.
23. Mergran D. Enterococcal endocarditis. Clin Infect Dis 1992;15:63.
24. Pelletier L, Petersdorf R,. Infective endocarditis: a review of 125 cases from the University of Washington Hospitals, 1963-72. Medicine (Baltimore) 1997;56:287-313.
25. Murray B. The life and times of the enterococcus. Clin Microbiol Rev 1990;3:46-65.
26. Eliopoulos G, Eliopoulis C. Therapy of enterococcal infections. Eur J Clin Microbiol Infect Dis 1990;9:118-26.
27. McAlister T, George N, Faoagali J, Bell J. Isolation of a β-lactamase positive vancomycin resistant Enterococcus faecalis; first case in Australia. Commun Dis Intell 1999:23:237-239.
28. Bell S, Pham J, Carter I, Hanrahan J. Antibiotic susceptibility testing by the CDS method: A manual for medical and veterinary laboratories 2011. Sixth edition 2011. http://web.med.unsw.edu.au
29. Clinical and Laboratory Standards Institute (2012). Performance standards for antimicrobial susceptibility testing; twenty-second Informational Supplement. M100-S22. CLSI, Villanova, PA, USA.
30. Clinical and Laboratory Standards Institute (2012). Methods for dilution antimicrobial susceptibility tests for bacteria that grow aerobically; approved standard – ninth edition. M07-A9. CLSI, Villanova, PA, USA.
31. Clinical and Laboratory Standards Institute (2012). Performance standards for antimicrobial disk susceptibility tests; approved standard – eleventh edition. M02-A11. CLSI, Villanova, PA, USA.
32. Bell J, Paton JC, Turnidge J. Emergence of vancomycin-resistant enterococci in Australia: phenotypic and genotypic characteristics of the isolates. J Clin Microbiol 1998;2187-90.