the atlantis water supply scheme “local climate … quality is generally saline with bacteria...
TRANSCRIPT

The Atlantis Water Supply Scheme“Local Climate Solution for Africa”
A case study of integrated water resource management

ATLANTIS AQUIFER
CAPE FLATS AQUIFER
T MG AQUIFER STUDY AREA SITUATED IN THE MOUNTAIN CHAIN
NEWLANDS AQUIFER
AtlantisWater Supply
Scheme

Atlantis Water Supply Scheme

Atlantis Water Supply Scheme
Purpose – Municipal supply
Resources – Spring, groundwater and transferred municipal supply, recycled SW & WW
Aquifers – 2 Primary unconfined
Boreholes – 32 Production
Recharge – Natural & managed SW detention ponds – 4 residential, 4 industrial , 1reception & diversion Recharge basins – 2 for aquifer and 4 for sea water barrierTreated domestic WW – to aquiferTreated industrial WW – to sea water
Groundwater treatment –Hardness removal, blending with stabilised municipal supply
Groundwater quality –Neutral pH, hard, moderate TDS
Iron clogging – Frequent & problematic
Declining borehole yield –Due to clogging and borehole construction
Borehole rehabilitation –Sporadic to maintain yield
Management initiatives –Monitoring monthly, sporadic step drawdown tests & CCTV camera logging, Aquifer Management Committee (to be reconvened!)

Atlantis Water Supply Scheme
Aquifer
Residential users Industrial users
WzWTP
SsWTP
Bholes Bholes
DomesticWWTW
Industrial WWTW
Residential SW
IndustrialSWPond 6
CoastalRecharge
Sea
VvleiWTP
RechargeP12
RechargeP7 Weir
Natural Recharge

Q: Why Cape Town considers the AWSS a good idea and why we did it this way. Is it a success ?
Atlantis needed a reliable independent and sustainable water supplySupply of treated surface water not economically affordable and at the extremity of the supply systemGood quality GW in the primary aquifer but natural recharge was too low to prevent depletionScientific evidence that the recharge and recycling of treated effluent is viable in the primary aquiferGreenfield development leant itself to innovative design and integration of infrastructure incorporating IWRMRobust and flexible system developed over timeAdditional treated water augments recharge and improves water qualitySuccessful supply history since 1975Water quality not adversely impacted by recharge
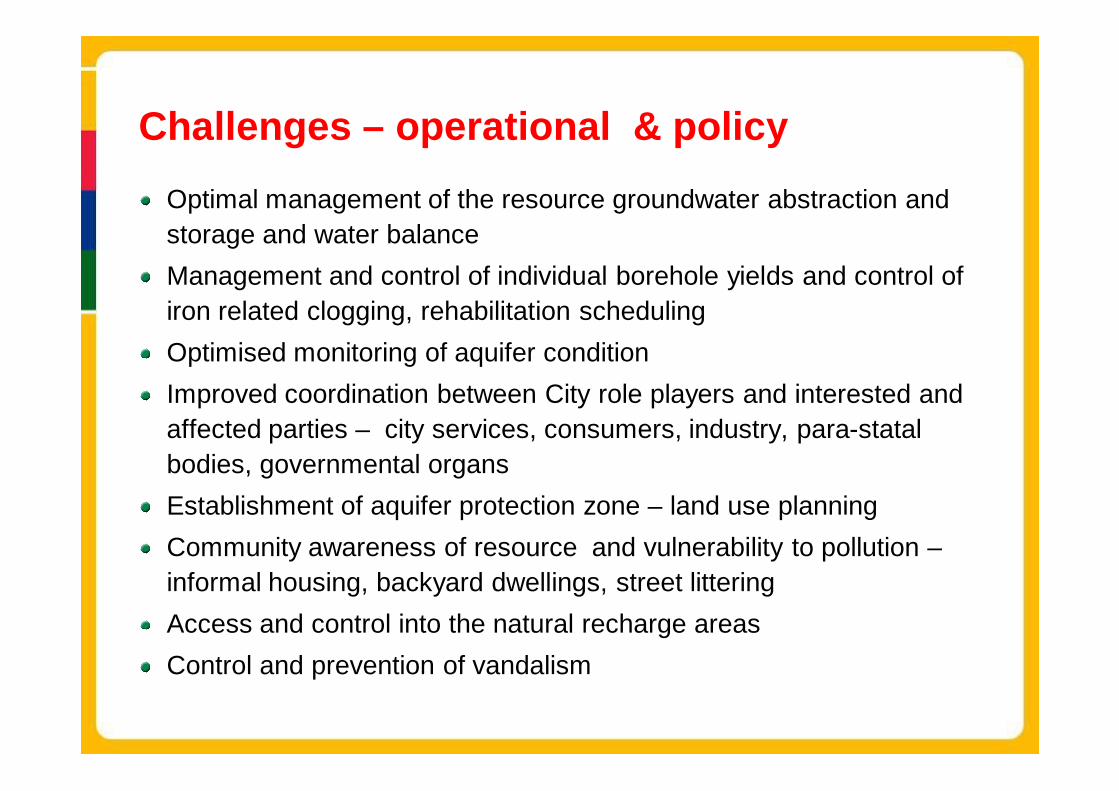
Challenges – operational & policyOptimal management of the resource groundwater abstraction and storage and water balanceManagement and control of individual borehole yields and control of iron related clogging, rehabilitation schedulingOptimised monitoring of aquifer condition Improved coordination between City role players and interested and affected parties – city services, consumers, industry, para-statal bodies, governmental organsEstablishment of aquifer protection zone – land use planning Community awareness of resource and vulnerability to pollution –informal housing, backyard dwellings, street litteringAccess and control into the natural recharge areasControl and prevention of vandalism

Management Initiatives
Aquifer levels & water balancePump yield monitoring and optimizationWater quality control testsDrawdown managementRoutine maintenance review and improvementStaff training & operating rulesAquifer protection zone and land use rules
Borehole design review & improvementClogging controlCCTV inspectionsStep drawdown pumping testsRehabilitation planPumping equipment review & improvement.Multi-disciplinary team management

How is this a“Local Climate Solution for Africa” ?
Groundwater is a potentially significant renewable resource in AfricaAquifer sustainability can be enhanced by artificial rechargeStormwater and treated effluent can be safely used at relatively low costWater can be stored and losses to evaporation can be minimised.Optimisation of water useWater stress due to climatic variations can be buffered
A drought reserve can be maintainedTechnology can range from simple ( recharge ponds ) to complex treated effluent reuse.Artificial recharge can be used to improve public environmental awareness and understanding of how to cope with climate variability and stresses.Recharge areas can be integrated into nature reservesWetlands could generate economic benefits and crops

The Good, Bad and Beware aspects
Improved assurance of water supplyA water in the bank approachLower energy utilisation than desalinationLow carbon footprint potentialEconomic and ecological sustainability benefits
Requires careful management and operation to maintain contamination barriers and controlsAquifer monitoring costsRetro-fitting not cheap, greenfield infrastructure most cost effectiveWill not work everywhere

Witzands wellfield water levelsShowing the recovery of the aquifer storage due to artificial recharge – data from CSIR aquifer monitoring

Thank you
Thank you
Any Questions ?
Thank you
Any Questions ?

More Information
Recharge pond 7 – full level
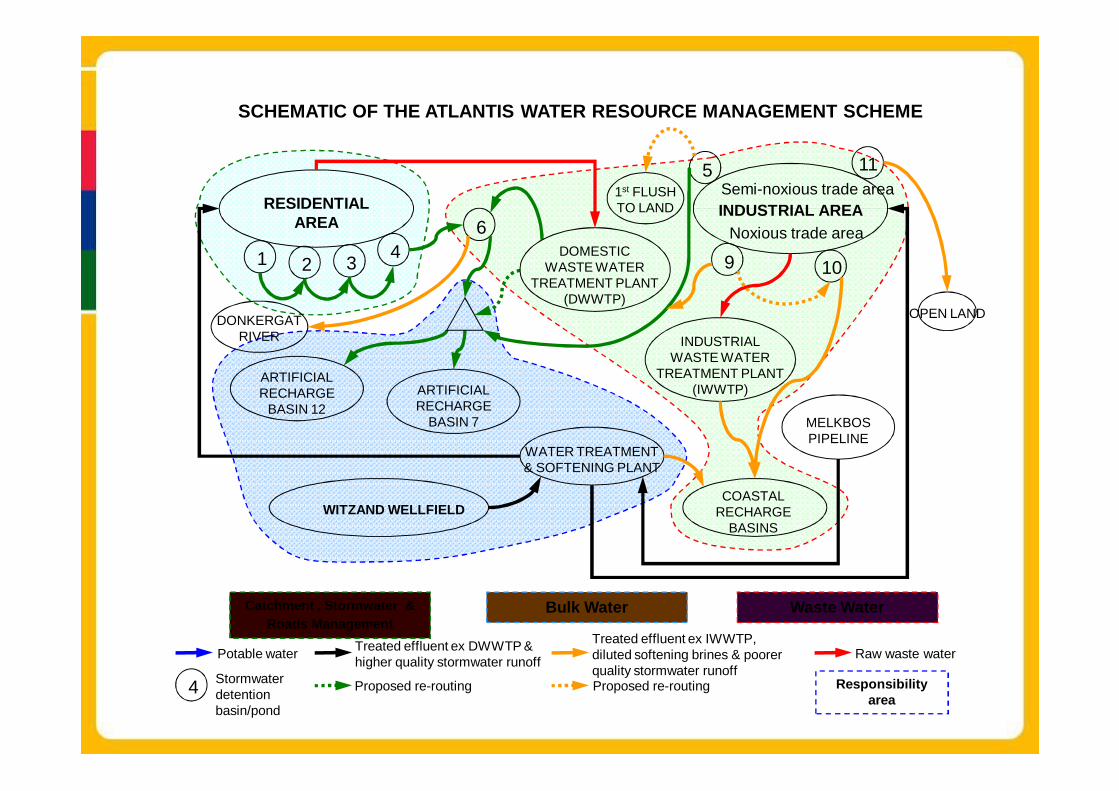
SCHEMATIC OF THE ATLANTIS WATER RESOURCE MANAGEMENT SCHEME
MELKBOSPIPELINE
OPEN LAND
Bulk Water Waste WaterCatchment , Stormwater & Roads Management
ARTIFICIALRECHARGE
BASIN 12ARTIFICIALRECHARGE
BASIN 7
WITZAND WELLFIELD
WATER TREATMENT& SOFTENING PLANT
COASTALRECHARGE
BASINS
INDUSTRIALWASTE WATER
TREATMENT PLANT(IWWTP)
DOMESTICWASTE WATER
TREATMENT PLANT(DWWTP)
Semi-noxious trade area
Noxious trade areaINDUSTRIAL AREARESIDENTIAL
AREA
1 2 3 46
5 11
9 10
Potable water Treated effluent ex DWWTP & higher quality stormwater runoff
Treated effluent ex IWWTP,diluted softening brines & poorer quality stormwater runoff
Raw waste water
Proposed re-routing Proposed re-routing
1st FLUSHTO LAND
4 Stormwaterdetention basin/pond
Responsibility area
DONKERGATRIVER

COMPARISON OF QUALITY OF THE TWO WASTEWATER EFFLUENTS (1)
PARAMETER UNITS DOMESTIC INDUSTRIALCHEM. OXYGEN DEMAND as O
mg/l 40 63
AMMONIA as N mg/l 0.5 1.6NITRATE as N mg/l 9.5 10.9CONDUCTIVITY mS/m 81 197CHLORIDE as Cl mg/l 126 431SODIUM as Na mg/l 104 339POTASSIUM as K mg/l 17 19ortho PHOSPHATE as P
mg/l 6.8 5.2

COMPARISON OF QUALITY OF THE TWO WASTEWATER EFFLUENTS (2)
PARAMETER UNITS DOMESTIC INDUSTRIAL
BORON as B µg/l 90 360
CADMIUM as Cd µg/l 0.9 0.9
CHROMIUM as Cr µg/l 1.9 6.5
COPPER as Cu µg/l 9.8 63
IRON as Fe µg/l 60 206
ZINC as Zn µg/l 31 109
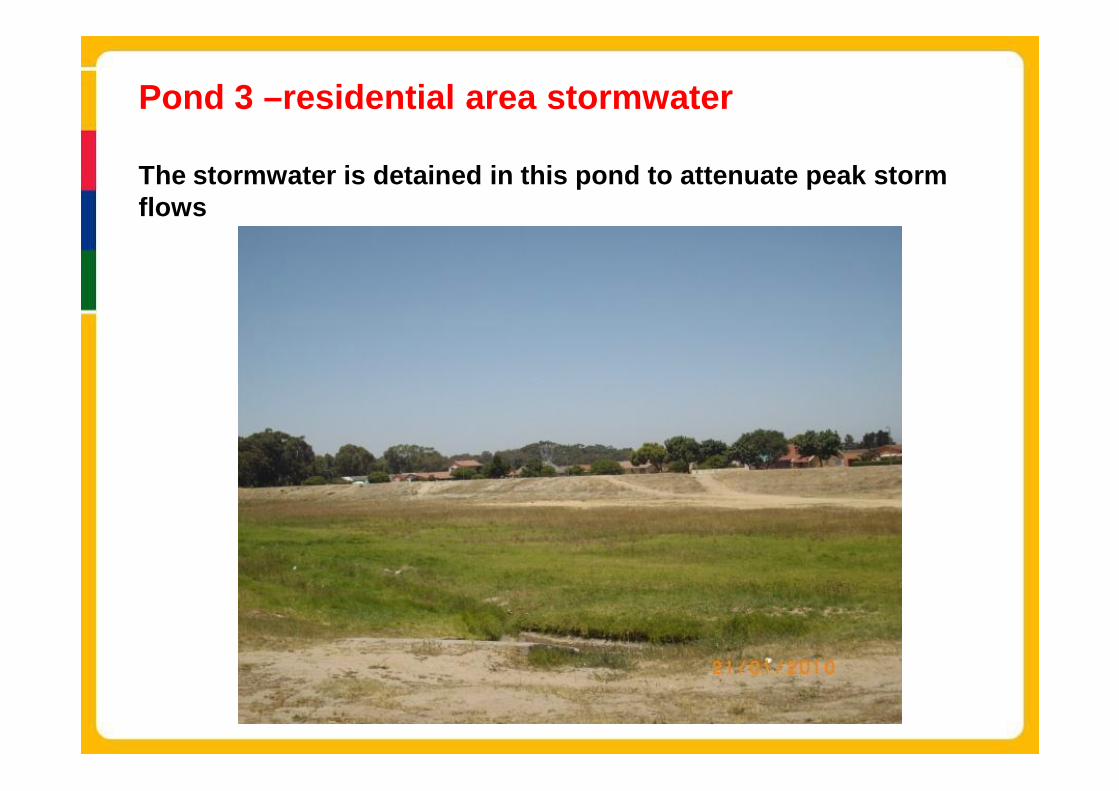
Pond 3 –residential area stormwater
The stormwater is detained in this pond to attenuate peak storm flows

Pond 6 – combined SW +WWTE
This is the reception pond for all the stormwater from the residential area and the domestic wastewater treated effluent. The integral reed-bed attenuates the stormwater quality and traps debris. Periodic cleaning is carried out

Pond 9 – industrial area stormwater
This receives polluted runoff and has an oil barrier at the inlet for periodic cleaning and pollution minimisation

Flow splitter box – into recharge ponds
This device has two outgoing pipes to direct the flow into the recharge ponds to 7 (underflow weir – low flow) and 12 (overflow weir – storm flow).
P12 P7

Pond 7 - combined recharge SW + WWTE
This receives the base flow stormwater and first flush during rainfall. Water quality is generally saline with bacteria count higher than wastewater treated effluent
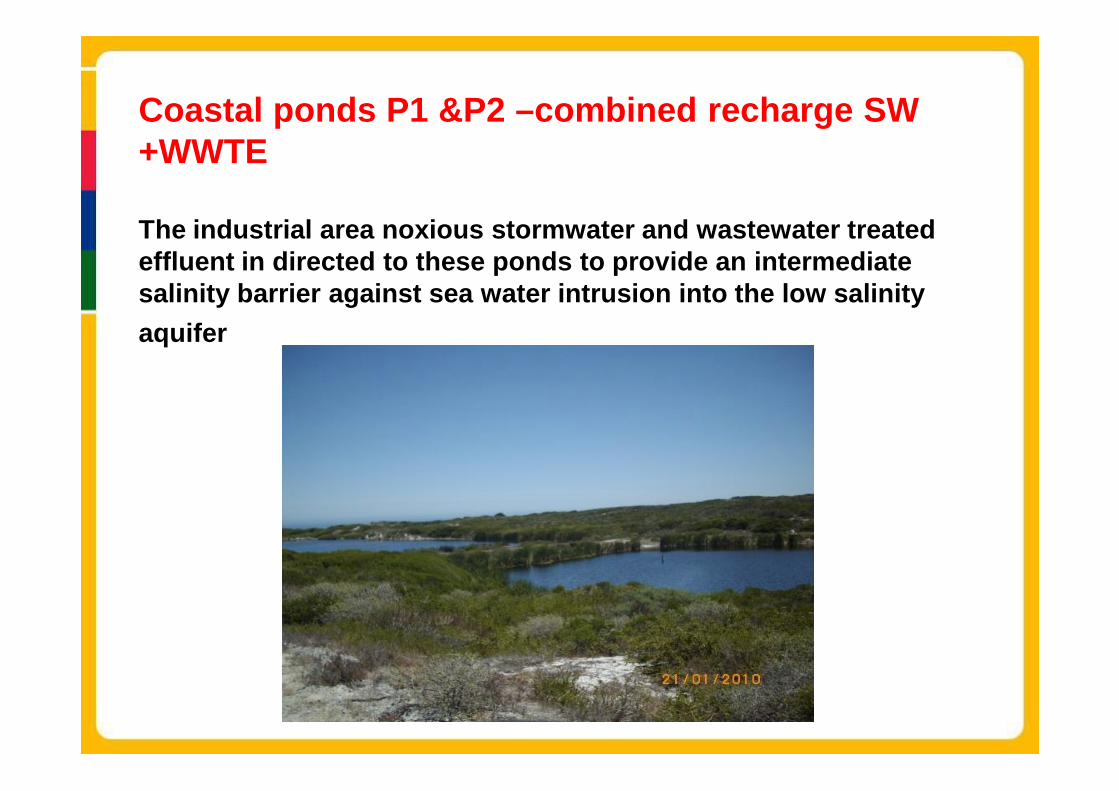
Coastal ponds P1 &P2 –combined recharge SW +WWTE
The industrial area noxious stormwater and wastewater treated effluent in directed to these ponds to provide an intermediate salinity barrier against sea water intrusion into the low salinity aquifer

Groundwater Protection Initiatives currently in place
• Regulatory monitoring required for waste sites for operational and closed facilities. So far about 37 sites identified, but not all are being monitored
• Limited GW monitoring associated with some watercourses and waterbodies – City of CT has a small database (MONIS) for catchment management
• Atlantis aquifer monitoring since 1975• TMG hydrocensus, baseline, near-field & far-field protocol and
database under development• DWAF monitors sites and receives data from site licensees

Atlantis Aquifer protection zonesThe zones are based on the surface and basement topography as well as the likely travel time for pollutants to reach the wellfields

Groundwater Future Requirements• Develop a comprehensive and integrated monitoring protocol
and network for Cape Town• Commit to permanent operating funding for GW protection
measures• Employ in-service expertise to manage monitoring and
interpretation – must be coupled to training• Use information to educate the citizens and post to website and
develop GW map• Adopt “Water Sensitive Urban Design” approach• Adopt “ Managed Artificial Recharge” principles• Promote registration of all boreholes and responsible use of
public resource• Promote registration of drillers & best practice

Groundwater Challenges and Hurdles
• Public suspicion of Government regulating landowner’s “own free water”
• Inadvertent or careless pollution of superficial aquifer difficult to control – informal housing , garden fertilisers, informal industries
• Lack of resources to control and monitor – reliant on public cooperation and awareness
• Poverty, squalor and lack of basic services together with rapid urbanisation
• Acquiring and focusing adequate funding for GW protection

CSRM Service
1 200km rivers and streams 300ha wetlands200km lined canals5 000km pipes and culverts300 detention ponds100 000 catchpits
Management of urban drainage catchments in respect of hydrological
functioning for drainage, flood control, ecological
and social purposes
Catchments ,Stormwater & Rivers Management Service, TRS Directorate

Atlantis – evidence of iron clogging
Pump and motor covered in iron bacterial slime –causes impaired cooling
Pump inside clogged & capacity badly reduced
Red water due to iron bacterial clogging of the screen sloughing when pumped at a higher rate
Source: C Less, More Water CC

Specific Capacity = Drawdown per unit flowSC = Sw/Q
Clogged condition
After rehabilitation

Reasons for yield deterioration
Sand or silt passing from aquifer through the screen into the well &pumpSilt or clay infiltration migration reducing the pore spaces near to the wellWater level decline, increased oxidation of the aquifer , screen exposureArtificial recharge imbalance, level rise, geochemical changesScreen, gravel pack and near aquifer clogging “!”Pump deterioration, corrosion , erosion , poor selectionWell collapse, casing failure , screen failureChemical encrustation, precipitationBiofouling and clogging, bio-films, slimes and mineral deposits “!”Corrosion, corrosive groundwater, hot water reactivity, unsuitable materials, galvanic action of dissimilar metals, stray electrical currents **, Inadequate borehole construction and engineering “!”Geological changes, structural collapse, tectonic movements and stress relief **
Generally found to apply to production boreholes. Source USACE & others
** Does not apply at Atlantis. “!” Significant problem at Atlantis

Rehabilitation techniquesChemical methodsBlended Chemical Heat Treatment (ARCC patent)Liquid CO2 injection (Aquafreed patent)Sequestration (Vyredox, air sparging)Chemical soaking – polyphosphate detergents, surfactants, acids (HCl, Sulphamic, Citric), alkali (NaOH)Disinfectants and biocides (Chlorine gas, HTH )Physical methodsSwabbing, brushing and scraping casing and screenJetting to clear the screen and penetrate the gravel packSurge block positive displacement pumpingSurge bumping and backwashingCompressed airlift pumping or injecting into the screen & formationUltrasonic shock jettingHydro-fracturingExplosive fracturing and dislodgingAssessment methodStep drawdown testVideo camera loggingWater quality monitoring
Note:The selection of the rehabilitation methods, chemical and physical, must be carefully approached after investigation of the problem, the borehole construction and hydrogeology.