the association between attending a grammar school and ... · the association between attending a...
TRANSCRIPT
1
The association between attending a grammar school and children’s socio-emotional outcomes.
New evidence from the Millennium Cohort Study.
John Jerrim
Sam Sims
UCL Institute of Education and Education Datalab
May 2018
Academic selection of 11-year-old children into different secondary schools remains a
prominent part of the education system within certain parts of the United Kingdom. A small
number of studies have investigated how gaining access to the academically selective grammar
school ‘track’ is associated with young people’s subsequent educational achievement. Yet less
attention has been paid to the impact grammar schools may have upon a wider range of
outcomes, such as young people’s self-confidence, academic self-esteem and aspirations for
the future. We address this gap in the literature by considering the relationship between
attending a grammar school and a wide range of outcomes, including young people’s attitudes,
behaviours and socio-emotional skills. Applying a propensity score matching approach to rich
longitudinal data, we find that gaining access to a grammar school has very little impact upon
young people’s lives. This holds true across both England and Northern Ireland, and for a range of different socio-emotional outcomes.
Key Words: Grammar schools, socio-emotional outcomes.
Contact details: John Jerrim ([email protected]) Department of Social Science, UCL Institute
of Education, University College London, 20 Bedford Way London, WC1H 0AL
Acknowledgements: The Nuffield Foundation is an endowed charitable trust that aims to
improve social well-being in the widest sense. It funds research and innovation in education
and social policy and also works to build capacity in education, science and social science
research. The Nuffield Foundation has funded this project, but the views expressed are those
of the authors and not necessarily those of the Foundation. More information is availab le
at www.nuffieldfoundation.org

2
1. Introduction
A large number of countries, particularly within Europe, have an academically selective
schooling system. At a relatively young age, sometimes at just 10 or 11 years old, children are
placed into different types of secondary school based upon their measured academic potential.
These children may then go on to have quite different experiences of secondary school and
outcomes in later life. For instance, while those in the more academically focused tracks are
typically being prepared for life at university, others are often encouraged to take a more
vocational path (Chmielewski 2014). Academic selection therefore has the potential to have a
dramatic effect upon a person’s life course.
England is a somewhat unusual example of a country where academic selection still partially
exists. Despite laws enacted more than 50 years ago to end the practise of separating children
into different secondary schools based upon their academic ability, a number of selective
‘grammar schools’ continue to exist within certain parts of the country. Indeed, nine percent of
secondary pupils in England attend school in what can be considered an academically-select ive
education area, with around five percent of secondary school pupils currently enrolled in a
grammar school nationwide (Department for Education 2017). Likewise, the use of between-
school academic selection remains the norm in some other parts of the United Kingdom – most
notably Northern Ireland.
The impact grammar schools have upon young people’s outcomes has recently received a lot
of attention, due to increased policy interest in this area. Specifically, throughout 2016 and
2017 there was much discussion in England about repealing the current legislative ban upon
the opening of new selective grammar schools (The Guardian 2016). Although such
discussions have become more muted at present, and the ban upon new grammar schools
opening remains in place, the Conservative government are introducing other ways to allow
selective education in England to expand. For instance, at the time of writing, they have made
an additional £50 million of funding available allowing existing grammar schools to expand
(Department for Education 2018). Consequently, one way or another, the number of grammar
school places in England seems destined to soon increase.
It is therefore unsurprising that the academic literature on the impact of grammar schools in
England has had something of a renaissance (Cribb et al 2013; Burgess et al, 2014; Allen and
Bartley 2017; Burgess et al 2017). One particular strand has considered whether children who
attend grammar schools have superior educational and later lifetime outcomes than their peers
3
who attend a non-grammar state school. The general thrust of this literature is that gaining entry
into a grammar school has non-trivial benefits for young people’s educational and labour
market outcomes. For instance, Clark and Del Bono (2014) found that grammar school
attendance had a significant impact upon the amount of education completed for a cohort of
children from Aberdeen in the 1960s. They also detected significant effects upon earnings and
fertility, but only for women. Likewise, Sullivan and Heath (2002) found grammar school
pupils achieved superior educational outcomes relative to their comprehensive school peers,
after a range of pupil characteristics had been controlled for. Andrews et al (2016) also found
that pupils who attend a grammar school do better than similar pupils in comprehens ive
schools, although the effect diminishes as the area becomes more selective.
We contribute to this relatively small literature by investigating the ‘impact’ gaining entry into
grammar school has upon children’s social and emotional skills, including school engagement,
academic well-being, peer relationships, self-esteem, aspirations for the future and mental
health. There are several reasons why one might anticipate attendance at a grammar school
might influence such outcomes. First, grammar and non-grammar school pupils are likely to
have rather different school peers. Previous work has illustrated how such peer effects can
influence children’s socio-economic competencies, such as the ‘big five’ personality traits
(Comi, Origo and Pagani 2017). Second, relatedly, young people are likely to use their school
peers as a reference point, and thus judge their own ability against individuals within the same
school. Research from both psychology (e.g. Marsh and Parker 1984) and economics (Murphy
and Weinhardt 2016) into ‘Big Fish Little Pond’ effects therefore suggests that grammar school
pupils may actually develop lower levels of academic self-concept and self-efficacy, as their
main reference point will be their high-achieving peers. Third, alternatively, it is possible that
failure to get into grammar school has a long-term scarring effect upon young people’s self-
confidence, well-being and self-esteem. Specifically, they may internalise a feeling of failure
from not gaining entry into an academically-selective school, which continues to affect them
even a long time after such selection has taken place. Finally, grammar and non-grammar
schools may have quite different environments, with bullying, peer-pressure, discipline and the
provision of career advice and guidance likely to vary. This may, in turn, influence factors such
as young people’s expectations for the future and their mental health. Together, the
combination of the factors above provide clear reasons to believe that gaining entry into a
grammar school may have an impact upon young people’s socio-emotional competencies, in
addition to academic skills. We present the first contemporary evidence on this issue for two
4
parts of the UK – England and Northern Ireland – allowing us to consider whether the effect
of grammar schools is similar across these different national settings.
To trail our key results, we find little evidence that attending a grammar school has a positive
effect upon young people’s socio-emotional outcomes at age 14. This holds true in both
England and Northern Ireland, for a wide variety of measures (behavioural, socio-emotiona l,
academic, aspirations) and is robust to the extensive sensitivity analyses we have conducted.
We hence challenge the conventional wisdom that gaining access to a grammar schools is really
the make or break turning point for children that it is often made out to be.
The paper now proceeds as follows. Section 2 provides a brief overview of the grammar school
system in England and Northern Ireland. Section 3 outlines the Millennium Cohort Study
(MCS) dataset, with our propensity score matching approach discussed in section 4. Results
are then presented in section 5, with conclusions and potential directions for future research
following in section 6.
2. The grammar schooling system in England and Northern Ireland
Academic selection in the United Kingdom refers to the grammar school system. At the start
of their final year of primary school, at age 10 or 11, families have the option of entering their
child for the grammar school entrance test. This is known as the 11-plus test in England and
the ‘transfer test’ in Northern Ireland. These tests typically assess children’s ability in three
subjects (English, mathematics and reasoning skills) with a sufficiently high score required for
the child to be allowed access to a grammar school. Those children who do not pass, or whose
parents choose to not enter them for this test, do not have access to this academically selective
track. Children who enter grammar school then typically remain in this track throughout
secondary education (from ages 11 to 16); movement to and from a grammar to a non-grammar
school is rare. By international standards, this form of academic selection is early (the average
age of selection amongst OECD countries is 14) and binding in the sense that there is little
opportunity to move into the grammar school track once in secondary school (OECD 2013).
This system of between-school academic selection is the norm across the whole of Northern
Ireland. In England, however, the situation is more complex. Although the grammar school
system was in place across the whole of England until the mid-1960s, the government then
issued a directive encouraging local education authorities to move to a non-selective,
comprehensive school system. Academic selection was quickly disbanded across large parts of
the country, with only around 200 grammar schools remaining, educating around five percent
5
of England’s pupils by the end of the 1970s (Andrews et al, 2016). Although opening new
grammar schools was outlawed in 1998, they were never fully abolished by the central
government. As a result, academically selective schools still remain in certain parts of the
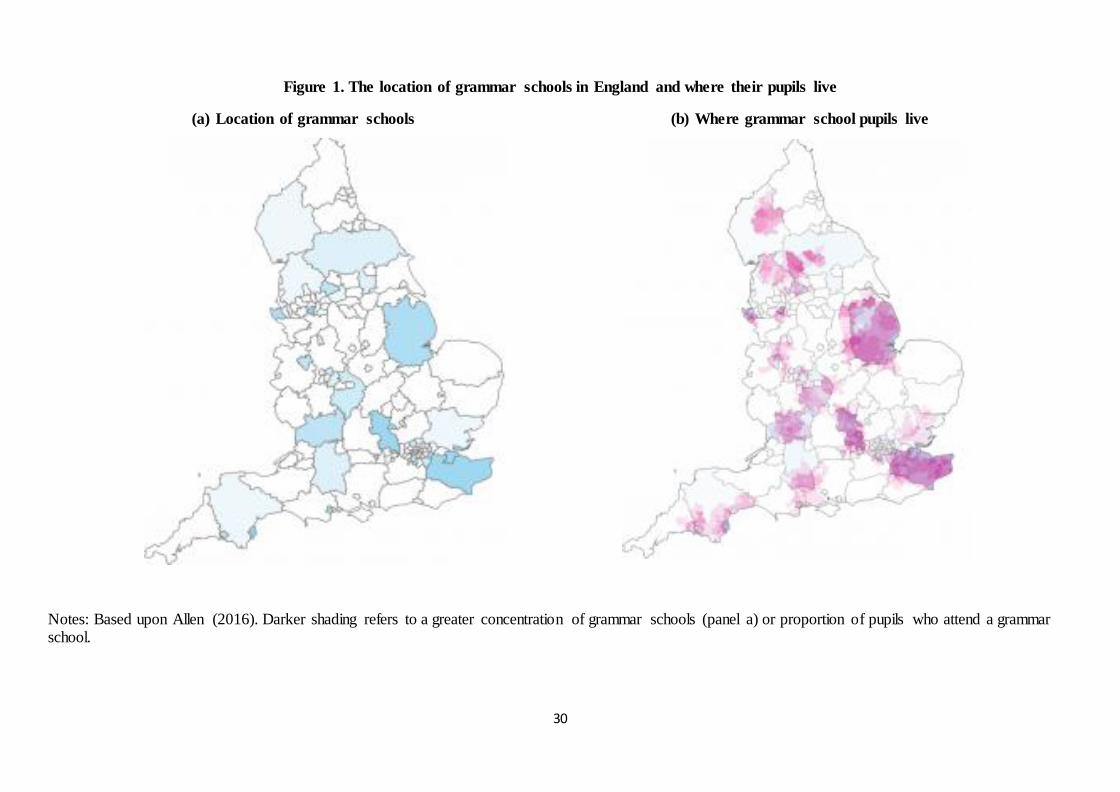
country. Specifically, there are ten Local Education Authorities (LEAs) in England where a
fully academically selective schooling system remains1. Moreover, a number of ‘isolated’
grammar schools still exist in other parts of England (i.e. single grammar schools within a
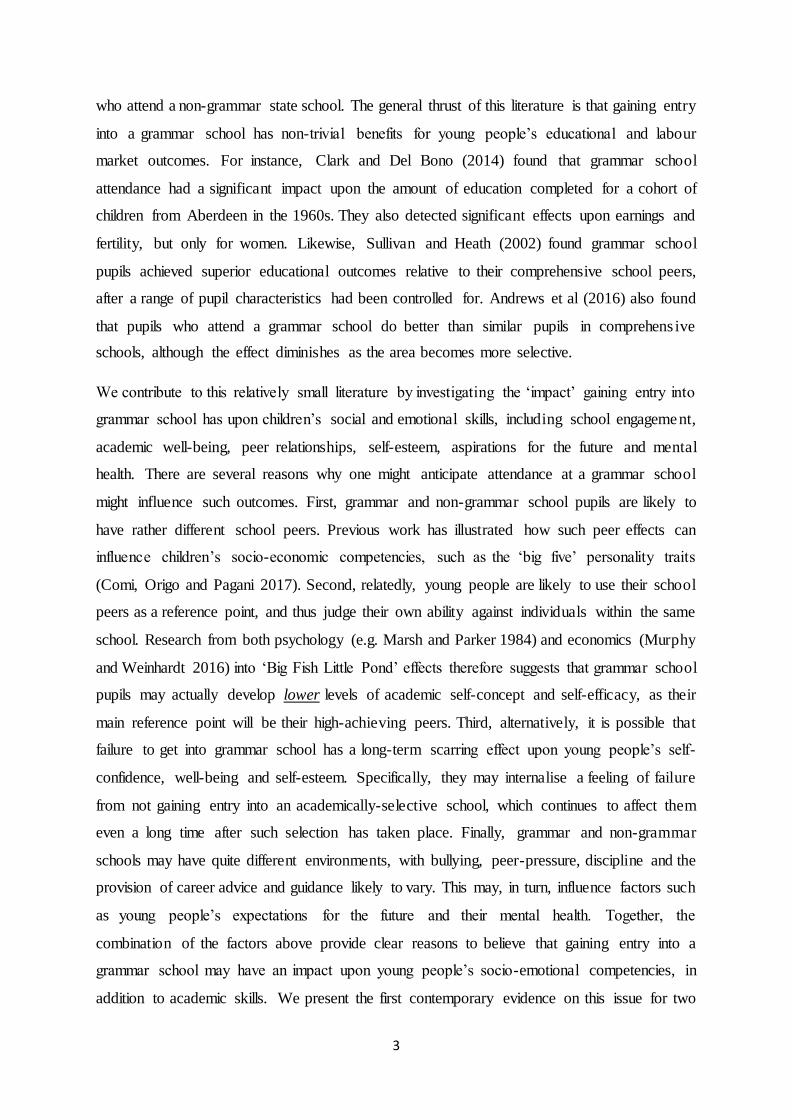
largely comprehensive area, with no other selective schools around). Figure 1 illustrates how
England’s 163 remaining grammar schools are distributed across the country (left-hand panel)
along with the home location of the children who attend (right-hand panel). Darker shading
indicates to more intense concentration of academic selection.
<< Figure 1 >>
The above has some important implications for our aim of comparing outcomes between
grammar and non-grammar school pupils; particularly with regards to differences between
England and Northern Ireland. For instance, in Northern Ireland, there is a clear counterfactua l
to not gaining access to the grammar school track; children enter the non-academic track which
caters for lower-achieving pupils. However, given the geographic spread of grammar schools
across England, attending a non-selective comprehensive school (or, indeed, paying to attend
an independent school) is a viable alternative for many of those who fail to pass the 11-plus
test. This means that our results for England and Northern Ireland should not be directly
compared; rather, they are reflecting the ‘impact’ of attending a selective school in two quite
different settings (with rather different counterfactuals). Figure 1 also highlights the importance
of performing sensitivity analyses for our results in England, including restricting the sample
to only those children who clearly live within selective education areas. The results from such
sensitivity analysis are presented in the online supplementary material (see Appendix D and
Appendix H).
3. Data
The Millennium Cohort Study (MCS) is a nationally representative longitudinal study of UK
children (https://www.cls.ioe.ac.uk/page.aspx?sitesectionid=851). A stratified, clustered
survey design was used, with geographic areas (electoral wards) selected as the primary
sampling unit, and then households with newly born children randomly selected from within
1 The 10 fully selective LEAs in England are Bexley, Buckinghamshire, Kent, Lincolnshire, Medway, Slough,
Southend-on-Sea, Torbay, Trafford and Sutton.

6
sampled electoral wards (see Plewis 2004 for further details). Six sweeps have been conducted
between 2000 and 2015, when children were 9 months, 3, 5, 7, 11 and 14 years old. Parents,
children and their teachers have been interviewed within the various sweeps. Of the 18,819
cohort members who participated at nine months (11,695 in England and 1,955 in Northern
Ireland), 11,726 remained in the study at age 14 (7,739 in England and 1,115 in Northern
Ireland). This reflects attrition rates of 34 percent (England) and 43 percent (Northern Ireland)
respectively.
Children and their parents completed the fifth wave of the MCS survey at age 11; when the
majority of pupils were in Year 6 (i.e. the year before children enter grammar school). Most of
the surveys were completed between February and July 2012, as children in England were
completing Year 6, after children would have taken the eleven-plus test (typically between
September 2011 and January 2012). Within the age 11 survey, parents of cohort members were
asked:
“Thinking about all of the schools you applied to, which of these types of schools did you apply
to?” with “Grammar school” being one of the response options.
Note that families typically only apply to grammar schools after the results of the entrance test
are known. With respect to this paper, this would imply that families would only apply to a
grammar school if their child has passed the entrance test. Consequently, parental reports of
whether they applied to a grammar school should act as a good proxy for whether their child
sat and passed this test. Therefore, throughout our analysis, we restrict the sample to only those
pupils whose families applied for them to attend a grammar school. This should, in turn, help
us to rule out potential confounding differences between grammar and non-grammar school
pupils, and aid in our estimation of the average treatment effect on the treated (ATT). In doing
so, the sample size available for analysis is restricted to 883 children in England and 733 in
Northern Ireland. Approximately 40 percent of these children then went on to attend a grammar
school in England, and 78 percent in Northern Ireland2. Appreciating that this restriction clearly
reduces the pool of observations available to match grammar school pupils to, we also present
2 Restricting the sample to applicants leads to a relatively small sample size for non -grammar school children in
the case of Northern Ireland. We have therefore produced an alternative set of estimates for Northern Ireland
where we do not make this sample restriction, and include both applicants and non-applicants within our matching
models. This leads to a much larger pool of non-grammar school pupils that we can match grammar school pupils
to. These alternative results are provided in the online supplementary material (see Appendix H). This alternative
approach does not lead to substantial changes to the conclusions reached.

7
alternative results in the online supplementary material where this sample restriction is no
longer made (see Appendix H).
Parental school preferences
When the MCS cohort were age 11, their parents were also asked a series of questions capturing
their secondary school preferences. First, they were asked:
“Which of these factors were important in choosing a secondary school?” ticking all the
following options that apply (as well as identifying the single most important factor): (a) Child
wanted to go there; (b) School is near to home; (c) His/her friends intending to go there; (d)
His/her brother/sister goes there; (e) Other relative goes there; (f) Academic reputation; (g)
Strong discipline policy; (h) good extra-curricular activities; (i) school has specialist
curriculum; (j) good facilities; (k) general good impression; (l) religious grounds.
They were then asked about the steps they took to get their child into their preferred school,
including use of extra tuition:
“Which, if any, of the steps on this card did you take in order to help improve your child’s
chance of getting into a particular secondary school?” (a) Moved home; (b) Short-term
renting; (c); Used the address of a relative or friend; (d) Got child into a particular primary
school; (e) Arranged extra tuition or coaching for child; (f) Arranged for extra curricula
activities for child; (g) Joined a church or place of worship; (h) Asked someone with influence
in the process to recommend your child; (i) Other steps.
Together this means we have access to detailed information on the factors associated with
parental school choice and the actions they have taken to try and get their children into their
preferred secondary school. This information will play a critical role in our construction of an
appropriate counterfactual within our propensity score matching models (see section 4 for
further details).
Academic achievement measures
MCS cohort members have completed a number of cognitive tests at ages 3, 5, 7 and 11.
Specifically, these tests are:
• Naming vocabulary (ages 3 and 5)
• Pattern construction (ages 5 and 7)
• Picture similarities (age 5)

8
• Word reading (age 7)
• Progress in Maths (age 7)
• Verbal similarities (age 11)
• Spatial working memory (age 11)
Together, these capture children’s abilities in English, mathematics, verbal and non-verbal
reasoning – all the areas typically assessed as part of the grammar school entrance exam (Allen,
Bartley and Nye 2017). Hence, we are able to account for the key factors which determine
entry into grammar schools, amongst the sub-set of children who apply. Moreover, by being
able to control for children’s performance on up to nine different tests, taken at four different
ages, the scope for measurement error affecting our results is limited.
Social, behavioural and emotional skills measured at age 11
As part of the age 11 survey, young people were asked a battery of questions capturing their
attitudes towards school, along with a number of modules designed to capture their social and
emotional skills. This includes the following characteristics:
• Academic self-concept. A battery of three questions capturing children’s views of how
good they are at various school subjects. Example item: “I am good at English”.
• School motivation / engagement. A series of five questions asking children about
whether they try their best at school and find the work interesting. Example question:
“How often do you try your best at school”
• Well-being. A battery of six questions capturing how positive children feel about
various aspects of their life. Example question: “How do you feel about the following
parts of your life? Your friends.
• Academic well-being. Children’s responses to two questions capturing how positive
children are about their school work and the school they go to. Example question: “How
do you feel about the following parts of your life? Your school work.
• Rosenberg self-esteem scale. Example item: ‘I am able to do things as well as most
other people.
• Strengths and Difficulties Questionnaire. A widely used scale capturing children’s
behavioural problems across five dimensions (see online supplementary materials -
Appendix A - for further details).
The online supplementary materials (Appendix A) provides the full list of questions within
each of our outcome scales. We include these scales within our matching models as they could
potentially be associated with both the probability of gaining entry into grammar schools and
children’s social and emotional outcomes at age 14. For instance, children with lower self-
esteem or academic self-concept in the final year of primary school may perform less well on
the grammar school entrance test, over and above any potential difference in their actual

9
academic abilities. Moreover, as a number of these scales also serve as our age 14 outcome
measures, accounting for ‘pre-treatment’ differences between children who gain entry into
grammar school and those who do not is potentially important.
Age 14 outcome measures
A number outcome scales children completed at age 11 were also repeated in the age 14 survey,
including the academic self-concept, well-being, academic well-being, self-esteem and SDQ
scales. Hence for these specific measures we have information available in the final year of
primary school, and again three years into secondary school. Moreover, we also have access to
additional outcome measures within the age 14 survey. We group these into the five categories
detailed below, all of which could be plausibly influenced by whether the child gains entry into
a grammar school.
Parental aspirations for their offspring and continuing educational investments
If a child fails to get into a grammar school, then their parents may adjust their expectations for
what their offspring will do in the future. For instance, as their child has failed to get into a
grammar school, they may revise their beliefs about whether they are likely to continue in
school beyond the compulsory leaving age, and whether they will go on to university. Parents
may also adjust their willingness to continue certain educational investments in their offspring,
such as paying for private tuition. We explore such possibilities through the following three
age 14 outcome variables:
• Parental post-16 expectations. Parental responses to the question ‘What would you like
your child to do when he/she is 16 years of age?’ This has been converted into a binary
variable, coded as 1 if they said continue their education, and 0 otherwise.
• Parental university expectations. Parental responses to the question: ‘How likely or
unlikely do you think it is that your child will attend university?’ This has been
converted into a binary variable, coded as 0 if they do not think their child will attend
university, and 1 if they do.
• Receiving tutoring at age 14. A binary variable based upon children’s responses to
whether they were receiving private tuition in either English or mathematics.
Young people’s expectations and aspirations for the future
Children may also alter their aspirations and expectations for the future, depending upon
whether they gain entry into a grammar school or not. For instance, the may start to believe
10
that they do not have the academic ability to gain entry at university, or to work in a
professional job. This situation could be reinforced by peer effects, with their classmates less
likely to expect to enter university, which has an impact upon their own beliefs. Likewise, they
may receive less information about university from their school teachers, or receive different
careers advice relative to their grammar school peers. We consider the impact of attending a
grammar school upon the following variables:
• Young person’s university expectations. Children’s response to the question ‘How
likely do you think it is that you will go to university?’ This was reported on a continuous
scale (ranging from 0 to 100%), which we have standardised to mean 0 and standard
deviation 1.
• Young person’s aspirations towards a professional job. Children were asked ‘When
you grow up what would you like to be?’ This has been recoded into occupationa l
categories within the MCS dataset, which we have dichotomised into a binary variable.
This takes the value of 1 if the child responded with a professional job (NS-SEC
category 2, 3.1, 3.2, 3.3 or 3.4), and 0 otherwise (including if they gave a vague response
or said that they do not know).
Young people’s attitude towards school
Young people’s attitudes towards school may be influenced by whether they attend a grammar
school. For instance, by failing to gain entry into a grammar school, young people may become
disengaged from education and put less effort into their school work. Likewise, it may lower
their self-confidence in their academic ability, and they may become less happy with their
school work (and, more generally, life at school). Alternatively, previous work on Big Fish
Little Pond effects (Marsh and Parker 1984) suggests that children may reference their own
ability against their peers, potentially implying that attending a grammar school could actually
have a negative effect upon academic self-efficacy. More generally, previous work suggesting
grammar schools have a positive effect educational achievement have been limited in terms of
exploring potential mechanisms – including the role of school engagement. We therefore
explore the association between grammar school entry and the following attitudinal variables:
• Academic self-concept. (Same scale as age 11 – see sub-section above)
• School motivation / engagement. (Same scale as age 11 – see sub-section above)
• Academic well-being. (Same scale as age 11 – see sub-section above)
• Friends behaviour in school. A scale based upon children’s response to the following
two question: ‘How many of your close friends work hard at school?’ and ‘How many
11
of your close friends get into a lot of trouble at school?’. Responses are on a four-point
scale – all of them, most of them, some of them and none of them.
• Importance of qualifications. Children’s responses to the following question on a five -
point scale: ‘How much do you agree or disagree that nowadays you need qualifications
in order to get a job worth having?’
• Truancy. A binary variable, based upon children’s responses to a question asking whether they
have missed school at any point over the last 12 months without parental permission.
Mental health, well-being and self-esteem
A now extensive literature has highlighted the importance of socio-emotional outcomes to
young people’s future success (Blanden, Gregg and Macmillan 2007) with increased policy
interest in areas such as children’s well-being and mental health (May 2017). Likewise, in
addition to educational achievement, the happiness and well-being of their offspring is
extremely important to parents when selecting a secondary school. Yet, despite the importance
of these wider outcomes, little previous research has considered whether they are influenced
by attending a grammar school. For instance, children might be more likely to be bullied if they
are a high-achiever in a non-grammar school or, alternatively, amongst the least able pupils in
a grammar school. Likewise, it may impact upon the size and composition of their friendship
groups, which may in turn impact upon their well-being, behaviour and mental health. Hence,
due to both their importance and the credible mechanisms by which they may be impacted, we
consider the relationship between grammar school attendance and the following socio-
emotional outcomes:
• Mental health scale. A scale based upon children’s response to 13 statements, all on a
three point scale (not true, sometimes, true). For example ‘I thought I could never be as
good as other kids’. See online supplementary materials (Appendix A) for further
details.
• Well-being. (Same scale as age 11 – see sub-section above)
• Rosenberg self-esteem scale. (Same scale as age 11 – see sub-section above)
• Bullying. Children’s responses on a six point scale to the two questions: ‘How often do
other children hurt you or pick on you on purpose?’ and ‘How often have other children
sent you unwanted or nasty emails, texts or messages or posted something nasty about
you on a website?’
• The Strengths and Difficulties Questionnaire (SDQ) behavioural scale. Children were
asked to respond on a three-point scale (Not True, Somewhat True or Certainly True)
to a set of 25 questions. Together, these questions capture children’s emotiona l
problems, conduct problems, hyperactivity, peer-problems and their social skills (see
online supplementary materials Appendix A for further details). When combined, they
provide a well-known and widely used aggregate measure of whether young people
have behavioural issues.
12
Young people’s academic achievement and skills
Several previous studies have suggested that attending a grammar school is positively related
with academic achievement (Sullivan and Heath 2002; Atkinson et al 2006; Andrews et al
2016). A limitation of the MCS is that it currently only has a single measure of academic skills
at age 14 – capturing pupils’ achievement on a low-stakes English test – which only took four
minutes to complete. Our analysis considers the association between grammar school entry and
the following single academic achievement variable:
• English vocabulary skills. This captured children’s ability to understand the meaning
of words by choosing a word meaning the same or nearly the same from a list of five
alternatives. Twenty words were included in the task and these got more difficult as the
task progressed.
4. Methodology
We use propensity score matching (PSM) to estimate the impact of gaining entry into a
grammar school upon children’s outcomes. This method essentially matches each grammar
school pupil to an equivalent non-grammar school pupil, who is similar in terms of a number
of observable characteristics. The outcomes of ‘treatment’ (grammar) and ‘control’ (matched
non-grammar) pupils are then compared to estimate the impact of attending grammar schools
upon young people’s lives.
When implementing this methodology, we first restrict the MCS sample to only those children
whose families applied for them to attend a grammar school. This leaves a pre-matching sample
of 883 children in England and 733 children in Northern Ireland. Nearest neighbour matching
is then used, with a tight restriction set on the caliper to 0.005, to create the matched control
group. Within the PSM model, we include a wide range of variables described in the previous
section, including all parent and child responses up to the fifth MCS survey sweep (answered
at age 11 – when children are in the final year of primary school). This includes numerous
academic and cognitive achievement tests3, parental school preferences, family background,
strategies parents have used to get their child into their preferred school (including private
tuition) and a selection of children’s social, emotional and behavioural outcomes (e.g.
engagement in school, SDQ scores). A full list of the variables included in our matching models
3 Together these cover mathematics, English and non-verbal reasoning skills; all the areas covered in the 11-plus
entrance examination.
13
can be found in Table 1 (England) and Table 2 (Northern Ireland). Formally, the logist ic
regression model underlying the PSM matching is specified as:
𝑙𝑜𝑔 (𝜋(𝐺)
1− 𝜋(𝐺)) = 𝛼 + 𝛽1. 𝐷 + 𝛽2. 𝐴7 + 𝛽3. 𝑆7 + 𝛽4. 𝐴11 + 𝛽5. 𝑆11 + 𝛽6. 𝑃 + 𝛽7. 𝑇
Where:
𝜋(𝐺) = The probability of attending a grammar school (G = 1 grammar; G = 0 non-grammar)
D = A vector of demographic characteristics such as gender and parental income
𝐴7= Measures of children’s academic achievement up to age 7
𝑆 7 = Children’s socio-emotional measures at age 7
𝐴11 = Measures of children’s academic achievement up to age 11
𝑆 11 = Children’s socio-emotional measures at age 11
P = Parental school preferences measured at age 11
T = Whether the child received tutoring at age 11
Multiple imputation by chained equations has been used to take into account of missing
covariate data. These models are estimated separately for England and Northern Ireland. This
means that grammar school children in England can only be matched to non-grammar school
children in England (and likewise for Northern Ireland). The notes to Figure 2, along with the
online supplementary materials (Appendix B and C), provides details about the number of
children who are dropped due to not having a suitable match (e.g. treatment pupils for whom
no control pupil with an estimated propensity score within 0.005 could be found) or because
their propensity score was outside of the region of common support. The online supplementary
materials (Appendix B and C) also show the final sample size for our different analyses, which
are typically around 650 observations in England and 500 observations in Northern Ireland.
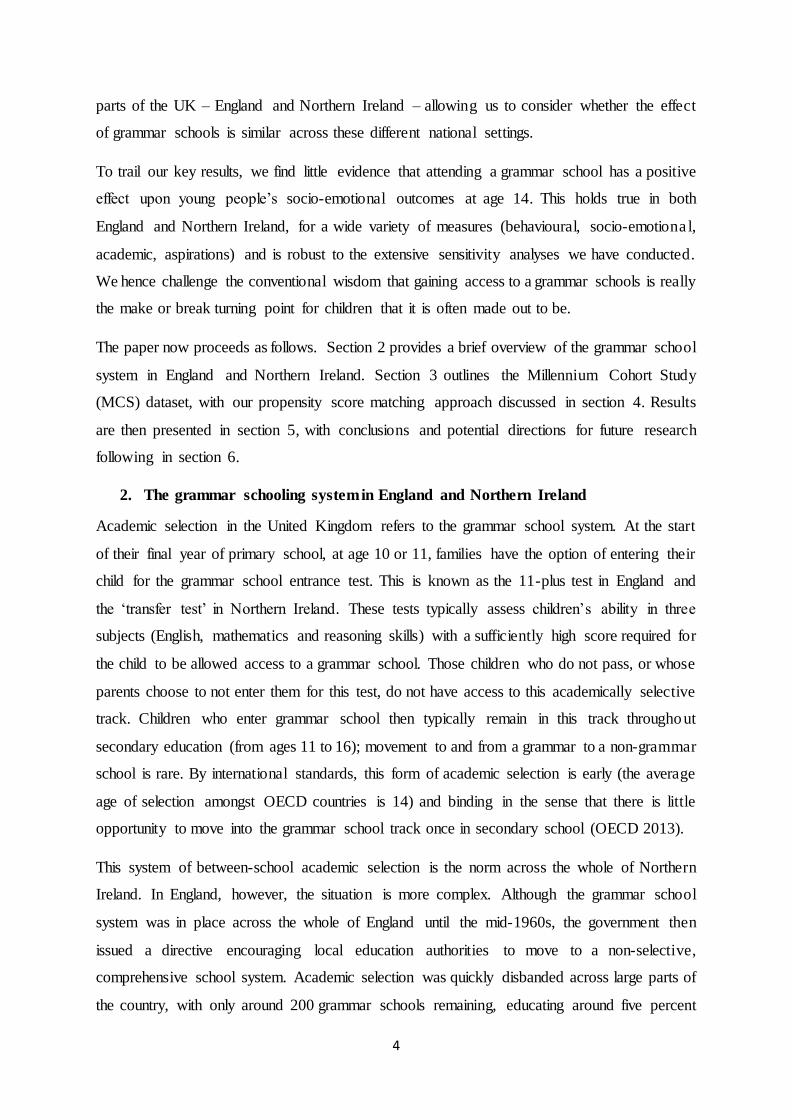
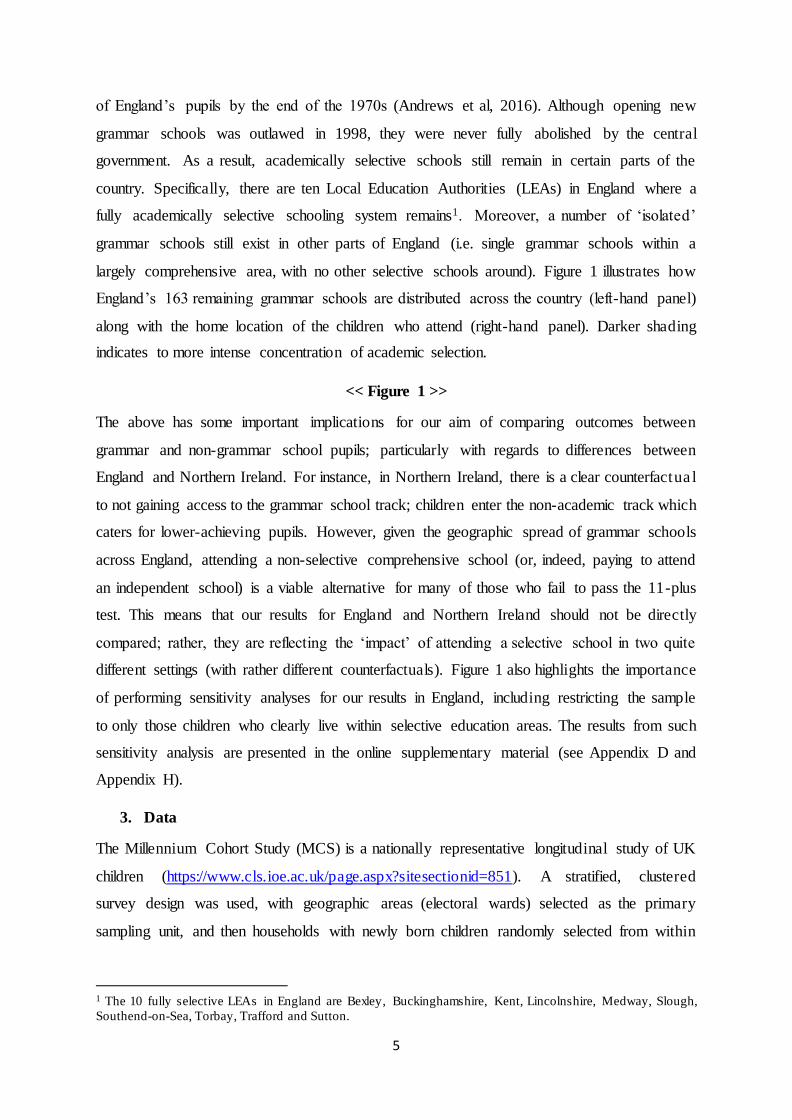
<< Figure 2 >>
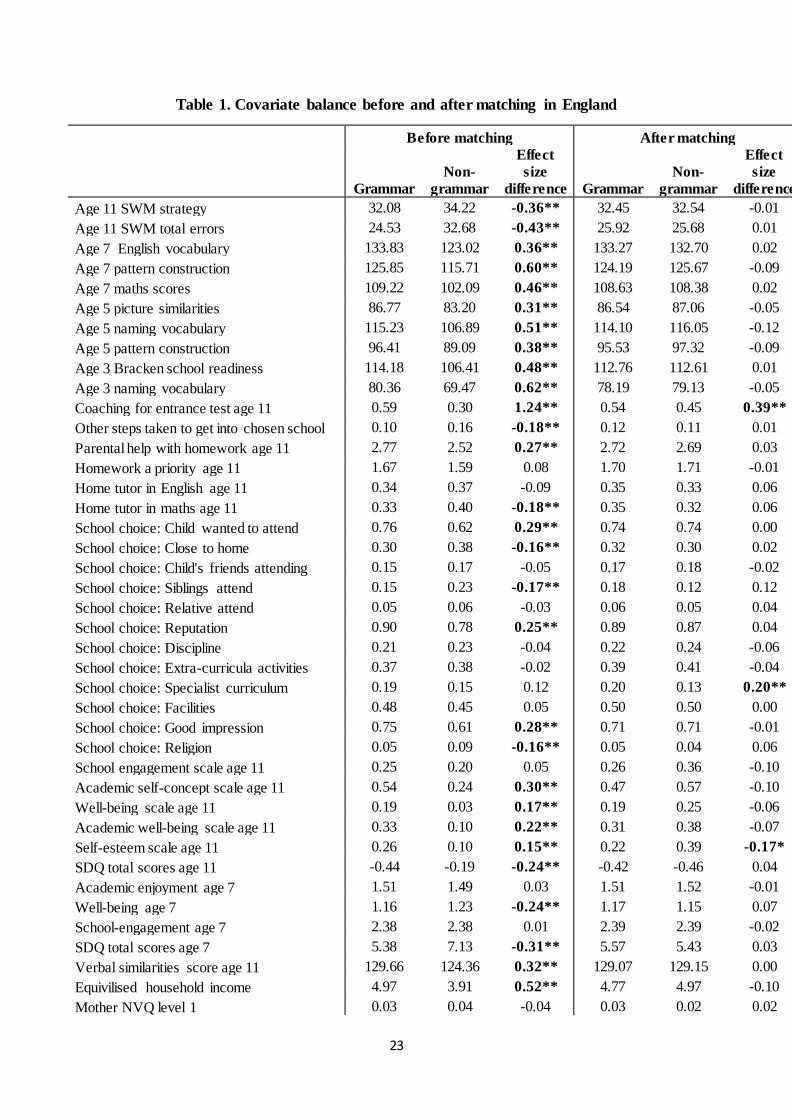
It is standard in the PSM literature to present ‘balance tests’, comparing the characteristics of
the two groups, after the matching has taken place. These are presented in Tables 1 (England)
and 2 (Northern Ireland) below. As anticipated, before matching has taken place, grammar
school pupils are rather different to their non-grammar school peers. Specifically, they tend to
have higher levels of prior academic achievement, come from more advantaged socio-

14
economic backgrounds and have stronger socio-emotional skills. However, after matching
upon the propensity score, the two groups are much more comparable, particularly in the case
of England. For instance, as evidenced by the small and statistically insignificant effect size
differences, the matched samples are very similar in terms of prior academic ability scores,
parental school preferences and socio-economic background. Indeed, across the 50 variables
considered, the only occasions where the two groups notably differ post-matching are self-
esteem at age 11 (slight advantage for non-grammar pupils), whether the child’s parents wanted
them to go to a school with a specialist curriculum and whether the children received coaching
for the entrance test (slight advantage for the grammar school groups). Notably, the two groups
appear well-matched across a wide range of cognitive ability measures taken before entry into
secondary school and across a range of socio-emotional outcomes measured at age 11.
Consequently, our interpretation of Table 1 is that the matching process for England appears
to have ‘balanced’ the grammar and non-grammar school groups reasonably well.
<< Table 1 >>
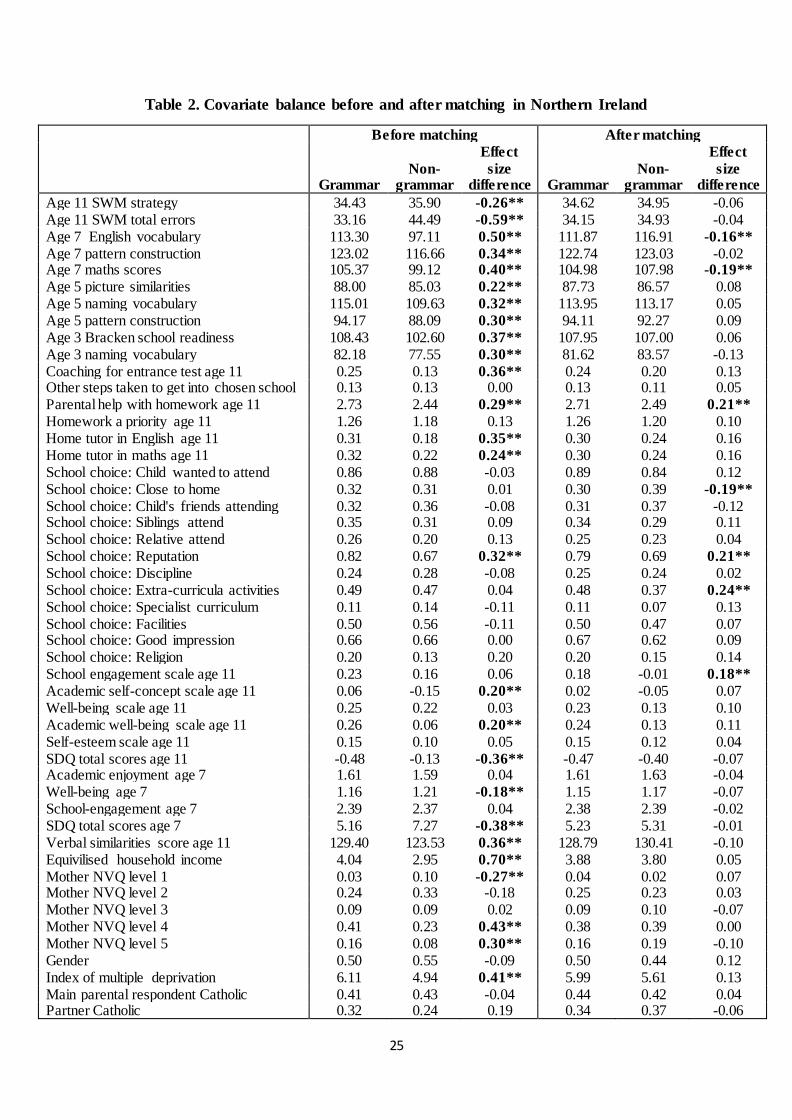
Although matching has undoubtedly improved the comparability of the grammar and non-
grammar groups within the Northern Irish data, it is nevertheless clear that some differences
do remain. For instance, after matching, the grammar school group continue to have higher
levels of school engagement, parents who tend to help their children more with their homework
and who placed more importance upon reputation when choosing a secondary school than their
non-grammar school peers. On the other hand, the two groups are now reasonably well-
balanced in terms of prior academic achievement results, with there actually being some small
advantages on some of these to the non-grammar school group (e.g. age 7 maths and English
scores). Together, our interpretation of Table 2 is that the matching process has worked
satisfactorily in Northern Ireland, in that the two groups now appear reasonably similar across
most of the key baseline characteristics. However, we note that some caution is required when
interpreting our results using the Northern Irish data, given that some non-trivial differences
between grammar and non-grammar school pupils remain.
<< Table 2 >>
The following section presents our results, where we compare age 14 outcomes between
grammar school pupils and their matched controls. All continuous measures (e.g. WORD
vocabulary scores, SDQ scores) have been standardised to mean 0 and standard deviation 1.
The direction of each scale has also been changed, so that higher values refer to ‘better’
15
outcomes. All estimates for continuous variables are therefore effect sizes. Results for binary
outcomes are, on the other hand, presented in terms of proportional differences4.
We have conducted a number of sensitivity analyses to investigate the robustness of our
findings. In the following section, we present results when our matching models only include
achievement controls up to age 7, rather than age 11. (The intuition being that, although all the
age 11 measures are captured before children have entered secondary school, some may be
potentially endogenous)5. We also illustrate how our estimates vary according to the
specification of the matching model, such as altering the length of the caliper (resulting in
greater or fewer observations being removed from the sample due to there being no sufficient ly
close match available) and the number of neighbours selected. Additionally, the online
supplementary materials (Appendix D) investigates whether our estimates for England change
once we restrict the sample to only those pupils living within selective-education areas.
Likewise, online supplementary materials (Appendix E) explores the extent to which our
conclusions change in England after removing pupils who failed to get into grammar school,
but instead attended a fee-paying school, at age 14. An alternative statistical methodology
(difference- in-differences) has been applied to a sub-set of outcomes in Appendix F as a check
to whether this leads to similar results. The results from these various sensitivity analyses are
summarised in the following section. Finally, as our main estimates use multiple imputation to
handle missing covariate data, alternative results are also presented for which we implement a
‘complete case’ analysis. See the online supplementary materials Appendix G.
To conclude, we remind readers that all our estimates only capture causal effects if the
(untestable) ‘selection-upon-observables’ assumption is met. This requires that when we are
predicting the propensity (score) of an individual gaining a place at grammar school, we include
as covariates in this model all the variables which are relevant to determining treatment
assignment and this outcome. We argue that the extensive range of factors we are able to
include in our PSM models, including nine measures of prior achievement, parental investment
including private tuition, aspiration and attitudes toward education, and rich family background
measures, means that such an assumption is more credible here than in most situations. Yet we
4 For instance, a value of 0.05 for a binary measure would indicate that grammar school pupils are five percentage
points more likely to experience the outcome in question than their matched non -grammar peers. 5 For example, children and their families will already know whether they will be going to a grammar school by
the time they sit their Key Stage 2 tests. If going to a grammar school has ‘anticipatory effects’ (e.g. parents
deciding to continue investing in private tuition if their child gains en try to grammar school, but end it if they do
not) then Key Stage 2 test scores may be potentially endogenous.

16
still cannot completely rule out the possibility that important factors which predict both
grammar school entry and children’s age 14 outcomes remain.
5. Results
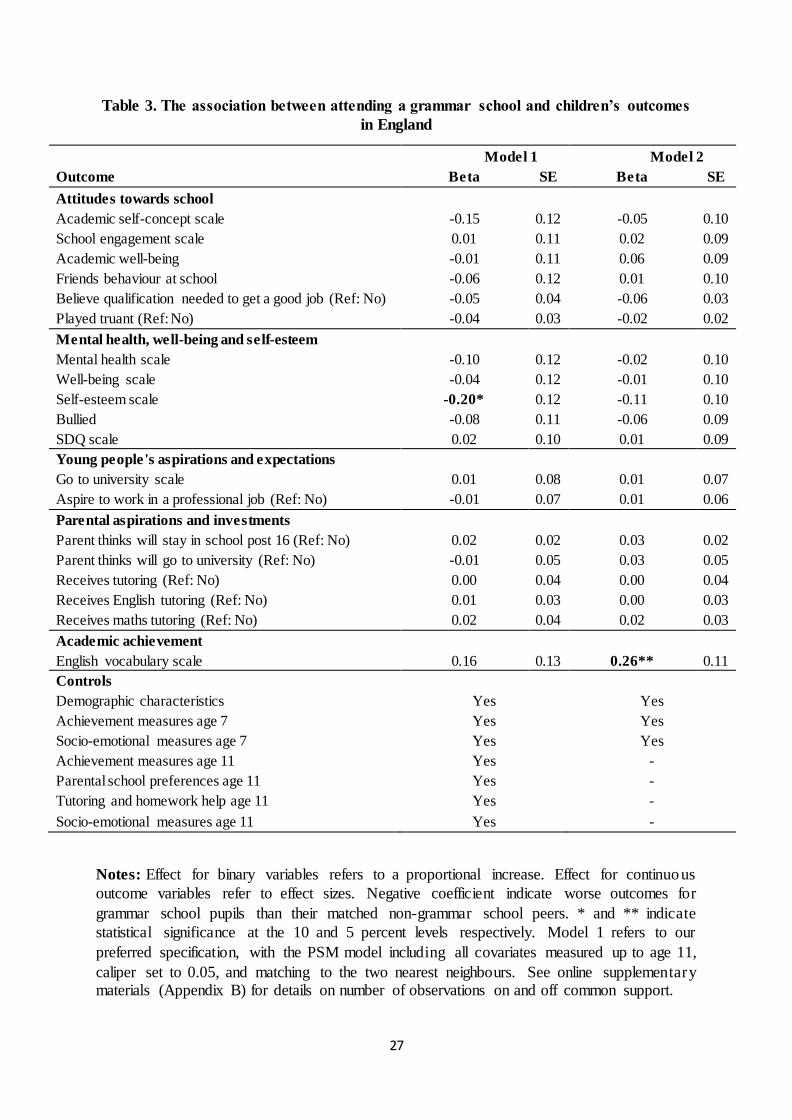
Table 3 presents the results for England. Our discussion of this table focuses upon our preferred
specification (model 1), which controls for a wide range of measures up to age 11. It highlights
a clear and consistent message; across a wide range of outcomes there is little positive benefit
of gaining entry into a grammar school. The vast majority of estimates are small in terms of
magnitude, and do not reach statistical significance at conventional levels. For instance, there
is no evidence that grammar school children are more engaged in their school work (effect size
0.01), are more likely to expect to go to university (effect size 0.01) or have superior English
vocabulary skills (effect size 0.16) than the matched comparison group. Similar results hold
for aspirations towards a professional job (-1 percentage point), academic self-concept (effect
size -0.15) and SDQ scores (effect size 0.02). Indeed, the only outcome with a sizeable effect
is teenagers’ self-esteem, though this actually seems worse for grammar school pupils. Thus,
against common perception, Table 3 therefore suggests that gaining access to a grammar school
may not be as life-changing as many perhaps expect.
<< Table 3 >>
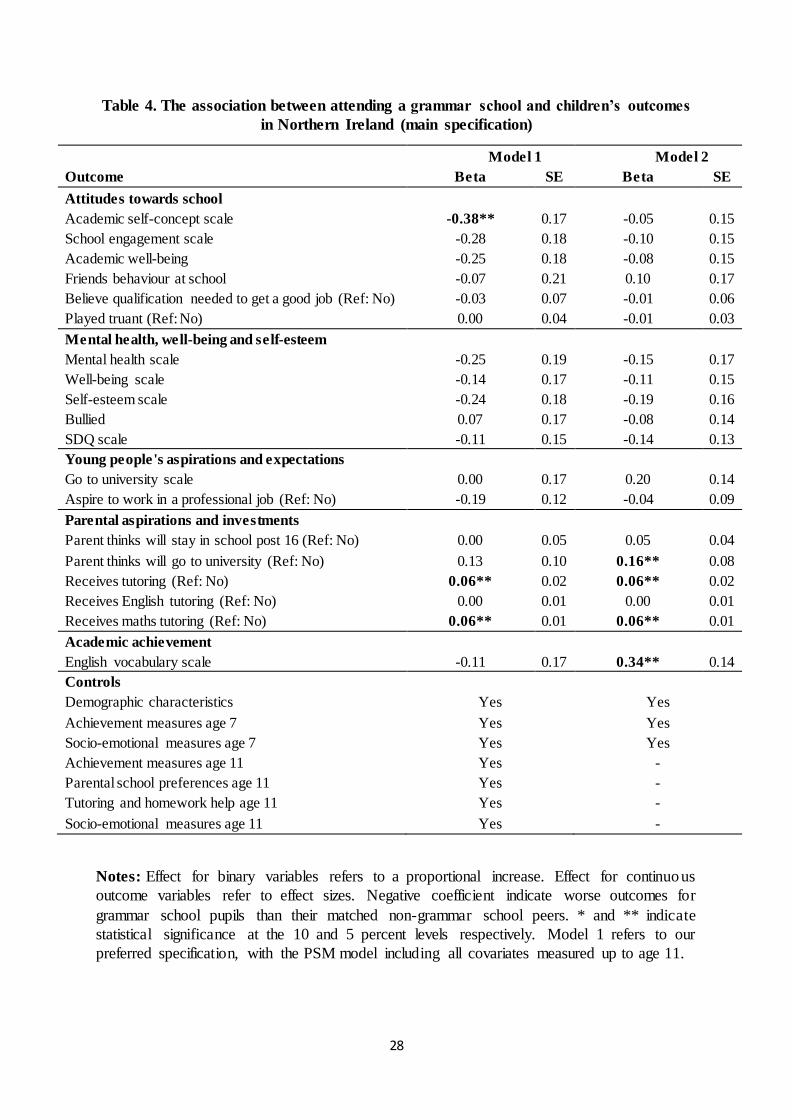
Analogous results for Northern Ireland can be found in Table 4. Again, most of the coefficients
are close to zero, indicating that there is little difference between the two groups. Academic
self-concept (i.e. children’s responses to questions such as ‘I am good at maths’) is a notable
exception, with grammar school pupils having worse outcomes than their matched peers (effect
size = -0.38). This could be due to big-fish little-pond effects (Marsh and Parker 1984), with
young people referencing their own ability against their school peers. On the other hand,
Northern Irish parents are six percentage points more likely to continue to pay for their child
to have private tuition (particularly in mathematics) than their matched comparators. Hence
there is some suggestion that parents are somewhat more likely to continue to pay for
educational investments for their offspring if they attend a grammar school. Yet the above
should not distract from the central message of Table 4; similar to the results for England,
attending a grammar school does not seem to offer substantial advantages to those young
people who gain entry (at least in the short run).
<< Table 4 >>
17
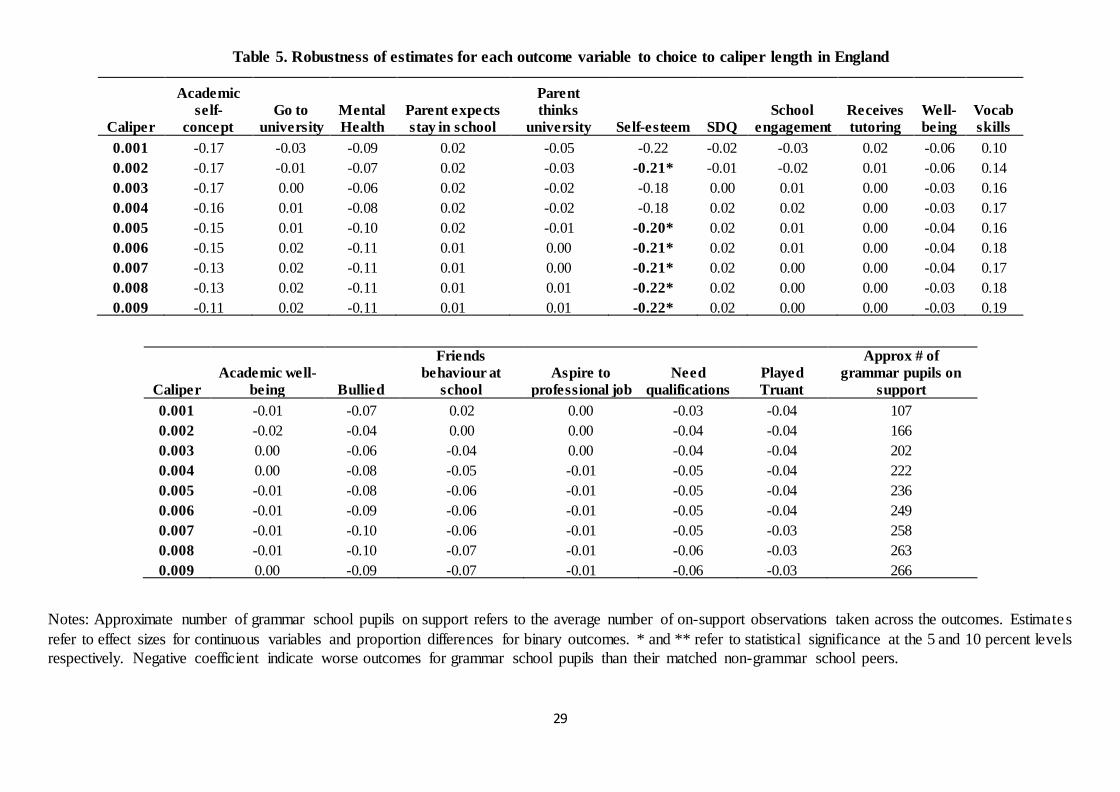
The robustness of these results have been tested in several ways. First, we have varied the
length of the caliper from 0.001 to 0.009, which subsequently varies the number of grammar
school pupils for whom a comparable match can be found. These alternative results in the case
of England can be found in Table 5 (see the online supplementary materials, Appendix I, for
the equivalent results for Northern Ireland). For England, almost all estimates for all outcomes
remain small in terms of magnitude, and are not statistically significant. The only exception is
the Rosenberg self-esteem scale, where there continues to be a small negative effect of
attending a grammar school. Similar results hold for Northern Ireland, where substantia l
positive effects of attending a grammar school are few and far between (with the exception of
grammar school parents being more likely to continue to pay for private tutoring for their
offspring). The results presented in Table 5 therefore provides support for our key substantive
conclusion – for a wide array of outcomes, the advantage of gaining entry into a grammar
school is minimal. This continues to hold true in further robustness tests we have conducted
with the specification of the matching model, such as varying the number of neighbours that
grammar school pupils have been matched to.
<< Table 5 >>
All estimates presented thus far have used multiple imputation to handle item non-response to
the covariate data. The online supplementary materials (Appendix H) therefore considers
whether our findings change when implementing a complete-case analysis. Overall, there is
minimal change to our results in either country. Effect sizes are persistently small in terms of
their magnitude, and rarely reach statistical significance at conventional thresholds. The finding
that grammar schools actually have little positive impact upon a wide array of young people’s
outcomes therefore seems robust to potential challenges with missing covariate data.
Similar results hold for the other sensitivity analyses we have conducted (see the online
supplementary materials for further details). When removing those children who go on to
attend a private secondary school from the sample, we continue to find only very few
statistically significant effects across our outcomes, and the majority of these favour attending
non-grammar pupils (see online supplementary materials Appendix E)6. After restricting the
sample in England to selective education areas only, most point estimates are reasonably
similar, though with notably larger standard errors (see online supplementary materia ls
6 The point estimate for the age 14 vocabulary test was slightly larger (effect size of 0.24), but not statistically
significant in our preferred model specification.

18
Appendix D). For a sub-set of outcomes, where there are repeated measures over multiple time
points, we have implemented a difference statistical approach (difference- in-differences),
which conditions out a subset of unobservable variables which might bias our results. These
results confirm our key findings, with attending a grammar school having no impact upon
young people’s English skills, well-being or behavioural outcomes (see online supplementary
materials Appendix F for further details).
6. Conclusions
Although often characterised as having a ‘comprehensive’ secondary schooling system, in parts
of the United Kingdom the education system remains highly selective. In Northern Ireland and
certain parts of England, children are segregated into different schools at age 11 based upon
their performance on a high-stakes test, which many believe to be a critical determinant of
young people’s future lives. But how much of an advantage does gaining entry into an
academically-selective grammar school really bring? Although a number of previous studies
have considered this issue (Sullivan and Heath 2002; Andrews et al 2016), their focus has been
upon a rather narrow range of outcomes. Little consideration has thus far been paid to the
impact upon wider aspects of young people’s lives that are of great importance to children and
parents when they are choosing a secondary school. Moreover, most contemporary research
into the impact of modern day grammar schools has been conducted using nationa l
administrative data, which are limited in terms of the amount of variables which can be
controlled to account for self-selection into grammar schools. For instance, most recent
research using the national pupil database has been unable to account for differences between
grammar and non-grammar pupils in terms of parental school preferences, application
decisions and the measures they have taken to get their child into their chosen school (private
tuition being an obvious example). Selection bias hence remains a significant challenge in most
research into the impact of modern day grammar schools.
We attempt to overcome these issues within this paper. Specifically, rather than focusing upon
a narrow range of academic achievement measures alone, we explore the association between
grammar school attendance and a wide range of children’s outcomes, including their attitudes
towards schools, aspirations and expectations for the future, as well as their socio-emotiona l
skills , along with a key academic competency (e.g. English vocabulary skills). Moreover, by
using the rich data available within the Millennium Cohort Study (MCS), including detailed
information on parental school preferences and multiple measures of children’s achievement,
our results are likely to be less susceptible to issues surrounding selection bias than most other

19
recent studies in this line of research. Together, we believe that this adds new and important
detail to the on-going debates about the merits of grammar schools, and the pros and cons of
academically-selective education systems more generally.
Against the conventional wisdom, we find little evidence that gaining entry into a grammar
school has a positive impact upon most aspects of young people’s lives. For instance, three
years into their time at secondary school, grammar pupils seem to have similar levels of
engagement and self-confidence in school, aspirations and expectations for the future, and
socio-emotional outcomes as their matched (non-grammar) peers. This holds true across two
rather different settings (England and Northern Ireland), with quite different counterfactua ls,
and is robust to the wide array of sensitivity analyses we have conducted. This leads us to an
important conclusion: gaining entry into a grammar school may actually not be as important as
many assume.
Why do our results differ from the general thrust of the grammar schools literature, which has
typically identified a positive effect upon young people’s outcomes? One possibility is
methodological differences, with our estimates based upon the MCS (a sample survey) while
other recent work has used the National Pupil Database (administrative records). This could
mean we are better able to control for selection into grammar schools than other recent studies,
due to the range of observable potential confounders available in the MCS, though with more
uncertainty with respect to sampling and representivity. Yet we believe the much more likely
explanation rests in the constructs being measured. The socio-emotional competencies we
focus upon are quite different to the academic achievement measures typically studied in this
literature, with different mechanisms likely to influence such outcomes. Consequently, it is
entirely possible that grammar schools may influence young people’s academic achievement,
while having little impact upon their wider outcomes. At the time of writing, only a single,
low-stakes and potentially low-quality academic outcome measure is available (English
vocabulary based upon the age 14 WORD score), meaning we are unable to consider the
academic impact of grammar schools in more detail.
These findings do, of course, need to be considered in light of the limitations of this research.
First, despite the many important advantages of the MCS dataset, the sample size available for
our analysis is limited. However, the fact that we have produced similar results using two
separate samples (England and Northern Ireland), and with most point estimates around zero
or even negative, we do not believe it likely that an increase in statistical power would alter our
20
substantive conclusions. Second, at the time of writing, data is only available upon short- run
outcomes (measured at age 14) and for a low-stakes (and potentially low-quality) measure of
children’s academic skills. An important direction for future research is for longer- term
outcomes to also be considered, including higher-quality and higher-stakes academic measures
(e.g. GCSE grades, university entry), labour market outcomes, as well as the key socio-
emotional competencies investigated in this paper. Finally, the limited sample size availab le
for certain sub-groups (e.g. low-income pupils who attend a grammar school) means we have
been unable to explore potential heterogeneous effects. Although this is clearly an important
and policy-relevant issue, we unfortunately cannot provide a credible investigation into such
effects due to the MCS sample size.
Despite these limitations, we nevertheless believe this paper has helped to further the debate
upon the impact of grammar schools. Many parents and families place great emphasis upon
their child getting a place at a grammar school, in the belief that this will have a substantia l
impact upon their future well-being. However, our analysis has shown how many of the things
parents hold most dear (their children’s well-being, aspirations and behaviour) are largely
unaffected by going to a grammar. Consequently, getting your child into a grammar school
may not be the make or break outcome that so many believe.
References
Allen, R. 2016. Grammar schools contaminate comprehensive schooling areas. Education
Datalab Blog. Accessed 14/11/2017 from https://educationdatalab.org.uk/2016/08/grammar-
schools-contaminate-comprehensive-schooling-areas/
Allen, R., Bartley, J. and Nye, P. 2017. ‘The 11-plus is a loaded dice. Analysis of Kent 11-
plus data.’ Education Datalab research report. Accessed 04/08/2017 from
http://educationdatalab.org.uk/wp-content/uploads/2017/05/The-11-plus- is-a- loaded-dice-Report.pdf
Andrews, J., Hutchinson, J., Johnes, R. 2016. Grammar schools and social mobility. London:
Education Policy Institute.
Atkinson, A., Gregg, P. and McConnell, B., 2006. The result of 11 plus selection: An
investigation into opportunities and outcomes for pupils in selective LEAs. Centre for Market
and Public Organisation Working Paper, (06/150).
Blanden, J; Gregg, P. and Macmillan, L. 2007. ‘Accounting for intergenerational income persistence: noncognitive skills, ability and education.’ Economic Journal 117(519): C43-C60.
Burgess, S., Crawford, C., Macmillan, L. 2017. ‘Assessing the role of grammar schools in
promoting social mobility.’ DQSS Working Paper 14/09, UCL Institute of Education.
21
Burgess, S., Dickson, M. and Macmillan, L. 2014. ‘Do Selective Schooling Systems Increase
Inequality?’ DQSS Working Paper 14/09, UCL Institute of Education.
Chmielewski, A K. 2014. ‘An International Comparison of Achievement Inequality in Within- and Between-School Tracking Systems.’ American Journal of Education 120(3): 293-324.
Clark, D. and Del Bono, E. 2014. ‘The long-run effects of attending and elite school: evidence
from the UK’, ISER Working Paper No. 2014-05.
Comi, S.; Origo, F. and Pagani, L. 2017. ‘Peer effects on non-cognitive skills.’ Accessed 08/01/2018 from http://www.aiel.it/cms/cms-files/submission/all20170615160133.pdf
Cribb, J., Sibieta, L., Vignoles, A. 2013. Entry into grammar schools in England. London:
Sutton Trust.
Department for Education. 2017. ‘Schools, Pupils and Their Characteristics – Local Authority Tables. SFR 28/17.’ Accessed 21/05/2018 from
https://www.gov.uk/government/statistics/schools-pupils-and-their-characteristics-january-2017
Department for Education. 2018. ‘Drive to create more good school places for familie s.’ Accessed 21/05/2018 from https://www.gov.uk/government/news/drive-to-create-more-good-
school-places-for- families
Guardian. 2016. ‘Theresa May to end ban on new grammar schools.’ Accessed 30/10/2017 from https://www.theguardian.com/education/2016/sep/09/theresa-may-to-end-ban-on-new-
grammar-schools
Galindo-Rueda, Fernando and Anna Vignoles. 2005. ‘The heterogeneous effect of selection
in secondary schools: Understanding the changing role of ability.’ CEE Discussion Paper No. 52.
Independent. 2017 ‘Conservatives used false data to justify grammar school plans, leading
academic claims.’ Accessed 30/10/2017 from http://www.independent.co.uk/news/education/education-news/tories-grammar-schools-
theresa-may-false-data-claims-education-expert-a7763686.html
Manning, A. and Pischke, J.S. 2006. ‘Comprehensive versus Selective Schooling in England in Wales: What Do We Know?’ (No. w12176). National Bureau of Economic Research.
Marsh, H. and Parker, J. 1984. ‘Determinants of student self-concept: Is it better to be a relatively large fish in a small pond even if you don't learn to swim as well?’ Journal of
Personality and Social Psychology 47 (1): 213–231.
May, T. 2017. ‘Prime Minister unveils plans to transform mental health support.’ Accessed 31/10/2017 from https://www.gov.uk/government/news/prime-minister-unveils-plans- to-
transform-mental-health-support
Murphy, R and Weinhardt, F. 2016. ‘Top of the class. The importance of ordinal rank.’ Accessed 08/01/2018 from https://ideas.repec.org/p/ces/ceswps/_4815.html
New Statesman. 2017. ‘Graham Brady: I owe my career to grammar school’. Accessed 30/10/2017 from https://www.newstatesman.com/politics/politics/2012/08/graham-brady- i-
owe-my-career-grammar-school

22
Plewis, I. 2004. Millennium Cohort Study First Survey: Technical Report on Sampling. Accessed 16/06/2017 from
file:///C:/Users/john/Downloads/MCS1_Technical_Report_on_Sampling_June_2004%20(3).pdf
Sullivan, A. and Heath, A. 2002. ‘State and private schools in England and Wales’ Sociology Working Paper, University of Oxford, No. 2002-02.
23
Table 1. Covariate balance before and after matching in England
Before matching After matching
Grammar
Non-
grammar
Effect
size
difference Grammar
Non-
grammar
Effect
size
difference
Age 11 SWM strategy 32.08 34.22 -0.36** 32.45 32.54 -0.01
Age 11 SWM total errors 24.53 32.68 -0.43** 25.92 25.68 0.01
Age 7 English vocabulary 133.83 123.02 0.36** 133.27 132.70 0.02
Age 7 pattern construction 125.85 115.71 0.60** 124.19 125.67 -0.09
Age 7 maths scores 109.22 102.09 0.46** 108.63 108.38 0.02
Age 5 picture similarities 86.77 83.20 0.31** 86.54 87.06 -0.05
Age 5 naming vocabulary 115.23 106.89 0.51** 114.10 116.05 -0.12
Age 5 pattern construction 96.41 89.09 0.38** 95.53 97.32 -0.09
Age 3 Bracken school readiness 114.18 106.41 0.48** 112.76 112.61 0.01
Age 3 naming vocabulary 80.36 69.47 0.62** 78.19 79.13 -0.05
Coaching for entrance test age 11 0.59 0.30 1.24** 0.54 0.45 0.39**
Other steps taken to get into chosen school 0.10 0.16 -0.18** 0.12 0.11 0.01
Parental help with homework age 11 2.77 2.52 0.27** 2.72 2.69 0.03
Homework a priority age 11 1.67 1.59 0.08 1.70 1.71 -0.01
Home tutor in English age 11 0.34 0.37 -0.09 0.35 0.33 0.06
Home tutor in maths age 11 0.33 0.40 -0.18** 0.35 0.32 0.06
School choice: Child wanted to attend 0.76 0.62 0.29** 0.74 0.74 0.00
School choice: Close to home 0.30 0.38 -0.16** 0.32 0.30 0.02
School choice: Child's friends attending 0.15 0.17 -0.05 0.17 0.18 -0.02
School choice: Siblings attend 0.15 0.23 -0.17** 0.18 0.12 0.12
School choice: Relative attend 0.05 0.06 -0.03 0.06 0.05 0.04
School choice: Reputation 0.90 0.78 0.25** 0.89 0.87 0.04
School choice: Discipline 0.21 0.23 -0.04 0.22 0.24 -0.06
School choice: Extra-curricula activities 0.37 0.38 -0.02 0.39 0.41 -0.04
School choice: Specialist curriculum 0.19 0.15 0.12 0.20 0.13 0.20**
School choice: Facilities 0.48 0.45 0.05 0.50 0.50 0.00
School choice: Good impression 0.75 0.61 0.28** 0.71 0.71 -0.01
School choice: Religion 0.05 0.09 -0.16** 0.05 0.04 0.06
School engagement scale age 11 0.25 0.20 0.05 0.26 0.36 -0.10
Academic self-concept scale age 11 0.54 0.24 0.30** 0.47 0.57 -0.10
Well-being scale age 11 0.19 0.03 0.17** 0.19 0.25 -0.06
Academic well-being scale age 11 0.33 0.10 0.22** 0.31 0.38 -0.07
Self-esteem scale age 11 0.26 0.10 0.15** 0.22 0.39 -0.17*
SDQ total scores age 11 -0.44 -0.19 -0.24** -0.42 -0.46 0.04
Academic enjoyment age 7 1.51 1.49 0.03 1.51 1.52 -0.01
Well-being age 7 1.16 1.23 -0.24** 1.17 1.15 0.07
School-engagement age 7 2.38 2.38 0.01 2.39 2.39 -0.02
SDQ total scores age 7 5.38 7.13 -0.31** 5.57 5.43 0.03
Verbal similarities score age 11 129.66 124.36 0.32** 129.07 129.15 0.00
Equivilised household income 4.97 3.91 0.52** 4.77 4.97 -0.10
Mother NVQ level 1 0.03 0.04 -0.04 0.03 0.02 0.02

24
Mother NVQ level 2 0.22 0.21 0.01 0.22 0.26 -0.08
Mother NVQ level 3 0.09 0.10 -0.02 0.08 0.08 -0.01
Mother NVQ level 4 0.45 0.33 0.26** 0.43 0.39 0.10
Mother NVQ level 5 0.16 0.11 0.22** 0.18 0.19 -0.07
Gender 0.49 0.49 0.01 0.50 0.57 -0.13
Ethnicity: Mixed 0.06 0.05 0.04 0.07 0.05 0.08
Ethnicity: Indian 0.07 0.13 -0.43** 0.09 0.08 0.08
Ethnicity: Pakistani or Bangladeshi 0.05 0.14 -0.39** 0.05 0.05 0.00
Ethnicity: Black 0.02 0.09 -0.41** 0.02 0.03 -0.03
Ethnicity: Other 0.09 0.12 -0.15 0.09 0.08 0.03
Notes: Figures based upon our model preferred specification. This is using ‘model 1’, the
sample having been restricted to families who applied for their child to attend a grammar
school, the caliper set at 0.005, with the two nearest neighbours chosen. Standard deviation
used in the effect size calculation is based upon all MCS children in England. ** indicates statistical significance at the 5 percent level.
25
Table 2. Covariate balance before and after matching in Northern Ireland
Before matching After matching
Grammar Non-
grammar
Effect
size difference Grammar
Non-grammar
Effect
size difference
Age 11 SWM strategy 34.43 35.90 -0.26** 34.62 34.95 -0.06 Age 11 SWM total errors 33.16 44.49 -0.59** 34.15 34.93 -0.04 Age 7 English vocabulary 113.30 97.11 0.50** 111.87 116.91 -0.16**
Age 7 pattern construction 123.02 116.66 0.34** 122.74 123.03 -0.02 Age 7 maths scores 105.37 99.12 0.40** 104.98 107.98 -0.19**
Age 5 picture similarities 88.00 85.03 0.22** 87.73 86.57 0.08 Age 5 naming vocabulary 115.01 109.63 0.32** 113.95 113.17 0.05 Age 5 pattern construction 94.17 88.09 0.30** 94.11 92.27 0.09 Age 3 Bracken school readiness 108.43 102.60 0.37** 107.95 107.00 0.06 Age 3 naming vocabulary 82.18 77.55 0.30** 81.62 83.57 -0.13 Coaching for entrance test age 11 0.25 0.13 0.36** 0.24 0.20 0.13 Other steps taken to get into chosen school 0.13 0.13 0.00 0.13 0.11 0.05 Parental help with homework age 11 2.73 2.44 0.29** 2.71 2.49 0.21**
Homework a priority age 11 1.26 1.18 0.13 1.26 1.20 0.10 Home tutor in English age 11 0.31 0.18 0.35** 0.30 0.24 0.16 Home tutor in maths age 11 0.32 0.22 0.24** 0.30 0.24 0.16 School choice: Child wanted to attend 0.86 0.88 -0.03 0.89 0.84 0.12 School choice: Close to home 0.32 0.31 0.01 0.30 0.39 -0.19**
School choice: Child's friends attending 0.32 0.36 -0.08 0.31 0.37 -0.12 School choice: Siblings attend 0.35 0.31 0.09 0.34 0.29 0.11 School choice: Relative attend 0.26 0.20 0.13 0.25 0.23 0.04 School choice: Reputation 0.82 0.67 0.32** 0.79 0.69 0.21**
School choice: Discipline 0.24 0.28 -0.08 0.25 0.24 0.02 School choice: Extra-curricula activities 0.49 0.47 0.04 0.48 0.37 0.24**
School choice: Specialist curriculum 0.11 0.14 -0.11 0.11 0.07 0.13 School choice: Facilities 0.50 0.56 -0.11 0.50 0.47 0.07 School choice: Good impression 0.66 0.66 0.00 0.67 0.62 0.09 School choice: Religion 0.20 0.13 0.20 0.20 0.15 0.14 School engagement scale age 11 0.23 0.16 0.06 0.18 -0.01 0.18**
Academic self-concept scale age 11 0.06 -0.15 0.20** 0.02 -0.05 0.07 Well-being scale age 11 0.25 0.22 0.03 0.23 0.13 0.10 Academic well-being scale age 11 0.26 0.06 0.20** 0.24 0.13 0.11 Self-esteem scale age 11 0.15 0.10 0.05 0.15 0.12 0.04 SDQ total scores age 11 -0.48 -0.13 -0.36** -0.47 -0.40 -0.07 Academic enjoyment age 7 1.61 1.59 0.04 1.61 1.63 -0.04 Well-being age 7 1.16 1.21 -0.18** 1.15 1.17 -0.07 School-engagement age 7 2.39 2.37 0.04 2.38 2.39 -0.02 SDQ total scores age 7 5.16 7.27 -0.38** 5.23 5.31 -0.01 Verbal similarities score age 11 129.40 123.53 0.36** 128.79 130.41 -0.10 Equivilised household income 4.04 2.95 0.70** 3.88 3.80 0.05 Mother NVQ level 1 0.03 0.10 -0.27** 0.04 0.02 0.07 Mother NVQ level 2 0.24 0.33 -0.18 0.25 0.23 0.03 Mother NVQ level 3 0.09 0.09 0.02 0.09 0.10 -0.07 Mother NVQ level 4 0.41 0.23 0.43** 0.38 0.39 0.00 Mother NVQ level 5 0.16 0.08 0.30** 0.16 0.19 -0.10 Gender 0.50 0.55 -0.09 0.50 0.44 0.12 Index of multiple deprivation 6.11 4.94 0.41** 5.99 5.61 0.13 Main parental respondent Catholic 0.41 0.43 -0.04 0.44 0.42 0.04 Partner Catholic 0.32 0.24 0.19 0.34 0.37 -0.06

26
Notes: Figures based upon our model preferred specification. This is using ‘model 1’, the
sample having been restricted to families who applied for their child to attend a grammar school, the caliper set at 0.005, with the two nearest neighbours chosen.
27
Table 3. The association between attending a grammar school and children’s outcomes
in England
Model 1 Model 2
Outcome Beta SE Beta SE
Attitudes towards school
Academic self-concept scale -0.15 0.12 -0.05 0.10
School engagement scale 0.01 0.11 0.02 0.09
Academic well-being -0.01 0.11 0.06 0.09
Friends behaviour at school -0.06 0.12 0.01 0.10
Believe qualification needed to get a good job (Ref: No) -0.05 0.04 -0.06 0.03
Played truant (Ref: No) -0.04 0.03 -0.02 0.02
Mental health, well-being and self-esteem
Mental health scale -0.10 0.12 -0.02 0.10
Well-being scale -0.04 0.12 -0.01 0.10
Self-esteem scale -0.20* 0.12 -0.11 0.10
Bullied -0.08 0.11 -0.06 0.09
SDQ scale 0.02 0.10 0.01 0.09
Young people's aspirations and expectations
Go to university scale 0.01 0.08 0.01 0.07
Aspire to work in a professional job (Ref: No) -0.01 0.07 0.01 0.06
Parental aspirations and investments
Parent thinks will stay in school post 16 (Ref: No) 0.02 0.02 0.03 0.02
Parent thinks will go to university (Ref: No) -0.01 0.05 0.03 0.05
Receives tutoring (Ref: No) 0.00 0.04 0.00 0.04
Receives English tutoring (Ref: No) 0.01 0.03 0.00 0.03
Receives maths tutoring (Ref: No) 0.02 0.04 0.02 0.03
Academic achievement
English vocabulary scale 0.16 0.13 0.26** 0.11
Controls
Demographic characteristics Yes Yes
Achievement measures age 7 Yes Yes
Socio-emotional measures age 7 Yes Yes
Achievement measures age 11 Yes -
Parental school preferences age 11 Yes -
Tutoring and homework help age 11 Yes -
Socio-emotional measures age 11 Yes -
Notes: Effect for binary variables refers to a proportional increase. Effect for continuous
outcome variables refer to effect sizes. Negative coefficient indicate worse outcomes for
grammar school pupils than their matched non-grammar school peers. * and ** indicate
statistical significance at the 10 and 5 percent levels respectively. Model 1 refers to our
preferred specification, with the PSM model including all covariates measured up to age 11,
caliper set to 0.05, and matching to the two nearest neighbours. See online supplementary materials (Appendix B) for details on number of observations on and off common support.
28
Table 4. The association between attending a grammar school and children’s outcomes
in Northern Ireland (main specification)
Model 1 Model 2
Outcome Beta SE Beta SE
Attitudes towards school
Academic self-concept scale -0.38** 0.17 -0.05 0.15
School engagement scale -0.28 0.18 -0.10 0.15
Academic well-being -0.25 0.18 -0.08 0.15
Friends behaviour at school -0.07 0.21 0.10 0.17
Believe qualification needed to get a good job (Ref: No) -0.03 0.07 -0.01 0.06
Played truant (Ref: No) 0.00 0.04 -0.01 0.03
Mental health, well-being and self-esteem
Mental health scale -0.25 0.19 -0.15 0.17
Well-being scale -0.14 0.17 -0.11 0.15
Self-esteem scale -0.24 0.18 -0.19 0.16
Bullied 0.07 0.17 -0.08 0.14
SDQ scale -0.11 0.15 -0.14 0.13
Young people's aspirations and expectations
Go to university scale 0.00 0.17 0.20 0.14
Aspire to work in a professional job (Ref: No) -0.19 0.12 -0.04 0.09
Parental aspirations and investments
Parent thinks will stay in school post 16 (Ref: No) 0.00 0.05 0.05 0.04
Parent thinks will go to university (Ref: No) 0.13 0.10 0.16** 0.08
Receives tutoring (Ref: No) 0.06** 0.02 0.06** 0.02
Receives English tutoring (Ref: No) 0.00 0.01 0.00 0.01
Receives maths tutoring (Ref: No) 0.06** 0.01 0.06** 0.01
Academic achievement
English vocabulary scale -0.11 0.17 0.34** 0.14
Controls
Demographic characteristics Yes Yes
Achievement measures age 7 Yes Yes
Socio-emotional measures age 7 Yes Yes
Achievement measures age 11 Yes -
Parental school preferences age 11 Yes -
Tutoring and homework help age 11 Yes -
Socio-emotional measures age 11 Yes -
Notes: Effect for binary variables refers to a proportional increase. Effect for continuous
outcome variables refer to effect sizes. Negative coefficient indicate worse outcomes for
grammar school pupils than their matched non-grammar school peers. * and ** indicate
statistical significance at the 10 and 5 percent levels respectively. Model 1 refers to our
preferred specification, with the PSM model including all covariates measured up to age 11.
29
Table 5. Robustness of estimates for each outcome variable to choice to caliper length in England
Caliper
Academic
self-
concept
Go to
university
Mental
Health
Parent expects
stay in school
Parent
thinks
university Self-esteem SDQ
School
engagement
Receives
tutoring
Well-
being
Vocab
skills
0.001 -0.17 -0.03 -0.09 0.02 -0.05 -0.22 -0.02 -0.03 0.02 -0.06 0.10
0.002 -0.17 -0.01 -0.07 0.02 -0.03 -0.21* -0.01 -0.02 0.01 -0.06 0.14
0.003 -0.17 0.00 -0.06 0.02 -0.02 -0.18 0.00 0.01 0.00 -0.03 0.16
0.004 -0.16 0.01 -0.08 0.02 -0.02 -0.18 0.02 0.02 0.00 -0.03 0.17
0.005 -0.15 0.01 -0.10 0.02 -0.01 -0.20* 0.02 0.01 0.00 -0.04 0.16
0.006 -0.15 0.02 -0.11 0.01 0.00 -0.21* 0.02 0.01 0.00 -0.04 0.18
0.007 -0.13 0.02 -0.11 0.01 0.00 -0.21* 0.02 0.00 0.00 -0.04 0.17
0.008 -0.13 0.02 -0.11 0.01 0.01 -0.22* 0.02 0.00 0.00 -0.03 0.18
0.009 -0.11 0.02 -0.11 0.01 0.01 -0.22* 0.02 0.00 0.00 -0.03 0.19
Caliper
Academic well-
being Bullied
Friends
behaviour at
school
Aspire to
professional job
Need
qualifications
Played
Truant
Approx # of
grammar pupils on
support
0.001 -0.01 -0.07 0.02 0.00 -0.03 -0.04 107
0.002 -0.02 -0.04 0.00 0.00 -0.04 -0.04 166
0.003 0.00 -0.06 -0.04 0.00 -0.04 -0.04 202
0.004 0.00 -0.08 -0.05 -0.01 -0.05 -0.04 222
0.005 -0.01 -0.08 -0.06 -0.01 -0.05 -0.04 236
0.006 -0.01 -0.09 -0.06 -0.01 -0.05 -0.04 249
0.007 -0.01 -0.10 -0.06 -0.01 -0.05 -0.03 258
0.008 -0.01 -0.10 -0.07 -0.01 -0.06 -0.03 263
0.009 0.00 -0.09 -0.07 -0.01 -0.06 -0.03 266
Notes: Approximate number of grammar school pupils on support refers to the average number of on-support observations taken across the outcomes. Estimates
refer to effect sizes for continuous variables and proportion differences for binary outcomes. * and ** refer to statistical significance at the 5 and 10 percent levels
respectively. Negative coefficient indicate worse outcomes for grammar school pupils than their matched non-grammar school peers.
30
Figure 1. The location of grammar schools in England and where their pupils live
(a) Location of grammar schools (b) Where grammar school pupils live
Notes: Based upon Allen (2016). Darker shading refers to a greater concentration of grammar schools (panel a) or proportion of pupils who attend a grammar school.

31
Figure 2. A comparison of estimated propensity scores across treatment and control
groups (preferred specification)
(a) England
(b) Northern Ireland
Notes: Graphs based upon first multiply imputed dataset, with caliper set to 0.005 and two
nearest neighbours. Matching model includes all MCS cognitive tests taken up to age 11. See the online supplementary materials, Appendix B and Appendix C, for further details.
0 .2 .4 .6 .8 1Propensity Score
Untreated Treated: On support
Treated: Off support
0 .2 .4 .6 .8 1Propensity Score
Untreated Treated: On support
Treated: Off support
32
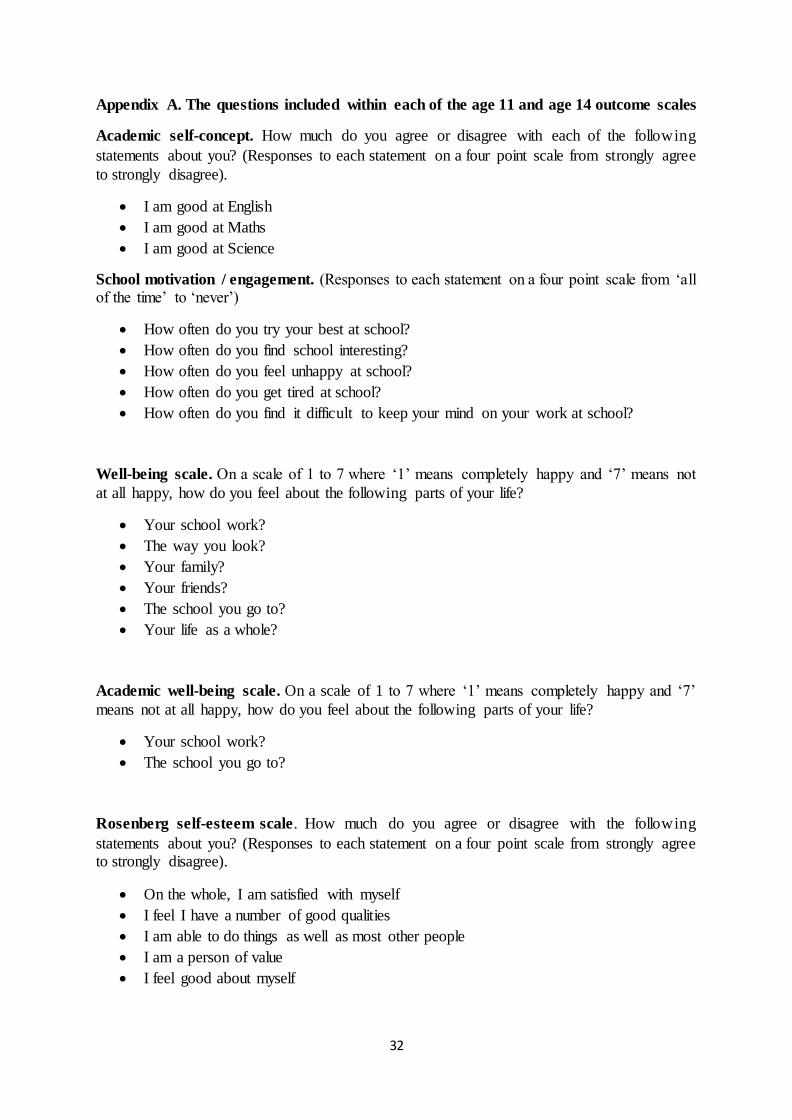
Appendix A. The questions included within each of the age 11 and age 14 outcome scales
Academic self-concept. How much do you agree or disagree with each of the following
statements about you? (Responses to each statement on a four point scale from strongly agree
to strongly disagree).
• I am good at English
• I am good at Maths
• I am good at Science
School motivation / engagement. (Responses to each statement on a four point scale from ‘all of the time’ to ‘never’)
• How often do you try your best at school?
• How often do you find school interesting?
• How often do you feel unhappy at school?
• How often do you get tired at school?
• How often do you find it difficult to keep your mind on your work at school?
Well-being scale. On a scale of 1 to 7 where ‘1’ means completely happy and ‘7’ means not
at all happy, how do you feel about the following parts of your life?
• Your school work?
• The way you look?
• Your family?
• Your friends?
• The school you go to?
• Your life as a whole?
Academic well-being scale. On a scale of 1 to 7 where ‘1’ means completely happy and ‘7’
means not at all happy, how do you feel about the following parts of your life?
• Your school work?
• The school you go to?
Rosenberg self-esteem scale. How much do you agree or disagree with the following
statements about you? (Responses to each statement on a four point scale from strongly agree to strongly disagree).
• On the whole, I am satisfied with myself
• I feel I have a number of good qualities
• I am able to do things as well as most other people
• I am a person of value
• I feel good about myself

33
Mental Health scale. The next few questions are about how you have been feeling or acting
recently. For each question please select the answer which reflects how you have been feeling
or acting in the past two weeks. (Responses to each statement on a three point scale: not true;
sometimes; true).
• I felt miserable or unhappy
• I didn’t enjoy anything at all
• I felt so tired I just sat around and did nothing
• I was very restless
• I felt I was no good any more
• I cried a lot
• I found it hard to think properly or concentrate
• I hated myself
• I was a bad person
• I felt lonely
• I thought nobody really loved me
• I thought I could never be as good as other kids
• I did everything wrong
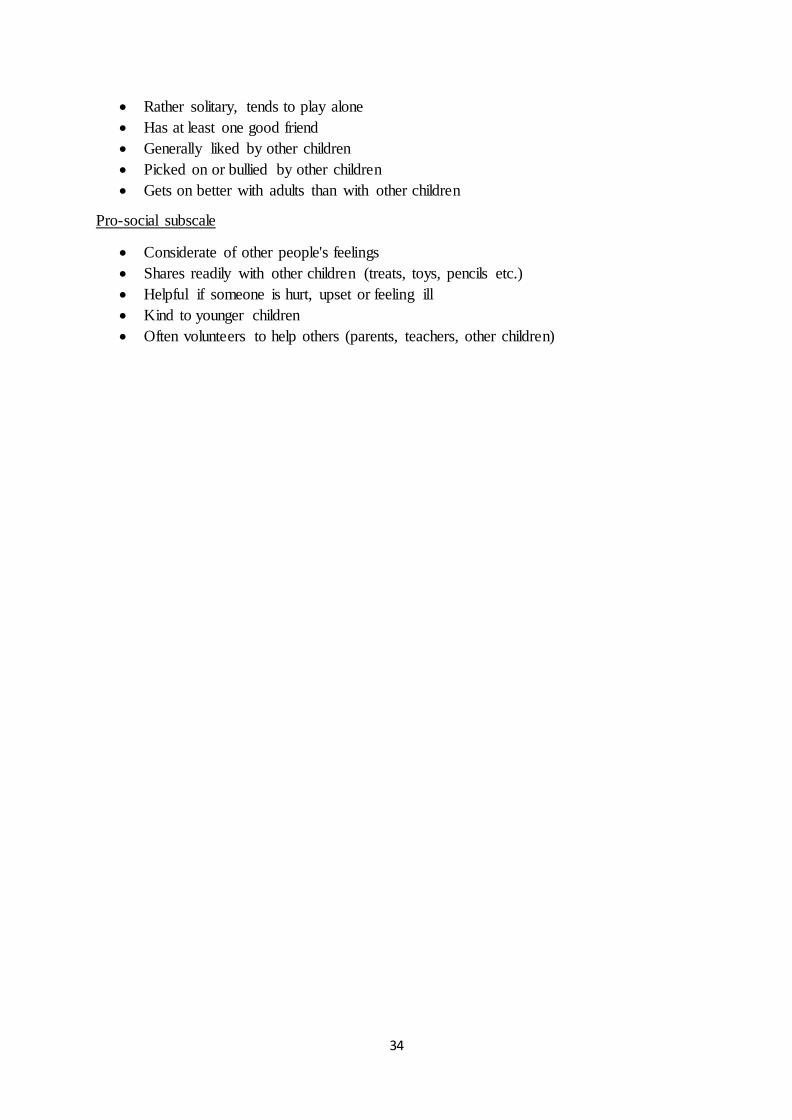
Strengths and Difficulties questionnaire . For each item, please mark the box for Not True,
Somewhat True or Certainly True. Please give your answers on the basis of the child's behaviour over the last six months or this school year.
Emotional problems subscale
• Often complains of headaches, stomach-aches or sickness
• Many worries, often seems worried
• Often unhappy, down-hearted or tearful
• Nervous or clingy in new situations, easily loses confidence
• Many fears, easily scared
Conduct problems subscale
• Often has temper tantrums or hot tempers
• Generally obedient, usually does what adults request
• Often fights with other children or bullies them
• Often lies or cheats
• Steals from home, school or elsewhere
Hyper-activity subscale
• Restless, overactive, cannot stay still for long
• Constantly fidgeting or squirming
• Easily distracted, concentration wanders
• Thinks things out before acting
• Sees tasks through to the end, good attention span
Peer-problems subscale
34
• Rather solitary, tends to play alone
• Has at least one good friend
• Generally liked by other children
• Picked on or bullied by other children
• Gets on better with adults than with other children
Pro-social subscale
• Considerate of other people's feelings
• Shares readily with other children (treats, toys, pencils etc.)
• Helpful if someone is hurt, upset or feeling ill
• Kind to younger children
• Often volunteers to help others (parents, teachers, other children)

35
Appendix B. Number of observations in the estimation models in England
(a) Model 1
Outcome variable
All
observations
On
support
Off
support
Non-
grammar Grammar
Academic self-concept 752 676 76 436 240 Go to university scale 738 672 66 430 242 Mental health scale 752 676 76 436 240 Parent thinks will stay in school post 16 761 701 60 441 260 Parent thinks will go to university 761 701 60 441 260 Self-esteem scale 752 676 76 436 240 SDQ scale 746 690 56 431 259 School engagement scale 752 676 76 436 240 Receives tutoring 721 655 66 422 233 Receives English tutoring 721 655 66 422 233 Receives maths tutoring 721 655 66 422 233 Wellbeing scale 752 676 76 436 240 English vocabulary scale 718 650 68 414 236 Academic wellbeing scale 752 676 76 436 240 Bullying scale 752 676 76 436 240 Friends behaviour at school scale 656 578 78 375 203 Aspire to work in a professional job 574 505 69 344 161 Believe qualification needed to get a good job 752 676 76 436 240 Played truant 752 676 76 436 240
(b) Model 2
Outcome variable
All
observations
On
support
Off
support
Non-
grammar Grammar
Academic self-concept 752 732 20 436 296 Go to university scale 738 721 17 430 291 Mental health scale 752 732 20 436 296 Parent thinks will stay in school post 16 761 733 28 441 292 Parent thinks will go to university 761 733 28 441 292 Self-esteem scale 752 732 20 436 296 SDQ scale 746 736 10 431 305 School engagement scale 752 732 20 436 296 Receives tutoring 721 701 20 422 279 Receives English tutoring 721 701 20 422 279 Receives maths tutoring 721 701 20 422 279 Wellbeing scale 752 732 20 436 296 English vocabulary scale 718 701 17 414 287 Academic wellbeing scale 752 732 20 436 296 Bullying scale 752 732 20 436 296 Friends behaviour at school scale 656 644 12 375 269 Aspire to work in a professional job 574 563 11 344 219 Believe qualification needed to get a good job 752 732 20 436 296 Played truant 752 732 20 436 296
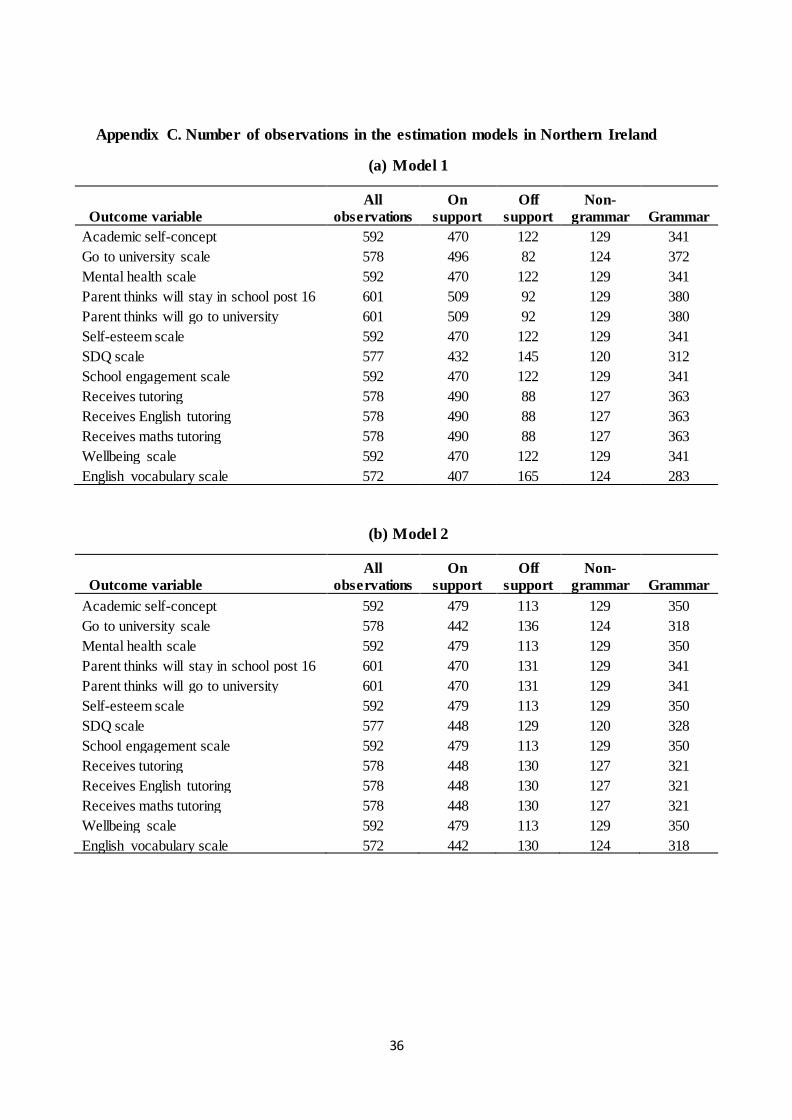
36
Appendix C. Number of observations in the estimation models in Northern Ireland
(a) Model 1
Outcome variable
All
observations
On
support
Off
support
Non-
grammar Grammar
Academic self-concept 592 470 122 129 341
Go to university scale 578 496 82 124 372
Mental health scale 592 470 122 129 341
Parent thinks will stay in school post 16 601 509 92 129 380
Parent thinks will go to university 601 509 92 129 380
Self-esteem scale 592 470 122 129 341
SDQ scale 577 432 145 120 312
School engagement scale 592 470 122 129 341
Receives tutoring 578 490 88 127 363
Receives English tutoring 578 490 88 127 363
Receives maths tutoring 578 490 88 127 363
Wellbeing scale 592 470 122 129 341
English vocabulary scale 572 407 165 124 283
(b) Model 2
Outcome variable
All
observations
On
support
Off
support
Non-
grammar Grammar
Academic self-concept 592 479 113 129 350
Go to university scale 578 442 136 124 318
Mental health scale 592 479 113 129 350
Parent thinks will stay in school post 16 601 470 131 129 341
Parent thinks will go to university 601 470 131 129 341
Self-esteem scale 592 479 113 129 350
SDQ scale 577 448 129 120 328
School engagement scale 592 479 113 129 350
Receives tutoring 578 448 130 127 321
Receives English tutoring 578 448 130 127 321
Receives maths tutoring 578 448 130 127 321
Wellbeing scale 592 479 113 129 350
English vocabulary scale 572 442 130 124 318

37
Appendix D. Alternative results for England. Sample further restricted to only those
pupils who live within a selective education area.
In this appendix we restrict the MCS data for England to only those pupils who lived in a
‘selection education area’ in the fifth wave (i.e. at age 11). We define a selective education area
as living in one of the ten local education authorities in England where academic selection is
still permissible (these are Bexley, Buckinghamshire, Kent, Lincolnshire, Medway, Slough,
Southend-on-Sea, Torbay, Trafford and Sutton), plus any child who lives in a Middle Super
Output Area (MSOAs) where at least 10 percent of children have attended a grammar school
over the last five years. See Jerrim and Sims (2018) for further discussion of this definition.
We then proceed by re-estimating all of our analysis using this restricted sample only. These
alternative results can be found in Table D1 below. Note that we have allowed for a slightly
more relaxed length of the caliper in our matching models to increase the number of
observations included (on-support) in our analysis.
Appendix Table D1. Alternative estimates for the association between attending a
grammar school and pupils outcomes in England. Sample restricted to children living in
selective education areas only.
Model 1 Model 2
Outcome Beta SE Beta SE
Attitudes towards school
Academic self-concept scale -0.311 0.209 -0.114 0.143 School engagement scale -0.117 0.231 0.03 0.152 Academic well-being -0.208 0.268 0.058 0.169 Friends behaviour at school 0.215 0.236 0.252 0.162 Believe qualification needed to get a good job (Ref: No) -0.05 0.073 -0.027 0.05 Played truant (Ref: No) -0.031 0.068 -0.04 0.043
Mental health, well-being and self-esteem
Mental health scale -0.177 0.254 -0.026 0.17 Well-being scale -0.165 0.289 0.076 0.176 Self-esteem scale -0.017 0.264 0.04 0.161 Bullied 0.008 0.256 0.064 0.166 SDQ scale -0.259 0.22 -0.115 0.147
Young people's aspirations and expectations
Go to university scale -0.037 0.183 0.096 0.123 Aspire to work in a professional job (Ref: No) 0.18 0.141 0.152 0.1
Parental aspirations and investments Parent thinks will stay in school post 16 (Ref: No) 0.009 0.059 0.048 0.039 Parent thinks will go to university (Ref: No) 0.076 0.122 0.022 0.083 Receives tutoring (Ref: No) 0.023 0.093 0.008 0.057 Receives English tutoring (Ref: No) 0.03 0.057 0.028 0.039 Receives maths tutoring (Ref: No) 0.041 0.081 0.016 0.051
Academic achievement English vocabulary scale 0.226 0.243 0.261 0.159 Controls Demographic characteristics Yes Yes Achievement measures age 7 Yes Yes Socio-emotional measures age 7 Yes Yes Achievement measures age 11 Yes - Parental school preferences age 11 Yes - Tutoring and homework help age 11 Yes -

38
Socio-emotional measures age 11 Yes -
Notes: Effect for binary variables refers to a proportional increase. Effect for continuous outcome variables refer
to effect sizes. Negative coefficient indicate worse outcomes for grammar school pupils. * and ** indicate
significance at the 10 and 5 percent levels. Caliper has been set to 0.09, with matching to the two nearest
neighbours. Sample size for most outcomes around 130 control observations and 150 treatment observations.

39
Appendix E. Alternative results dropping fee-paying school pupils at age 14 (England)
Model 1 Model 2
Outcome Beta SE Beta SE
Attitudes towards school
Academic self-concept scale -0.12 0.15 -0.06 0.12
School engagement scale 0.00 0.13 0.02 0.1
Academic well-being -0.06 0.14 0.02 0.11
Friends behaviour at school -0.04 0.15 -0.06 0.11
Believe qualification needed to get a good job (Ref: No) -0.08** 0.04 -0.07** 0.03
Played truant (Ref: No) -0.05 0.04 -0.02 0.03
Mental health, well-being and self-esteem
Mental health scale -0.05 0.13 0.06 0.11
Well-being scale -0.10 0.15 -0.01 0.12
Self-esteem scale -0.14 0.14 -0.05 0.11
Bullied -0.14 0.12 -0.14 0.10
SDQ scale 0.10 0.12 0.00 0.09
Young people's aspirations and expectations
Go to university scale 0.04 0.10 0.06 0.08
Aspire to work in a professional job (Ref: No) -0.03 0.09 0.04 0.07
Parental aspirations and investments
Parent thinks will stay in school post 16 (Ref: No) 0.02 0.03 0.02 0.02
Parent thinks will go to university (Ref: No) 0.01 0.06 0.03 0.05
Receives tutoring (Ref: No) 0.00 0.05 -0.01 0.04
Receives English tutoring (Ref: No) -0.01 0.04 0.00 0.03
Receives maths tutoring (Ref: No) 0.03 0.05 0.01 0.04
Academic achievement
English vocabulary scale 0.24 0.15 0.24** 0.12
Controls
Demographic characteristics Yes Yes
Achievement measures age 7 Yes Yes
Socio-emotional measures age 7 Yes Yes
Achievement measures age 11 Yes -
Parental school preferences age 11 Yes -
Tutoring and homework help age 11 Yes -
Socio-emotional measures age 11 Yes -
40
Appendix F. Alternative estimates using a difference-in-difference approach
The main statistical approach used within this paper is propensity score matching (PSM).
Within this appendix, we consider whether our findings continue to hold for a sub-set of
outcomes using an alternative statistical methodology - difference- in-differences (DiD)
regression. This methodology utilises the fact that for some variables we have repeated
measures over several time points (e.g. English skills, SDQ scores, well-being, school
engagement). The intuition behind DiD is that, although the trend in these outcomes
between grammar and non-grammar school pupils may be similar during primary school,
the trends will start to diverge in secondary school (as grammar schools start to have a
positive effect). We provide a visual representation of the intuition behind this approach in
Figure I1.
<< Figure F1 >>
There are some notable advantages to DiD over PSM. Most notably, whereas PSM relies
upon a ‘selection-upon-observables’ assumption, DiD implicitly controls for all time-
invariant unobservable characteristics and all time-varying unobservable characterist ics
which are common between the grammar and non-grammar groups. Hence the assumptions
one needs to make to interpret the estimates as causal are somewhat weaker than under
PSM. A limitation, however, is that we can consider fewer outcomes; only those where the MCS includes repeated-measures over time.
The DiD method relies on the ‘common trends’ assumption: that the outcomes for grammar
and non-grammar pupils would have moved along common trends during the treatment
period, in the absence of any pupils attending a grammar. This assumption is not
empirically verifiable. However, in order to provide some confidence that it is justified we
can test whether the outcomes for grammar and non-grammar pupils move along common
trends during primary school. See Figure I1.
When applying our DiD analysis, we first restrict the sample to applicants only. Then, for
each outcome we consider, we standardise the scale to mean zero and standard deviation
one within each MCS wave7. Hence all estimates can be interpreted in terms of an effect
size. We then plot the mean score for grammar and non-grammar school pupils for each
wave where data is available, allowing us to check whether the common trends assumption
holds, at least in the period prior to treatment. The following difference- in-difference
regression model is then estimated:
𝑂𝑖𝑊 = 𝛼 + 𝛽.𝐺𝑟𝑎𝑚𝑚𝑎𝑟𝑖 ∗ 𝑊6 + 𝛿.𝑊 + 𝜇𝑖 + 휀𝑖𝑤 (I1)
Where:
𝑂𝑖𝑊 = The standardised outcome of child I in MCS wave W.
𝐺𝑟𝑎𝑚𝑚𝑎𝑟𝑖 = Whether the child attends a grammar (1) or non-grammar (0) secondary school
7 For children’s English skills, we use their vocabulary scores at ages 3 and 5, word reading test at age 7, and
word test at age 14.
41
𝑊 = A vector of dummy variables capturing the MCS wave
𝐺𝑟𝑎𝑚𝑚𝑎𝑟𝑖 ∗ 𝑊6 = The DiD interaction term. This will be equal to 1 for children who attend a
grammar school in wave 6 (age 14) of the MCS survey and zero otherwise.
𝜇𝑖 = Child fixed-effect
휀𝑖𝑤 = Time-varying error term
The 𝛽 parameter on the interaction term in model I1 thus provides the DiD estimate of the
effect of attending a grammar school. All standard errors are clustered within pupils.
Our results from this analysis are presented in Figures I2 (English skills), I3 (SDQ scores), I4
(school engagement) to I5 (well-being). These illustrate the trend in the scale scores between
grammar and non-grammar school children, with the formal DiD estimate provided in the table
notes. For brevity, our focus is upon the results for England only.
<< Figures F2 to F5 >>
Consistent with our PSM results, all effects are small in terms of magnitude and are not
statistically significant. This holds true for our measure of children’s academic skills (English
test scores), school engagement and SDQ scores. Moreover, for these three outcomes,
‘common trends’ seems a reasonable assumption to make. (This is clearly not the case for well-
being in Figure I5, where the common-trends assumption does not hold). Consequently, our
overall interpretation is that the difference-in-difference approach leads us to similar
substantive conclusions as our PSM analysis. That is, the impact of grammar schools upon
pupils’ outcomes at age 14 seems to be minimal.
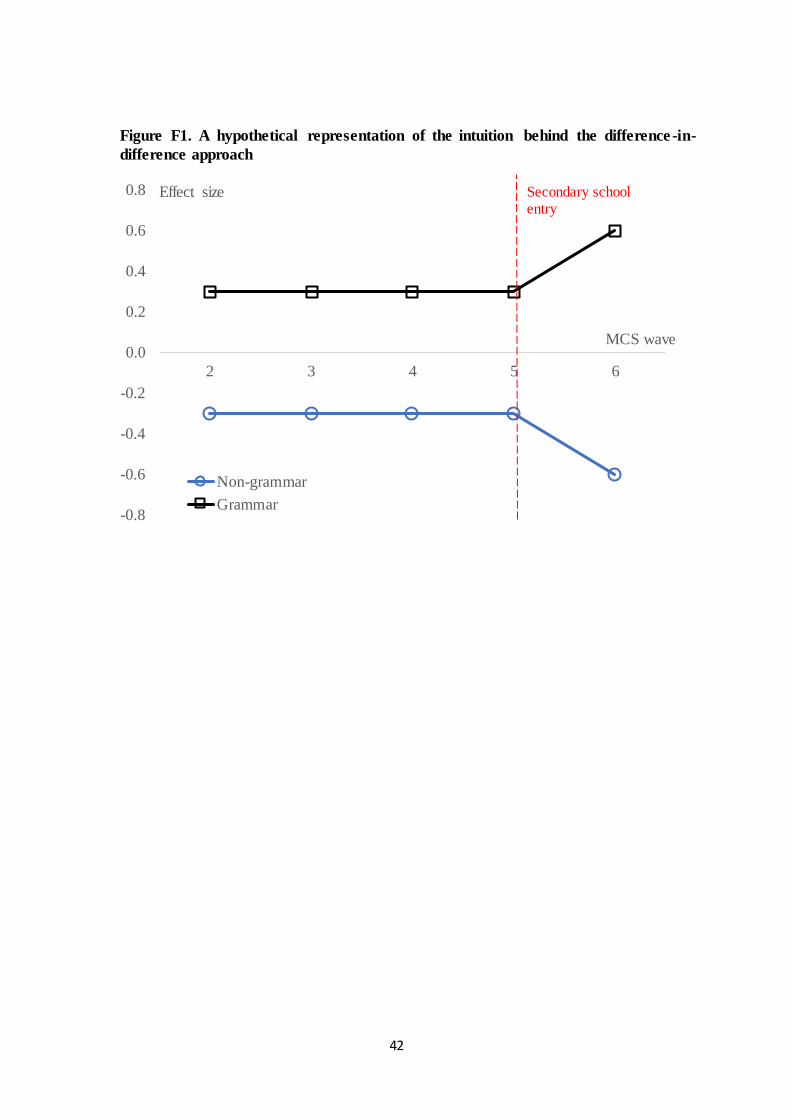
42
Figure F1. A hypothetical representation of the intuition behind the difference-in-
difference approach
-0.8
-0.6
-0.4
-0.2
0.0
0.2
0.4
0.6
0.8
2 3 4 5 6
Effect size
MCS wave
Non-grammar
Grammar
Secondary school entry
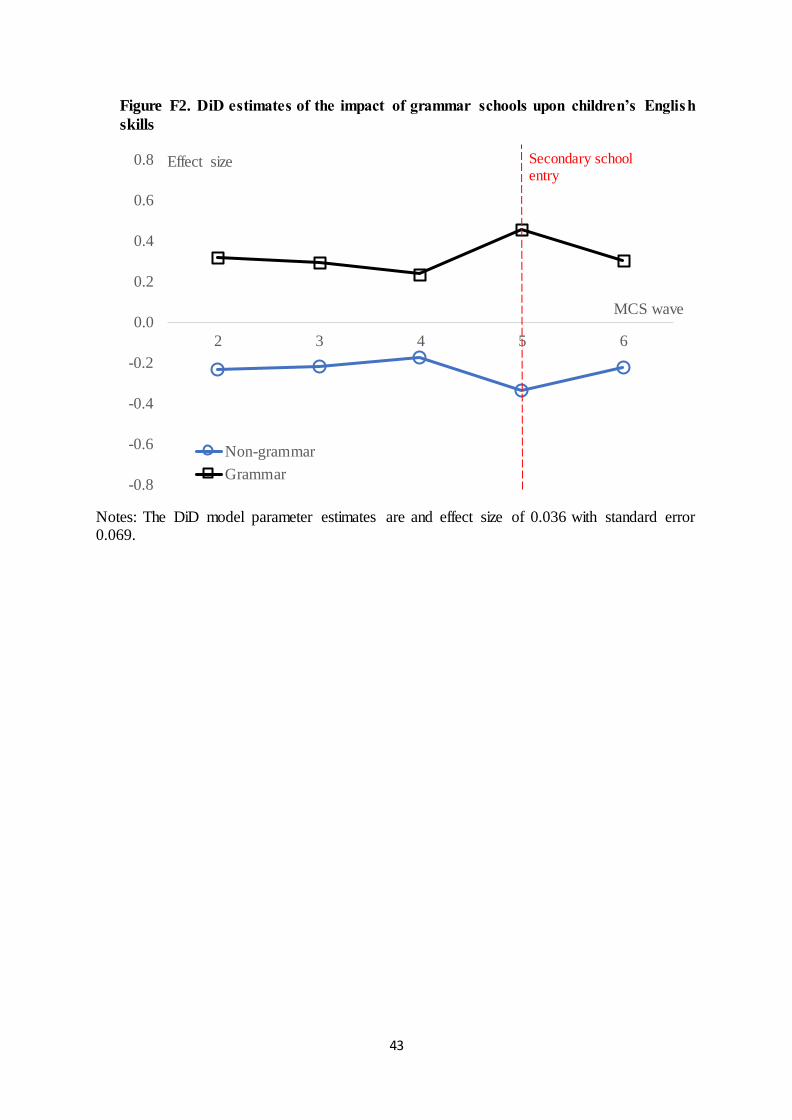
43
Figure F2. DiD estimates of the impact of grammar schools upon children’s English
skills
Notes: The DiD model parameter estimates are and effect size of 0.036 with standard error 0.069.
-0.8
-0.6
-0.4
-0.2
0.0
0.2
0.4
0.6
0.8
2 3 4 5 6
Effect size
MCS wave
Non-grammar
Grammar
Secondary school entry
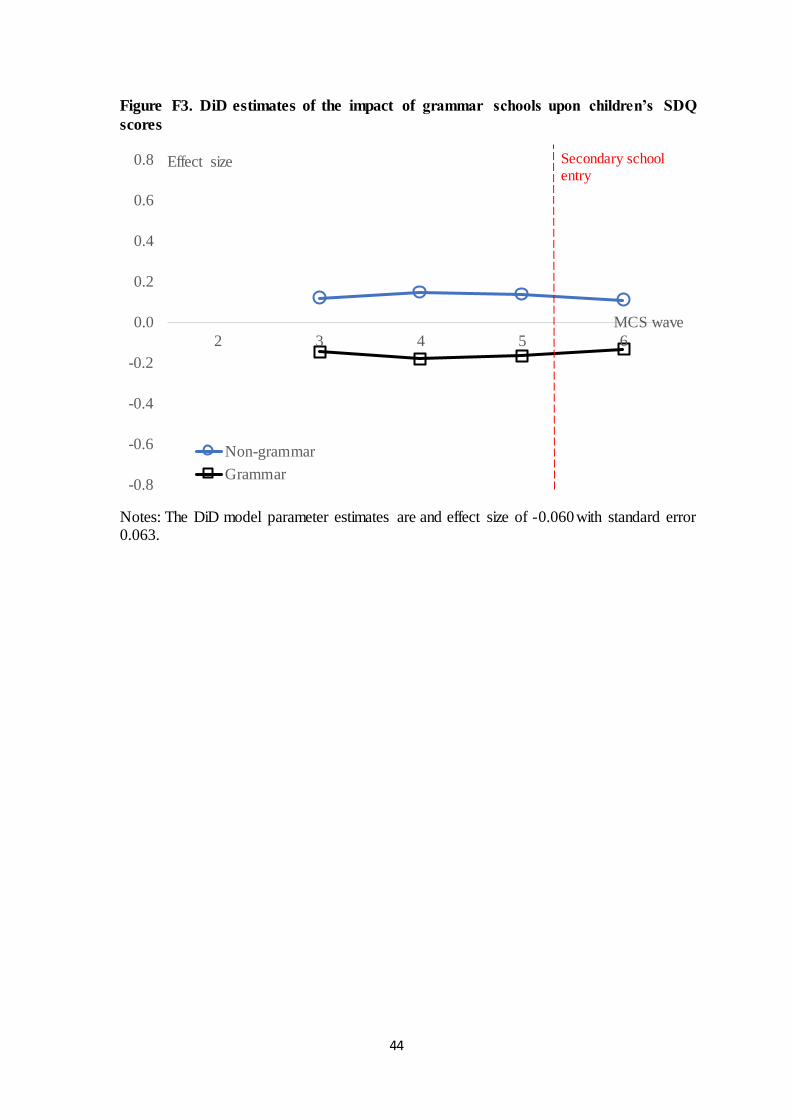
44
Figure F3. DiD estimates of the impact of grammar schools upon children’s SDQ
scores
Notes: The DiD model parameter estimates are and effect size of -0.060 with standard error 0.063.
-0.8
-0.6
-0.4
-0.2
0.0
0.2
0.4
0.6
0.8
2 3 4 5 6
Effect size
MCS wave
Non-grammar
Grammar
Secondary school entry
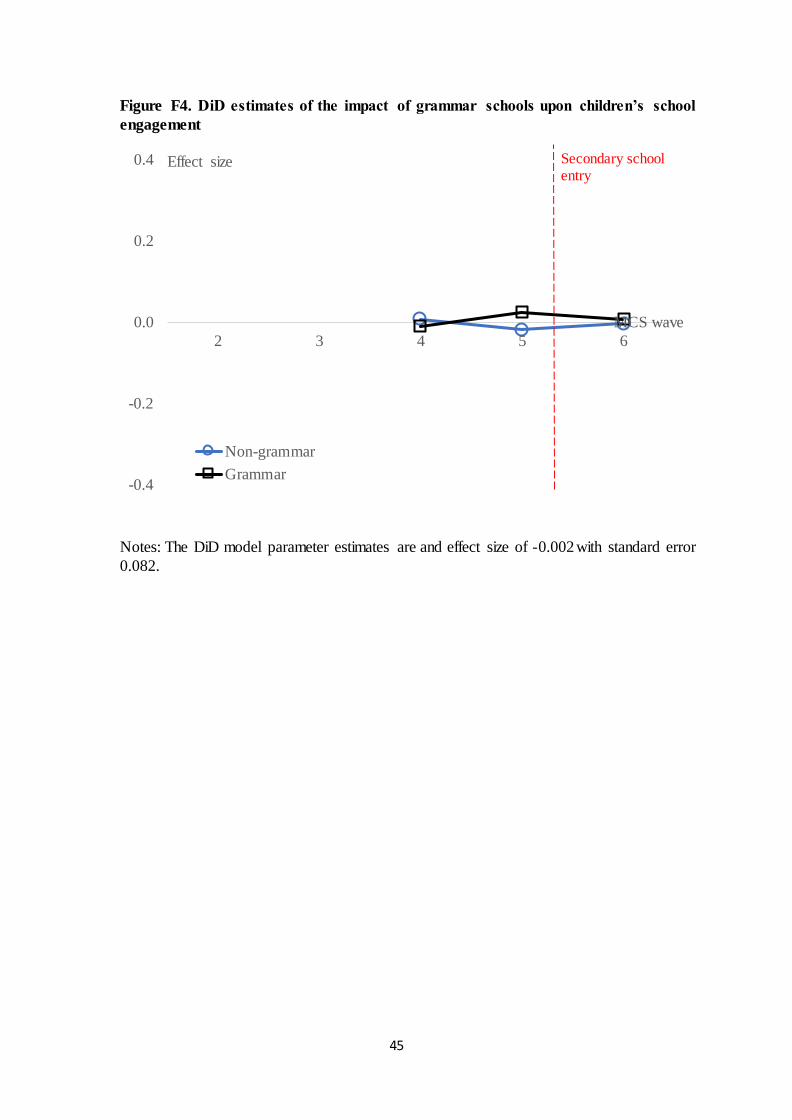
45
Figure F4. DiD estimates of the impact of grammar schools upon children’s school
engagement
Notes: The DiD model parameter estimates are and effect size of -0.002 with standard error
0.082.
-0.4
-0.2
0.0
0.2
0.4
2 3 4 5 6
Effect size
MCS wave
Non-grammar
Grammar
Secondary school entry
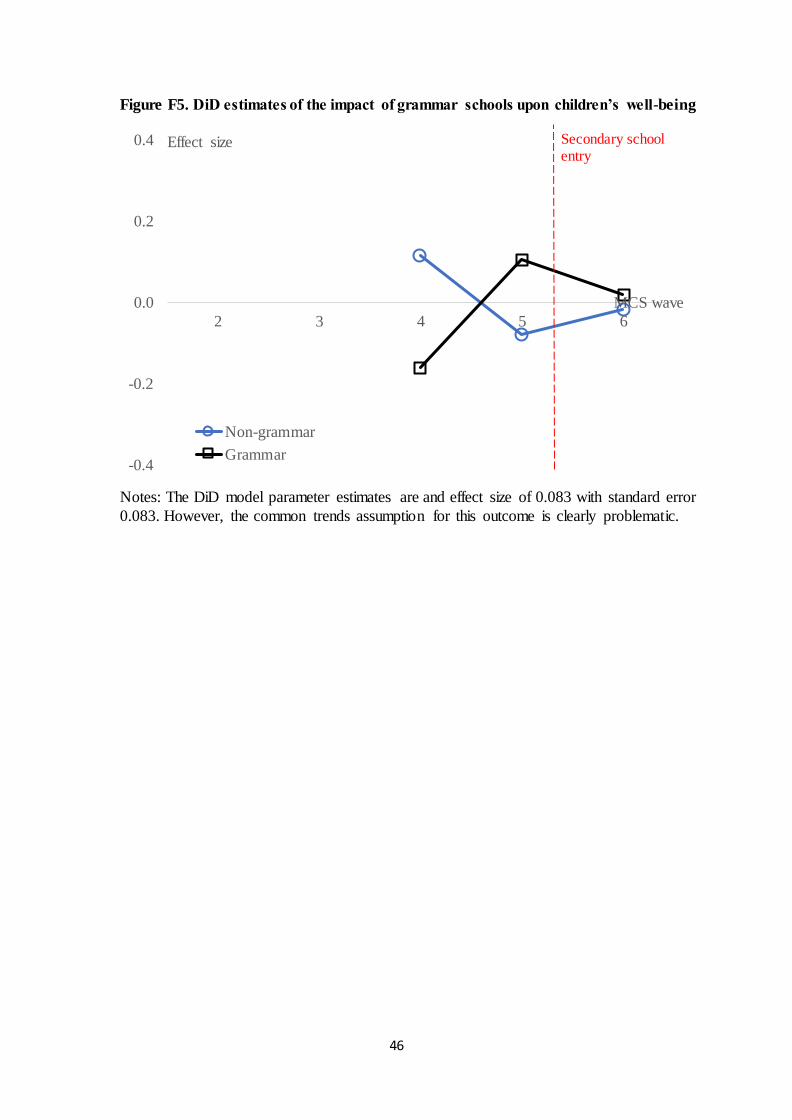
46
Figure F5. DiD estimates of the impact of grammar schools upon children’s well-being
Notes: The DiD model parameter estimates are and effect size of 0.083 with standard error
0.083. However, the common trends assumption for this outcome is clearly problematic.
-0.4
-0.2
0.0
0.2
0.4
2 3 4 5 6
Effect size
MCS wave
Non-grammar
Grammar
Secondary school entry
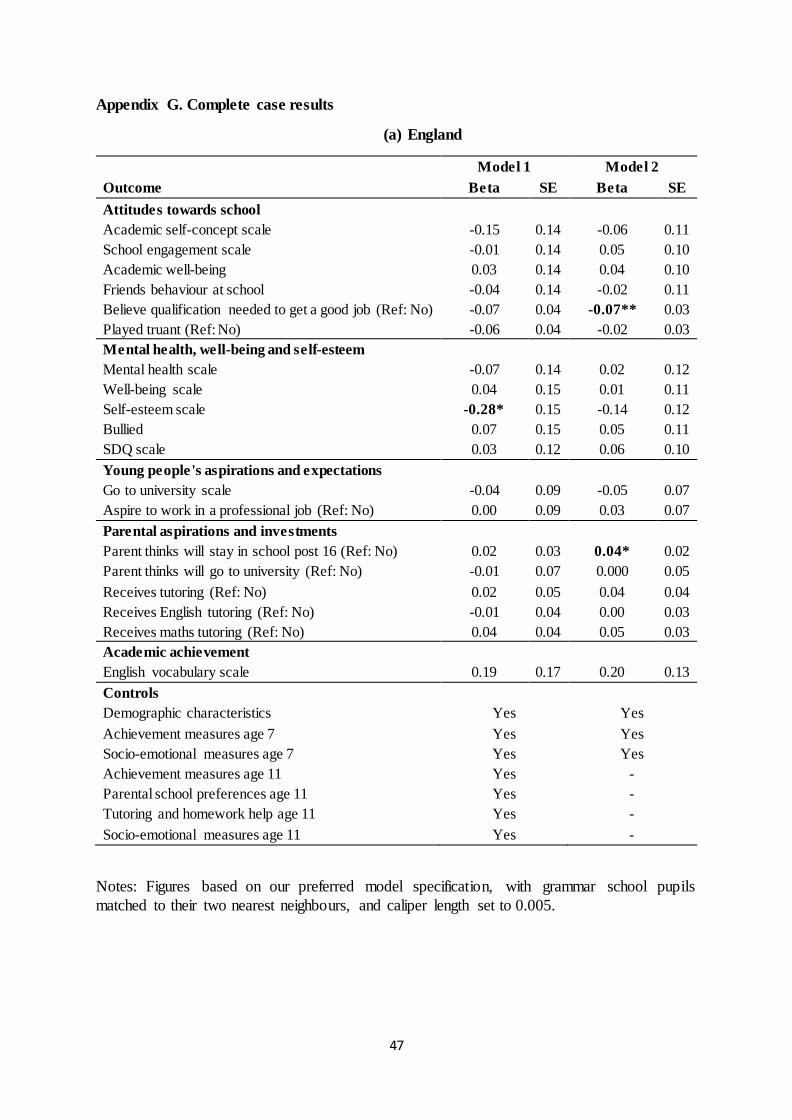
47
Appendix G. Complete case results
(a) England
Model 1 Model 2
Outcome Beta SE Beta SE
Attitudes towards school
Academic self-concept scale -0.15 0.14 -0.06 0.11
School engagement scale -0.01 0.14 0.05 0.10
Academic well-being 0.03 0.14 0.04 0.10
Friends behaviour at school -0.04 0.14 -0.02 0.11
Believe qualification needed to get a good job (Ref: No) -0.07 0.04 -0.07** 0.03
Played truant (Ref: No) -0.06 0.04 -0.02 0.03
Mental health, well-being and self-esteem
Mental health scale -0.07 0.14 0.02 0.12
Well-being scale 0.04 0.15 0.01 0.11
Self-esteem scale -0.28* 0.15 -0.14 0.12
Bullied 0.07 0.15 0.05 0.11
SDQ scale 0.03 0.12 0.06 0.10
Young people's aspirations and expectations
Go to university scale -0.04 0.09 -0.05 0.07
Aspire to work in a professional job (Ref: No) 0.00 0.09 0.03 0.07
Parental aspirations and investments
Parent thinks will stay in school post 16 (Ref: No) 0.02 0.03 0.04* 0.02
Parent thinks will go to university (Ref: No) -0.01 0.07 0.000 0.05
Receives tutoring (Ref: No) 0.02 0.05 0.04 0.04
Receives English tutoring (Ref: No) -0.01 0.04 0.00 0.03
Receives maths tutoring (Ref: No) 0.04 0.04 0.05 0.03
Academic achievement
English vocabulary scale 0.19 0.17 0.20 0.13
Controls
Demographic characteristics Yes Yes
Achievement measures age 7 Yes Yes
Socio-emotional measures age 7 Yes Yes
Achievement measures age 11 Yes -
Parental school preferences age 11 Yes -
Tutoring and homework help age 11 Yes -
Socio-emotional measures age 11 Yes -
Notes: Figures based on our preferred model specification, with grammar school pupils
matched to their two nearest neighbours, and caliper length set to 0.005.

48
(b) Northern Ireland
Model 1 Model 2
Outcome Beta SE Beta SE
Attitudes towards school
Academic self-concept scale -0.33 0.24 0.1 0.16
School engagement scale -0.16 0.24 -0.03 0.16
Academic well-being -0.04 0.23 -0.23 0.16
Friends behaviour at school -0.29 0.29 -0.18 0.2
Believe qualification needed to get a good job (Ref: No) -0.06 0.09 -0.02 0.06
Played truant (Ref: No) -0.03 0.07 -0.02 0.04
Mental health, well-being and self-esteem
Mental health scale -0.26 0.27 -0.29 0.18
Well-being scale -0.16 0.19 -0.32** 0.15
Self-esteem scale -0.29 0.23 -0.36** 0.17
Bullied -0.1 0.22 -0.22 0.15
SDQ scale -0.25 0.22 -0.12 0.14
Young people's aspirations and expectations
Go to university scale -0.04 0.24 0.17 0.17
Aspire to work in a professional job (Ref: No) -0.12 0.15 -0.05 0.11
Parental aspirations and investments
Parent thinks will stay in school post 16 (Ref: No) -0.01 0.04 0.02 0.05
Parent thinks will go to university (Ref: No) 0.12 0.13 0.26** 0.09
Receives tutoring (Ref: No) 0.08** 0.02 0.07** 0.02
Receives English tutoring (Ref: No) 0.01 0.01 0.01 0.01
Receives maths tutoring (Ref: No) 0.08** 0.02 0.06** 0.02
Academic achievement
English vocabulary scale -0.08 0.2 0.23 0.16
Controls
Demographic characteristics Yes Yes
Achievement measures age 7 Yes Yes
Socio-emotional measures age 7 Yes Yes
Achievement measures age 11 Yes -
Parental school preferences age 11 Yes -
Tutoring and homework help age 11 Yes -
Socio-emotional measures age 11 Yes -
Notes: Figures based on our preferred model specification, with grammar school pupils
matched to their two nearest neighbours, and caliper length set to 0.005.

49
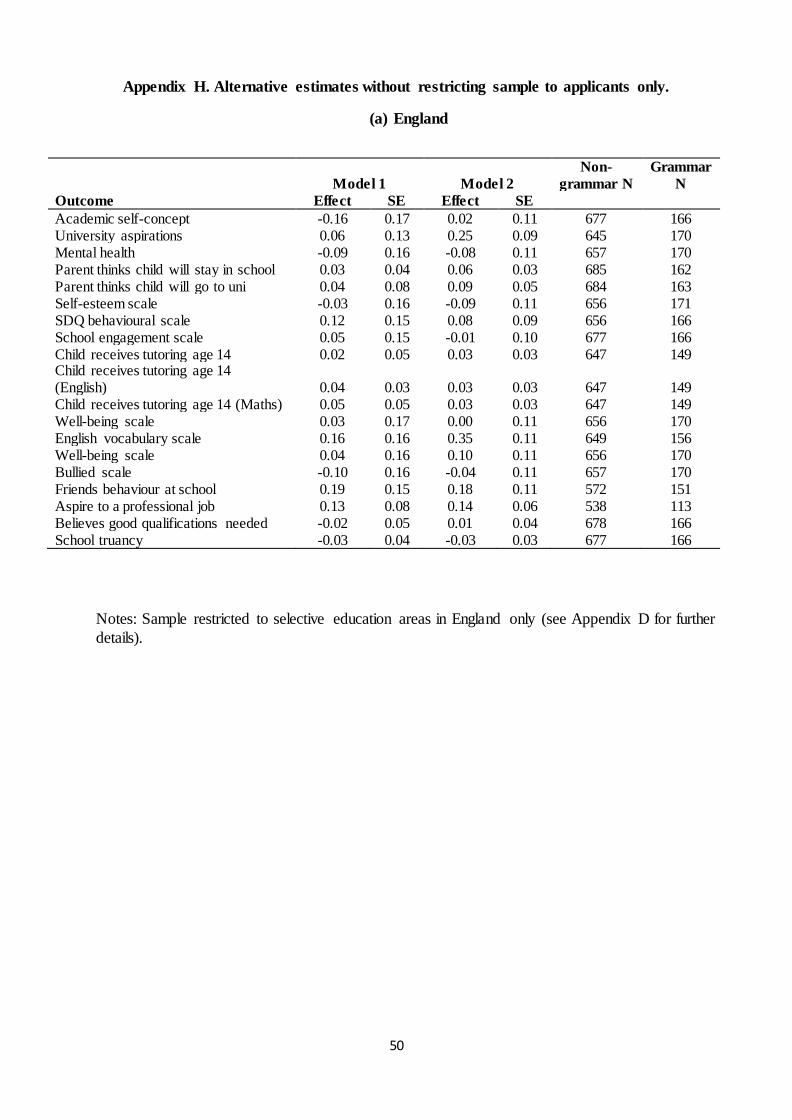
50
Appendix H. Alternative estimates without restricting sample to applicants only.
(a) England
Model 1 Model 2
Non-
grammar N
Grammar
N
Outcome Effect SE Effect SE
Academic self-concept -0.16 0.17 0.02 0.11 677 166 University aspirations 0.06 0.13 0.25 0.09 645 170 Mental health -0.09 0.16 -0.08 0.11 657 170 Parent thinks child will stay in school 0.03 0.04 0.06 0.03 685 162 Parent thinks child will go to uni 0.04 0.08 0.09 0.05 684 163 Self-esteem scale -0.03 0.16 -0.09 0.11 656 171 SDQ behavioural scale 0.12 0.15 0.08 0.09 656 166 School engagement scale 0.05 0.15 -0.01 0.10 677 166 Child receives tutoring age 14 0.02 0.05 0.03 0.03 647 149 Child receives tutoring age 14 (English) 0.04 0.03 0.03 0.03 647 149 Child receives tutoring age 14 (Maths) 0.05 0.05 0.03 0.03 647 149 Well-being scale 0.03 0.17 0.00 0.11 656 170 English vocabulary scale 0.16 0.16 0.35 0.11 649 156 Well-being scale 0.04 0.16 0.10 0.11 656 170 Bullied scale -0.10 0.16 -0.04 0.11 657 170 Friends behaviour at school 0.19 0.15 0.18 0.11 572 151 Aspire to a professional job 0.13 0.08 0.14 0.06 538 113 Believes good qualifications needed -0.02 0.05 0.01 0.04 678 166 School truancy -0.03 0.04 -0.03 0.03 677 166
Notes: Sample restricted to selective education areas in England only (see Appendix D for further
details).

51
(b) Northern Ireland
Model 1 Model 2
Outcome Beta SE Beta SE
Attitudes towards school
Academic self-concept scale -0.26** 0.12 -0.17* 0.10
School engagement scale -0.05 0.12 -0.04 0.10
Academic well-being -0.07 0.12 -0.10 0.11
Friends behaviour at school -0.04 0.14 0.01 0.12
Believe qualification needed to get a good job (Ref: No) -0.03 0.04 -0.03 0.04
Played truant (Ref: No) 0.03 0.03 0.03 0.02
Mental health, well-being and self-esteem
Mental health scale -0.1 0.12 -0.07 0.11
Well-being scale 0.00 0.13 -0.08 0.10
Self-esteem scale -0.07 0.13 -0.11 0.11
Bullied 0.14 0.13 0.07 0.11
SDQ scale -0.10 0.12 -0.14 0.10
Young people's aspirations and expectations
Go to university scale 0.08 0.12 0.19* 0.11
Aspire to work in a professional job (Ref: No) 0.00 0.07 0.02 0.06
Parental aspirations and investments
Parent thinks will stay in school post 16 (Ref: No) 0.02 0.04 0.05 0.03
Parent thinks will go to university (Ref: No) 0.21** 0.06 0.18** 0.05
Receives tutoring (Ref: No) 0.05** 0.02 0.05** 0.02
Receives English tutoring (Ref: No) -0.01 0.02 0.00 0.01
Receives maths tutoring (Ref: No) 0.05** 0.02 0.05** 0.02
Academic achievement
English vocabulary scale 0.07 0.13 0.12 0.11
Controls
Demographic characteristics Yes Yes
Achievement measures age 7 Yes Yes
Socio-emotional measures age 7 Yes Yes
Achievement measures age 11 Yes -
Parental school preferences age 11 Yes -
Tutoring and homework help age 11 Yes -
Socio-emotional measures age 11 Yes -

52
All
observations
On
support
Off
support
Non-
grammar Grammar
Academic self-concept scale 956 833 123 490 343 Go to university scale 918 837 81 461 376 Mental health scale 947 836 111 481 355 Parent thinks will stay in school post 16 (REF: No) 975 868 107 500 368 Parent thinks will go to university (REF: No) 975 868 107 500 368 Self-esteem scale 945 835 110 479 356 SDQ scale 934 840 94 474 366 School engagement scale 956 833 123 490 343 Receives tutoring (REF: No) 949 838 111 495 343 Receives English tutoring (REF: No) 949 838 111 495 343 Receives maths tutoring (REF: No) 949 838 111 495 343 Well-being scale 947 836 111 481 355 English vocabulary scale 917 819 98 466 353 Academic well-being 946 811 135 481 330 Bullied 945 855 90 480 375 Friends behaviour at school 767 673 94 382 291 Aspire to work in a professional job 760 628 132 399 229 Believe qualification needed to get a good job 956 833 123 490 343 Played truant 956 833 123 490 343
Notes: Alternative estimates for Northern Ireland. These estimates do not restrict the sample to only those
children whose parents applied for them to attend a grammar school. This increases the sample size,
particularly within the non-grammar group. These results can be cross-referenced against Table 4 for comparison.
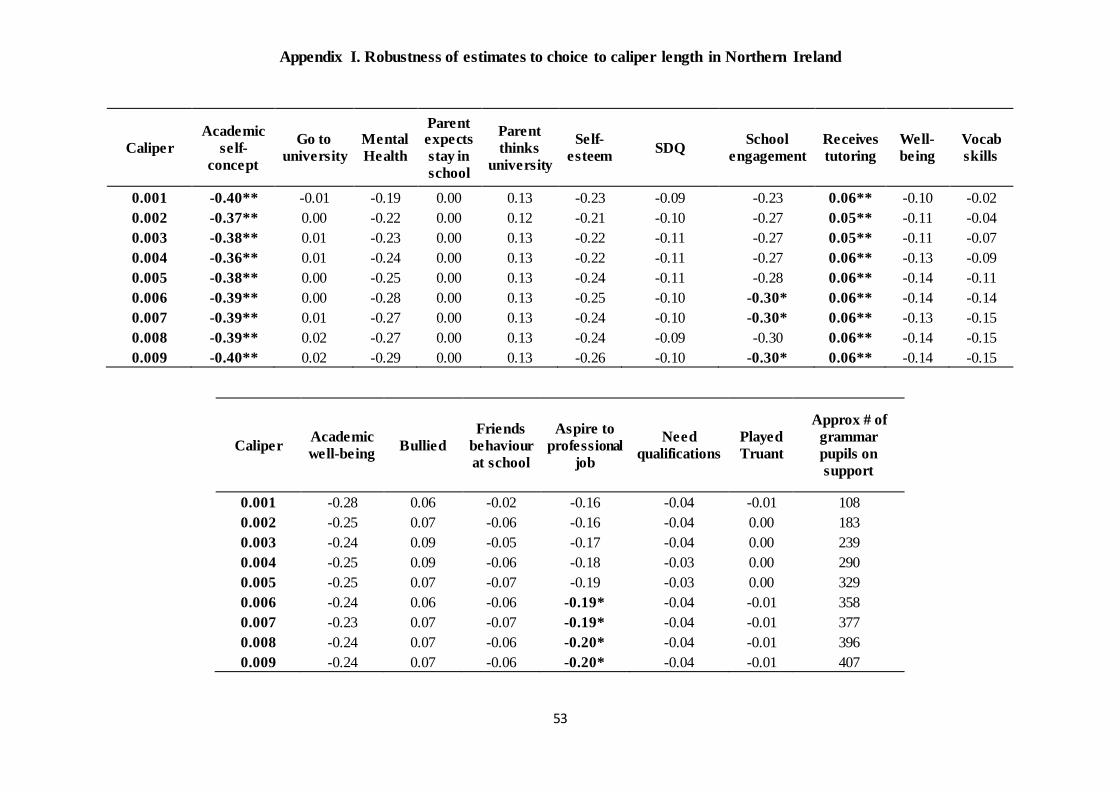
53
Appendix I. Robustness of estimates to choice to caliper length in Northern Ireland
Caliper
Academic
self-
concept
Go to
university
Mental
Health
Parent expects
stay in
school
Parent
thinks
university
Self-
esteem SDQ
School
engagement
Receives
tutoring
Well-
being
Vocab
skills
0.001 -0.40** -0.01 -0.19 0.00 0.13 -0.23 -0.09 -0.23 0.06** -0.10 -0.02
0.002 -0.37** 0.00 -0.22 0.00 0.12 -0.21 -0.10 -0.27 0.05** -0.11 -0.04
0.003 -0.38** 0.01 -0.23 0.00 0.13 -0.22 -0.11 -0.27 0.05** -0.11 -0.07
0.004 -0.36** 0.01 -0.24 0.00 0.13 -0.22 -0.11 -0.27 0.06** -0.13 -0.09
0.005 -0.38** 0.00 -0.25 0.00 0.13 -0.24 -0.11 -0.28 0.06** -0.14 -0.11
0.006 -0.39** 0.00 -0.28 0.00 0.13 -0.25 -0.10 -0.30* 0.06** -0.14 -0.14
0.007 -0.39** 0.01 -0.27 0.00 0.13 -0.24 -0.10 -0.30* 0.06** -0.13 -0.15
0.008 -0.39** 0.02 -0.27 0.00 0.13 -0.24 -0.09 -0.30 0.06** -0.14 -0.15
0.009 -0.40** 0.02 -0.29 0.00 0.13 -0.26 -0.10 -0.30* 0.06** -0.14 -0.15
Caliper Academic
well-being Bullied
Friends
behaviour
at school
Aspire to
professional
job
Need
qualifications
Played
Truant
Approx # of
grammar
pupils on
support
0.001 -0.28 0.06 -0.02 -0.16 -0.04 -0.01 108
0.002 -0.25 0.07 -0.06 -0.16 -0.04 0.00 183
0.003 -0.24 0.09 -0.05 -0.17 -0.04 0.00 239
0.004 -0.25 0.09 -0.06 -0.18 -0.03 0.00 290
0.005 -0.25 0.07 -0.07 -0.19 -0.03 0.00 329
0.006 -0.24 0.06 -0.06 -0.19* -0.04 -0.01 358
0.007 -0.23 0.07 -0.07 -0.19* -0.04 -0.01 377
0.008 -0.24 0.07 -0.06 -0.20* -0.04 -0.01 396
0.009 -0.24 0.07 -0.06 -0.20* -0.04 -0.01 407