the asset price bubble and monetary policy: japan’s
TRANSCRIPT
395
MONETARY AND ECONOMIC STUDIES (SPECIAL EDITION)/FEBRUARY 2001
The Asset Price Bubbleand Monetary Policy:
Japan’s Experiencein the Late 1980s
and the Lessons
Background Paper by Kunio Okina, Masaaki Shirakawa,
and Shigenori Shiratsuka
Since the latter half of the 1980s, Japan’s economy has experiencedthe emergence, expansion, and bursting of a bubble economy, characterized by a rapid rise in asset prices, the overheating of economic activity, and the expansion of money supply and credit.This paper examines the mechanism by which the bubble economywas generated and summarizes lessons a central bank should drawfrom the experience in order to prevent it from happening again.Specifically, by focusing on the intensified bullish expectations that played an important role behind the large fluctuations in assetprices and the economy, the process of the emergence, expansion, and bursting of the bubble is examined in relation to the monetary policyat the time. Based on this analysis, the paper discusses a frameworkfor monetary policy conducive to achieving both price stability andfinancial system stability.
Key words: Asset prices; Bubble; Intensified bullish expectations;Monetary policy; Sustained price stability; Financialstability; Forward-looking monetary policy
Kunio Okina: Bank of Japan (E-mail: [email protected])Masaaki Shirakawa: Bank of Japan (E-mail: [email protected])Shigenori Shiratsuka: Bank of Japan (E-mail: [email protected])
This paper is a revised version of preliminary draft presented at the workshop under thesame title sponsored by the Institute for Monetary and Economic Studies at the Bank ofJapan on January 25, 2000. The authors are grateful to Dr. Masaru Yoshitomi, ProfessorShinichi Kitasaka, and other participants at the workshop for their helpful comments anddiscussions; to Messrs. Yasuhiro Maehara, Michio Kitahara, Toyoichiro Shirota, and YujiYokobori, and Ms. Sachiko Suematsu for their assistance. The views expressed in thepaper are those of the authors and do not necessarily reflect those of the Bank of Japan.
I. Introduction
Japan’s economy has experienced substantial fluctuations since the latter half of the1980s. From the latter half of the 1980s to the early 1990s when the bubble emergedand expanded, we saw a rapid and large surge in asset prices, a sizable increase inmoney supply and credit, and the expansion of economic activity for a protractedperiod. During the subsequent period of the bursting of the bubble from the early1990s, Japan experienced a plummet in asset prices, the accumulation of huge nonperforming assets and resulting difficulties faced by financial institutions, and aprolonged recession.
There have been various discussions and analyses among central bankers, academia, and economists both at home and abroad with respect to the mechanismof how the bubble economy was generated, although up to now a consensus is far from being reached.1 Similarly, discussions are under way as to how monetary policy should be conducted when asset prices rapidly rise. In fact, the evaluation ofmonetary policy depends very much on financial and economic conditions underwhich it is conducted. For example, from the latter half of 1987 when asset pricesrapidly rose and economic expansion became increasingly certain, the Bank of Japan(BOJ) explored the possibility of monetary tightening in view of concern over inflation and excessive monetary easing, but could not present an argument that wasregarded as sufficiently convincing for tightening. In contrast, immediately after thebursting of the bubble, there were periods when monetary tightening was generallypraised as an appropriate measure. As the recession became protracted, the BOJ wasexposed to severe criticism that prolonged monetary easing since the latter half of the1980s had brought about the bubble economy, which led to the subsequent deeprecession and nonperforming-asset problem.
Recalling the situation when the bubble emerged, the BOJ expressed concern, at arelatively early stage, over inflationary pressure and the adverse effects of excessivemonetary easing. Such concerns were also shared by not a few economists at thattime. However, in view of stable prices indicated by various related indices, thosewho were concerned with inflationary pressure had difficulty in reconciling stableprice indices with concern over future inflation. Furthermore, there did not exist acommonly shared understanding as to what exactly are problems caused by theincrease in asset prices.
This paper intends to draw lessons based on the experience of monetary policyduring the bubble period rather than a simple afterthought. In view of such an intention, this paper attempts to describe as accurately and as concretely as possiblethe economic, financial, and social background under which monetary policy wasbeing conducted. Needless to say, the lessons derived from the experience during thebubble period could differ depending on the economic theories that are beingapplied and also on how the general public perceived the central bank. Some mayfind this paper overstates the importance of monetary policy and others find it
396 MONETARY AND ECONOMIC STUDIES (SPECIAL EDITION)/FEBRUARY 2001
1. Literature that has dealt with Japan’s bubble period includes Ohta (1991), Noguchi (1992), Ueda (1992), Iwata(1993), Ministry of Finance (1993), Suzuki (1993), Takao (1994), Ogata (1996), Cargill, Hutchison, and Ito(1997), Ogawa and Kitasaka (1998), Yoshitomi (1998), Okumura (1999), and Mieno (2000).
too detached or self-defensive, neither of which intention the authors had in mind.The main purpose of this paper is to present the authors’ views on the cause of the bubble since the late 1980s and the lessons for monetary policy as well as toobjectively describe the background behind these views, thereby further enrichingdiscussion on the bubble.
This paper is structured as follows. Chapter II reviews the development of Japan’seconomy during the bubble period, and Chapter III examines the mechanism behindthe emergence and expansion of the bubble. Chapter IV analyzes how monetary policy was conducted in the process of the emergence and expansion of the bubble as well as the influence of prolonged monetary easing on the process. Chapter V considers the question of why monetary tightening was delayed, and Chapter VI discusses the lessons learned from the bubble period that the BOJ should be aware ofin conducting monetary policy.
II. Overview of Japan’s Economy during the Bubble Period
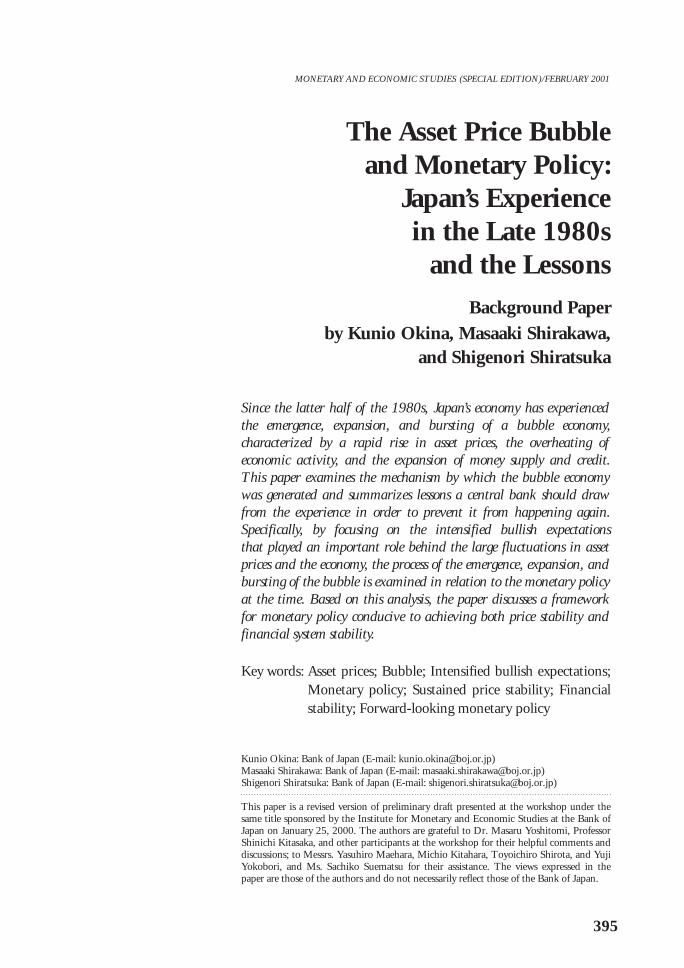
A. Definition of the Bubble EconomyWhile the term “bubble” is used differently among people, based on the experienceof Japan’s economy in the late 1980s, let us characterize the bubble economy in thispaper by three factors: a rapid rise in asset prices, the overheating of economic activity, and a sizable increase in money supply and credit (see Figure 1 for monetaryand economic conditions after the 1980s).
The definition of the bubble period may vary depending on which one of the three factors one emphasizes. The rise in asset prices started around 1982 and accelerated from 1985 to 1986. However, the rise was relatively moderate in the earlystage and two years (1985–86) coincided with the “endaka recession” (a recessioncaused by the appreciation of the yen). While few view these years as being part of the bubble period, many consider 1987 as the beginning of the bubble period for the following reasons. First, according to the Economic Planning Agency’s (EPA) reference dates of the business cycle, the economy bottomed out in November 1986and 1987 was a year of expansion. Second, while the year-on-year growth rate ofmoney supply (M2+CDs) and credit had been declining somewhat in 1986, albeit ata high level, it started to accelerate around 1987. As such, 1987 saw an accelerating rise in money supply and credit, a rapid increase in asset prices, and the economyentering a recovery cycle. Hence, many naturally regard 1987 as the starting year of thebubble. However, some might argue that 1987 should not be included in the bubbleperiod since the recovery of the economy was not clearly recognized in the first half of the year and there was a worldwide stock market crash in October of the same year.
Views differ as to when the bubble began to burst. Stock prices in terms of theNikkei 225 peaked at end-1989,2 while land prices in terms of the Urban Land PriceIndex (six major cities, commercial areas) of the Japan Real Estate Institute peaked
397
The Asset Price Bubble and Monetary Policy: Japan’s Experience in the Late 1980s and the Lessons
2. The Nikkei OTC Index hit a peak on July 9, 1990, increasing almost 60 percent even after the Nikkei 225 peakedat end-1989 (from ¥2,597 at end-1989 to ¥4,149 on July 9, 1990).

398 MONETARY AND ECONOMIC STUDIES (SPECIAL EDITION)/FEBRUARY 2001
Figure 1 Financial and Macroeconomic Conditions
1982 83 84 88 89 90 91 92 93 94 95 96 97 98 9985 86 87012345678
75100125150175200225250275
Percent Yen/U.S. dollar
Official discount rate (left scale)
Yen/U.S. dollar rate (right scale)
1982 83 84 88 89 90 91 92 93 94 95 96 97 98 9985 86 87–4–202468
101214
Claims on private sector
M2+CD
Changes from a year earlier, percent
1982 83 84 88 89 90 91 92 93 94 95 96 97 98 9985 86 8705
10152025303540
0
20
40
60
80
100
1201990/III = 100¥ thousands
Nikkei 225 (left scale)Commercial land price index of cities(right scale)
–6
–4
–2
0
2
4
6
8
1982 83 84 88 89 90 91 92 93 94 95 96 97 98 99–60
–40
–20
0
20
40
60
Changes from a year earlier, percent Percentage points
Real GDP growth (left scale)Business conditions DI (right scale)
80
85 86 87
1982 83 84 88 89 90 91 92 93 94 95 96 97 98 99
Changes from a year earlier, percent �
85 86 87–6
–4
–2
0
2
4
Domestic WPICPI excluding fresh foods
Notes: Shaded areas indicate periods of economic recession.
Sources: Bank of Japan, Financial and Economic Statistics Monthly; EconomicPlanning Agency, Annual Report on National Accounts; Japan Real EstateInstitute, Urban Land Price Index.
around 1990. In addition, the year-on-year growth rate of money supply (M2+CDs)peaked in April and May 1990, and the economy peaked in February 1991 accordingto the EPA.
While the exact period of the emergence, expansion, and bursting of the bubblemay differ, in this paper we define the four years from 1987 through 1990 as the“emergence and expansion of the bubble period” based on the simultaneous rise instock and land prices, economic activity, and money supply.3
B. Characteristics of the Bubble Economy1. Substantial increase in asset pricesThe first characteristic of the bubble period was a rapid and substantial rise in assetprices. In fact, asset prices began increasing in 1983, and it was around 1986 whenthe rise began accelerating rapidly.
Among asset prices, what exhibited the most rapid rise initially were stock prices.The speed of the rise in the Nikkei 225 began accelerating in 1986 and the index hita peak of ¥38,915 at end-1989, 3.1 times higher than the level at the time of thePlaza Agreement in September 1985 (¥12,598). Then, stock prices fell sharply to¥14,309 in August 1992, more than 60 percent below the peak.4
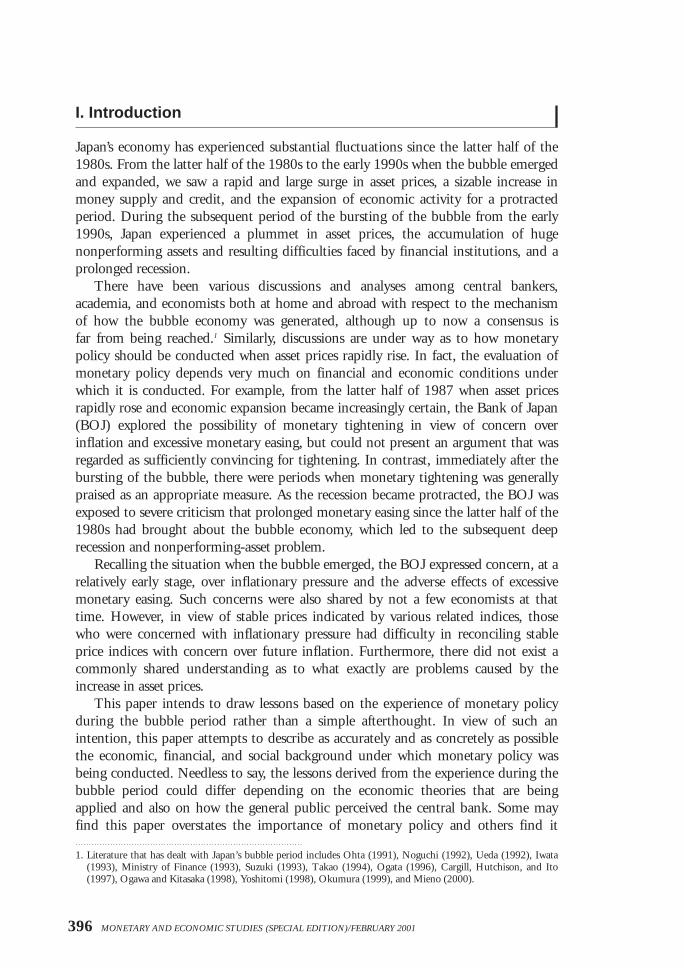
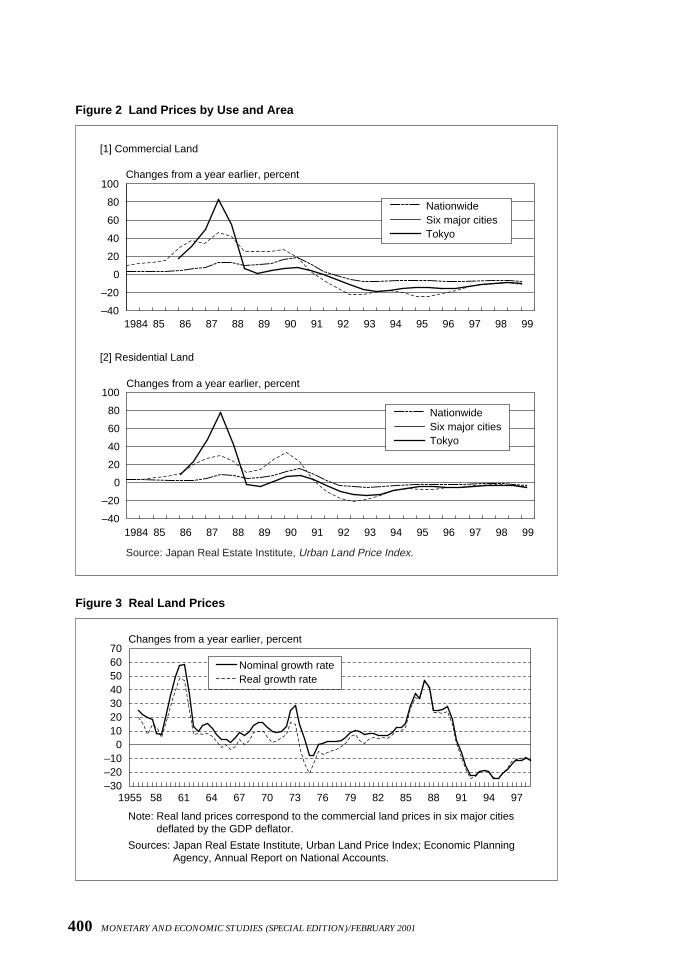
The rise in land prices followed that in stock prices with a time lag, spreadingfrom Tokyo to major cities such as Osaka and Nagoya, and then to other cities(Figure 2). The Urban Land Price Index reached a peak in September 1990, almostfour times higher than the level in September 1985. Land prices have been decliningthereafter and in 1999 were some 20 percent lower than in September 1985, andsome 80 percent lower than the peak in September 1990.
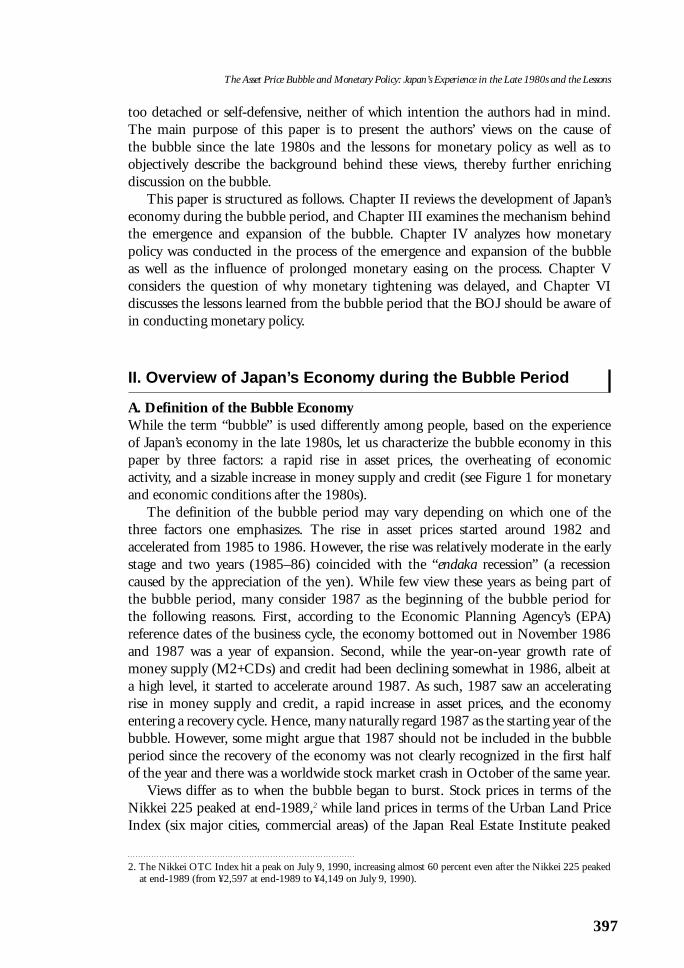
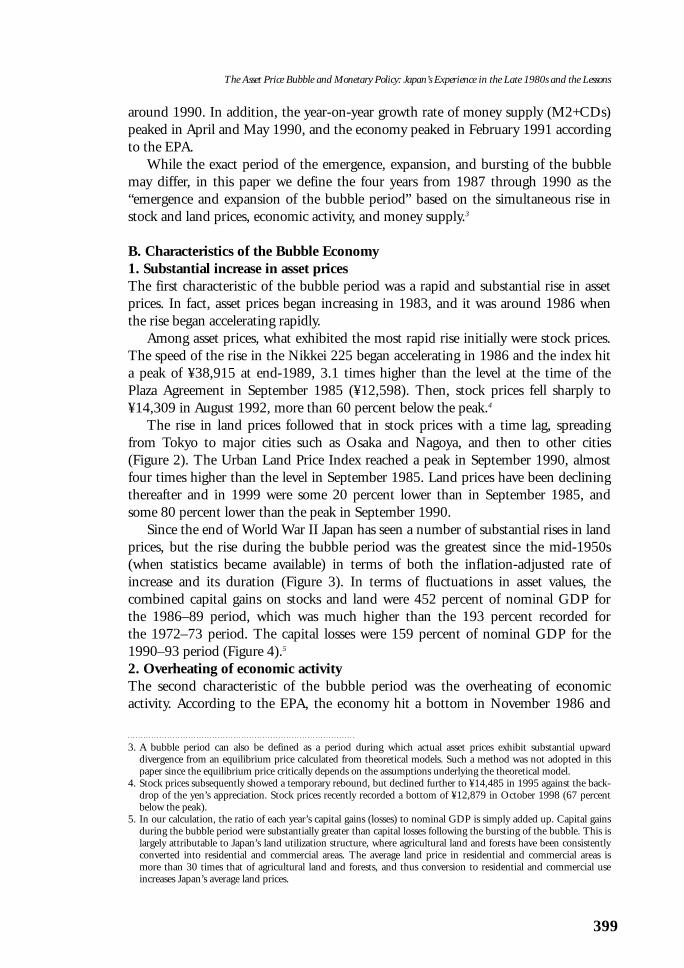
Since the end of World War II Japan has seen a number of substantial rises in landprices, but the rise during the bubble period was the greatest since the mid-1950s(when statistics became available) in terms of both the inflation-adjusted rate ofincrease and its duration (Figure 3). In terms of fluctuations in asset values, the combined capital gains on stocks and land were 452 percent of nominal GDP for the 1986–89 period, which was much higher than the 193 percent recorded for the 1972–73 period. The capital losses were 159 percent of nominal GDP for the1990–93 period (Figure 4).5
2. Overheating of economic activityThe second characteristic of the bubble period was the overheating of economicactivity. According to the EPA, the economy hit a bottom in November 1986 and
399
The Asset Price Bubble and Monetary Policy: Japan’s Experience in the Late 1980s and the Lessons
3. A bubble period can also be defined as a period during which actual asset prices exhibit substantial upward divergence from an equilibrium price calculated from theoretical models. Such a method was not adopted in thispaper since the equilibrium price critically depends on the assumptions underlying the theoretical model.
4. Stock prices subsequently showed a temporary rebound, but declined further to ¥14,485 in 1995 against the back-drop of the yen’s appreciation. Stock prices recently recorded a bottom of ¥12,879 in October 1998 (67 percentbelow the peak).
5. In our calculation, the ratio of each year’s capital gains (losses) to nominal GDP is simply added up. Capital gainsduring the bubble period were substantially greater than capital losses following the bursting of the bubble. This islargely attributable to Japan’s land utilization structure, where agricultural land and forests have been consistentlyconverted into residential and commercial areas. The average land price in residential and commercial areas ismore than 30 times that of agricultural land and forests, and thus conversion to residential and commercial useincreases Japan’s average land prices.
400 MONETARY AND ECONOMIC STUDIES (SPECIAL EDITION)/FEBRUARY 2001
–40
–20
0
20
40
60
80
100Changes from a year earlier, percent
NationwideSix major citiesTokyo
1984 85 86 87 88 89 90 91 92 93 94 95 96 97 98 99
–40
–20
0
20
40
60
80
100Changes from a year earlier, percent
NationwideSix major citiesTokyo
1984 85 86 87 88 89 90 91 92 93 94 95 96 97 98 99
Source: Japan Real Estate Institute, Urban Land Price Index.
[2] Residential Land
Figure 2 Land Prices by Use and Area
Figure 3 Real Land Prices
–30–20–10
010203040506070
581955 61 64 67 70 73 76 79 82 85 88 91 94 97
Nominal growth rateReal growth rate
Changes from a year earlier, percent
Note: Real land prices correspond to the commercial land prices in six major citiesdeflated by the GDP deflator.
Sources: Japan Real Estate Institute, Urban Land Price Index; Economic PlanningAgency, Annual Report on National Accounts.
[1] Commercial Land

401
The Asset Price Bubble and Monetary Policy: Japan’s Experience in the Late 1980s and the Lessons
–100
–50
0
50
100
150
1956 58 60 62 64 66 68 70 72 74 76 78 80 82 84 86 88 90 92 94 96
Ratio to nominal GDP, percent
(+452%)
(–159%)
(+193%)
–100
–50
0
50
100
150
1956 58 60 62 64 66 68 70 72 74 76 78 80 82 84 86 88 90 92 94 96
Ratio to nominal GDP, percent
(+367%)
(–107%)
(+156%)
–100
–50
0
50
100
150
1956 58 60 62 64 66 68 70 72 74 76 78 80 82 84 86 88 90 92 94 96
Ratio to nominal GDP, percent
(+151%)
(–110%)
(+36%)
Figure 4 Capital Gains and Losses
Source: Economic Planning Agency, Annual Report on National Accounts.
[1] Land and Stocks
[2] Land
[3] Stocks
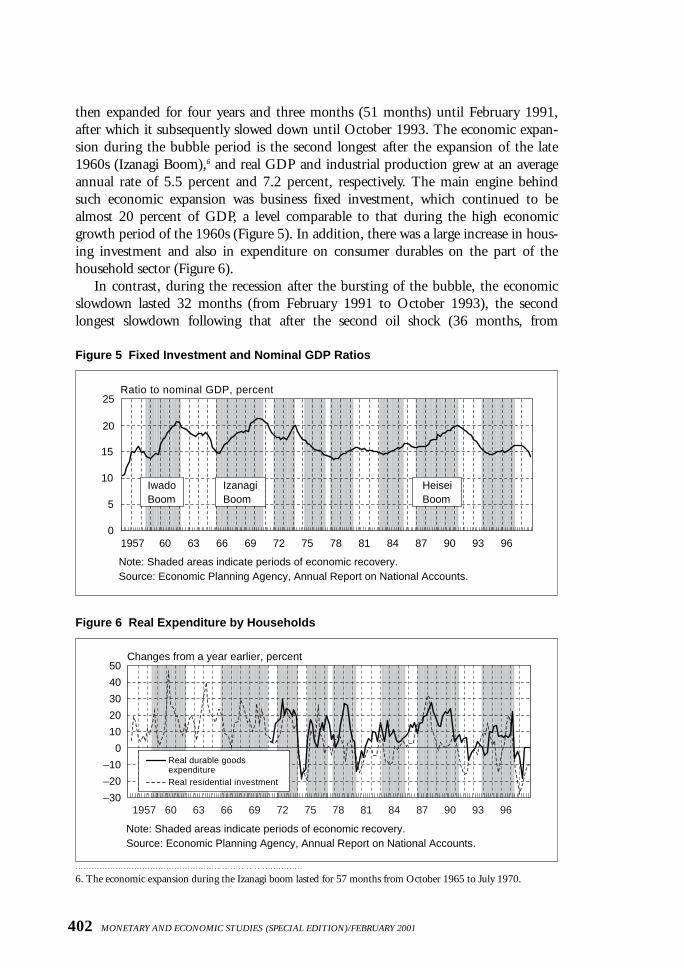
then expanded for four years and three months (51 months) until February 1991,after which it subsequently slowed down until October 1993. The economic expan-sion during the bubble period is the second longest after the expansion of the late1960s (Izanagi Boom),6 and real GDP and industrial production grew at an averageannual rate of 5.5 percent and 7.2 percent, respectively. The main engine behindsuch economic expansion was business fixed investment, which continued to bealmost 20 percent of GDP, a level comparable to that during the high economicgrowth period of the 1960s (Figure 5). In addition, there was a large increase in hous-ing investment and also in expenditure on consumer durables on the part of thehousehold sector (Figure 6).
In contrast, during the recession after the bursting of the bubble, the economicslowdown lasted 32 months (from February 1991 to October 1993), the secondlongest slowdown following that after the second oil shock (36 months, from
402 MONETARY AND ECONOMIC STUDIES (SPECIAL EDITION)/FEBRUARY 2001
Figure 5 Fixed Investment and Nominal GDP Ratios
0
5
1957 60 63 66 69 72 75 78 81 84 87 90 93 96
10
15
20
25Ratio to nominal GDP, percent
IwadoBoom
IzanagiBoom
HeiseiBoom
Figure 6 Real Expenditure by Households
Real durable goodsexpenditureReal residential investment
–30
–20
–10
0
10
20
30
40
50Changes from a year earlier, percent
1957 60 63 66 69 72 75 78 81 84 87 90 93 96
6. The economic expansion during the Izanagi boom lasted for 57 months from October 1965 to July 1970.
Note: Shaded areas indicate periods of economic recovery.Source: Economic Planning Agency, Annual Report on National Accounts.
Note: Shaded areas indicate periods of economic recovery.Source: Economic Planning Agency, Annual Report on National Accounts.
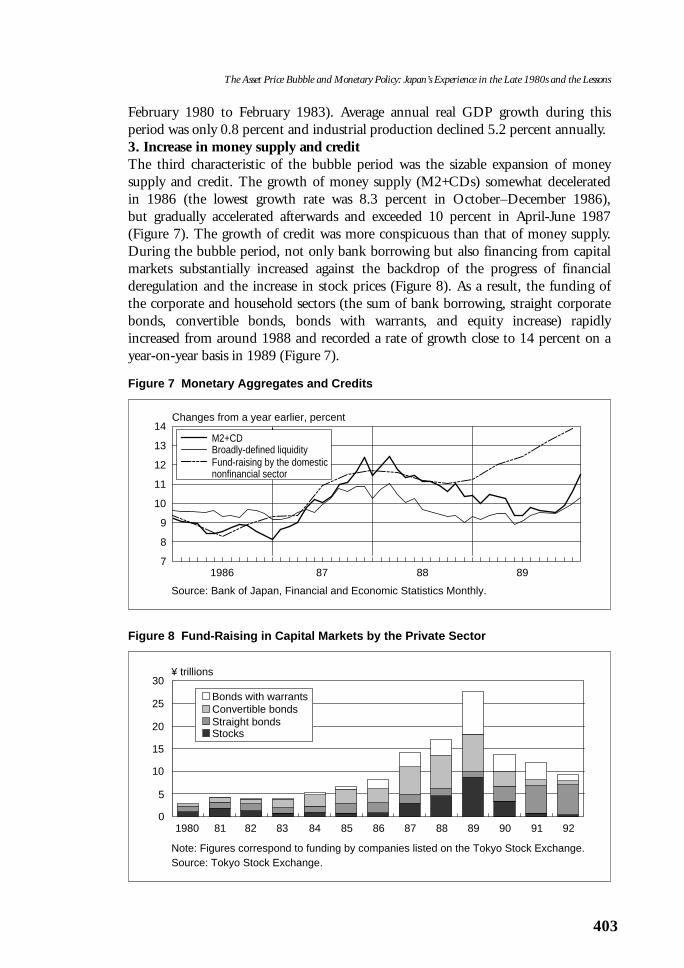
February 1980 to February 1983). Average annual real GDP growth during thisperiod was only 0.8 percent and industrial production declined 5.2 percent annually.3. Increase in money supply and creditThe third characteristic of the bubble period was the sizable expansion of money supply and credit. The growth of money supply (M2+CDs) somewhat decelerated in 1986 (the lowest growth rate was 8.3 percent in October–December 1986), but gradually accelerated afterwards and exceeded 10 percent in April-June 1987(Figure 7). The growth of credit was more conspicuous than that of money supply.During the bubble period, not only bank borrowing but also financing from capitalmarkets substantially increased against the backdrop of the progress of financialderegulation and the increase in stock prices (Figure 8). As a result, the funding ofthe corporate and household sectors (the sum of bank borrowing, straight corporatebonds, convertible bonds, bonds with warrants, and equity increase) rapidlyincreased from around 1988 and recorded a rate of growth close to 14 percent on ayear-on-year basis in 1989 (Figure 7).
403
The Asset Price Bubble and Monetary Policy: Japan’s Experience in the Late 1980s and the Lessons
Figure 7 Monetary Aggregates and Credits
7
8
9
10
11
12
13
14
1986 87 88 89
Changes from a year earlier, percent
M2+CDBroadly-defined liquidityFund-raising by the domesticnonfinancial sector
Figure 8 Fund-Raising in Capital Markets by the Private Sector
0
5
10
15
20
25
30
1980 81 82 83 84 85 86 87 88 89 90 91 92
¥ trillions
Bonds with warrantsConvertible bondsStraight bondsStocks
Source: Bank of Japan, Financial and Economic Statistics Monthly.
Note: Figures correspond to funding by companies listed on the Tokyo Stock Exchange.Source: Tokyo Stock Exchange.

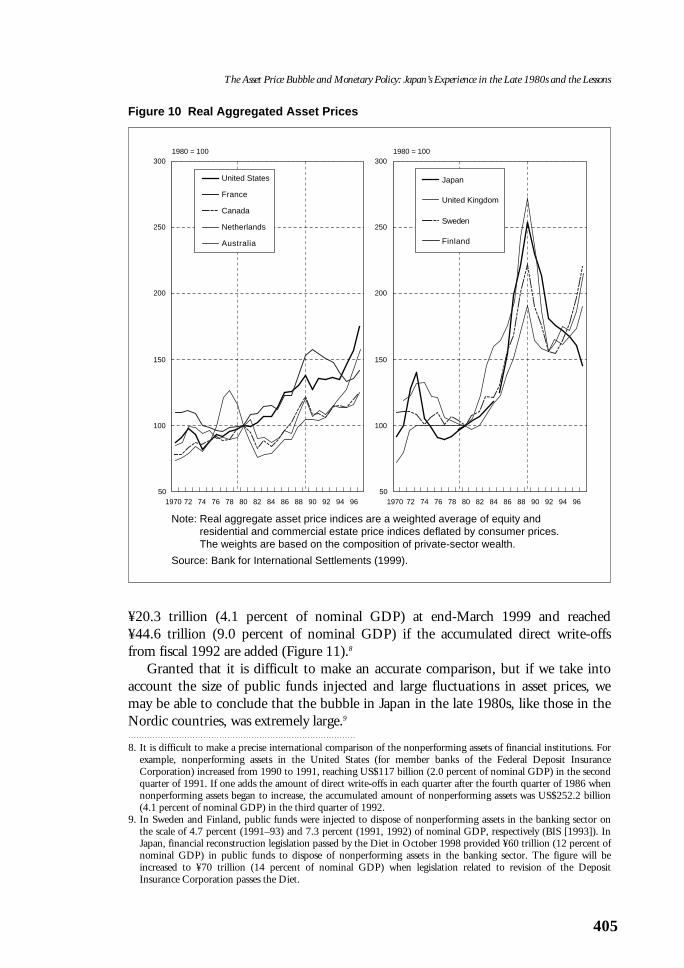
C. Size of Japan’s Bubble EconomyFrom the latter half of the 1980s, a bubble economy emerged not only in Japan butalso in other industrial countries. Indeed, economic and financial history both athome and abroad shows that bubbles have often emerged. Thus, to put the size ofthe bubble economy in Japan into perspective, it may be useful to compare it withbubbles in other industrial countries in the 1980s as well as the experience in Japanafter World War I (WWI).1. Comparison with overseas episodesLooking at the experience of major countries from the latter half of the 1980s, stockprices started to rise from around 1983 and, until mid-1987, it was not necessarily thecase that such a rise was only conspicuous in Japan (Figure 9). However, from 1988 thestock price rise in Japan began to stand out internationally. Borio et al. (1994) concluded that the rate of increase in real asset prices (both stock and land prices) inJapan was quite high as were the increases in Sweden and Finland (Figure 10).7
From the latter half of the 1980s, Japan experienced the largest fluctuation in economic activity among industrial countries. Though the timing of the bubbleperiod differs slightly from country to country, when one compares economic growthof the G-7 countries between 1986–90 (the bubble period) and 1991–95 (the bursting of the bubble period) its fluctuation was the largest in Japan.
Many countries had observed an increase in nonperforming assets since the latterhalf of the 1980s, among which the nonperforming assets of Japanese financial institutions were the largest. Nonperforming assets of major Japanese banks were
404 MONETARY AND ECONOMIC STUDIES (SPECIAL EDITION)/FEBRUARY 2001
Figure 9 International Comparison of Stock Price Movements
–0.5
0.0
0.5
1.0
1.5
2.0
2.5
3.0
1982 83 84 85 86 87 88 89 90 91 92 93 94 95 96 97 98 99
End-1981 = 0 log-scale
MSCI/WorldNikkei 225New York Dow
7. Real aggregate asset prices estimated by Borio et al. (1994) were updated until 1997 by BIS (1999). The prices arethe weighted average of equity and residential and commercial real estate price indices deflated by consumer priceswith the weights based on the composition of private-sector wealth.
Note: MSCI/World corresponds to aggregated stock price index in 22 industrializedcountries compiled by Morgan Stanley Capital International.
Sources: Bank of Japan, Financial and Economic Statistics Monthly; Morgan StanleyCapital International (http://www.msci.com).
405
The Asset Price Bubble and Monetary Policy: Japan’s Experience in the Late 1980s and the Lessons
Figure 10 Real Aggregated Asset Prices
United States
France
Canada
Netherlands
Australia
50
100
150
200
250
300
1970 72 74 76 78 80 82 84 86 88 90 92 94 96
1980 = 100
50
100
150
200
250
300
1970 72 74 76 78 80 82 84 86 88 90 92 94 96
1980 = 100
Japan
United Kingdom
Sweden
Finland
8. It is difficult to make a precise international comparison of the nonperforming assets of financial institutions. Forexample, nonperforming assets in the United States (for member banks of the Federal Deposit InsuranceCorporation) increased from 1990 to 1991, reaching US$117 billion (2.0 percent of nominal GDP) in the secondquarter of 1991. If one adds the amount of direct write-offs in each quarter after the fourth quarter of 1986 whennonperforming assets began to increase, the accumulated amount of nonperforming assets was US$252.2 billion(4.1 percent of nominal GDP) in the third quarter of 1992.
9. In Sweden and Finland, public funds were injected to dispose of nonperforming assets in the banking sector onthe scale of 4.7 percent (1991–93) and 7.3 percent (1991, 1992) of nominal GDP, respectively (BIS [1993]). InJapan, financial reconstruction legislation passed by the Diet in October 1998 provided ¥60 trillion (12 percent ofnominal GDP) in public funds to dispose of nonperforming assets in the banking sector. The figure will beincreased to ¥70 trillion (14 percent of nominal GDP) when legislation related to revision of the DepositInsurance Corporation passes the Diet.
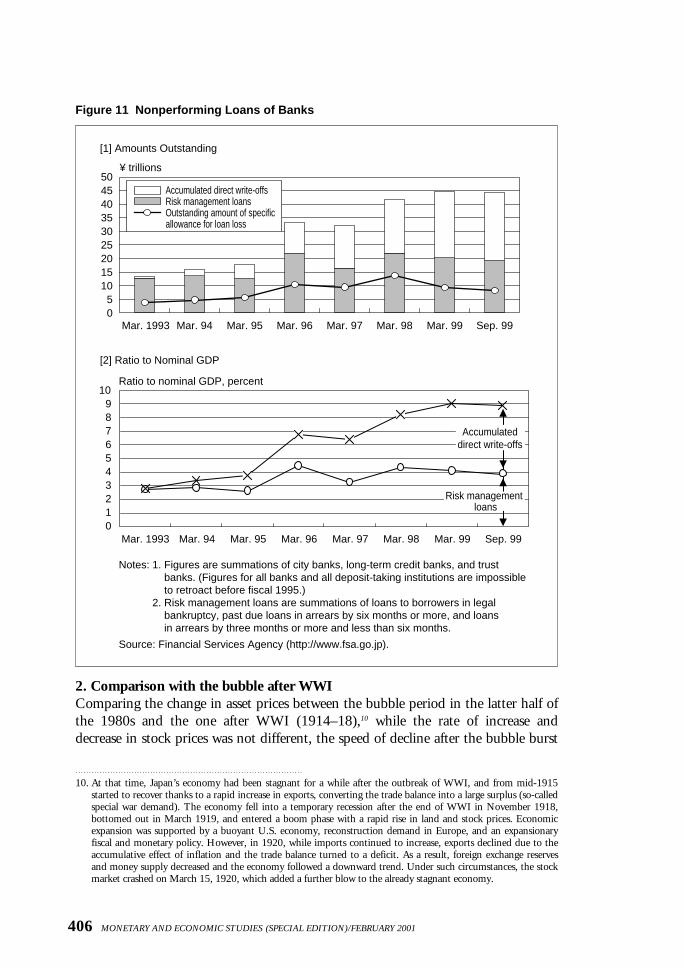
¥20.3 trillion (4.1 percent of nominal GDP) at end-March 1999 and reached ¥44.6 trillion (9.0 percent of nominal GDP) if the accumulated direct write-offsfrom fiscal 1992 are added (Figure 11).8
Granted that it is difficult to make an accurate comparison, but if we take intoaccount the size of public funds injected and large fluctuations in asset prices, wemay be able to conclude that the bubble in Japan in the late 1980s, like those in theNordic countries, was extremely large.9
Note: Real aggregate asset price indices are a weighted average of equity and residential and commercial estate price indices deflated by consumer prices. The weights are based on the composition of private-sector wealth.
Source: Bank for International Settlements (1999).
2. Comparison with the bubble after WWIComparing the change in asset prices between the bubble period in the latter half ofthe 1980s and the one after WWI (1914–18),10 while the rate of increase anddecrease in stock prices was not different, the speed of decline after the bubble burst
406 MONETARY AND ECONOMIC STUDIES (SPECIAL EDITION)/FEBRUARY 2001
10. At that time, Japan’s economy had been stagnant for a while after the outbreak of WWI, and from mid-1915started to recover thanks to a rapid increase in exports, converting the trade balance into a large surplus (so-calledspecial war demand). The economy fell into a temporary recession after the end of WWI in November 1918,bottomed out in March 1919, and entered a boom phase with a rapid rise in land and stock prices. Economicexpansion was supported by a buoyant U.S. economy, reconstruction demand in Europe, and an expansionaryfiscal and monetary policy. However, in 1920, while imports continued to increase, exports declined due to theaccumulative effect of inflation and the trade balance turned to a deficit. As a result, foreign exchange reservesand money supply decreased and the economy followed a downward trend. Under such circumstances, the stockmarket crashed on March 15, 1920, which added a further blow to the already stagnant economy.
Figure 11 Nonperforming Loans of Banks
05
101520253035404550
Mar. 1993 Mar. 94 Mar. 95 Mar. 96 Mar. 97 Mar. 98 Mar. 99 Sep. 99
¥ trillions
Accumulated direct write-offsRisk management loansOutstanding amount of specific allowance for loan loss
[2] Ratio to Nominal GDP
Ratio to nominal GDP, percent
0123456789
10
Mar. 1993 Mar. 94 Mar. 95 Mar. 96 Mar. 97 Mar. 98 Mar. 99 Sep. 99
Risk managementloans
Accumulateddirect write-offs
Notes: 1. Figures are summations of city banks, long-term credit banks, and trustbanks. (Figures for all banks and all deposit-taking institutions are impossibleto retroact before fiscal 1995.)
2. Risk management loans are summations of loans to borrowers in legal bankruptcy, past due loans in arrears by six months or more, and loans in arrears by three months or more and less than six months.
Source: Financial Services Agency (http://www.fsa.go.jp).
[1] Amounts Outstanding
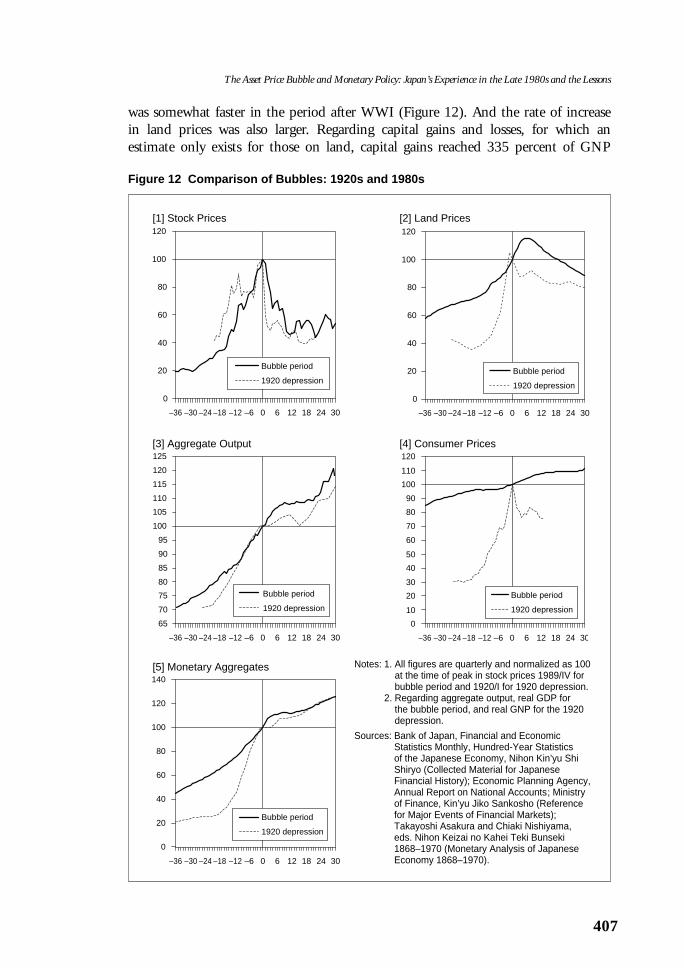
was somewhat faster in the period after WWI (Figure 12). And the rate of increase in land prices was also larger. Regarding capital gains and losses, for which an estimate only exists for those on land, capital gains reached 335 percent of GNP
407
The Asset Price Bubble and Monetary Policy: Japan’s Experience in the Late 1980s and the Lessons
Figure 12 Comparison of Bubbles: 1920s and 1980s
0
20
40
60
80
100
120
–36 –30 –24 –18 –12 –6 0 6 12 18 24 30
Bubble period
1920 depression
Notes: 1. All figures are quarterly and normalized as 100at the time of peak in stock prices 1989/IV forbubble period and 1920/I for 1920 depression.
2. Regarding aggregate output, real GDP for the bubble period, and real GNP for the 1920depression.
Sources: Bank of Japan, Financial and EconomicStatistics Monthly, Hundred-Year Statistics of the Japanese Economy, Nihon Kin’yu ShiShiryo (Collected Material for JapaneseFinancial History); Economic Planning Agency,Annual Report on National Accounts; Ministryof Finance, Kin’yu Jiko Sankosho (Referencefor Major Events of Financial Markets);Takayoshi Asakura and Chiaki Nishiyama, eds. Nihon Keizai no Kahei Teki Bunseki1868–1970 (Monetary Analysis of JapaneseEconomy 1868–1970).
[1] Stock Prices
0
20
40
60
80
100
120
–36 –30 –24 –18 –12 –6 0 6 12 18 24 30
Bubble period
1920 depression
[2] Land Prices
–36 –30 –24 –18 –12 –6 0 6 12 18 24 30
Bubble period
1920 depression
65
70
75
80
85
90
95
100
105
110
115
120
125[3] Aggregate Output
–36 –30 –24 –18 –12 –6 0 6 12 18 24 30
Bubble period
1920 depression
0
20
40
60
80
100
120
140[5] Monetary Aggregates
0
20
40
30
10
60
50
80
70
100
90
120
110
–36 –30 –24 –18 –12 –6 0 6 12 18 24 30
Bubble period
1920 depression
[4] Consumer Prices
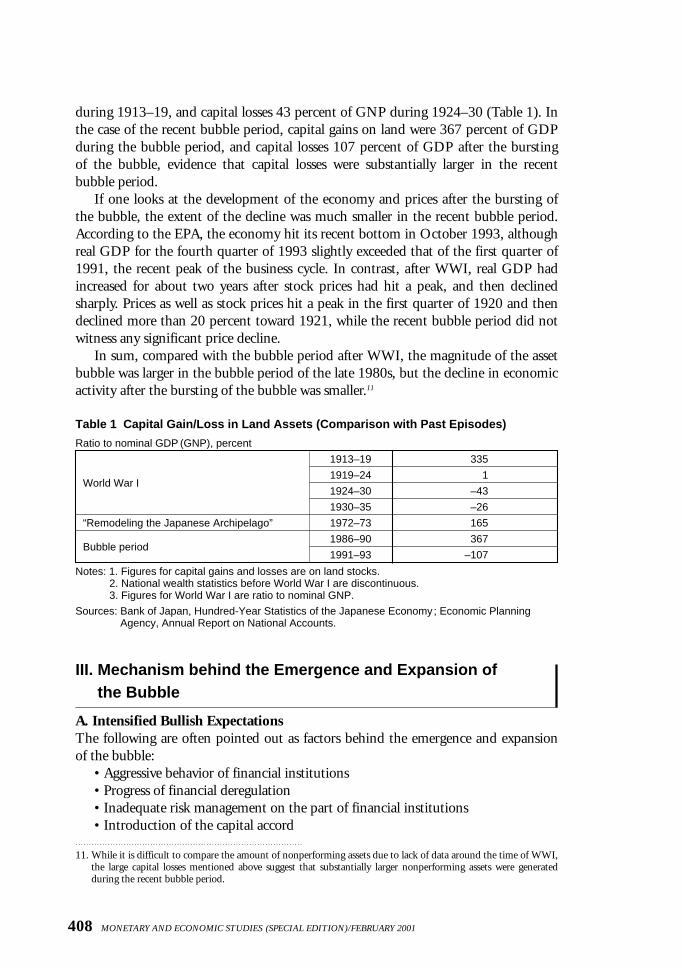
during 1913–19, and capital losses 43 percent of GNP during 1924–30 (Table 1). Inthe case of the recent bubble period, capital gains on land were 367 percent of GDPduring the bubble period, and capital losses 107 percent of GDP after the bursting of the bubble, evidence that capital losses were substantially larger in the recent bubble period.
If one looks at the development of the economy and prices after the bursting ofthe bubble, the extent of the decline was much smaller in the recent bubble period.According to the EPA, the economy hit its recent bottom in October 1993, althoughreal GDP for the fourth quarter of 1993 slightly exceeded that of the first quarter of1991, the recent peak of the business cycle. In contrast, after WWI, real GDP hadincreased for about two years after stock prices had hit a peak, and then declinedsharply. Prices as well as stock prices hit a peak in the first quarter of 1920 and thendeclined more than 20 percent toward 1921, while the recent bubble period did notwitness any significant price decline.
In sum, compared with the bubble period after WWI, the magnitude of the assetbubble was larger in the bubble period of the late 1980s, but the decline in economicactivity after the bursting of the bubble was smaller.11
408 MONETARY AND ECONOMIC STUDIES (SPECIAL EDITION)/FEBRUARY 2001
Table 1 Capital Gain/Loss in Land Assets (Comparison with Past Episodes)
Ratio to nominal GDP (GNP), percent
1913–19 335
World War I1919–24 1
1924–30 –43
1930–35 –26
“Remodeling the Japanese Archipelago” 1972–73 165
Bubble period1986–90 367
1991–93 –107
Notes: 1. Figures for capital gains and losses are on land stocks.2. National wealth statistics before World War I are discontinuous.3. Figures for World War I are ratio to nominal GNP.
Sources: Bank of Japan, Hundred-Year Statistics of the Japanese Economy ; Economic PlanningAgency, Annual Report on National Accounts.
11. While it is difficult to compare the amount of nonperforming assets due to lack of data around the time of WWI,the large capital losses mentioned above suggest that substantially larger nonperforming assets were generatedduring the recent bubble period.
III. Mechanism behind the Emergence and Expansion of the Bubble
A. Intensified Bullish ExpectationsThe following are often pointed out as factors behind the emergence and expansionof the bubble:
• Aggressive behavior of financial institutions• Progress of financial deregulation• Inadequate risk management on the part of financial institutions• Introduction of the capital accord
• Protracted monetary easing• Taxation and regulations biased toward accelerating the rise in land prices• Overconfidence and euphoria• Over-concentration of economic functions on Tokyo, and Tokyo becoming an
international financial centerThese factors are not necessarily mutually exclusive, but interrelated. In this
regard, we are often tempted to ask: among these factors, can we single out the mostimportant and fundamental factor to explain the emergence and expansion of thebubble? Unfortunately, there is no simple answer to this question. Our experienceafter the late 1980s tells us that realities cannot be explained by any one factor.
Our conclusion is that no single factor was responsible for generating the bubble.Rather, we believe that when several initial factors changed, there existed certain factors amplifying such changes, which led to the emergence and expansion of thebubble. The bubble was generated by the complex interaction of various factors in asimilar way as in a chemical reaction. The process of such a chemical reaction couldbe termed the process of “intensified bullish expectations.”
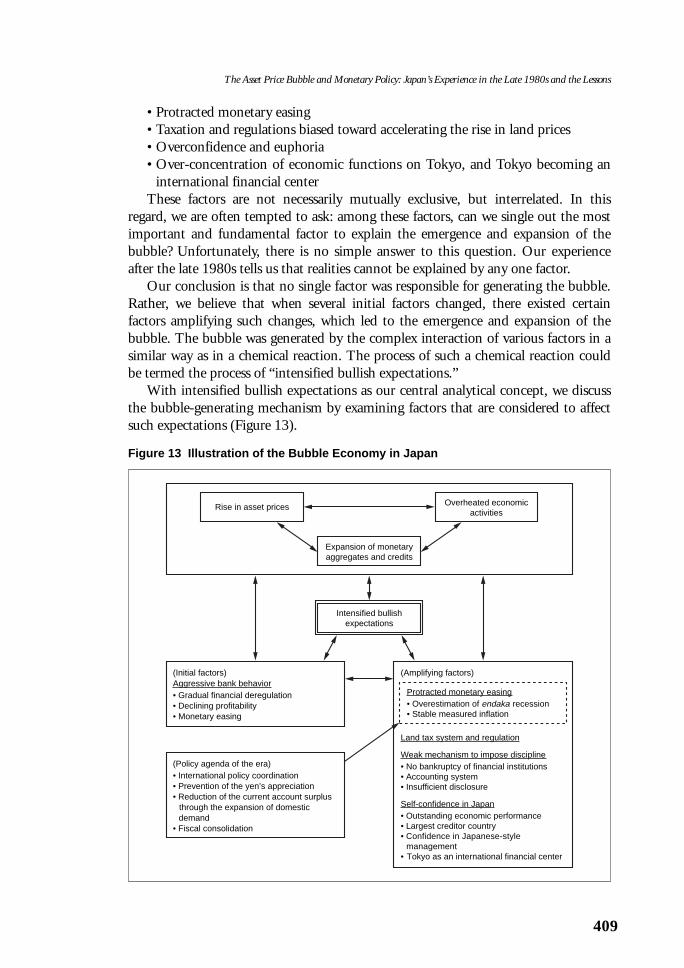
With intensified bullish expectations as our central analytical concept, we discussthe bubble-generating mechanism by examining factors that are considered to affectsuch expectations (Figure 13).
409
The Asset Price Bubble and Monetary Policy: Japan’s Experience in the Late 1980s and the Lessons
Rise in asset prices Overheated economic activities
Expansion of monetary aggregates and credits
Intensified bullish expectations
(Initial factors)Aggressive bank behavior• Gradual financial deregulation• Declining profitability• Monetary easing
(Amplifying factors)
Protracted monetary easing• Overestimation of endaka recession• Stable measured inflation
Land tax system and regulation
Weak mechanism to impose discipline• No bankruptcy of financial institutions• Accounting system• Insufficient disclosure
Self-confidence in Japan• Outstanding economic performance• Largest creditor country• Confidence in Japanese-style management• Tokyo as an international financial center
(Policy agenda of the era)• International policy coordination• Prevention of the yen’s appreciation• Reduction of the current account surplus through the expansion of domestic demand• Fiscal consolidation
Figure 13 Illustration of the Bubble Economy in Japan
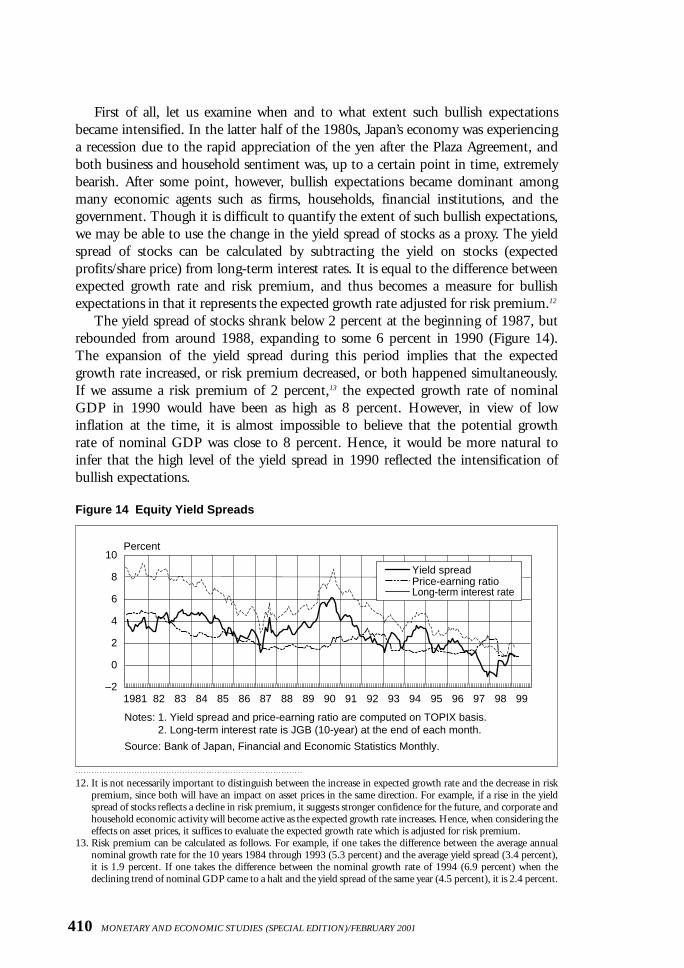
First of all, let us examine when and to what extent such bullish expectationsbecame intensified. In the latter half of the 1980s, Japan’s economy was experiencing a recession due to the rapid appreciation of the yen after the Plaza Agreement, andboth business and household sentiment was, up to a certain point in time, extremely bearish. After some point, however, bullish expectations became dominant amongmany economic agents such as firms, households, financial institutions, and the government. Though it is difficult to quantify the extent of such bullish expectations,we may be able to use the change in the yield spread of stocks as a proxy. The yieldspread of stocks can be calculated by subtracting the yield on stocks (expected profits/share price) from long-term interest rates. It is equal to the difference betweenexpected growth rate and risk premium, and thus becomes a measure for bullish expectations in that it represents the expected growth rate adjusted for risk premium.12
The yield spread of stocks shrank below 2 percent at the beginning of 1987, butrebounded from around 1988, expanding to some 6 percent in 1990 (Figure 14).The expansion of the yield spread during this period implies that the expectedgrowth rate increased, or risk premium decreased, or both happened simultaneously.If we assume a risk premium of 2 percent,13 the expected growth rate of nominalGDP in 1990 would have been as high as 8 percent. However, in view of low inflation at the time, it is almost impossible to believe that the potential growth rate of nominal GDP was close to 8 percent. Hence, it would be more natural toinfer that the high level of the yield spread in 1990 reflected the intensification ofbullish expectations.
410 MONETARY AND ECONOMIC STUDIES (SPECIAL EDITION)/FEBRUARY 2001
12. It is not necessarily important to distinguish between the increase in expected growth rate and the decrease in riskpremium, since both will have an impact on asset prices in the same direction. For example, if a rise in the yieldspread of stocks reflects a decline in risk premium, it suggests stronger confidence for the future, and corporate andhousehold economic activity will become active as the expected growth rate increases. Hence, when considering theeffects on asset prices, it suffices to evaluate the expected growth rate which is adjusted for risk premium.
13. Risk premium can be calculated as follows. For example, if one takes the difference between the average annualnominal growth rate for the 10 years 1984 through 1993 (5.3 percent) and the average yield spread (3.4 percent),it is 1.9 percent. If one takes the difference between the nominal growth rate of 1994 (6.9 percent) when the declining trend of nominal GDP came to a halt and the yield spread of the same year (4.5 percent), it is 2.4 percent.
Figure 14 Equity Yield Spreads
–2
0
2
4
6
8
10
1981 82 83 84 85 86 87 88 89 90 91 92 93 94 95 96 97 98 99
Percent
Yield spreadPrice-earning ratioLong-term interest rate
Notes: 1. Yield spread and price-earning ratio are computed on TOPIX basis.2. Long-term interest rate is JGB (10-year) at the end of each month.
Source: Bank of Japan, Financial and Economic Statistics Monthly.
B. Factors behind the BubbleThrough what mechanism was the bubble generated? With focus on intensified bullish expectations, we examine the following five factors that are considered important: aggressive bank behavior, protracted monetary easing, taxation and regulations biased toward accelerating the rise in land prices, a weak mechanism toimpose discipline, and the effect of overconfidence in Japan.14 Though these five factors are mutually interrelated, if we dare to point the finger at one, it would likelybe the aggressive behavior of financial institutions, which indeed many consider to bethe initial underlying factor behind the emergence of the bubble, while the other fourfactors amplified changes in such behavior.1. Aggressive bank behaviorThe first factor that generated the bubble was the aggressive behavior of financial institutions. After 1987–88, it was clear that the behavior of financial institutionsbecame extremely aggressive. If looked at more closely, such aggressive behavior on thepart of financial institutions did not suddenly appear in the process of monetary easingin the latter half of the 1980s, but rather had already gradually started around 1983.a. Gradual financial deregulation and declining profitability of financial
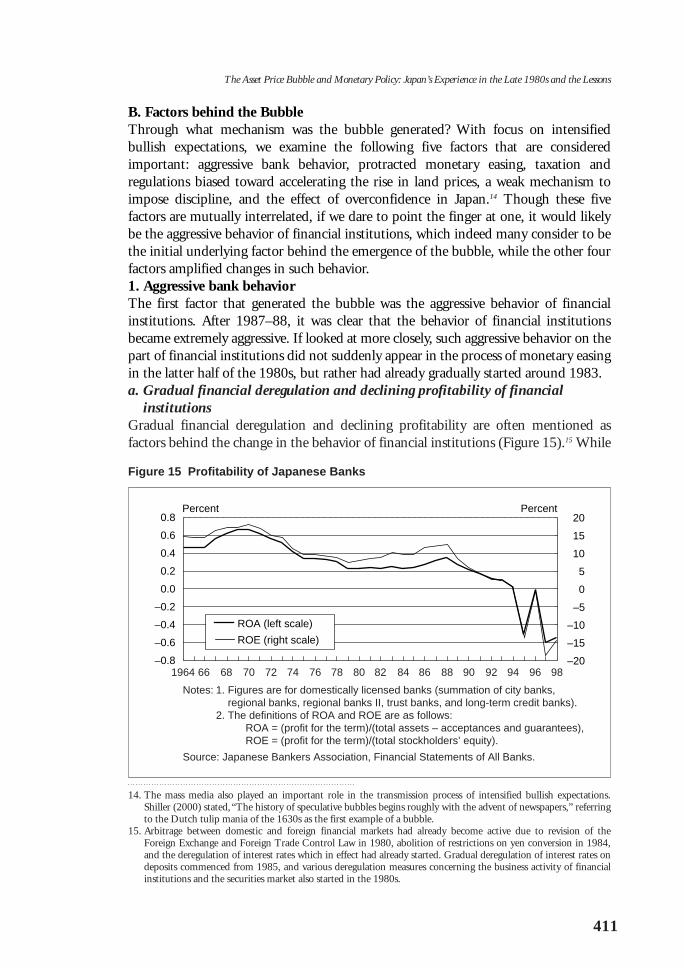
institutionsGradual financial deregulation and declining profitability are often mentioned as factors behind the change in the behavior of financial institutions (Figure 15).15 While
411
The Asset Price Bubble and Monetary Policy: Japan’s Experience in the Late 1980s and the Lessons
14. The mass media also played an important role in the transmission process of intensified bullish expectations.Shiller (2000) stated, “The history of speculative bubbles begins roughly with the advent of newspapers,” referringto the Dutch tulip mania of the 1630s as the first example of a bubble.
15. Arbitrage between domestic and foreign financial markets had already become active due to revision of theForeign Exchange and Foreign Trade Control Law in 1980, abolition of restrictions on yen conversion in 1984,and the deregulation of interest rates which in effect had already started. Gradual deregulation of interest rates ondeposits commenced from 1985, and various deregulation measures concerning the business activity of financialinstitutions and the securities market also started in the 1980s.
Figure 15 Profitability of Japanese Banks
–0.8
–0.6
–0.4
–0.2
0.0
0.2
0.4
0.6
0.8
–20
–15
–10
–5
0
5
10
15
20
ROA (left scale)
ROE (right scale)
Percent Percent
1964 66 68 70 72 74 76 78 80 82 84 86 88 90 92 94 96 98
Notes: 1. Figures are for domestically licensed banks (summation of city banks,regional banks, regional banks II, trust banks, and long-term credit banks).
2. The definitions of ROA and ROE are as follows:ROA = (profit for the term)/(total assets – acceptances and guarantees),ROE = (profit for the term)/(total stockholders’ equity).
Source: Japanese Bankers Association, Financial Statements of All Banks.
restrictions on fund-raising in the securities market by firms were removed from around1980, banks were only allowed phased entry into the securities business and were veryconcerned that major firms would become less dependent on them for funding.
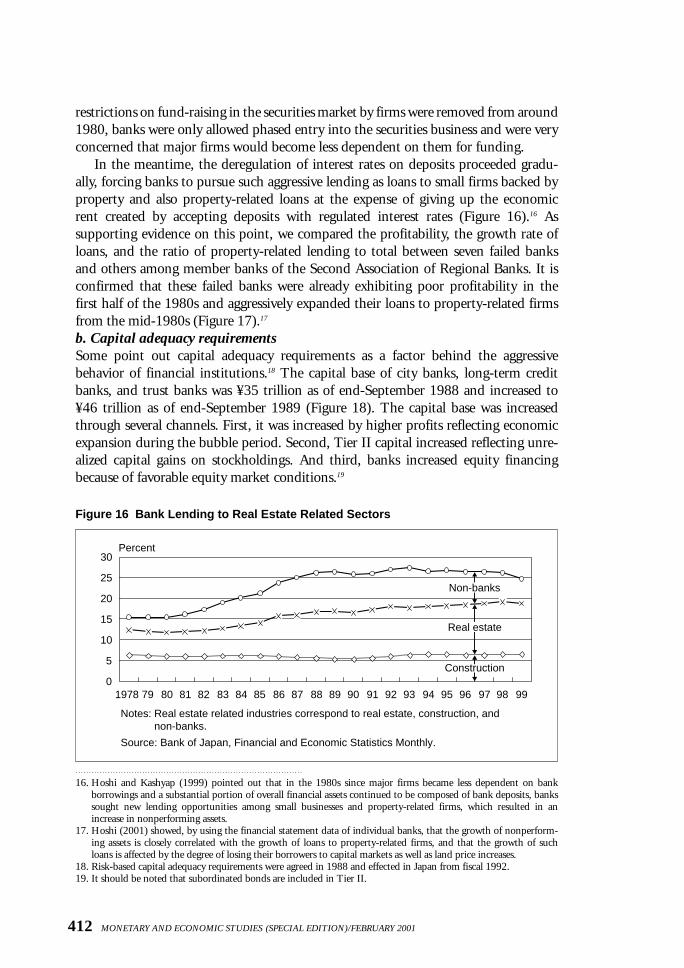
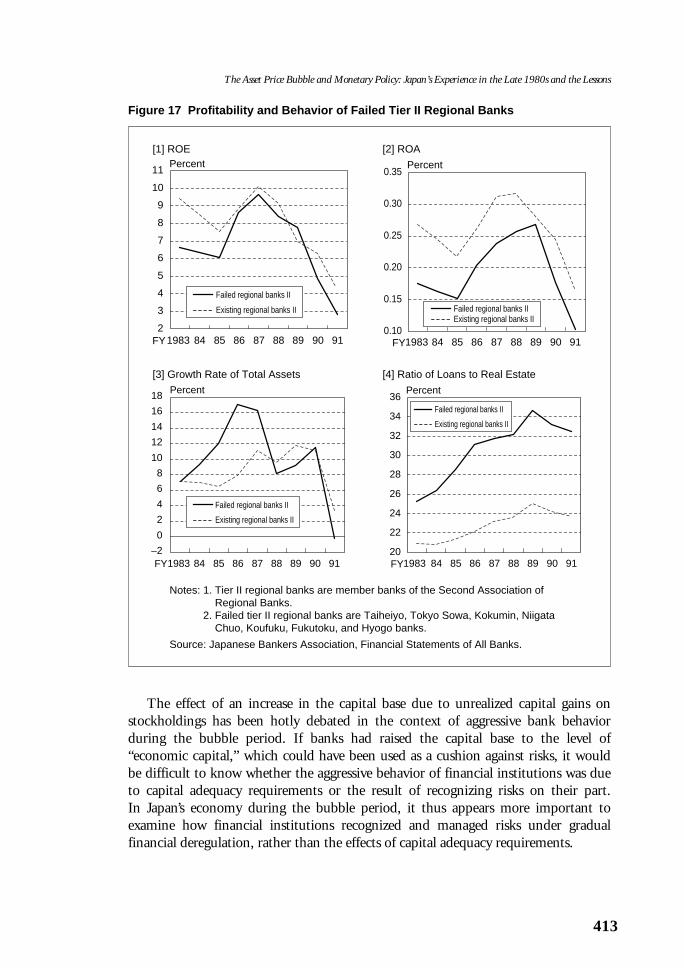
In the meantime, the deregulation of interest rates on deposits proceeded gradu-ally, forcing banks to pursue such aggressive lending as loans to small firms backed byproperty and also property-related loans at the expense of giving up the economicrent created by accepting deposits with regulated interest rates (Figure 16).16 As supporting evidence on this point, we compared the profitability, the growth rate ofloans, and the ratio of property-related lending to total between seven failed banksand others among member banks of the Second Association of Regional Banks. It isconfirmed that these failed banks were already exhibiting poor profitability in thefirst half of the 1980s and aggressively expanded their loans to property-related firmsfrom the mid-1980s (Figure 17).17
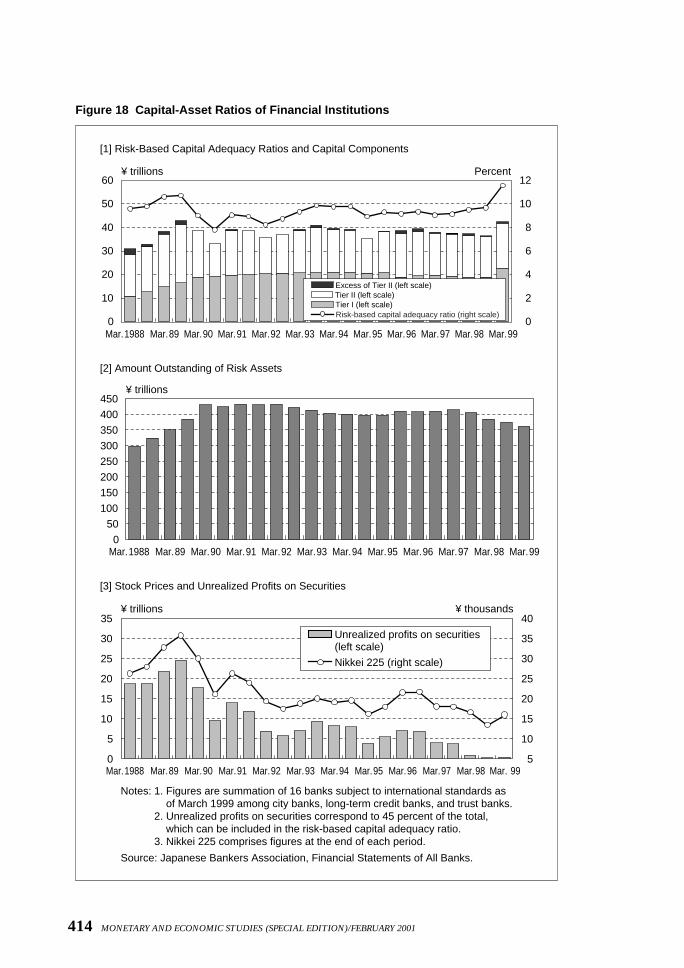
b. Capital adequacy requirementsSome point out capital adequacy requirements as a factor behind the aggressivebehavior of financial institutions.18 The capital base of city banks, long-term creditbanks, and trust banks was ¥35 trillion as of end-September 1988 and increased to¥46 trillion as of end-September 1989 (Figure 18). The capital base was increasedthrough several channels. First, it was increased by higher profits reflecting economicexpansion during the bubble period. Second, Tier II capital increased reflecting unre-alized capital gains on stockholdings. And third, banks increased equity financingbecause of favorable equity market conditions.19
412 MONETARY AND ECONOMIC STUDIES (SPECIAL EDITION)/FEBRUARY 2001
16. Hoshi and Kashyap (1999) pointed out that in the 1980s since major firms became less dependent on bank borrowings and a substantial portion of overall financial assets continued to be composed of bank deposits, bankssought new lending opportunities among small businesses and property-related firms, which resulted in anincrease in nonperforming assets.
17. Hoshi (2001) showed, by using the financial statement data of individual banks, that the growth of nonperform-ing assets is closely correlated with the growth of loans to property-related firms, and that the growth of suchloans is affected by the degree of losing their borrowers to capital markets as well as land price increases.
18. Risk-based capital adequacy requirements were agreed in 1988 and effected in Japan from fiscal 1992.19. It should be noted that subordinated bonds are included in Tier II.
Figure 16 Bank Lending to Real Estate Related Sectors
0
5
10
15
20
25
30
1978 79 80 81 82 83 84 85 86 87 88 89 90 91 92 93 94 95 96 97 98 99
Percent
Construction
Real estate
Non-banks
Notes: Real estate related industries correspond to real estate, construction, and non-banks.
Source: Bank of Japan, Financial and Economic Statistics Monthly.
The effect of an increase in the capital base due to unrealized capital gains onstockholdings has been hotly debated in the context of aggressive bank behavior during the bubble period. If banks had raised the capital base to the level of “economic capital,” which could have been used as a cushion against risks, it would be difficult to know whether the aggressive behavior of financial institutions was dueto capital adequacy requirements or the result of recognizing risks on their part. In Japan’s economy during the bubble period, it thus appears more important toexamine how financial institutions recognized and managed risks under gradualfinancial deregulation, rather than the effects of capital adequacy requirements.
413
The Asset Price Bubble and Monetary Policy: Japan’s Experience in the Late 1980s and the Lessons
Figure 17 Profitability and Behavior of Failed Tier II Regional Banks
2
3
4
5
6
7
8
9
1983 84 85 86 87 88 89 90 91
Percent
FY
Failed regional banks II
Existing regional banks II
10
11
Notes: 1. Tier II regional banks are member banks of the Second Association ofRegional Banks.
2. Failed tier II regional banks are Taiheiyo, Tokyo Sowa, Kokumin, NiigataChuo, Koufuku, Fukutoku, and Hyogo banks.
Source: Japanese Bankers Association, Financial Statements of All Banks.
[1] ROE
1983 84 85 86 87 88 89 90 91
Percent
FY
Failed regional banks IIExisting regional banks II
0.10
0.15
0.20
0.25
0.30
0.35
[2] ROA
1983 84 85 86 87 88 89 90 91
Percent
FY
Failed regional banks II
Existing regional banks II
–2
0
2
4
6
8
10
12
14
16
18
[3] Growth Rate of Total Assets
1983 84 85 86 87 88 89 90 91
Percent
FY
Failed regional banks II
Existing regional banks II
20
22
24
26
28
30
32
34
36
[4] Ratio of Loans to Real Estate
414 MONETARY AND ECONOMIC STUDIES (SPECIAL EDITION)/FEBRUARY 2001
Figure 18 Capital-Asset Ratios of Financial Institutions
0
10
20
30
40
50
60¥ trillions Percent
0
2
4
6
8
10
12
Mar. 1988 Mar. 89 Mar. 90 Mar. 91 Mar. 92 Mar. 93 Mar. 94 Mar. 95 Mar. 96 Mar. 97 Mar. 98 Mar. 99
Excess of Tier II (left scale)Tier II (left scale)Tier I (left scale)Risk-based capital adequacy ratio (right scale)
[2] Amount Outstanding of Risk Assets
0
50
100
150
200
250
300
350
400
450¥ trillions
Mar. 1988 Mar. 89 Mar. 90 Mar. 91 Mar. 92 Mar. 93 Mar. 94 Mar. 95 Mar. 96 Mar. 97 Mar. 98 Mar. 99
[3] Stock Prices and Unrealized Profits on Securities
0
5
10
15
20
25
30
35
Mar. 1988 Mar. 89 Mar. 90 Mar. 91 Mar. 92 Mar. 93 Mar. 94 Mar. 95 Mar. 96 Mar. 97 Mar. 98 Mar. 99 5
10
15
20
25
30
35
40¥ thousands
Unrealized profits on securities(left scale)
Nikkei 225 (right scale)
¥ trillions
Notes: 1. Figures are summation of 16 banks subject to international standards asof March 1999 among city banks, long-term credit banks, and trust banks.
2. Unrealized profits on securities correspond to 45 percent of the total,which can be included in the risk-based capital adequacy ratio.
3. Nikkei 225 comprises figures at the end of each period.
Source: Japanese Bankers Association, Financial Statements of All Banks.
[1] Risk-Based Capital Adequacy Ratios and Capital Components
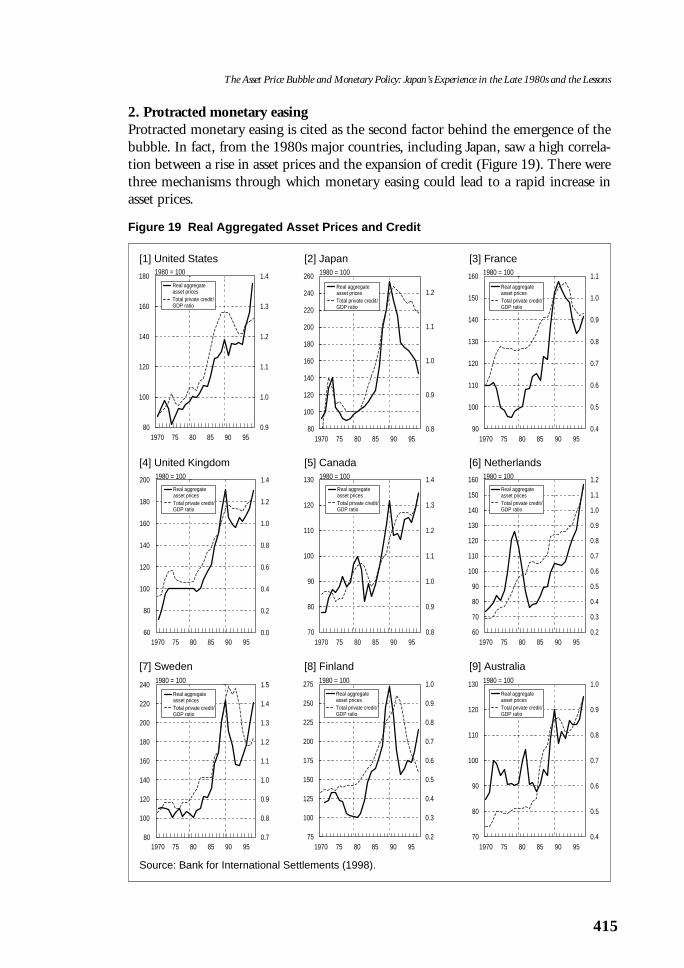
2. Protracted monetary easingProtracted monetary easing is cited as the second factor behind the emergence of thebubble. In fact, from the 1980s major countries, including Japan, saw a high correla-tion between a rise in asset prices and the expansion of credit (Figure 19). There werethree mechanisms through which monetary easing could lead to a rapid increase inasset prices.
415
The Asset Price Bubble and Monetary Policy: Japan’s Experience in the Late 1980s and the Lessons
Figure 19 Real Aggregated Asset Prices and Credit
80
100
120
140
160
180
0.9
1.0
1.1
1.2
1.3
1.4
1970 75 80 85 90 95
1980 = 100
Real aggregate asset pricesTotal private credit/ GDP ratio
Source: Bank for International Settlements (1998).
[1] United States
80
100
120
140
160
180
200
220
240
0.7
0.8
0.9
1.0
1.1
1.2
1.3
1.4
1.5
1970 75 80 85 90 95
1980 = 100
Real aggregate asset pricesTotal private credit/ GDP ratio
[7] Sweden
60
80
100
120
140
160
180
200
0.0
0.2
0.4
0.6
0.8
1.0
1.2
1.4
1970 75 80 85 90 95
1980 = 100
Real aggregate asset pricesTotal private credit/ GDP ratio
[4] United Kingdom
90
100
110
120
130
140
150
160
0.4
0.5
0.6
0.7
0.8
0.9
1.0
1.1
1970 75 80 85 90 95
1980 = 100
Real aggregate asset pricesTotal private credit/ GDP ratio
[3] France
70
80
90
100
110
120
130
0.4
0.5
0.6
0.7
0.8
0.9
1.0
1970 75 80 85 90 95
1980 = 100
Real aggregate asset pricesTotal private credit/ GDP ratio
[9] Australia
60
70
80
90
100
110
120
130
140
150
160
0.2
0.3
0.4
0.5
0.6
0.7
0.8
0.9
1.0
1.1
1.2
1970 75 80 85 90 95
1980 = 100
Real aggregate asset pricesTotal private credit/ GDP ratio
[6] Netherlands
80
100
120
140
160
180
200
220
240
260
0.8
0.9
1.0
1.1
1.2
1970 75 80 85 90 95
1980 = 100
Real aggregate asset pricesTotal private credit/ GDP ratio
[2] Japan
75
100
125
150
175
200
225
250
275
0.2
0.3
0.4
0.5
0.6
0.7
0.8
0.9
1.0
1970 75 80 85 90 95
1980 = 100
Real aggregate asset pricesTotal private credit/ GDP ratio
[8] Finland
70
80
90
100
110
120
130
0.8
0.9
1.0
1.1
1.2
1.3
1.4
1970 75 80 85 90 95
1980 = 100
Real aggregate asset pricesTotal private credit/ GDP ratio
[5] Canada
First, monetary easing could facilitate the funding of speculators by reducingfunding costs (Iwamoto et al. [1999]). Since speculators who engage in large-scaleinvestments tend to create positions in excess of their own financial resources, theyusually need funds to cover a gap in settlement when trading a variety of financialassets. Protracted monetary easing from the latter half of the 1980s facilitated the creation of such investment positions by reducing funding costs. Second, a rise instock prices, partly supported by monetary easing, reduced capital costs and facili-tated financing in capital markets such as the issuance of new shares at market priceas well as of convertible bonds and bonds with warrants. Third, a rise in land andstock prices increased the value of land and stocks held by firms, thereby enhancingtheir funding ability by increasing the collateral value of these assets.
During the bubble period, it is true that the above three mechanisms worked.However, it is difficult to believe that the bubble was generated only through monetaryeasing. First of all, if monetary easing automatically induces a bubble economy, thenwhy wasn’t it generated during all previous periods of monetary easing? In addition, whyhasn’t a bubble emerged under such extreme monetary easing conditions as created bythe zero interest rate policy since February 1999? Second, the fact that industrial coun-tries simultaneously, albeit to a different extent, experienced a bubble economy fromthe latter half of the 1980s seems to imply that there might exist some common factorswhich generate bubbles.20 Considering all the above, it appears that monetary easing isa necessary but not a sufficient condition for the emergence of a bubble.21
3. Taxation and regulationsThe third factor behind the emergence of the bubble is taxation and regulations onland that tended to induce higher land prices.22
First is the effect of tax rates that are relatively low on the holding of land butheavy on land transactions. In general, when a rise in land prices is anticipated, thelight tax burden on holding land has the effect of increasing the incentive to continueholding it, which thus suppresses the supply of land. Furthermore, the heavy tax burden on transaction gains has the effect of squeezing the supply of land by creatingan incentive to delay selling it for as long as possible. The rise in land prices throughsuch a mechanism reflected the expected present discount value stemming from theabove tax advantage. Expectations for a rise in land prices increased the expected present discount value of the tax advantage, leading to a further rise in land prices.
Second is the possibility that land prices, mainly in local areas, were formed byincorporating expectations that agricultural land would be converted to residentialuse in the future as a result of the lax application of regulations on land use. Like thetax effect just described, this suppressed the sale of land.23
416 MONETARY AND ECONOMIC STUDIES (SPECIAL EDITION)/FEBRUARY 2001
20. Generally observed common factors in the bubbles of major industrial countries from the 1980s include monetary easing, the review of regulations and supervision not being concurrent with the progress of financialderegulation, and the distortion of taxation.
21. The relationship between monetary easing and the bubble is examined in more detail in Chapter IV.22. For the effects of tax and regulations on land price formation, see, for example, Noguchi (1989) and Nishimura
(1995). In the case of overseas, interest payments on housing loans being tax-deductible from income is pointedout as an important factor in land price formation (Shigemi [1995]).
23. When there is an incentive to hold land that can be sold at any time, it is likely to be left under-utilized. Forexample, Kanoh and Murase (1999) showed that the potential option value of the alternative utilization of land isan important determinant of land prices.
The rise in land prices due to the above factors can be regarded by landholders asthe “institutional benefits” or “rents” created by the system. When land prices are rising, these institutional benefits become larger, which in turn accelerates the rise in land prices.4. Weak mechanism to impose disciplineAs the fourth factor, it is pointed out that, while the behavior of many economic agentsincluding financial institutions, firms, individuals, and the government became gradually aggressive during the bubble period, a mechanism to impose discipline onthese agents was not functioning effectively. In Japan, the main bank system had beenplaying an important role in imposing discipline on firms, i.e., corporate governance.However, its functioning gradually weakened as major firms increased their fundingthrough capital markets. In addition, the mechanism whereby discipline is imposed by shareholders and creditors did not function sufficiently due to such factors as cross-shareholdings, the application of the acquisition cost method of accounting, andinsufficient disclosure.24
In light of the change in the environment as financial deregulation progressed, a new mechanism of corporate governance was needed for financial institutions. To this end, financial institution should have established a framework for controllingrisks. Delay by the authorities in establishing an appropriate regulatory and super-visory framework made financial institutions rather lenient to review corporate governance on their part.
Any mechanism imposing discipline on economic agents will change as the economy develops. A mechanism that is effective up to a certain point in time willgradually cease functioning adequately as the economic and financial environmentchanges. For example, the fact that Japan had not experienced the bankruptcy offinancial institutions for a long time in the postwar period mirrors, in principle, thesoundness of the financial system. The practice of cross-shareholdings enabled firmsto be managed with emphasis on medium- to long-term managerial stability, whichcontributed to the strength of Japanese firms. Partly because of such success, thereoccurred a delay in establishing a new mechanism of discipline, which is perhapspartly responsible for the emergence of the bubble.5. Self-confidence in JapanIt appears that the above four factors are, albeit important, not quite sufficient to explain the emergence and expansion of the bubble. To further describe the expansion of the bubble, we need to introduce an additional factor, which we mayterm the self-confidence that prevailed in Japan at that time.
Examining the backdrop against which such confidence was created, first is the fact that Japan’s economy continued to perform well. As we have seen from themovement of the yield spread on stocks, expectations became clearly bullish from the latter half of 1988, when Japan recovered from the aftermath of the stock pricecrash on Black Monday, and rises in both stock prices and economic growth were
417
The Asset Price Bubble and Monetary Policy: Japan’s Experience in the Late 1980s and the Lessons
24. As to the accounting standards, for example, convertible bonds and bonds with warrants are issued at a discountby an amount corresponding to stock conversion and stock purchase rights. Since the discount was treated inclusive of the issue price of bonds, it was regarded as a profit.
witnessed under price stability. Such good macroeconomic performance brought self-confidence to many economic agents.
Second is the greater role of Japan in international financial markets. For example,Japan’s external claims substantially increased with the expansion of the currentaccount surplus. The overseas activities of Japanese financial institutions expandedconsiderably and their share of international bank lending was 41 percent at the peak(in the fourth quarter of 1989). Large-scale takeovers of foreign companies byJapanese firms were frequently reported. An often-heard term, “the largest creditorcountry,” vividly captures the atmosphere of the time.25
Third, Japanese firms were leading the world in manufacturing technology,including semiconductors, and the success of Japanese-style management wasregarded as evidence that it had a competitive edge over U.S.-style management.
Finally, the rush of overseas financial institutions to Tokyo to open offices alsosupported Japan’s self-confidence, as evidenced by the term “Tokyo as an interna-tional financial center,” which was often used in the bubble period to describe the situation. In addition, such a rush to Tokyo pushed land prices higher through theincreased demand for office space in the center of Tokyo, leading to the furtherintensification of bullish expectations.26
IV. Did the BOJ’s Monetary Policy Create the Bubble?
The previous chapter described the mechanism behind the emergence of the bubble,and explained that protracted monetary easing was not the only factor, but one ofseveral that generated the bubble. This chapter further examines in more detail therelationship between the emergence of the bubble and monetary policy.
A. Monetary Policy during the Bubble PeriodIn considering the relationship between the emergence of the bubble and monetarypolicy, it is useful to divide the bubble period from the latter half of the 1980s to theearly 1990s into the following three sub-periods.
The first sub-period is from the Plaza Agreement in September 1985 through thespring of 1987, during which period monetary easing was promoted to counter the recession caused by the rapid appreciation of the yen after the Plaza Agreement.The second sub-period is from the summer of 1987 to the spring of 1989. Althoughthe BOJ sought an appropriate timing to tighten monetary policy during this sub-period, it could not easily shift to monetary tightening, thus resulting in the then lowest official discount rate being maintained for a protracted period. The third sub-period is from the spring of 1989, when the BOJ finally reversed its policydirection to monetary tightening.
418 MONETARY AND ECONOMIC STUDIES (SPECIAL EDITION)/FEBRUARY 2001
25. The net position of U.S. external assets and liabilities became negative in the mid- to late-1980s (the exact timingof this turnaround slightly differs depending on the different evaluation of asset prices). In addition, it was in1979 when both the English and Japanese editions of Ezra F. Vogel’s Japan as Number One were published.
26. The National Land Agency (1985) forecast that demand for office space in Tokyo would increase to a levelequivalent to the office space contained in 250 skyscrapers. It is sometimes pointed out that this forecast couldhave had a significant impact on expectations with respect to future land prices at that time.
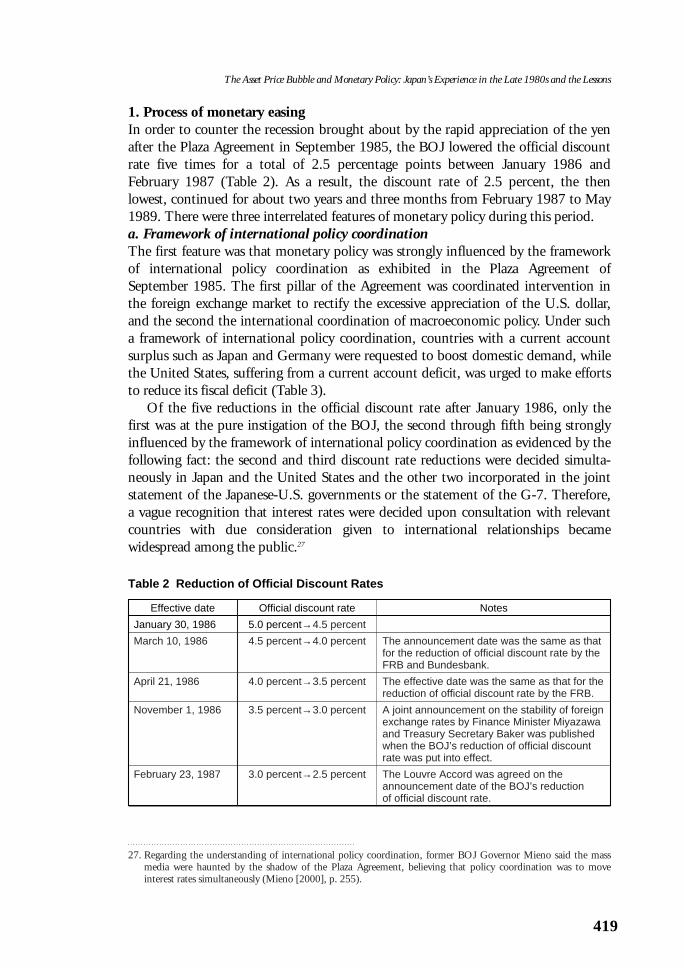
1. Process of monetary easingIn order to counter the recession brought about by the rapid appreciation of the yenafter the Plaza Agreement in September 1985, the BOJ lowered the official discountrate five times for a total of 2.5 percentage points between January 1986 andFebruary 1987 (Table 2). As a result, the discount rate of 2.5 percent, the then lowest, continued for about two years and three months from February 1987 to May1989. There were three interrelated features of monetary policy during this period.a. Framework of international policy coordinationThe first feature was that monetary policy was strongly influenced by the frameworkof international policy coordination as exhibited in the Plaza Agreement ofSeptember 1985. The first pillar of the Agreement was coordinated intervention inthe foreign exchange market to rectify the excessive appreciation of the U.S. dollar,and the second the international coordination of macroeconomic policy. Under sucha framework of international policy coordination, countries with a current accountsurplus such as Japan and Germany were requested to boost domestic demand, whilethe United States, suffering from a current account deficit, was urged to make effortsto reduce its fiscal deficit (Table 3).
Of the five reductions in the official discount rate after January 1986, only thefirst was at the pure instigation of the BOJ, the second through fifth being stronglyinfluenced by the framework of international policy coordination as evidenced by thefollowing fact: the second and third discount rate reductions were decided simulta-neously in Japan and the United States and the other two incorporated in the jointstatement of the Japanese-U.S. governments or the statement of the G-7. Therefore,a vague recognition that interest rates were decided upon consultation with relevantcountries with due consideration given to international relationships became widespread among the public.27
419
The Asset Price Bubble and Monetary Policy: Japan’s Experience in the Late 1980s and the Lessons
Table 2 Reduction of Official Discount Rates
Effective date Official discount rate Notes
January 30, 1986 5.0 percent→4.5 percent
March 10, 1986 4.5 percent→4.0 percent The announcement date was the same as thatfor the reduction of official discount rate by theFRB and Bundesbank.
April 21, 1986 4.0 percent→3.5 percent The effective date was the same as that for thereduction of official discount rate by the FRB.
November 1, 1986 3.5 percent→3.0 percent A joint announcement on the stability of foreignexchange rates by Finance Minister Miyazawaand Treasury Secretary Baker was publishedwhen the BOJ’s reduction of official discountrate was put into effect.
February 23, 1987 3.0 percent→2.5 percent The Louvre Accord was agreed on theannouncement date of the BOJ’s reduction of official discount rate.
27. Regarding the understanding of international policy coordination, former BOJ Governor Mieno said the massmedia were haunted by the shadow of the Plaza Agreement, believing that policy coordination was to move interest rates simultaneously (Mieno [2000], p. 255).
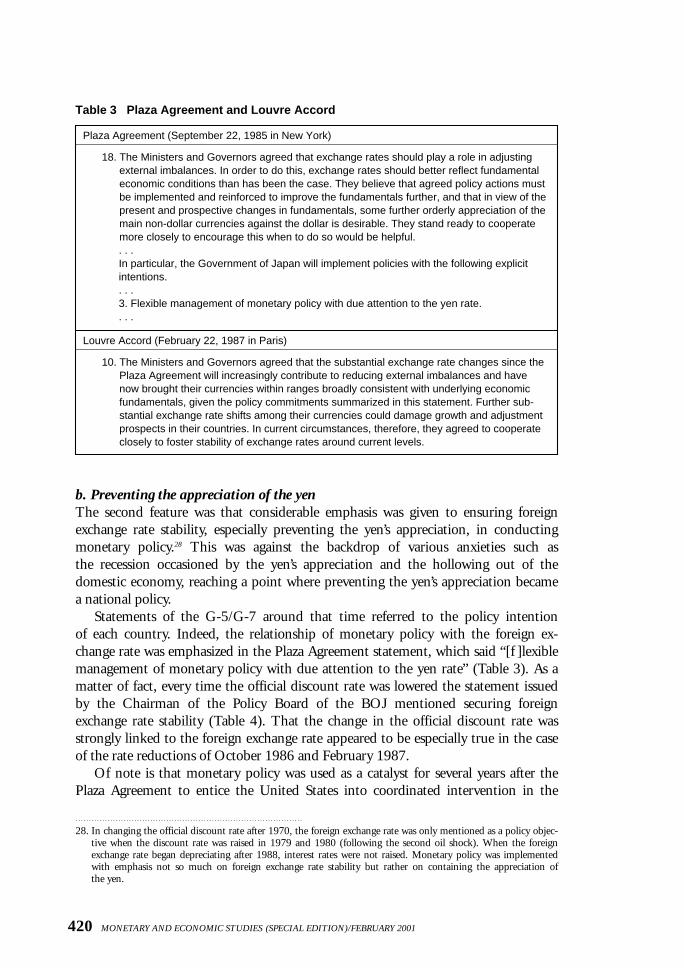
b. Preventing the appreciation of the yenThe second feature was that considerable emphasis was given to ensuring foreignexchange rate stability, especially preventing the yen’s appreciation, in conductingmonetary policy.28 This was against the backdrop of various anxieties such as the recession occasioned by the yen’s appreciation and the hollowing out of thedomestic economy, reaching a point where preventing the yen’s appreciation becamea national policy.
Statements of the G-5/G-7 around that time referred to the policy intention of each country. Indeed, the relationship of monetary policy with the foreign ex-change rate was emphasized in the Plaza Agreement statement, which said “[f ]lexible management of monetary policy with due attention to the yen rate” (Table 3). As amatter of fact, every time the official discount rate was lowered the statement issuedby the Chairman of the Policy Board of the BOJ mentioned securing foreignexchange rate stability (Table 4). That the change in the official discount rate wasstrongly linked to the foreign exchange rate appeared to be especially true in the caseof the rate reductions of October 1986 and February 1987.
Of note is that monetary policy was used as a catalyst for several years after thePlaza Agreement to entice the United States into coordinated intervention in the
420 MONETARY AND ECONOMIC STUDIES (SPECIAL EDITION)/FEBRUARY 2001
Table 3 Plaza Agreement and Louvre Accord
Plaza Agreement (September 22, 1985 in New York)
18. The Ministers and Governors agreed that exchange rates should play a role in adjustingexternal imbalances. In order to do this, exchange rates should better reflect fundamentaleconomic conditions than has been the case. They believe that agreed policy actions must be implemented and reinforced to improve the fundamentals further, and that in view of thepresent and prospective changes in fundamentals, some further orderly appreciation of themain non-dollar currencies against the dollar is desirable. They stand ready to cooperatemore closely to encourage this when to do so would be helpful.. . . In particular, the Government of Japan will implement policies with the following explicit intentions.. . . 3. Flexible management of monetary policy with due attention to the yen rate.. . .
Louvre Accord (February 22, 1987 in Paris)
10. The Ministers and Governors agreed that the substantial exchange rate changes since thePlaza Agreement will increasingly contribute to reducing external imbalances and have now brought their currencies within ranges broadly consistent with underlying economic fundamentals, given the policy commitments summarized in this statement. Further sub-stantial exchange rate shifts among their currencies could damage growth and adjustmentprospects in their countries. In current circumstances, therefore, they agreed to cooperateclosely to foster stability of exchange rates around current levels.
28. In changing the official discount rate after 1970, the foreign exchange rate was only mentioned as a policy objec-tive when the discount rate was raised in 1979 and 1980 (following the second oil shock). When the foreignexchange rate began depreciating after 1988, interest rates were not raised. Monetary policy was implementedwith emphasis not so much on foreign exchange rate stability but rather on containing the appreciation of the yen.
foreign exchange market or to prevent high-ranking U.S. officials from “talking down the dollar.”29
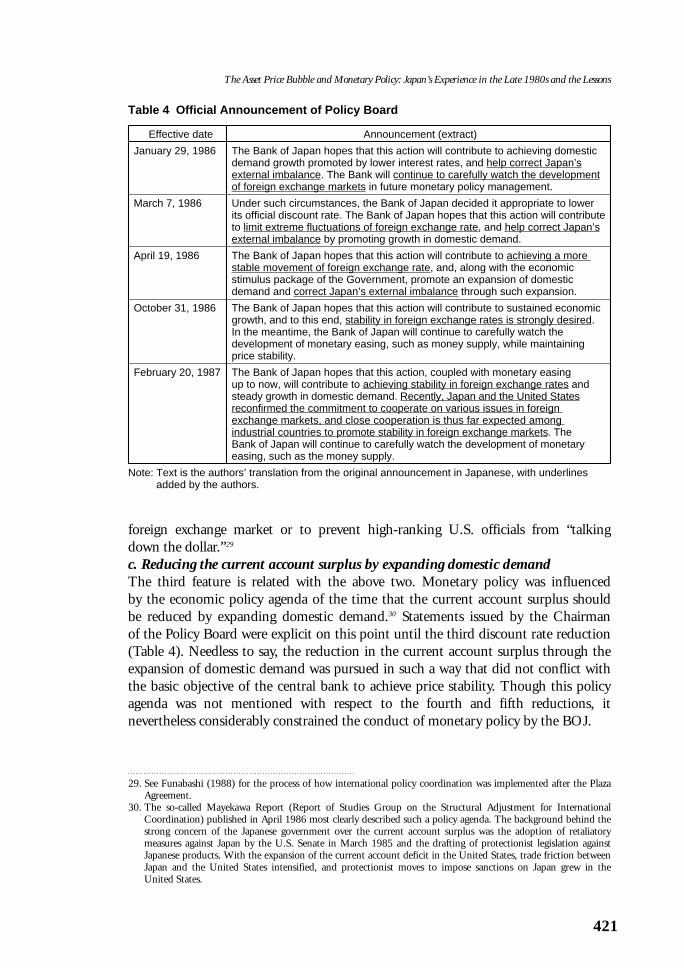
c. Reducing the current account surplus by expanding domestic demandThe third feature is related with the above two. Monetary policy was influenced by the economic policy agenda of the time that the current account surplus should be reduced by expanding domestic demand.30 Statements issued by the Chairman of the Policy Board were explicit on this point until the third discount rate reduction(Table 4). Needless to say, the reduction in the current account surplus through theexpansion of domestic demand was pursued in such a way that did not conflict withthe basic objective of the central bank to achieve price stability. Though this policyagenda was not mentioned with respect to the fourth and fifth reductions, it nevertheless considerably constrained the conduct of monetary policy by the BOJ.
421
The Asset Price Bubble and Monetary Policy: Japan’s Experience in the Late 1980s and the Lessons
29. See Funabashi (1988) for the process of how international policy coordination was implemented after the PlazaAgreement.
30. The so-called Mayekawa Report (Report of Studies Group on the Structural Adjustment for InternationalCoordination) published in April 1986 most clearly described such a policy agenda. The background behind thestrong concern of the Japanese government over the current account surplus was the adoption of retaliatory measures against Japan by the U.S. Senate in March 1985 and the drafting of protectionist legislation againstJapanese products. With the expansion of the current account deficit in the United States, trade friction betweenJapan and the United States intensified, and protectionist moves to impose sanctions on Japan grew in theUnited States.
Table 4 Official Announcement of Policy Board
Effective date Announcement (extract)
January 29, 1986 The Bank of Japan hopes that this action will contribute to achieving domesticdemand growth promoted by lower interest rates, and help correct Japan’sexternal imbalance. The Bank will continue to carefully watch the developmentof foreign exchange markets in future monetary policy management.
March 7, 1986 Under such circumstances, the Bank of Japan decided it appropriate to lower its official discount rate. The Bank of Japan hopes that this action will contributeto limit extreme fluctuations of foreign exchange rate, and help correct Japan’sexternal imbalance by promoting growth in domestic demand.
April 19, 1986 The Bank of Japan hopes that this action will contribute to achieving a more stable movement of foreign exchange rate, and, along with the economic stimulus package of the Government, promote an expansion of domesticdemand and correct Japan’s external imbalance through such expansion.
October 31, 1986 The Bank of Japan hopes that this action will contribute to sustained economicgrowth, and to this end, stability in foreign exchange rates is strongly desired. In the meantime, the Bank of Japan will continue to carefully watch the development of monetary easing, such as money supply, while maintaining price stability.
February 20, 1987 The Bank of Japan hopes that this action, coupled with monetary easing up to now, will contribute to achieving stability in foreign exchange rates and steady growth in domestic demand. Recently, Japan and the United Statesreconfirmed the commitment to cooperate on various issues in foreign exchange markets, and close cooperation is thus far expected among industrial countries to promote stability in foreign exchange markets. The Bank of Japan will continue to carefully watch the development of monetary easing, such as the money supply.
Note: Text is the authors’ translation from the original announcement in Japanese, with underlinesadded by the authors.
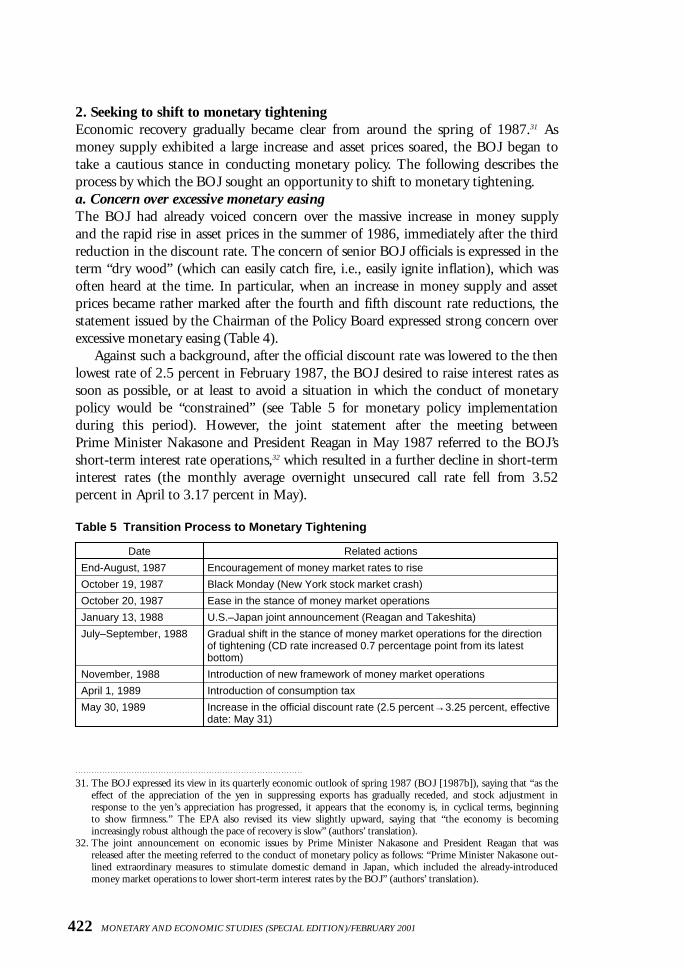
2. Seeking to shift to monetary tighteningEconomic recovery gradually became clear from around the spring of 1987.31 Asmoney supply exhibited a large increase and asset prices soared, the BOJ began totake a cautious stance in conducting monetary policy. The following describes theprocess by which the BOJ sought an opportunity to shift to monetary tightening.a. Concern over excessive monetary easingThe BOJ had already voiced concern over the massive increase in money supply and the rapid rise in asset prices in the summer of 1986, immediately after the thirdreduction in the discount rate. The concern of senior BOJ officials is expressed in theterm “dry wood” (which can easily catch fire, i.e., easily ignite inflation), which wasoften heard at the time. In particular, when an increase in money supply and assetprices became rather marked after the fourth and fifth discount rate reductions, the statement issued by the Chairman of the Policy Board expressed strong concern overexcessive monetary easing (Table 4).
Against such a background, after the official discount rate was lowered to the thenlowest rate of 2.5 percent in February 1987, the BOJ desired to raise interest rates assoon as possible, or at least to avoid a situation in which the conduct of monetarypolicy would be “constrained” (see Table 5 for monetary policy implementation during this period). However, the joint statement after the meeting between Prime Minister Nakasone and President Reagan in May 1987 referred to the BOJ’sshort-term interest rate operations,32 which resulted in a further decline in short-terminterest rates (the monthly average overnight unsecured call rate fell from 3.52 percent in April to 3.17 percent in May).
422 MONETARY AND ECONOMIC STUDIES (SPECIAL EDITION)/FEBRUARY 2001
Table 5 Transition Process to Monetary Tightening
Date Related actions
End-August, 1987 Encouragement of money market rates to rise
October 19, 1987 Black Monday (New York stock market crash)
October 20, 1987 Ease in the stance of money market operations
January 13, 1988 U.S.–Japan joint announcement (Reagan and Takeshita)
July–September, 1988 Gradual shift in the stance of money market operations for the direction of tightening (CD rate increased 0.7 percentage point from its latestbottom)
November, 1988 Introduction of new framework of money market operations
April 1, 1989 Introduction of consumption tax
May 30, 1989 Increase in the official discount rate (2.5 percent→3.25 percent, effectivedate: May 31)
31. The BOJ expressed its view in its quarterly economic outlook of spring 1987 (BOJ [1987b]), saying that “as theeffect of the appreciation of the yen in suppressing exports has gradually receded, and stock adjustment inresponse to the yen’s appreciation has progressed, it appears that the economy is, in cyclical terms, beginning to show firmness.” The EPA also revised its view slightly upward, saying that “the economy is becoming increasingly robust although the pace of recovery is slow” (authors’ translation).
32. The joint announcement on economic issues by Prime Minister Nakasone and President Reagan that wasreleased after the meeting referred to the conduct of monetary policy as follows: “Prime Minister Nakasone out-lined extraordinary measures to stimulate domestic demand in Japan, which included the already-introducedmoney market operations to lower short-term interest rates by the BOJ” (authors’ translation).
b. Raising the short-term interest rate in the summer of 1987In view of the prospective hike in the official discount rate, the BOJ took the firstconcrete step to change its monetary easing stance at the end of August 1987 when itbegan guiding market interest rates to a higher level. As a result, short-term marketrates gradually rose after September and, on October 19, immediately before BlackMonday in the United States, the market rate on newly issued three-month CDs was4.920 percent, 0.84 percentage point higher than the level at the end of August.Long-term interest rates also rose by nearly three percentage points compared withthe lowest level, reflecting clear signs of economic recovery, an increase in money supply, and the rebound of commodity prices both domestically and overseas.
However, Black Monday resulted in the BOJ suspending monetary operations toguide interest rates to a higher level, and short-term rates declined again. Under suchcircumstances, the maintenance of low short-term interest rates was mentioned in thejoint statement issued after the meeting of Prime Minister Takeshita and PresidentReagan in January 1988.33
c. Call for “prudent lending attitude”At that time, the BOJ still maintained the framework of “window guidance” regard-ing the lending of commercial banks (moral suasion to contain the increase in loans)as a supplementary measure to orthodox monetary policy measures. Until the firstquarter of 1987 the BOJ simply monitored the lending policy of commercial banks,but from the second quarter switched to moderate moral suasion urging commercialbanks to maintain a “prudent lending attitude” and gradually strengthened the extentof moral suasion thereafter.
In the situation where the official discount rate was unchanged, the BOJ couldnot conduct effective moral suasion on financial institutions to suppress lending, andeven if it did lending would probably not have declined. On the other hand, if theBOJ did not effect strong moral suasion, there was a risk that the market would thinkthe BOJ had no concern over the aggressive lending attitude of commercial banks.Under such circumstances, although the BOJ gradually strengthened window guidance with respect to the lending of commercial banks, more decisive policyaction had to wait until the official discount rate was raised.d. Shift to monetary tightening in major overseas countriesImmediately after Black Monday, financial markets and foreign exchange marketsworldwide were unstable. Major foreign central banks lowered their interest rates andconducted monetary operations to provide ample liquidity to financial markets (seeTable 6 for monetary policy in Germany and the United States at that time). Suchmonetary easing continued until the spring of 1988, but in the summer of the sameyear major overseas countries, including the United States and Germany, seeing clearsigns of economic recovery, began raising interest rates again. In the foreign exchangemarket, the U.S. dollar reversed course and started to appreciate, and Europeancountries conducted dollar selling intervention.34
423
The Asset Price Bubble and Monetary Policy: Japan’s Experience in the Late 1980s and the Lessons
33. In the joint announcement of Prime Minister Takeshita and President Reagan on economic issues, Japan’s monetary policy was described as follows: “In order to attain sustainable economic growth and to achieve foreignexchange rate stability, the BOJ has agreed to make efforts to maintain the current policy stance and low interestrates under price stability” (authors’ translation).
34. See Chapter V concerning the relationship between foreign exchange market intervention and monetary policy.
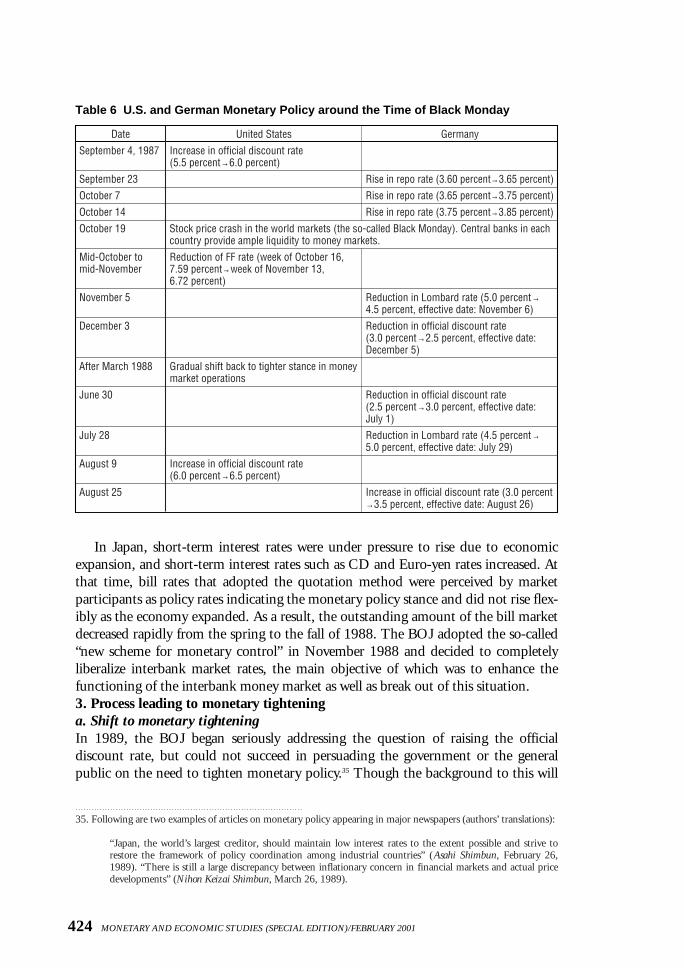
In Japan, short-term interest rates were under pressure to rise due to economicexpansion, and short-term interest rates such as CD and Euro-yen rates increased. Atthat time, bill rates that adopted the quotation method were perceived by market participants as policy rates indicating the monetary policy stance and did not rise flex-ibly as the economy expanded. As a result, the outstanding amount of the bill marketdecreased rapidly from the spring to the fall of 1988. The BOJ adopted the so-called“new scheme for monetary control” in November 1988 and decided to completely liberalize interbank market rates, the main objective of which was to enhance the functioning of the interbank money market as well as break out of this situation.3. Process leading to monetary tighteninga. Shift to monetary tighteningIn 1989, the BOJ began seriously addressing the question of raising the official discount rate, but could not succeed in persuading the government or the general public on the need to tighten monetary policy.35 Though the background to this will
424 MONETARY AND ECONOMIC STUDIES (SPECIAL EDITION)/FEBRUARY 2001
Table 6 U.S. and German Monetary Policy around the Time of Black Monday
Date United States Germany
September 4, 1987 Increase in official discount rate (5.5 percent→6.0 percent)
September 23 Rise in repo rate (3.60 percent→3.65 percent)
October 7 Rise in repo rate (3.65 percent→3.75 percent)October 14 Rise in repo rate (3.75 percent→3.85 percent)October 19 Stock price crash in the world markets (the so-called Black Monday). Central banks in each
country provide ample liquidity to money markets.
Mid-October to Reduction of FF rate (week of October 16, mid-November 7.59 percent→week of November 13,
6.72 percent)November 5 Reduction in Lombard rate (5.0 percent→
4.5 percent, effective date: November 6)
December 3 Reduction in official discount rate (3.0 percent→2.5 percent, effective date: December 5)
After March 1988 Gradual shift back to tighter stance in money market operations
June 30 Reduction in official discount rate (2.5 percent→3.0 percent, effective date: July 1)
July 28 Reduction in Lombard rate (4.5 percent→5.0 percent, effective date: July 29)
August 9 Increase in official discount rate (6.0 percent→6.5 percent)
August 25 Increase in official discount rate (3.0 percent→3.5 percent, effective date: August 26)
35. Following are two examples of articles on monetary policy appearing in major newspapers (authors’ translations):
“Japan, the world’s largest creditor, should maintain low interest rates to the extent possible and strive torestore the framework of policy coordination among industrial countries” (Asahi Shimbun, February 26,1989). “There is still a large discrepancy between inflationary concern in financial markets and actual pricedevelopments” (Nihon Keizai Shimbun, March 26, 1989).
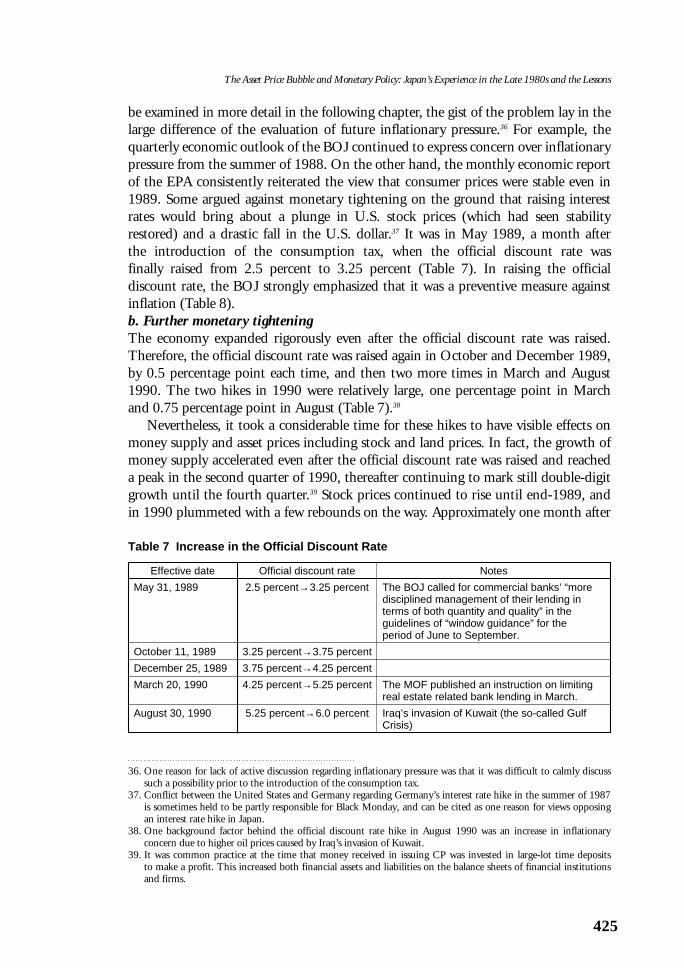
be examined in more detail in the following chapter, the gist of the problem lay in thelarge difference of the evaluation of future inflationary pressure.36 For example, the quarterly economic outlook of the BOJ continued to express concern over inflationarypressure from the summer of 1988. On the other hand, the monthly economic reportof the EPA consistently reiterated the view that consumer prices were stable even in1989. Some argued against monetary tightening on the ground that raising interestrates would bring about a plunge in U.S. stock prices (which had seen stabilityrestored) and a drastic fall in the U.S. dollar.37 It was in May 1989, a month after the introduction of the consumption tax, when the official discount rate was finally raised from 2.5 percent to 3.25 percent (Table 7). In raising the official discount rate, the BOJ strongly emphasized that it was a preventive measure againstinflation (Table 8).b. Further monetary tighteningThe economy expanded rigorously even after the official discount rate was raised.Therefore, the official discount rate was raised again in October and December 1989,by 0.5 percentage point each time, and then two more times in March and August1990. The two hikes in 1990 were relatively large, one percentage point in Marchand 0.75 percentage point in August (Table 7).38
Nevertheless, it took a considerable time for these hikes to have visible effects onmoney supply and asset prices including stock and land prices. In fact, the growth ofmoney supply accelerated even after the official discount rate was raised and reacheda peak in the second quarter of 1990, thereafter continuing to mark still double-digitgrowth until the fourth quarter.39 Stock prices continued to rise until end-1989, andin 1990 plummeted with a few rebounds on the way. Approximately one month after
425
The Asset Price Bubble and Monetary Policy: Japan’s Experience in the Late 1980s and the Lessons
36. One reason for lack of active discussion regarding inflationary pressure was that it was difficult to calmly discusssuch a possibility prior to the introduction of the consumption tax.
37. Conflict between the United States and Germany regarding Germany’s interest rate hike in the summer of 1987is sometimes held to be partly responsible for Black Monday, and can be cited as one reason for views opposingan interest rate hike in Japan.
38. One background factor behind the official discount rate hike in August 1990 was an increase in inflationary concern due to higher oil prices caused by Iraq’s invasion of Kuwait.
39. It was common practice at the time that money received in issuing CP was invested in large-lot time deposits to make a profit. This increased both financial assets and liabilities on the balance sheets of financial institutionsand firms.
Table 7 Increase in the Official Discount Rate
Effective date Official discount rate Notes
May 31, 1989 2.5 percent→3.25 percent The BOJ called for commercial banks’ “moredisciplined management of their lending in terms of both quantity and quality” in the guidelines of “window guidance” for the period of June to September.
October 11, 1989 3.25 percent→3.75 percent
December 25, 1989 3.75 percent→4.25 percent
March 20, 1990 4.25 percent→5.25 percent The MOF published an instruction on limitingreal estate related bank lending in March.
August 30, 1990 5.25 percent→6.0 percent Iraq’s invasion of Kuwait (the so-called GulfCrisis)
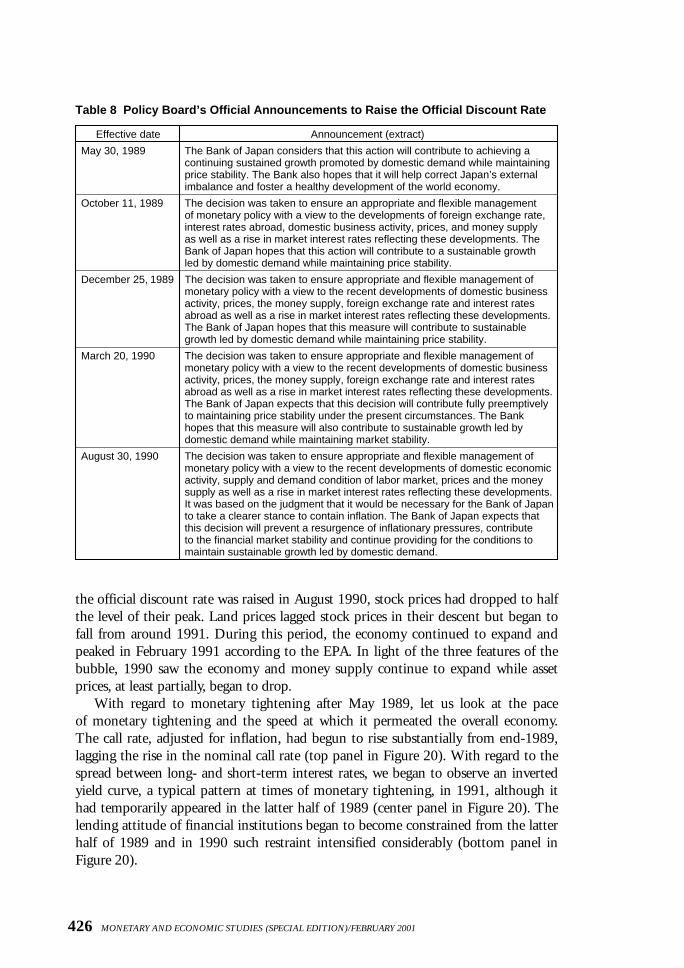
the official discount rate was raised in August 1990, stock prices had dropped to halfthe level of their peak. Land prices lagged stock prices in their descent but began tofall from around 1991. During this period, the economy continued to expand andpeaked in February 1991 according to the EPA. In light of the three features of thebubble, 1990 saw the economy and money supply continue to expand while assetprices, at least partially, began to drop.
With regard to monetary tightening after May 1989, let us look at the pace of monetary tightening and the speed at which it permeated the overall economy.The call rate, adjusted for inflation, had begun to rise substantially from end-1989,lagging the rise in the nominal call rate (top panel in Figure 20). With regard to thespread between long- and short-term interest rates, we began to observe an invertedyield curve, a typical pattern at times of monetary tightening, in 1991, although ithad temporarily appeared in the latter half of 1989 (center panel in Figure 20). Thelending attitude of financial institutions began to become constrained from the latterhalf of 1989 and in 1990 such restraint intensified considerably (bottom panel inFigure 20).
426 MONETARY AND ECONOMIC STUDIES (SPECIAL EDITION)/FEBRUARY 2001
Table 8 Policy Board’s Official Announcements to Raise the Official Discount Rate
Effective date Announcement (extract)
May 30, 1989 The Bank of Japan considers that this action will contribute to achieving a continuing sustained growth promoted by domestic demand while maintainingprice stability. The Bank also hopes that it will help correct Japan’s externalimbalance and foster a healthy development of the world economy.
October 11, 1989 The decision was taken to ensure an appropriate and flexible management of monetary policy with a view to the developments of foreign exchange rate,interest rates abroad, domestic business activity, prices, and money supply as well as a rise in market interest rates reflecting these developments. TheBank of Japan hopes that this action will contribute to a sustainable growth led by domestic demand while maintaining price stability.
December 25, 1989 The decision was taken to ensure appropriate and flexible management ofmonetary policy with a view to the recent developments of domestic businessactivity, prices, the money supply, foreign exchange rate and interest ratesabroad as well as a rise in market interest rates reflecting these developments.The Bank of Japan hopes that this measure will contribute to sustainablegrowth led by domestic demand while maintaining price stability.
March 20, 1990 The decision was taken to ensure appropriate and flexible management ofmonetary policy with a view to the recent developments of domestic businessactivity, prices, the money supply, foreign exchange rate and interest ratesabroad as well as a rise in market interest rates reflecting these developments.The Bank of Japan expects that this decision will contribute fully preemptivelyto maintaining price stability under the present circumstances. The Bank hopes that this measure will also contribute to sustainable growth led bydomestic demand while maintaining market stability.
August 30, 1990 The decision was taken to ensure appropriate and flexible management ofmonetary policy with a view to the recent developments of domestic economicactivity, supply and demand condition of labor market, prices and the moneysupply as well as a rise in market interest rates reflecting these developments.It was based on the judgment that it would be necessary for the Bank of Japanto take a clearer stance to contain inflation. The Bank of Japan expects thatthis decision will prevent a resurgence of inflationary pressures, contribute to the financial market stability and continue providing for the conditions tomaintain sustainable growth led by domestic demand.
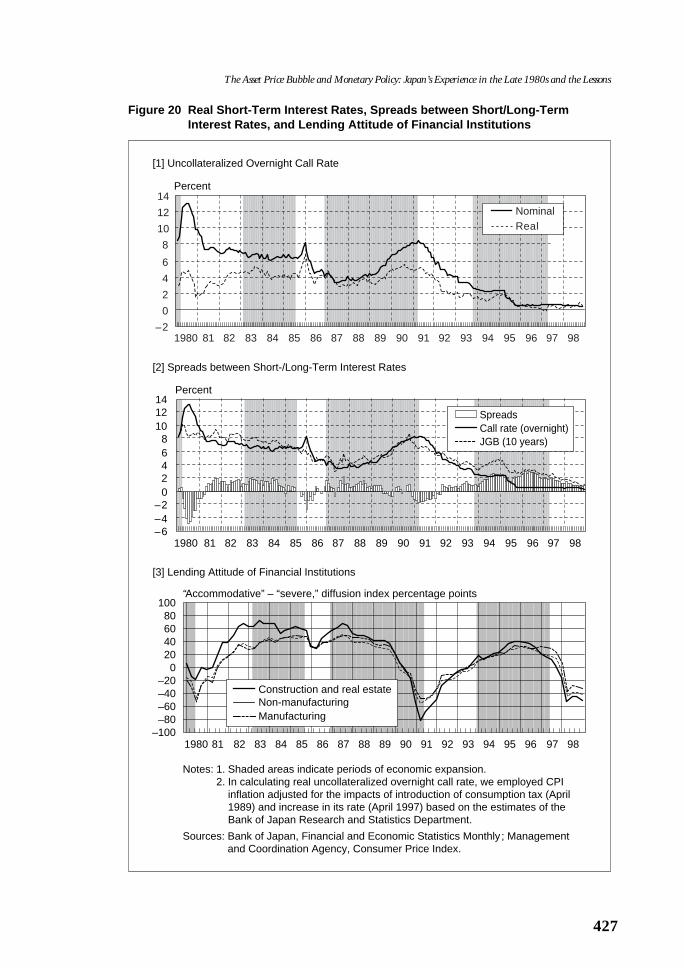
427
The Asset Price Bubble and Monetary Policy: Japan’s Experience in the Late 1980s and the Lessons
Figure 20 Real Short-Term Interest Rates, Spreads between Short/Long-TermInterest Rates, and Lending Attitude of Financial Institutions
–2
0
2
4
6
8
10
12
14
1980 81 82 83 84 85 86 87 88 89 90 91 92 93 94 95 96 97 98
NominalReal
Percent
[2] Spreads between Short-/Long-Term Interest Rates
–6–4–2
02468
101214
1980 81 82 83 84 85 86 87 88 89 90 91 92 93 94 95 96 97 98
SpreadsCall rate (overnight)JGB (10 years)
Percent
[3] Lending Attitude of Financial Institutions
–100
–20–40–60–80
0
4020
1008060
1980 81 82 83 84 85 86 87 88 89 90 91 92 93 94 95 96 97 98
Construction and real estateNon-manufacturingManufacturing
“Accommodative” – “severe,” diffusion index percentage points
Notes: 1. Shaded areas indicate periods of economic expansion.2. In calculating real uncollateralized overnight call rate, we employed CPI
inflation adjusted for the impacts of introduction of consumption tax (April1989) and increase in its rate (April 1997) based on the estimates of theBank of Japan Research and Statistics Department.
Sources: Bank of Japan, Financial and Economic Statistics Monthly ; Managementand Coordination Agency, Consumer Price Index.
[1] Uncollateralized Overnight Call Rate
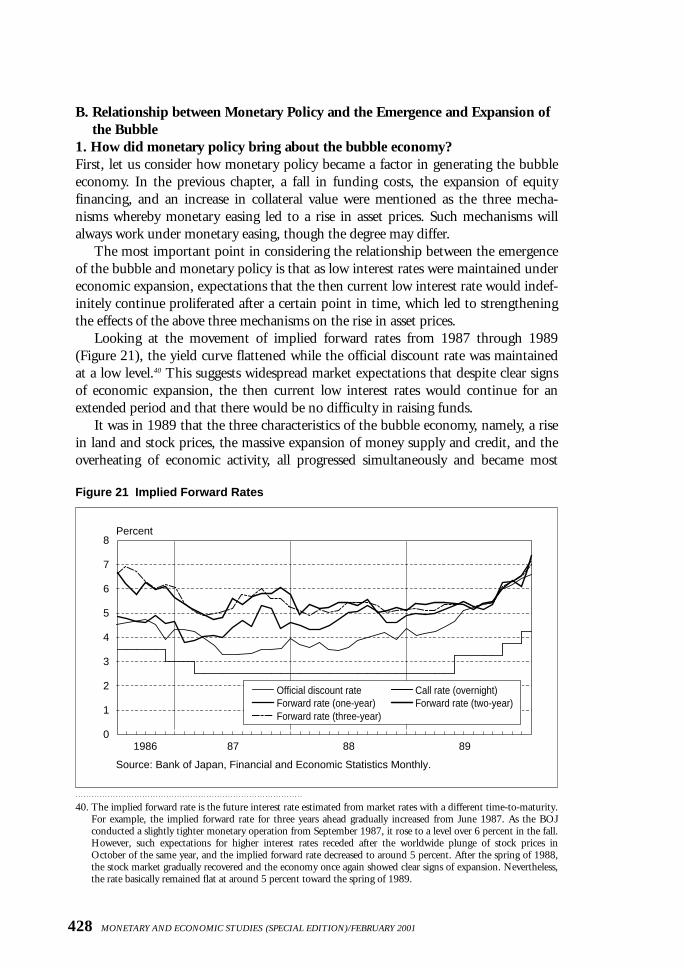
B. Relationship between Monetary Policy and the Emergence and Expansion ofthe Bubble
1. How did monetary policy bring about the bubble economy? First, let us consider how monetary policy became a factor in generating the bubbleeconomy. In the previous chapter, a fall in funding costs, the expansion of equityfinancing, and an increase in collateral value were mentioned as the three mecha-nisms whereby monetary easing led to a rise in asset prices. Such mechanisms willalways work under monetary easing, though the degree may differ.
The most important point in considering the relationship between the emergenceof the bubble and monetary policy is that as low interest rates were maintained undereconomic expansion, expectations that the then current low interest rate would indef-initely continue proliferated after a certain point in time, which led to strengtheningthe effects of the above three mechanisms on the rise in asset prices.
Looking at the movement of implied forward rates from 1987 through 1989(Figure 21), the yield curve flattened while the official discount rate was maintainedat a low level.40 This suggests widespread market expectations that despite clear signsof economic expansion, the then current low interest rates would continue for anextended period and that there would be no difficulty in raising funds.
It was in 1989 that the three characteristics of the bubble economy, namely, a risein land and stock prices, the massive expansion of money supply and credit, and theoverheating of economic activity, all progressed simultaneously and became most
428 MONETARY AND ECONOMIC STUDIES (SPECIAL EDITION)/FEBRUARY 2001
40. The implied forward rate is the future interest rate estimated from market rates with a different time-to-maturity.For example, the implied forward rate for three years ahead gradually increased from June 1987. As the BOJ conducted a slightly tighter monetary operation from September 1987, it rose to a level over 6 percent in the fall.However, such expectations for higher interest rates receded after the worldwide plunge of stock prices inOctober of the same year, and the implied forward rate decreased to around 5 percent. After the spring of 1988,the stock market gradually recovered and the economy once again showed clear signs of expansion. Nevertheless,the rate basically remained flat at around 5 percent toward the spring of 1989.
Figure 21 Implied Forward Rates
0
1
2
3
4
5
6
7
8
1986 87 88 89
Percent
Official discount rate Call rate (overnight)Forward rate (one-year) Forward rate (two-year)Forward rate (three-year)
Source: Bank of Japan, Financial and Economic Statistics Monthly.

prominent. This seems consistent with the proliferation of expectations that thencurrent low interest rates, which started from the summer of 1988, would continuefor a prolonged period.2. Could monetary policy have prevented the emergence of the bubble
economy?The second question is whether monetary policy could have prevented the emergenceof the bubble economy. If monetary policy were to focus solely on the “complete suppression of rises in asset prices,” such an objective could be achieved by signifi-cantly raising interest rates. In this rather extreme sense, monetary policy could haveprevented the emergence of the bubble economy, or at least the emergence of theasset price bubble.
In fact, Bernanke and Gertler (1999) conducted a simulation using data for Japanand calculated the ex post target interest rate that would have offset the stimulativeeffects of the asset price bubble (Figure 22). According to their calculation, if the target interest rate had been raised from around 4 percent to 8 percent in 1988, theemergence of the bubble could have been prevented.41 Even without such detailedsimulation, there are many discussions in the same vein which maintain that theemergence of the bubble could have been prevented if monetary policy had been sufficiently tightened.
429
The Asset Price Bubble and Monetary Policy: Japan’s Experience in the Late 1980s and the Lessons
41. The simulation by Bernanke and Gertler (1999) shows that the target interest rate temporarily jumped in 1987 and 1997. Such temporary fluctuations in the target interest rate might perhaps reflect the effects of the introduction of the consumption tax (3 percent) in April 1989 and the hike in the consumption tax (from 3 percent to 5 percent) in 1997.
Figure 22 Simulation by Bernanke-Gertler
12
10
8
6
4
2
0
–2
–4
12
10
8
6
4
2
0
–2
–4
Japan call money rate
Actual
Target
Jan. 1984
Jan. 85
Jan. 86
Jan. 87
Jan. 88
Jan. 89
Jan. 90
Jan. 91
Jan. 92
Jan. 93
Jan. 94
Jan. 95
Jan. 96
Jan. 97
Source: Bernanke and Gertler (1999).

However, even if we had known ex ante the target interest rate that would haveprevented the bubble from emerging, one wonders whether a central bank could haveraised the short-term interest rate from 4 percent to 8 percent in one go at a timewhen inflation was very low (annualized inflation rate of the consumer price index[CPI] was 0.7 percent in 1988).42 During the bubble period, even though the BOJadvocated the need for monetary tightening, likening the economy to “dry woodwhich could ignite at any moment,” it could not succeed in persuading the public.Even if the BOJ believed that the emergence of a bubble was very likely, it is not clear if it would have been wise for the BOJ to raise interest rates to 8 percent whenthe BOJ was not sufficiently sure about the existence of the bubble. It thus appearsdifficult for monetary policy alone to prevent the emergence of a bubble.3. Would earlier monetary tightening have reduced the scale of the bubble?The third question is whether we could have reduced the scale of the bubble if monetary policy had been tightened at an earlier stage. There are two opposing views on this.
On the one hand, if monetary policy had been tightened at an early stage, theoutput gap would have narrowed, and the expansion of money supply and creditwould have been suppressed, thus preventing the expansion of the bubble. On theother hand, if an early and small rise in interest rates had nipped inflationary pressurein the bud, it would have only further strengthened already bullish expectations, thusleading to the expansion of the bubble. Indeed, turmoil in the market followingBlack Monday was effective in calming market participants’ bullish expectations, butwe cannot deny the possibility that by overcoming the turmoil bullish expectationswere strengthened again, thus expanding the bubble.
Our views on this are as follows.43 If interest rates had been raised early, expecta-tions for the continuation of low interest rates would have receded more quickly thanotherwise, and to that extent the timing of the autonomous collapse of the bubblewould have been somewhat expedited. If this had transpired, the expansion of creditduring the bubble period would likely have been suppressed and the negative effectsafter the bursting of the bubble smaller than otherwise. If interest rates had beenraised early but only by a small degree, asset prices would have continued to rise, andthus the level of asset prices at the peak might not have differed much from the levelif interest rates had not been raised early.
In fact, bullish expectations intensified so much during the emergence and expansion of the bubble that a small rise in interest rates would have had little impacton such expectations. Under such circumstances, it is apparent that an increase in interest rates would have had to be fairly large to induce a change in market expectations. In other words, even if interest rates had been high, the effect of monetary tightening would not have materialized to any great degree until suchexpectations had been adjusted downward. If such expectations had been adjusted
430 MONETARY AND ECONOMIC STUDIES (SPECIAL EDITION)/FEBRUARY 2001
42. BOJ Deputy Governor Yamaguchi questions the practical validity of the simulation result, saying “I don’t seehow a central bank can increase the interest rate to 8 percent or 10 percent when we don’t have inflation at all”(Yamaguchi [1999]).
43. Kent and Lowe (1997) expressed similar views to those of the authors, emphasizing that an early rise in interestrates would heighten the possibility of the bubble bursting, thereby leading to smaller fluctuations in the realeconomy and inflation through smaller negative effects on the financial system after the bursting of the bubble.
downward, the adverse effects on the economy would inevitably have been quite large due to the combined effect of the rise in interest rates itself and the revision ofexpectations. Indeed, there is a strong possibility that the interest rate hike wouldhave been large at the end of the bubble period, but this does not imply that it would have magnified the collapse of the bubble economy.4. Should prudential regulations have been strengthened during the bubble
period?The fourth question is whether we should have responded to the emergence andexpansion of the bubble by tightening prudential regulations on financial institu-tions. There is a view that attributes the emergence and expansion of the bubblesolely to an increase in financial institutions’ aggressive lending to the property-related sector.44 Such a view leads us to the conclusion that an appropriate policyresponse during the bubble period would have been the strengthening of prudentialregulations rather than monetary tightening.
If the objective of prudential regulations was only to burst the bubble, property-related lending could have been curbed through the strict regulation of the amountof loans. In this case, the rise in land prices would have been contained. In fact, theintroduction of regulation on the total amount of property-related lending almostcoincided with the bursting of the bubble.45 However, it is difficult to judge inadvance whether a rise in land prices is a bubble or not and hence whether the regulatory and supervisory authorities should implement regulations on the totalamount of lending. In addition, if such regulations are effected when there are strongexpectations of a further rise in land prices, a number of loopholes to raise funds can be found, thus hampering the effectiveness of such regulations. Therefore, itwould be desirable for the regulatory and supervisory authorities to avoid directintervention, to the extent possible, in the lending policy of financial institutions,including lending to property-related firms.
However, this does not mean to argue that it is meaningless for the central bankand supervisory authorities to attempt some preventive measures in the managementof financial institutions. As we discuss in detail in Chapter VI, the problem duringthe bubble period was that credit had substantially expanded and had become greatlyinfluenced by the movement of land prices. It is an important role of a central bankand supervisory authorities to accurately understand the existence and characteristicsof risks accompanying aggressive lending and to explain them to the management of financial institutions. Although it might be difficult to draw a line between theexplanation of risks and direct regulations as described above, it is neverthelessimportant for a central bank and supervisory authorities to recognize the differencebetween them.
431
The Asset Price Bubble and Monetary Policy: Japan’s Experience in the Late 1980s and the Lessons
44. See Yoshitomi (1998).45. In the late 1980s, the Ministry of Finance (MOF) and the Japanese Bankers Associations issued quite a few
directives and guidelines that warned about excessive property-related lending. In March 1990, MOF issued a directive and guideline that included the following two points:(1) For the time being, except for lending to public housing land development institutions, the MOF requests
financial institutions to contain the increase in lending to property-related firms to within the increase intotal lending.
(2) For the time being, the MOF will collect reports with respect to lending to the real estate industry, construction industry, and non-banks.
V. Why Was Monetary Tightening Delayed?
As described earlier, the BOJ sought an opportunity to tighten monetary policy longbefore the increase in the official discount rate in May 1989, but the start of actualmonetary tightening was significantly delayed. We argued in the previous chapterthat even if we had begun monetary tightening earlier, we could not have preventedthe emergence of the bubble, though perhaps we could have expedited the timing ofits bursting, thereby reducing its negative effects. This chapter examines the reasonswhy actual monetary tightening was delayed compared with the BOJ’s intention bylooking at the economic and financial conditions, mainly after 1988.
We adopt two approaches. The first looks back on various developments such as the increase in money supply that gave warning signals of the emergence of the bubbleand examines why insufficient attention was paid to the above developments in theeconomic and financial environment. The second, putting aside individual warningsignals, examines why it was difficult to tighten monetary policy by analyzing the thenprevailing ideas with respect to the conduct of monetary policy.
A. Ex Post Examination of Economic and Financial Conditions during theBubble Period
1. Economic activityUpon reflection, at the time there did not exist sufficient recognition that monetarytightening was necessary, though the reasons for this might differ between the earlyand the latter part of the bubble period.
During the early bubble period from 1987 to the first half of 1988, the strengthof economic recovery was underestimated because of the following two reasons. First,the speed of the yen’s appreciation after the 1985 Plaza Agreement had been so rapidthat there were serious concerns of recession and the “hollowing out” of the economy. However, what happened in fact was that the downward pressure ondemand through the appreciation of the yen had already run its course, and thegrowth of the non-tradable goods sector, triggered by the change in relative pricesand an increase in real income due to improved terms of trade, was materializing.46
Second, in forming public opinion, the manufacturing industry, which was susceptible to the deflationary impact of the yen’s appreciation, had a large say.Although the yen’s appreciation could work to bring about economic expansion led by non-manufacturing industries through lower import prices, the voice of non-manufacturing industries was not very loud.
From the viewpoint of what generated the bubble, we should examine the assessment of the economy during the latter half of 1988. During this period, economic expansion became clear and the BOJ repeatedly gave warning signals thatthe economy was expanding beyond “cruising speed.”47 One reason for the warning
432 MONETARY AND ECONOMIC STUDIES (SPECIAL EDITION)/FEBRUARY 2001
46. In analyzing the appreciation of the yen and economic adjustment in this period, the BOJ (1987) stated that “Japan’s economy has entered a stage in which the effects of the yen’s appreciation on demand are diminish-ing, while those on industrial structure due to the change in relative prices are gaining momentum” (authors’translation).
47. For example, the BOJ (1989a) pointed out, in its quarterly economic outlook of January 1989, the risk that theeconomy might enter an adjustment phase due to upward pressures on prices.

was the constraint on resources as evidenced by the tightness of demand and supply,especially in the labor market (Figure 23). In addition, there was recognition of therisk that a large increase in business fixed investment would create excess capacity inthe future, leading to an economic slowdown.
However, these warnings were not viewed as sufficiently convincing. This waspartly because prices were stable in spite of economic expansion. More fundamen-tally, there existed the prevailing recognition that productivity and the growth potential of Japan’s economy had increased. Many interpreted the high growth ofbusiness fixed investment as being due to the rising trend of the capital coefficient.48
Despite the rapid economic expansion, over-evaluation with respect to the medium-to long-term sustainability of economic growth proliferated.2. InflationWhile the most orthodox rationale for a shift to monetary tightening is the existenceof inflationary pressure, extremely stable price developments at the time considerablyweakened the recognition of the need to raise interest rates. For example, in thesummer of 1988 when the United States and Germany raised interest rates, prices inJapan were extremely stable as witnessed by the year-on-year change in the domesticwholesale price index (WPI) and CPI for the third quarter being –0.7 percent and0.2 percent, respectively.49
433
The Asset Price Bubble and Monetary Policy: Japan’s Experience in the Late 1980s and the Lessons
48. It is emphasized that a rise in the capital coefficient has been supported by not only investment for capacityexpansion purposes but also for structural change such as research and development, information-related fields,and rationalization (for example, see the BOJ [1990b]).
49. It is often pointed out that one reason for stable prices under tight supply and demand conditions was theincrease in merchandise imports from NIEs under the yen’s appreciation, which was termed the “safety bulbeffect of imports.” (For example, see the BOJ [1989b, 1990b].)
Figure 23 Labor Supply and Demand Conditions
0.0
0.5
1.0
1.5
2.0
2.5
3.0
0.0
0.2
0.4
0.6
0.8
1.0
1.2
1.4
1.6
1.8
2.0Times
3.5Percent
Unemployment rate (left scale)
Ratio of job offers to applicants(right scale)Ratio of new job offers to newapplicants (right scale)
1963 64 65 66 67 68 69 70 71 72 73 74 75 76 77 78 79 80 81 82 83 84 85 86 87 88 89 90 91 92
Sources: Management and Coordination Agency, Labour Force Survey ; Ministry ofLabour, Report on Employment Service.
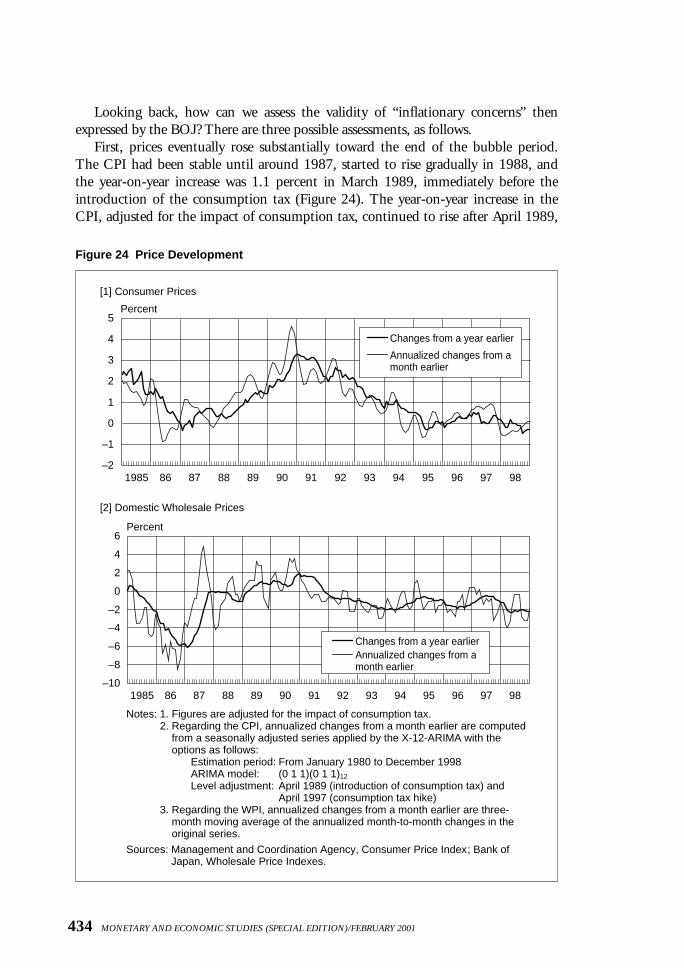
Looking back, how can we assess the validity of “inflationary concerns” thenexpressed by the BOJ? There are three possible assessments, as follows.
First, prices eventually rose substantially toward the end of the bubble period. The CPI had been stable until around 1987, started to rise gradually in 1988, andthe year-on-year increase was 1.1 percent in March 1989, immediately before theintroduction of the consumption tax (Figure 24). The year-on-year increase in theCPI, adjusted for the impact of consumption tax, continued to rise after April 1989,
434 MONETARY AND ECONOMIC STUDIES (SPECIAL EDITION)/FEBRUARY 2001
Figure 24 Price Development
–2
–1
0
1
2
3
4
5
1985 86 87 88 89 90 91 92 93 94 95 96 97 98
Changes from a year earlier
Annualized changes from amonth earlier
Percent
[2] Domestic Wholesale Prices
–10
–8
–6
–4
–2
0
2
4
6
1985 86 87 88 89 90 91 92 93 94 95 96 97 98
Changes from a year earlierAnnualized changes from amonth earlier
Percent
Notes: 1. Figures are adjusted for the impact of consumption tax.2. Regarding the CPI, annualized changes from a month earlier are computed
from a seasonally adjusted series applied by the X-12-ARIMA with theoptions as follows:
Estimation period: From January 1980 to December 1998ARIMA model: (0 1 1)(0 1 1)12
Level adjustment: April 1989 (introduction of consumption tax) and April 1997 (consumption tax hike)
3. Regarding the WPI, annualized changes from a month earlier are three-month moving average of the annualized month-to-month changes in theoriginal series.
Sources: Management and Coordination Agency, Consumer Price Index; Bank ofJapan, Wholesale Price Indexes.
[1] Consumer Prices
and it reached 2 percent in April 1990 and 3 percent in November 1990. In addition, the month-to-month annualized increase on a seasonally adjusted basismomentarily exceeded 4 percent in the latter half of 1990.50 In view of the fact thatthis 3–4 percent rise in inflation materialized despite a series of monetary tighteningmeasures beginning with the official discount rate hike in May 1989, it is possible toconclude that inflationary concerns expressed by the BOJ materialized with a timelag of about two to three years.
Second, inflationary pressure did not materialize after all and prices were generallystable during the bubble period. While it is true that the 3–4 percent inflation rate inthe final phase of the bubble period was high compared with the present level ofinflation, such a level cannot be regarded as particularly high compared with the figure before the bubble period, and thus we might be able to say that price stabilityhad not been eroded.
The third assessment emphasizes the importance of a long-term view with respectto price stability. If we take only the bubble period, prices could be perceived as stable. But if we include the period when the bubble bursts, we cannot say that prices were stable. During the period when the bubble burst, Japan’s economy experi-enced a decline in inflation and faced the risk of tumbling into a deflationary spiral(Figure 24). Such deflation very likely resulted from the bubble economy generatedin the latter half of the 1980s. In this context, it seems more important to considerwhether price stability is sustainable over the long run, instead of discussing whetherprices had been stable during the bubble period. According to this view, it might bepossible to assess that Japan’s economy did not succeed in sustaining price stabilityafter the bubble period.
Of the three possible assessments above, the first and second boil down to thequestion of what can be regarded as a tolerable inflation rate, and there can be a variety of answers. The experience of the bubble period seems to suggest the importance of the third point, which puts emphasis on the sustainability of price stability over a fairly long period.3. Expansion of money supply and creditDuring the bubble period, it was the large increase in money supply and credit thatsignaled the need for an early rise in interest rates. In fact, as previously mentioned,while the BOJ expressed concern over this increase from a relatively early stage, itturned out that such concern was not sufficiently taken into account. The major reason for this was lack of a common understanding, including on the part of theBOJ, as to what kind of problems might be occasioned by the massive expansion ofmoney supply and credit.
At the time, concern over the large increase in money supply was mainly based on the view that such an increase would eventually lead to inflation. However, pricesdid not rise even though money supply increased, and a view that the statistical relationship between money supply and prices had become unstable gradually
435
The Asset Price Bubble and Monetary Policy: Japan’s Experience in the Late 1980s and the Lessons
50. In judging monetary policy operations, it is crucial to know when the expected inflation rate turned to increase.Higo (1999) has estimated the expected inflation rate and obtained the result that while it had moved parallelwith, or with a time lag, vis-à-vis actual inflation until 1988, it increased rapidly preceding the increase in actualinflation from 1989 to 1990.

prevailed. In addition, the ongoing deregulation of deposit interest rates was oftenmentioned as a reason for the statistical instability.51
While an increase in money supply eventually affected prices to a certain extent, ithad more conspicuous effects on the rise in asset prices. However, at the time, the risein asset prices was mainly discussed from the viewpoint of equality of income andasset distribution, and was not seen as inducing large fluctuations in the economyfrom a medium- to long-term viewpoint. Accordingly, the large increase in moneysupply was not taken seriously.52
4. Rise in asset pricesThe rise in asset prices in general and land prices in particular, together with the increasein money supply was often cited as a rationale for an early interest rate hike during thebubble period. While the rise in asset prices was discussed from various viewpoints, the main focus was on the magnitude of so-called wealth effects on expenditure, theequality of asset and income distribution, and the risk of future inflation.53
While these points were important, the biggest problem stemming from the rapidrise in asset prices during the bubble period, in our view, was that it induced largefluctuations in economic activity, including the impact on the financial system, froma medium- to long-term viewpoint. However, there were only few arguments fromsuch a viewpoint during the bubble period, and thus the rise in asset prices was notadequately taken as a warning signal in the conduct of monetary policy.54
B. The Influence of the Prevailing Policy AgendaIn the previous section, we pointed out the difference in assessment regarding economic conditions and prices as a major reason the BOJ failed to make a convincingargument in favor of the need for an early interest rate hike. At the same time, it should
436 MONETARY AND ECONOMIC STUDIES (SPECIAL EDITION)/FEBRUARY 2001
51. The BOJ (1988) pointed out that the relationship between prices and money supply had become unstable, and asbackground referred to the price stabilization effect stemming from the yen’s appreciation in addition to theeffect of financial deregulation. In the United States, money supply ceased to be used as a policy target and itsrole in the conduct of monetary policy subsided substantially as the relationship between money supply andprices weakened in the process of financial deregulation. (For example, see Friedman [1997].)
52. The BOJ (1988) said that “while progress in monetary easing as witnessed by the large increase in money supply exerted multiple effects on the expansion of domestic demand and foreign exchange rate stability, oneshould be sufficiently aware of its side effects such that an increase in money supply will not lead to highergrowth in the long run, but is accompanied by the risk of higher inflation,” and that “excessive monetary easingwould induce problems from the viewpoint of the stability of money and capital markets as well as of socialequality” (authors’ translation).
53. During the bubble period, many estimates were made regarding wealth effects on expenditure, with most of theresults indicating that they were not so large. (For example, see the BOJ [1990a]).
54. In this regard, the BOJ (1990a) stated as follows in April 1990:
Various economic agents appear to implicitly assume the “myth of ever-rising land prices,” which means thatland prices will continue to rise, or, at least, never fall. However, recent episodes in foreign countries such as the United States and the United Kingdom show that the decline in land prices triggered the deteriorationin the soundness of financial institutions. Lessons from these episodes can be summarized in the followingthree points: (1) A rapid increase in land prices in a short period of time could easily be reversed later on. (2) In this case, a decline in land prices could ignite financial difficulties at individual financial institutions,and, in the worst case, lead to the instability of the financial system as a whole. (3) Property-related firmsdefaulting on loans are most likely to be seen at small and medium-sized financial institutions and non-banks. Although it is true that the factors behind the decline in land prices both at home and abroad, such asmonetary tightening, changes in industrial organization, and changes in taxation and other institutionalarrangements, are numerous and varied, they also indicate that the “myth of ever-rising land prices” is notinfallible (authors’ translation).
be noted that this difference was also strongly influenced by the then prevailing orientation of economic policy, which may be termed the “policy agenda of the era” or the “policy paradigm.”1. International policy coordinationThe most often-heard counterargument during the period after 1988 when the BOJsought an opportunity to effect monetary tightening was that, against the backdropof Japan being the world’s largest creditor and having a huge current account surplus, an interest rate hike in Japan would result in the collapse of internationalpolicy coordination.55
Originally, international policy coordination was a policy agenda whereby eachcountry should contribute to sustained growth of the world economy by ensuring thestability of its own economy.56 However, the experience of the bubble period suggeststhat the term “international policy coordination” was often used by a country asrhetoric in forcing other countries to implement macroeconomic policy adjustmentwhich they themselves should have already effected.57 The United States, after havingcorrected the excessive appreciation of the dollar at the Plaza Agreement, began tostrongly urge other major countries to reduce interest rates for fear that furtherdepreciation of the dollar might lead to its free-fall against the backdrop of a largebudget deficit and current account deficit.58 It was unfortunate that, against the backdrop of concern over further depreciation of the dollar on the part of the UnitedStates and concern over recession due to the appreciation of the yen on the part ofJapan, the maintenance of low interest rates with a domestic policy orientation wasoften discussed in Japan in the same light as international policy coordination. 2. Preventing the appreciation of the yenThere are two views with respect to how the foreign exchange rate is placed in theconduct of monetary policy. The first is to conduct monetary policy so as to offset
437
The Asset Price Bubble and Monetary Policy: Japan’s Experience in the Late 1980s and the Lessons
55. Looking back, former BOJ Governor Mieno mentioned one background factor behind delayed monetary tightening: “Despite the appreciation of the yen, a reduction in the current account surplus which was regardedas an international pledge at the time did not progress as expected. Therefore, to raise interest rates and suppressdomestic economic growth was regarded as contradicting the international pledge” (Mieno [2000], p. 206,authors’ translation).
56. Naturally, effects stemming from the economic policy of other countries are marginal compared with those ofone’s own. For example, Taylor (1993), in estimating the Taylor rule by using a large macro model, estimated apolicy rule by ignoring policy transmission effects from abroad. In addition, Komiya (1988), from the viewpointof the effective assignment of macroeconomic policy instruments, argued that “all countries can simultaneouslyachieve all objectives most effectively when each country appropriately employs its domestic policy tools toachieve its own domestic goals.” In addition, Frankel and Rockett (1988) examined major world econometricmodels and pointed out that important policy multipliers differed not only in their value but also in terms ofpositives and negatives, and that if countries took a policy coordination action based on different models, wecould not expect an improvement in the economic welfare of the countries concerned.
57. Former Governor Matsushita of the BOJ pointed out at a symposium in 1995 that “if a country pursues macro-economic policy in coordination with other countries, favorable domestic economic conditions such as price stability and sustainable growth are likely to be sacrificed” (Matsushita [1995]). In addition, Feldstein (1988),based on his experience as the Chairman of the Council of Economic Advisers in the Reagan administration,pointed out that macroeconomic policy coordination is likely to make other countries a scapegoat or tends toserve as external pressure to change domestic policy.
58. In Congressional testimony based on the Humphrey-Hawkins Act in February 1986, former FRB ChairmanVolcker emphasized that foreign countries need to expand their domestic economy, saying “The success of all ourefforts is dependent in substantial part on complementary policies by other countries—their success in enhancingtheir growth and stability, in opening markets to others, and in helping to deal with points of strain in the international financial fabric.” As explained in Footnote 56, the improvement in the current account balancethrough economic expansion overseas is generally limited.

the effects of foreign exchange rate fluctuations on economic activity, and the secondis to conduct monetary policy with the foreign exchange rate or a foreign exchangerate range as a direct target. The argument against an interest rate hike grounded on concern of an economic slowdown and the hollowing out of the domestic economy due to the appreciation of the yen centered around the first viewpoint.Though there are different views regarding the extent of the economic slowdown andthe hollowing out of the domestic economy, there is no essential difference betweenthose who advocate an early interest rate hike and those who oppose an interest ratehike concerning the perception that the effects of the foreign exchange rate need tobe taken into account in the conduct of monetary policy.
During the bubble period, it was a serious blow to the BOJ that many stronglyargued that monetary policy should be conducted with the foreign exchange rate as atarget.59 Under the situation where capital can freely move internationally, conduct-ing monetary policy with the foreign exchange rate as a target means to abandonindependent domestic monetary policy, which is neither possible nor appropriate fora large economy like Japan. However, under the circumstances where preventing theyen’s appreciation became a “national priority,” the fundamental problem was in thetendency to consider that the foreign exchange rate level could be controlled at willby monetary policy.60
As to the relationship between the foreign exchange rate and monetary policy, therole of foreign exchange intervention also became a topic of discussion. In Japan, theMinistry of Finance is responsible for foreign exchange intervention and the BOJonly conducts foreign exchange transactions as its agent.61 As a result, in some cases,foreign exchange intervention might not be effected in line with the stance of mone-tary policy. For example, when the BOJ was seeking monetary tightening, if it hadconducted foreign exchange buying intervention as an agent of the Ministry ofFinance in order to prevent the further appreciation of the yen, the policy stance ofthe BOJ would have been weakened and its policy intention perhaps misunderstood.In fact, after the spring of 1988 when the U.S. dollar reversed course and began torise, European countries conducted U.S. dollar-selling intervention and turned tomonetary tightening, but Japan did not intervene. We cannot deny the possibilitythat this was perceived as a signal of protracted monetary easing (Figure 25).62
438 MONETARY AND ECONOMIC STUDIES (SPECIAL EDITION)/FEBRUARY 2001
59. The communiqué of the 1987 Louvre Accord stated “they agreed to cooperate closely to foster stability ofexchange rates around current levels,” and it cannot be denied that such treatment of the foreign exchange ratebecame an obstacle for the subsequent conduct of monetary policy.
60. In general, it is known as the irreconcilable trinity of an open economy in international finance that, among threeobjectives, namely, independent monetary policy, free international capital flows, and fixing the foreign exchangerate, only two can be achieved simultaneously.
61. Based on the Consolidated Version of the Treaty Establishing the European Community, which stipulates thatprice stability is the objective for both monetary and foreign exchange rate policy, the European Central Bank conducts foreign exchange market intervention to the extent that it does not conflict with price stability.Regarding U.S. foreign exchange intervention in the 1980s, former FRB Chairman Volcker said it was a systemwith a mutual veto held by the Treasury and the Federal Reserve (Volcker and Gyoten [1992], p. 234).
62. As to the relationship between foreign exchange intervention policy and monetary policy at the time, Ohta(1991) said “it looked rather bizarre in the eyes of central banks in Europe, including the Bundesbank, to seeJapan doing nothing while they were struggling to stop the appreciation of the U.S. dollar by intervening in themarket” (p. 118, authors’ translation).
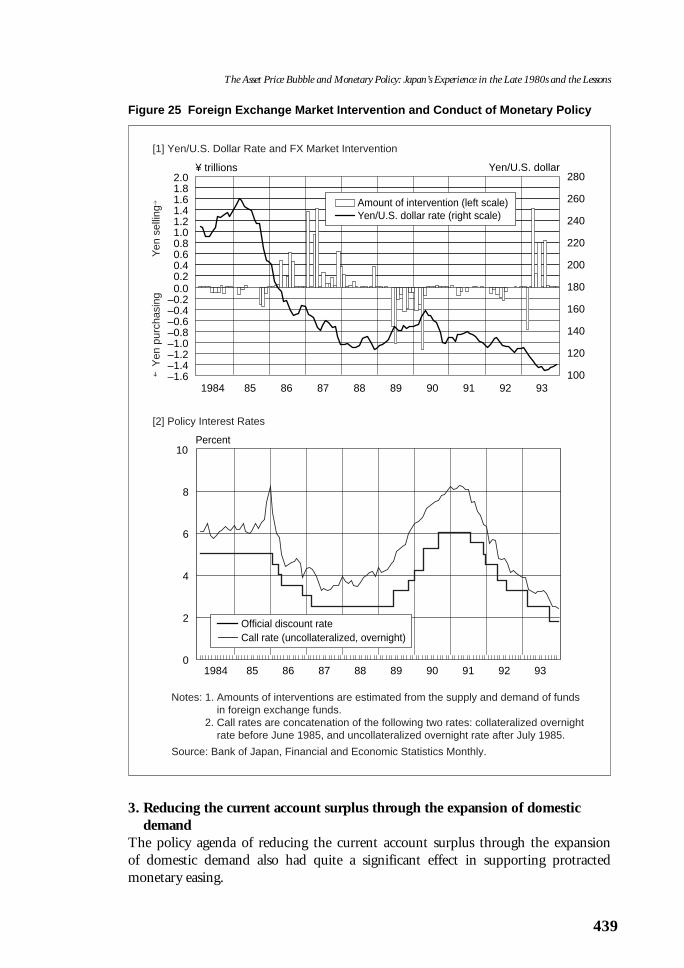
3. Reducing the current account surplus through the expansion of domesticdemand
The policy agenda of reducing the current account surplus through the expansion of domestic demand also had quite a significant effect in supporting protracted monetary easing.
439
The Asset Price Bubble and Monetary Policy: Japan’s Experience in the Late 1980s and the Lessons
Figure 25 Foreign Exchange Market Intervention and Conduct of Monetary Policy
–1.6–1.4–1.2–1.0–0.8–0.6–0.4–0.20.00.20.40.60.81.01.21.41.61.82.0
1984 85 86 87 88 89 90 91 92 93100
120
140
160
180
200
220
240
260
280¥ trillions Yen/U.S. dollar
Amount of intervention (left scale)Yen/U.S. dollar rate (right scale)
Yen
sel
ling→
←Y
en p
urch
asin
g
[2] Policy Interest Rates
0
2
4
6
8
10
1984 85 86 87 88 89 90 91 92 93
Percent
Official discount rateCall rate (uncollateralized, overnight)
Notes: 1. Amounts of interventions are estimated from the supply and demand of fundsin foreign exchange funds.
2. Call rates are concatenation of the following two rates: collateralized overnightrate before June 1985, and uncollateralized overnight rate after July 1985.
Source: Bank of Japan, Financial and Economic Statistics Monthly.
[1] Yen/U.S. Dollar Rate and FX Market Intervention
The current account balance is the difference between the export and import ofgoods and services, which can also be regarded as the difference between domesticsavings and investment. The difference between savings and investment of a countryreflects not only cyclical factors but also its long-term trend.63 Japan’s current accountsurplus reached 2.1 percent of nominal GDP in the 1980s and, roughly speaking, the difference between savings and investment over the long term is likely of thismagnitude (Figure 26).64
When a current account surplus basically stems from long-term excess savings, the expansion of domestic demand cannot result in a substantial reduction in the surplus. However, in Japan there still remained strong pressure for the reduction of the surplus through the expansion of domestic demand. Indeed, many called for a reduction in the current account surplus that went beyond what was justified by cyclical factors. This policy agenda was a powerful argument against an early discount rate hike.4. Relationship with fiscal policyWhen we examine the conduct of monetary policy during the bubble period in relation to the then prevailing policy agenda, the relationship with fiscal policy is alsoan issue for discussion. In this regard, the most often-heard argument was that thedelay in the implementation of expansionary fiscal policy increased the burden onmonetary policy which resulted in excessive monetary easing, thus generating thebubble.65 Indeed, it is true that the government was cautious in implementing expansionary fiscal policy during the first half of the bubble period from the viewpoint of fiscal consolidation, and that the expansion of domestic demand wasmainly borne by monetary policy (Figure 27).66
It is often argued that, if expansionary fiscal policy had been implemented at anearlier stage, the official discount rate might not have been reduced to 2.5 percent.However, as we examined, the essential issue for monetary policy during the bubbleperiod was not low interest rates per se but rather the creation of expectations thatlow interest rates would continue for a protracted period under economic expansion.Therefore, the point of discussion is whether an early implementation of expan-sionary fiscal policy facilitated a policy shift to monetary tightening. If such a shift inmonetary policy was difficult in any case, the argument that the bubble would nothave emerged if expansionary fiscal policy had been effected earlier will not hold.
440 MONETARY AND ECONOMIC STUDIES (SPECIAL EDITION)/FEBRUARY 2001
63. See, for example, Komiya (1994).64. Ueda (1988, 1992) pointed out, based on an estimation of the current account balance function, that Japan’s
structural current account surplus reached some 3 percent of nominal GDP in the first half of the 1980s, mainlybecause of an increase in the U.S. government deficit and a decrease in Japan’s government deficit.
65. It is natural that the fiscal authorities put emphasis on fiscal consolidation. However, the question is whether fiscal consolidation is achieved through sustainable measures. The bubble period had seen an increase in tax revenue (corporate, income, inheritance, securities transaction tax, etc.) not only due to economic expansion andthe rise in asset prices but also a temporary increase in revenues stemming from such factors as the sale of NTTshares and the issuance of commemorative coins. However, tax revenue had not increased if we include the bursting of the bubble period, and fiscal consolidation was not truly achieved. The BOJ (1989b) estimated thatthe increase in tax revenue due to the bubble was about ¥7.5 trillion (5.4 percent of tax revenue and stampduties) for three years from fiscal 1986 to 1988.
66. The contribution of public demand to the growth rate of real GDP consistently declined from 1986 through1989 as follows: 0.8 percent, 0.5 percent, 0.5 percent, and 0.2 percent.
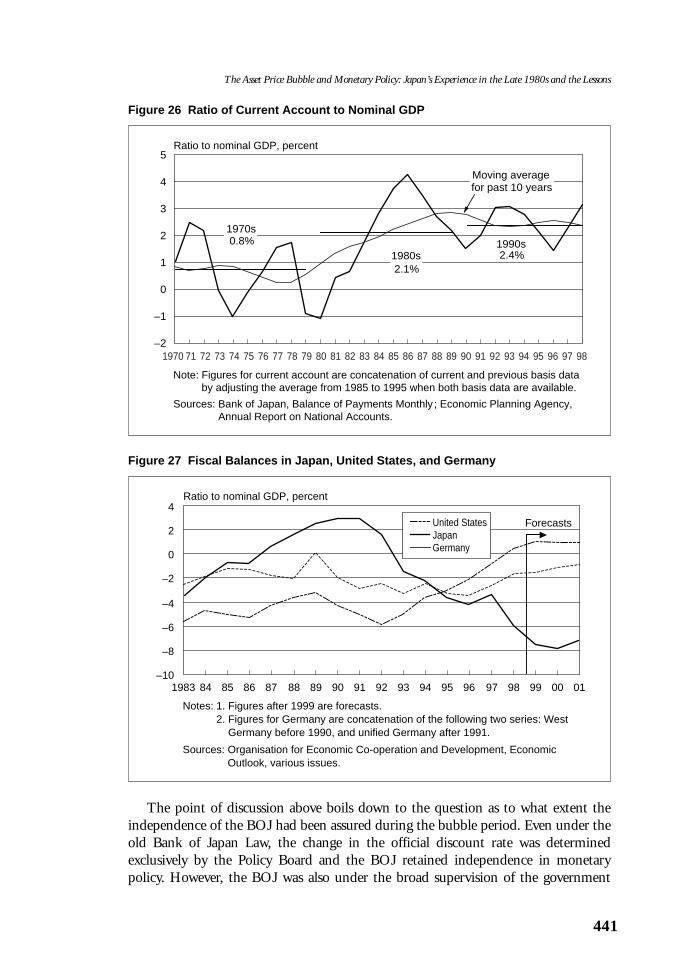
The point of discussion above boils down to the question as to what extent theindependence of the BOJ had been assured during the bubble period. Even under theold Bank of Japan Law, the change in the official discount rate was determined exclusively by the Policy Board and the BOJ retained independence in monetary policy. However, the BOJ was also under the broad supervision of the government
441
The Asset Price Bubble and Monetary Policy: Japan’s Experience in the Late 1980s and the Lessons
Figure 26 Ratio of Current Account to Nominal GDP
–2
–1
0
1
2
3
4
5Ratio to nominal GDP, percent
1970s0.8%
1980s2.1%
1990s2.4%
Moving averagefor past 10 years
1970 71 72 73 74 75 76 77 78 79 80 81 82 83 84 85 86 87 88 89 90 91 92 93 94 95 96 97 98
Figure 27 Fiscal Balances in Japan, United States, and Germany
–10
–8
–6
–4
–2
0
2
4
1983 84 85 86 87 88 89 90 91 92 93 94 95 96 97 98 99 00 01
United StatesJapanGermany
Ratio to nominal GDP, percent
Forecasts
Note: Figures for current account are concatenation of current and previous basis databy adjusting the average from 1985 to 1995 when both basis data are available.
Sources: Bank of Japan, Balance of Payments Monthly ; Economic Planning Agency,Annual Report on National Accounts.
Notes: 1. Figures after 1999 are forecasts.2. Figures for Germany are concatenation of the following two series: West
Germany before 1990, and unified Germany after 1991.
Sources: Organisation for Economic Co-operation and Development, EconomicOutlook, various issues.
(the Ministry of Finance) which is responsible for fiscal policy, and the possibilitycannot be denied a priori that such supervision might have affected the independenceof monetary policy. Under the old law, the BOJ maintained that it had “de factoindependence.”67 The new Bank of Japan Law was put into effect in April 1998, andthe independence and accountability of the BOJ were strengthened in variousrespects.68 Experience under the new law so far seems to suggest the importance ofindependence and accountability that are legally spelled out.
C. Recognizing the Adverse Effects of the BubbleTo summarize the discussions regarding the delay in monetary tightening, we conclude that we had insufficient recognition of the magnitude of damage caused by the bursting of the bubble, which was disproportionately larger than the gainsobtained in the emergence and expansion of the bubble.69 If we analyze the adverseeffects of the bubble with the benefit of hindsight after the bursting of the bubble,the largest adverse effect would be that it induced a prolonged recession through thefollowing three mechanisms. Among these three, while the first works symmetricallybetween the period of the emergence and expansion of the bubble and the period of the bursting of the bubble, the effects of the second and third mechanisms are disproportionately larger during the period of the bursting of the bubble.
The first mechanism is a decline in economic activity accompanying the correc-tion of bullish expectations. For example, we can point out the reversed wealth effectson expenditure and classical stock adjustment as a result of excessive investment during the bubble period.
The second mechanism is a reduction in the economic value of capital equipmentand reduced supply capacity. During the bubble period, capital expenditures dramati-cally increased on the premise of a future rise in asset prices and the underlying pattern of demand. The economic value of such physical assets fell sharply becausethey were unlikely to be utilized in the future and it would have been costly to convert them to different uses. In particular, considering that in the 1990s majorindustrial countries expanded their economies by taking advantage of innovation ininformation and telecommunications technology, the question of which areas had
442 MONETARY AND ECONOMIC STUDIES (SPECIAL EDITION)/FEBRUARY 2001
67. Regarding independence of the BOJ at the time, the Institute for Monetary and Economic Studies of the BOJ(1986) stated that “under the current law, the BOJ is widely under the supervision of the Ministry of Finance.Individual items subject to supervision are stipulated in detail, and the Ministry of Finance retains the right toissue general business directives and supervisory ordinances as well as to dismiss senior management . . . .However, since the Bank always maintains close contact and a cooperative relationship with the government, theabove-mentioned right has never been exercised and, in fact, monetary policy has been conducted independentlyunder the sole responsibility of the Bank of Japan” (p. 445, authors’ translation).
68. For example, independence was strengthened and the transparency of policy decision making mandated legally.First, the wide-ranging right of the government to issue general business directives was abolished and the right ofthe government became limited to supervision of compliance with laws and articles of association. Second, thereasons for the dismissal of senior management are confined to those such as bankruptcy, physical and mentaldisorders, and imprisonment. Third, if the Minister of Finance does not approve the operational budget of theBOJ, the Minister must publish the reasons. Fourth, monetary policy directives are to be decided by a majorityvote at Monetary Policy Meetings accompanied by a high degree of transparency with detailed minutes publishedafter meetings.
69. The IMF (1989, 1990) expressed an optimistic view of the future course of economic developments in Japan, saying that both high economic growth and price stability could be achieved through appropriate economic policy management.

been the recipients of business fixed investment during the bubble period in Japanturned out to be of the utmost significance. In this context, we should recognize thatthe serious dynamic resource misallocation caused by misguided prices during thebubble period was a mechanism inducing economic stagnation.70
The third and the most important mechanism is a so-called balance-sheet adjustment, in which a fall in asset prices eroded the asset quality of both lenders andborrowers, and reduced credit availability through the erosion of capital base, leadingto a decline in economic activity. The capital base functions as a buffer against futurerisks and losses. Such a function is not clearly recognized as long as the economy isexpanding smoothly. The effects of a capital base shortage will materialize once theoutlook for economic expansion changes. After the bursting of the bubble, as assetprices fell and the capital base was substantially reduced, the possibility of bankruptcyincreased among financial institutions, firms, and individuals. Under such circum-stances, economic agents whose capital base had been eroded became cautious in taking on risks and also in doing business with counterparties whose capital base had been eroded.71
VI. Lessons for the Bank of Japan
As explained in the preceding chapters, a bubble is defined as a phenomenon inwhich expectations become extremely bullish as various factors work in a complexmanner. As such, we may not be able to completely prevent the emergence of a bub-ble. The most orthodox approach is to build into the economic fabric a mechanismof self-restraint, recognizing that bullish expectations might sometimes intensify tothe extreme. In this chapter, we intend to draw four lessons for central banks, bearingin mind the importance of self-restraint in responding to a bubble.
A. Importance of Forward-Looking Monetary PolicyThe most significant lesson that central banks have learnt from the emergence of bubble economies is the importance of conducting monetary policy in such a forward-looking manner that it is possible to grasp the potential risk to the economyas early as possible.
As evidenced by the experience of Japan’s bubble period, a bubble is not generatedsuddenly, but expands as it gradually accumulates energy. Therefore, it is importantto deal with a possible bubble in a preemptive manner with a view to the future riskof inflation rather than to make a belated response only after inflation or the existence of a bubble visibly materializes. Perhaps monetary policy alone cannot
443
The Asset Price Bubble and Monetary Policy: Japan’s Experience in the Late 1980s and the Lessons
70. While the first mechanism materializes mainly from the demand side, the second comes mainly from the supply side.
71. Bernanke, Gertler, and Gilchrist (1996) advocate a “financial accelerator” theory, where a vicious circle between adecline in asset prices and a decline in demand will be created if information asymmetry exists between those whosupply funds and those who demand funds. Balance-sheet adjustment is regarded as reflecting a more cautious lending attitude on the part of financial institutions from the viewpoint of firms, and as a more cautious investmentattitude on the part of firms and a decline in demand for funds from the viewpoint of financial institutions.
prevent a bubble from emerging. However, if monetary policy were conducted in aforward-looking manner, economic fluctuations would be smaller.72
Needless to say, in the very process of the expansion of a bubble, it is difficult to identify whether it is really a bubble or not. One reason for this is the possibilitythat the economic structure might be undergoing change. When productivity is rising reflecting a change in economic structure, strong monetary tightening based on the assumption that the economic structure has not changed would constrain economic growth potential. In such a case, the central bank is faced with two different kinds of risks.
This issue can be regarded as similar to a problem of statistical errors in the testprocedure of statistical inference. Put metaphorically, Type I error (erroneously rejecta hypothesis when it is true) corresponds to a case where (though a “New Economy”theory may be correct) rejecting the theory means the central bank erroneously tightens monetary conditions and suppresses economic growth potential. Type IIerror (failure to reject a hypothesis when it is false) corresponds to a case in which a bubble is mistaken as a transitionary process to a “New Economy,” and the central bank allows inflation to ignite. Given that one cannot accurately tell inadvance which one of the two statistical errors the central bank is more likely tomake, it is important in the conduct of monetary policy to consider not only theprobability of making an error but also the relative cost of each error. Based on theexperience of Japan’s bubble period, it is important for the central bank to recognizethat making the Type II error is fatal compared with the Type I error when facedwith bubble-like phenomena.
Of course, a comparison of risks inherent in the two types of errors does not necessarily imply that monetary policy should be conducted by considering only themore fatal risk. Even though the risk of a bubble is regarded as more fatal, we shouldperhaps choose a gradual tightening rather than a rapid tightening in the conduct ofmonetary policy.73 However, even in such a case, we should take a pragmaticapproach to flexibly select the degree of tightening while paying due attention to notonly Type II error but also Type I error.
How should a forward-looking monetary policy be conducted? The answer is to conduct monetary policy with emphasis on maintaining an environment conducive to sustainable economic growth, which is the ultimate goal of price stability. A favorable environment presumes both price stability and financial system stability.
Price stability, which monetary policy should aim at, is not stability at any particular point in time but rather sustainable stability that can support economicgrowth over the medium to long term. Therefore, even when measured inflation isstable, it will become necessary to raise interest rates promptly to ensure sustainable
444 MONETARY AND ECONOMIC STUDIES (SPECIAL EDITION)/FEBRUARY 2001
72. There may be a case where the market would respond before the central bank if it was thought the central bankwould act in a preemptive manner. In this case, the central bank would follow market movements to change thepolicy rate.
73. Brainard (1967) points out that if there is uncertainty with respect to the multiplier effect of economic policymeasures, then the authorities should adopt a conservative approach. See also Blinder (1998) on this point.However, Stock (1998), by using a small U.S. model, contends that it is desirable to adopt an aggressive policyrule when the economy is undergoing structural change.
price stability if the risk of such stability being impaired is judged to be increasing.74
Monetary policy also influences the financial system through the behavior offinancial institutions and macroeconomic conditions. To achieve financial system stability, it is important to maintain not only a favorable macroeconomic environ-ment but also the soundness of individual financial institutions. In this regard, theregulatory and supervisory authorities play an important role. Thus, it should benoted that, although financial system stability is an important policy objective for thecentral bank, it should be recognized that the central bank does not command thesame power of influence over this objective as it does over price stability when tryingto maintain a favorable environment.
B. Grasping the Risk Profile of the EconomyThe second lesson of the bubble economy is the importance of recognizing the riskprofile of the economy as a whole, which might adversely affect price stability andfinancial system stability from the medium- to long-term viewpoint. No rules existregarding how to recognize risks. Based on the experience of Japan’s bubble period,we should examine the issue from the following five perspectives: the output gap in the economy, money supply and credit, asset prices, the behavior of financial institutions, and the interaction of various risks.1. Output gapIn the bubble period, the overheating of the real economy was most vividly evidencedby labor market and capacity utilization data. Of course, there is a lag between thetightening in the labor market and capacity utilization, and a rise in wages and prices.However, as it is not easy to increase capacity in the short run, the economy shouldbe carefully monitored when the output gap narrows.2. Money supply and creditIn the bubble period, we could have extracted useful information from such data asan increase in money supply and credit. After the 1970s, money supply fluctuatedwidely on two occasions: in the first half of the 1970s when the yen appreciated and the first oil crisis occurred, and after the latter half of the 1980s. These two occasions coincided with periods of considerable fluctuations in prices in general aswell as asset prices (except for the period when the second oil crisis occurred).Furthermore, during these two periods, real economic growth rates also experiencedlarge fluctuations.
At present, no consensus exists among central banks concerning how to placemoney supply in the conduct of monetary policy. Based on past experience, includ-ing the bubble period, when money supply and credit show a very large upswing, weshould pay close attention to such movements in the conduct of monetary policy onthe presumption that large fluctuations in these indices may indicate the possibilityof undesirable changes in economic activity.
445
The Asset Price Bubble and Monetary Policy: Japan’s Experience in the Late 1980s and the Lessons
74. FRB Chairman Greenspan discusses the definition of price stability that monetary policy should pursue andreferred to an operating definition of price stability from a central banker’s point of view: “Price stability obtainswhen economic agents no longer take account of the prospective change in the general price level in their economic decision making” (Greenspan [1996]). See Shiratsuka (1997) for discussion on the definition of pricestability as the target of monetary policy.
3. Asset pricesMonetary policy cannot control the level of asset prices. If it dared to do so, it wouldamplify fluctuations in economic activity. Nevertheless, we should recognize theimportance of asset prices in the conduct of monetary policy because they influencemonetary policy in a variety of ways. First, asset prices affect expenditures throughwealth effects. Second, they contain valuable information about expectations regardingthe future economic outlook. If we make use of asset prices in obtaining information,we must be mindful of the fact that a change in asset prices reflects not only the inflationary expectations of private economic agents but also other factors such as phenomena similar to the bubble and structural change in the economy.75 Third, achange in asset prices may have a huge impact on financial system stability and, in duecourse, on economic activity as a whole.76
As Kindleberger (1995) points out, there are no cookbook rules to deal with assetprices.77 However, we think it important to accurately analyze changes in asset pricesand examine whether the expectations implied are sustainable in relation to thecourse of the overall economy, bearing the above three viewpoints in mind.4. Behavior of financial institutionsThe expansion of a bubble accompanies the expansion of money supply and credit.One cannot judge whether the expansion of money supply and credit is compatiblewith sustainable economic growth just by looking at growth rates of money supplyand credit. To evaluate the nature of expansion, the content has to be taken into consideration. For example, borrowing costs and covenant clauses such as collateralrequirements, types of collateral and haircut rates are important. Another importantpoint is how an increase in bank liabilities, i.e., money supply, corresponds to anincrease in the assets of financial institutions. During the bubble period in Japan,money supply and credit were discussed from quantitative viewpoints. But we alsoneed to monitor the credit creation behavior of financial institutions and analyze howit might affect the economy.5. Interaction of risksIn retrospect, during the bubble period financial institutions took risks that were outof proportion to expected profits. There was lack of recognition about risks related tothe economy as a whole and the financial system, especially the concentration andinteraction of risks.
The interaction of risks takes various forms. First, let us look at the interaction ofrisks among different but related industries. For example, during the bubble periodthe high profitability of computer-related industries owed greatly to large computer-related investments by financial institutions. Such investments, triggered by financial
446 MONETARY AND ECONOMIC STUDIES (SPECIAL EDITION)/FEBRUARY 2001
75. Shiratsuka (1999) examines the possibility of incorporating asset prices in the price index. He concludes that it isvery difficult to construct a price index which includes asset prices for the following reasons: accuracy and cover-age of asset price statistics are low; changes in asset prices depend on various factors; they are also significantlyinfluenced by economic and financial developments.
76. For example, the possibility of utilizing information, which can be extracted from derivatives markets and otherfinancial markets, is one important issue to be examined (see Nakamura and Shiratsuka [1999]).
77. Kindleberger (1995) said on this point that “When speculation threatens substantial rises in asset prices, with apossible collapse in asset markets later, and harm to the financial system, or if domestic conditions call for onesort of policy, and international goals another, monetary authorities confront a dilemma calling for judgment,not cookbook rules of the game. It is, I believe, realistic.”
globalization and the progress of technological innovation, were also closely related to a rise in asset prices. Under these circumstances, the economy tended to be influenced by a larger increase in asset prices than generally thought. Second, risksarising from the correlation between loan value and collateral value can be pointedout. During the bubble period, real estate and stocks were often accepted as collateral. However, if the profitability of businesses financed by secured loans isclosely related to collateral value, such loans become practically unsecured since profits and collateral value move in the same direction.
These aggregate risks are not merely the sum of risks recognized by individualeconomic agents. Here, the interaction of various risks plays an important role. In addition, the interaction of risks may arise between financial and nonfinancial sectors. Therefore, a perspective that recognizes aggregate risks is quite important,and it becomes crucial which risk factor should be watched under evolving economicand financial conditions.
The BOJ gathers information regarding the economy and financial systemthrough its examination and monitoring of financial institutions and also throughdaily dialogue with financial market participants. The BOJ is well positioned to graspthe risk profile of the economy, which may adversely affect sustainable economicgrowth, by taking advantage of such information.
C. Relationship with the Prevailing Policy AgendaThe third lesson we have learnt from the bubble period is the importance of workingon the policy agenda. In Chapter V, we described three policy agenda items, namely,international policy coordination, preventing the appreciation of the yen, and areduction in the current account surplus by expanding domestic demand, which constrained the conduct of monetary policy during the bubble period. We alsoexplained the relationship with fiscal policy. Although various agenda that may bedetrimental to the fundamental mission of the central bank may surface dependingon economic conditions at the time, it will be difficult for the conduct of monetarypolicy to be immune from any particular policy agenda once it proliferates. Hence, itis important for the central bank to constantly express its views on key policy items.
D. Importance of Designing an Appropriate Institutional FrameworkThe fourth and last lesson from the bubble period is the need to design an appro-priate institutional framework. Monetary policy influences the decisions and behavior of private economic agents through interest rates and liquidity. But thedegree of influence depends on the institutional framework, such as the supervisionof financial institutions, taxation, the regulatory framework, accounting system, andlegal infrastructure.
Considering the experience during the bubble period in Japan, if financial deregulation had progressed at an earlier stage, and if the regulatory and supervisoryframework had been modified in line with the changes in financial markets, thebehavior of financial institutions would probably have been different to some extent.If taxation on land had not been biased toward accelerating an increase in land prices,the degree of increase in land prices would have been different. If the BOJ had
447
The Asset Price Bubble and Monetary Policy: Japan’s Experience in the Late 1980s and the Lessons
Bank for International Settlements, 63rd Annual Report, 1993.———, Quarterly Review: International Banking and Financial Market Developments, August 1999.Bank of Japan Institute for Monetary and Economic Studies, Shin Ban Wagakuni no Kin’yu Seido
(Japanese Financial System: New Edition), 1986 (in Japanese).———, Research and Statistics Department, “Endaka ka no Keizai Chosei ni Tsuite (Economic
Adjustment under the Yen’s Appreciation),” Chousa Geppo (Monthly Bulletin), Research andStatistics Department, Bank of Japan, February 1987a (in Japanese).
———, “Jousei Handan Shiryo: 62-nen Haru (Quarterly Economic Outlook: Spring 1987),” ChousaGeppo (Monthly Bulletin), Research and Statistics Department, Bank of Japan, April 1987b (in Japanese).
———, “Saikin no Manei Sapurai Doukou ni Tsuite (Recent Development of Monetary Aggregates),”Chousa Geppo (Monthly Bulletin), Research and Statistics Department, Bank of Japan, February1988 (in Japanese).
———, “Jousei Handan Shiryo: Heisei Gan-nen Fuyu (Quarterly Economic Outlook: Winter 1989),”Chousa Geppo (Monthly Bulletin), Research and Statistics Department, Bank of Japan, January1989a (in Japanese).
———, “Shouwa 63 Nendo no Kin’yu Oyobi Keizai no Doukou (Annual Review of Monetary andEconomic Developments in Fiscal 1988),” Chousa Geppo (Monthly Bulletin), Research andStatistics Department, Bank of Japan, May 1989b (in Japanese).
———, “Wagakuni ni Okeru Kin’nen no Chika Joushou no Haikei to Eikyo ni Tsuite” (Causes ofRecent Rise in Land Prices and Their Impacts),” Chousa Geppo (Monthly Bulletin), Researchand Statistics Department, Bank of Japan, April 1990a (in Japanese).
———, “Heisei Gan-nendo no Kin’yu Oyobi Keizai no Doukou (Annual Review of Monetary andEconomic Developments in Fiscal 1989),” Chousa Geppo (Monthly Bulletin), Research andStatistics Department, Bank of Japan, May 1990b (in Japanese).
Bernanke, Ben, and Mark Gertler, “Monetary Policy and Asset Price Volatility,” in New Challenges forMonetary Policy, Federal Reserve Bank of Kansas City, 1999.
———, ———, and Simon Gilchrist, “The Financial Accelerator and the Flight to Quality,” Review ofEconomics and Statistics, 78 (1), 1996, pp. 1–15.
Blinder, Alan S., Central Banking in Theory and Practice, MIT Press, 1998.Borio, C. E. V., N. Kennedy, and S. D. Prowse, “Exploring Aggregate Asset Price Fluctuations Across
Countries: Measurement, Determinants and Monetary Policy Implications,” BIS EconomicPapers, No. 40, 1994.
Brainard, William, “Uncertainty and the Effectiveness of Policy,” American Economic Review, 57 (2),1967, pp. 411–425
Cargill, Thomas F., Michael M. Hutchison, and Takatoshi Ito, The Political Economy of JapaneseMonetary Policy, MIT Press, 1997.
implemented reform measures with respect to the short-term money market and window guidance at an earlier stage, as we touched upon in Chapter IV, economicdevelopments might have been slightly better.
If an institutional framework is likely to adversely affect sustainable price stabilityand financial system stability, the BOJ should analyze the macroeconomic impactand make known its views to the public, even if the BOJ is not directly responsiblefor designing the institutional framework. At the same time, it is important that the BOJ should make efforts to review and modify, if necessary, any institutionalframework for which it is primarily responsible as the economic and financial environment changes.
448 MONETARY AND ECONOMIC STUDIES (SPECIAL EDITION)/FEBRUARY 2001
References
449
The Asset Price Bubble and Monetary Policy: Japan’s Experience in the Late 1980s and the Lessons
Feldstein, Martin, “Distinguished Lecture on Economics in Government: Thinking about InternationalEconomic Coordination,” Journal of Economic Perspectives, 2 (2), 1988, pp. 3–13.
Frankel, Jeffrey A., and Katharine E. Rockett, “International Macroeconomic Policy CoordinationWhen Policymakers Do Not Agree on the True Model,” American Economic Review, 78 (3),1988, pp. 318–340.
Friedman, Benjamin M., “The Rise and Fall of Money Growth Targets as Guidelines for U.S.Monetary Policy,” in Iwao Kuroda, ed. Towards More Effective Monetary Policy, London:Macmillan Press, 1997, pp. 137–164.
Funabashi, Yoichi, Managing the Dollar: From the Plaza to the Louvre, Institute for InternationalEconomics, 1988.
Greenspan, Alan, “Opening Remarks,” in “Achieving Price Stability,” a symposium sponsored by theFederal Reserve Bank of Kansas City, 1996.
Higo, Masahiro, “What Can Inflation Expectations and Core Inflation Tell Us about Monetary Policyin Japan?” IMES Discussion Paper No. 99-E-22, Institute for Monetary and Economic Studies,Bank of Japan, 1999.
Hoshi, Takeo, “What Happened to Japanese Banks?” Monetary and Economic Studies, 19 (1), Institutefor Monetary and Economic Studies, Bank of Japan, 2001, pp. 1–30.
———, and Anil Kashyap, “The Japanese Banking Crisis: Where Did It Come from and How Will ItEnd?” NBER Working Paper No. 7250, National Bureau of Economic Research, 1999.
International Monetary Fund, World Economic Outlook, 1989.———, World Economic Outlook, 1990.Iwamoto, Yasushi, Fumio Ohtake, Makoto Saito, and Koichi Futagami, Keizai Seisaku to Makuro
Keizai Gaku (Economic Policy and Macroeconomics), Nihon Keizai Shimbunsha, 1999 (in Japanese).
Iwata, Kikuo, Kin’yu Seisaku no Keizai Gaku: “Nichigin Riron” no Kensho (Economics of MonetaryPolicy: Examination of “BOJ Theory”), Nihon Keizai Shimbunsha, 1993 (in Japanese).
Kanoh, Satoru, and Hideaki Murase, “On Land Price Formation: Bubble versus Option,” JapaneseEconomic Review, 50 (2), 1999, pp. 212–226.
Kent, Christopher, and Phillip Lowe, “Asset-Price Bubbles and Monetary Policy,” Research DiscussionPaper No. 9709, Reserve Bank of Australia, 1997.
Kindleberger, Charles P., “Asset Inflation and Monetary Policy,” BNL Quarterly Review, 192, 1995, pp. 17–37.
Komiya, Ryutaro, Gendai Nihon Keizai (Japanese Economy in Our Time), University of Tokyo Press,1988 (in Japanese).
———, Boueki Kuroji-Akaji no Keizai Gaku (Economics of Trade Surplus and Deficit), Toyo KeizaiShimposha, 1994 (in Japanese).
Matsushita, Yasuo, “Global Economic Integration and the Central Bank,” Bank of Japan QuarterlyBulletin, 3(3), Bank of Japan, 1995, pp. 5–13.
Mieno, Yasushi, Ri wo Mite Gi wo Omou (Recall Faith to See What Makes a Profit), Chuo Koronsha,2000 (in Japanese).
Ministry of Finance, “Shisan Kakaku Hendo no Mekanizumu to Sono Keizai Kouka (Mechanism ofAsset Price Fluctuations and Its Economic Impact),” Financial Review, 30, Institute for Fiscaland Monetary Studies, Ministry of Finance, 1993 (in Japanese).
Nakamura, Hisashi, and Shigenori Shiratsuka, “Extracting Market Expectations form Option Prices:Case Studies in Japanese Option Markets,” Monetary and Economic Studies, 17 (1), Institute forMonetary and Economic Studies, Bank of Japan, 1999, pp. 1–43.
National Land Agency, Shuto-Ken Kaizo Keikaku (Remodeling the Tokyo Metropolitan Area), Shuto-Ken Seibi Kyokai, 1985 (in Japanese).
———, Kokusai Shushi Fukinkou ka no Kin’yu Seisaku (Monetary Policy under External Imbalance),Toyo Keizai Shimposha, 1992 (in Japanese).
Nishimura, Kiyohiko, Nihon no Chika no Kimari Kata (Way to Determine Land Prices in Japan),Chikuma Shobo, 1995 (in Japanese).

Noguchi, Yukio, Tochi no Keizai Gaku (Economics of Land), Nihon Keizai Shimbunsha, 1989 (in Japanese).
———, Baburu no Keizai Gaku (Economics of the Bubble), Nihon Keizai Shimbunsha, 1992 (in Japanese).
Ogata, Shijuro, Yen to Nichigin (Yen and the Bank of Japan), Chuko Shinsho, 1996 (in Japanese).Ogawa, Kazuo, and Shinichi Kitasaka, Shisan Shijo to Keiki Hendo (Asset Markets and Economic
Fluctuations), Nihon Keizai Shimbunsha, 1998 (in Japanese).Ohta, Takeshi, Kokusai Kin’yu—Genba Kara no Shougen (International Finance—Witness Concerned),
Chuko Shinsho, 1991 (in Japanese).Okumura, Hirohiko, Gendai Nihon Keizai Ron (An Essay on Current Japanese Economy), Toyo Keizai
Shimposha, 1999 (in Japanese).Shigemi, Yusuke, “Asset Inflation in Selected Countries,” Monetary and Economic Studies, 13 (2),
Institute for Monetary and Economic Studies, Bank of Japan, 1995, pp. 89–130.Shiller, Robert J., Irrational Exuberance, Princeton University Press, 2000.Shiratsuka, Shigenori, “Inflation Measures for Monetary Policy: Measuring the Underlying Inflation
Trend and Its Implication for Monetary Policy Implementation,” Monetary and EconomicStudies, 15 (2), Institute for Monetary and Economic Studies, Bank of Japan, 1997, pp. 1–26.
———, “Asset Price Fluctuation and Price Indices,” Monetary and Economic Studies, 17 (3), Institutefor Monetary and Economic Studies, Bank of Japan, 1999, pp. 103–128.
Stock, James H., “Monetary Policy in a Changing Economy: Indicators, Rules, and the Shift towardIntangible Output,” IMES Discussion Paper No. 99-E-13, Institute for Monetary andEconomic Studies, Bank of Japan, 1998.
Suzuki, Yoshio, Nihon no Kin’yu Seisaku (Japanese Monetary Policy), Iwanami Shinsho, 1993 (in Japanese).
Takao, Giichi, Heisei Kin’yu Fukyo (Heisei Financial Depression), Chuko Shinsho, 1994 (in Japanese).Taylor, John B., Macroeconomic Policy in a World Economy, New York: Norton, 1993.Ueda, Kazuo, “The Japanese Current Account Surplus and Fiscal Policy in Japan and the U.S.,” in
J. Shoven, ed. Government Policy towards Industry in the United States and Japan, CambridgeUniversity Press, 1988, pp. 145–172.
Vogel, Ezra F., Japan as Number One, Harvard University Press, 1979.Volcker, Paul A., “Statements to Congress,” Federal Reserve Bulletin, Federal Reserve Board, April 1986.———, and Toyoo Gyoten, Changing Fortune, Times Books, 1992.Yamaguchi, Yutaka, “Asset Price and Monetary Policy: Japan’s Experience,” in New Challenges for
Monetary Policy, Federal Reserve Bank of Kansas City, 1999.Yoshitomi, Masaru, Nihon Keizai no Shinjitsu (Truth of the Japanese Economy), Toyo Keizai
Shimposha, 1998 (in Japanese).
450 MONETARY AND ECONOMIC STUDIES (SPECIAL EDITION)/FEBRUARY 2001