the assessment of atfish produer organisations …
TRANSCRIPT

A RESEARCH THESIS SUBMITTED TO
VAN HALL LARENSTEIN UNIVERSITY OF APPLIED SCIENCES
ON
THE ASSESSMENT OF CATFISH PRODUCER ORGANISATION’S PERFORMANCE, LINKING SMALL SCALE
CATFISH FARMERS TO PROFITABLE MARKET IN NCHIA, ELEME LGA IN RIVERS STATE,NIGERIA.
By
Sotonye Mangibo
22nd October,2020.
© Copyright “Sotonye Mangibo” 2020. All rights reserve

i
Assessment of producer organization’s performance linking small scale catfish farmers to efficient market in Nchia, Eleme Local Government area, Rivers state, Nigeria. A research project submitted to Van Hall Larenstein University of Applied Sciences in partial fulfilment of the requirements for the degree of MSC in Agricultural production chain management Specialization: Livestock Chains By Sotonye Mangibo October 2020. Supervisor Johan Meinderts Assessor Fred Bomans © Copyright “Sotonye Mangibo” 2020. All Rights Reserved

ii
Table of Contents LIST OF TABLES ............................................................................................................................................. vi
LIST OF FIGURES .......................................................................................................................................... vii
ACKNOWLWDGEMENT ................................................................................................................................ ix
DEDICATION .................................................................................................................................................. x
Chapter one .................................................................................................................................................. 1
1.0 Background ............................................................................................................................................. 1
1.1 RESEARCH PROBLEM ........................................................................................................................... 4
1.1.1 PRIMARY PROBLEM OWNER ........................................................................................................ 4
1.1.2 SECONDARY PROBLEM OWNER/COMMISSIONER: ...................................................................... 4
1.1.3 MY ROLE AS A RESEARCHER ............................................................................................................. 4
1.2 RESEARCH AIM .................................................................................................................................... 5
1.4 RESEARCH OBJECTIVE ......................................................................................................................... 5
1.5 RESEARCH JUSTIFICATION ................................................................................................................... 5
1.6 RESEARCH QUESTIONS ........................................................................................................................ 5
What is hindering the performance of the catfish value chain from effective marketing in Nchia, Eleme
LGA? .......................................................................................................................................................... 5
CHAPTER TWO .............................................................................................................................................. 6
2.0 LITERATURE REVIEW ............................................................................................................................... 6
2.1 THE CATFISH INDUSTRY IN NIGERIA ................................................................................................... 6
2.2 THE CATFISH INDUSTRY IN RIVER STATE............................................................................................. 6
2.3 CATFISH PRODUCTION SYSTEMS ........................................................................................................ 7
2.3.1 HATCHERY (PRODUCTION OF CATFISH FINGERLINGS) ................................................................ 7
2.3.2 OUT-GROW PONDS (PRODUCTION OF TABLE CATFISH) .............................................................. 7
2.4 POST-PRODUCTION OPERATIONS ....................................................................................................... 8
2.4.1 HARVESTING ................................................................................................................................ 8
2.4.2 PROCESSING ................................................................................................................................. 8
2.4.3 VALUE ADDITION TO CATFISH ...................................................................................................... 8

iii
2.5 MARKETING AND DISTRIBUTION CHANNELS ...................................................................................... 8
2.6 PRODUCER ASSOCIATIONS IN THE CATFISH INDUSTRY .................................................................... 10
2.6.1 FARMERS’ COOPERATIVE ........................................................................................................... 10
2.6.2 INFORMAL GROUPS ................................................................................................................... 10
2.7 CHALLENGES AND OPPORTUNITY FACED BY FARMER GROUPS ....................................................... 11
2.8 FACTOR INFLUENCING POOR PERFORMANCE OF CATFISH MARKETING ......................................... 11
2.8.1 SOCIO ECONOMIC FACTORS AFFECTING CATFISH MARKETING ................................................ 12
2.8.2 MARKET FACTORS AFFECTING CATFISH..................................................................................... 12
2.9 ECONOMIC EFFICIENCY ..................................................................................................................... 13
2.9.1 VERTICAL INTEGRATION ............................................................................................................. 14
2.10 CHAIN GOVERNANCE ...................................................................................................................... 14
2.11 CHAIN ACTORS ................................................................................................................................ 14
2.12 DEFINITION OF KEY TERMS ............................................................................................................. 16
2.13 CONCEPTUAL FRAMEWORK............................................................................................................ 17
CHAPTER THREE .......................................................................................................................................... 18
3.0 RESEARCH METHODOLOGY .................................................................................................................. 18
3.1 RESEARCH DESIGN AND METHODOLOGY ......................................................................................... 18
3.2 STUDY AREA ...................................................................................................................................... 18
3.3 RESEARCH STRATEGY ........................................................................................................................ 19
3.4 DATA COLLECTION METHODS ........................................................................................................... 20
3.5 SAMPLING PROCEDURE .................................................................................................................... 21
3.6 FOCUS GROUP DISCUSSION .............................................................................................................. 22
3.7 DATA ANALYSIS ................................................................................................................................. 22
3.8 RESEARCH LIMITATIONS ................................................................................................................... 25
CHAPTER FOUR ........................................................................................................................................... 26
4.0 RESEARCH FINDINGS AND ANALYSIS .................................................................................................... 26
4.1 STAKEHOLDERS AND THEIR ROLES ................................................................................................... 26
4.2 VALUE CHAIN SUPPORTERS AND ROLES ........................................................................................... 27
4.3 CHAIN CORDINATION ........................................................................................................................ 28

iv
4.3.1 GOVERNANCE STRUCTURE IN THE CHAIN ................................................................................. 28
4.3.2 CHAIN RELATIONSHIP ................................................................................................................ 29
4.3.3 PRODUCT FLOW ......................................................................................................................... 30
4.3.4 INFORMATION FLOW ................................................................................................................. 30
4.3.5 CASH FLOW ................................................................................................................................ 30
4.4 VALUESHARE ..................................................................................................................................... 30
4.5 CHALLENGES IN THE CHAIN .............................................................................................................. 32
4.5.1 PRODUCTION CHALLENGES ....................................................................................................... 32
4.5.2 PROCESSING CHALLENGES ......................................................................................................... 32
4.6 SOCIOECONOMIC FACTORS .............................................................................................................. 32
4.6.1 GENDER ...................................................................................................................................... 32
4.6.2 AGE ............................................................................................................................................. 33
4.6.3 LEVEL OF EDUCATION OF CATFISH FARMERS ............................................................................ 34
4.6.4 YEARS OF EXPERIENCE OF CATFISH FARMERS ......................................................................... 35
4.6.5 PRIMARY OCCUPATION OF CATFISH FARMERS ......................................................................... 36
4.6.6 SOURCE OF INCOME OF CATFISH FARMERS .............................................................................. 37
4.7 MARKET FACTORS ............................................................................................................................. 38
4.7.1 COSTOMERS REQUIREMENT ...................................................................................................... 39
4.7.2 PRICE OF CATFISH ...................................................................................................................... 39
4.7.3 INPUT MARKET ........................................................................................................................... 40
4.7.4 PRICE SATISFACTION AMONGST CATFISH FARMERS ................................................................. 41
4.8 INSTITUTIONAL FACTORS .................................................................................................................. 43
4.9 PRODUCER ORGANIZATION PERFORMANCE WITH CATFISH FARMERS ........................................... 44
4.9.1 RELATIONSHIP BETWEEN LEVEL OF EXPERIENCE AND INCOME OF CATFISH FARMERS ........... 45
4.9.2 CHALLENGES WITH CATFISH SALES ............................................................................................ 45
4.9.3 SUPPORT FROM PRODUCER ORGANISATIONS .......................................................................... 46
4.9.4 INCOME PER MONTH FOR COOPERATIVE MEMBERS/NON-MEMBERS .................................... 47
4.9.5 ACCESS TO EXTENSION SERVICES .............................................................................................. 49
4.10 SUGGESTIONS FOR PRODUCER ORGANISATIONS FOR EFFICIENT MARKETING ............................. 49

v
4.11 SUGGESTIONS FOR PRODUCER ORGANISATIONS TO IMPROVE MARKET INFORMATION ............. 50
4.12 MARKET REQUIREMENTS FOR CATFISH .......................................................................................... 50
4.13 THE EFFECT OF COVID 19 ON CATFISH FARMING ........................................................................... 51
4.14 SWOT FOR PORT HARCOURT FISH FARMERS FORUM (INFORMALPRODUCER ORGANISATION) .. 52
4.15 A SWOT FOR AN FORMAL PRODUCER ORGANSATION (CAFFAN) Port Harcourt ......................... 52
4.16 PRODUCER ORGANISATION ASSESSMENT USING MIDCA .............................................................. 53
4.17.1 INTERNAL ORGANIZATION ASSESSMENT................................................................................. 54
4.17.2 MARKET .................................................................................................................................... 55
4.17.3 PRODUCTION ........................................................................................................................... 55
4.18 CURRENT BUSINESS CANVAS .......................................................................................................... 56
CHAPTER 5 .................................................................................................................................................. 59
5.0 DISCUSSION AND CONCLUSION ............................................................................................................ 59
5.1 STAKEHOLDERS AND THEIR ROLES ................................................................................................... 59
5.2 SOCIOECONOMIC FACTORS .............................................................................................................. 59
5.3 INPUT AND OUTPUT MARKET FACTORS ........................................................................................... 61
5.4 MARKET ANALYSIS USING MARKET MIX ........................................................................................... 62
5.5 INSTITUTIONAL FACTORS .................................................................................................................. 62
5.6 SUGGESTIONS FOR PRODUCER ORGANISATIONS TO INCREASE PROFIT IN CATFISH MARKETING .. 63
5.7 SUGGESTIONS FOR PRODUCER ORGANISATIONS TO INCREASE MARKET INFORMATION............... 64
5.8 MIDCA Tool for PFFF assessment...................................................................................................... 65
5.9 REFLECTION ........................................................................................................................................... 68
CHAPTER SIX ................................................................................................................................................ 71
6.0 CONCLUSION ......................................................................................................................................... 71
CHAPTER SEVEN .......................................................................................................................................... 73
7.0 RECOMMENDATIONS...................................................................................................................... 73
References .................................................................................................................................................. 76
Annexes ANNEX 1: PO ASSESSMENT USING MIDCA ............................................................................ 86

vi
LIST OF TABLES Table 1: Research analysis table ................................................................................................................. 24
Table 2: Chain supporters and their roles ................................................................................................... 28
Table 3: A table showing Value Share of the actors in the catfish value chain ......................................... 31
Table 4: A Table showing the percentage and number of male and female catfish farmers ..................... 33
Table 5: A table showing the age range of catfish farmers in percentages .............................................. 34
Table 6: A table showing the Level of Education of catfish farmers in percentages ................................. 35
Table 7:A Table showing the level of experience of catfish farmers in percentages ................................. 35
Table 8: A table showing catfish farmers that have other sources of Income in percentages .................. 37
Table 9: A table showing Transportation Challenge of catfish farmers in percentages ............................ 44
Table 10: A Table showing catfish farmers in producer organisations in percentages ............................. 44
Table 11: Market Requirement Table ......................................................................................................... 51
Table 12: A SWOT Analysis for Informal Group (Port Harcourt fish farmers’ forum) ................................ 52
Table 13: SWOT analysis for a formal cooperative ..................................................................................... 53
Table 14: SWOT and PESTEC for Catfish Farming ....................................................................................... 58

vii
LIST OF FIGURES Figure 1: Problem Tree.................................................................................................................................. 3
Figure 2: Market Interest Matrix ................................................................................................................ 13
Figure 3: Chain Governance ........................................................................................................................ 14
Figure 4: Conceptual FrameworK................................................................................................................ 17
Figure 5: Map showing Nchia in Eleme L.G.A of Rivers state Nigeria. ........................................................ 19
Figure 6: Research Design ........................................................................................................................... 20
Figure 7: A Graph Showing the Type of Transaction between Producers and Traders .............................. 28
Figure 8: A graph showing the Relationship between Catfish Farmers and Buyers ................................... 29
Figure 9: A Graph showing the Purchase of Catfish from Farm Gate ......................................................... 30
Figure 10: A graph showing the percentage of catfish farmers that sell added value products ............... 31
Figure 11: A graph showing Gender presentation of catfish farmers in percentages ............................... 33
Figure 12: A Graph showing the age bracket of catfish farmers in percentages ........................................ 34
Figure 13: A Graph showing the level of education of catfish farmers in percentages .............................. 35
Figure 14: A graph showing the years of Experience of Catfish farmers in percentages .......................... 36
Figure 15: A graph showing catfish farmers that take catfish farming as Primary Occupation ................. 37
Figure 16: A Graph showing catfish farmers with other sources of income .............................................. 38
Figure 17: A graph showing channels through which catfish farmers sell catfish ...................................... 38
Figure 18: A Graph Showing the Source of Price Information .................................................................... 39
Figure 19: A graph showing what customers require in catfish ................................................................ 39
Figure 20: A Graph Showing the Selling Price of 1kg of Catfish among Catfish Farmers ........................... 40
Figure 21: A Graph showing challenges catfish farmers encounter during production ............................. 41
Figure 22: A Graph showing how satisfied catfish farmers are with catfish price in percentages ............. 42
Figure 23: A graph showing institutional challenges catfish farmers encounter in percentages ............... 43
Figure 24: A graph showing the relationship between level of Experience and income of catfish farmers
.................................................................................................................................................................... 45
Figure 25: A graph showing a Comparison of transportation problems amongst catfish farmers in
producer organisations and catfish farmers not in producer organisation ................................................ 46
Figure 26: A Graph showing cooperative activities with marketing for catfish farming ............................ 47
Figure 27: A Graph showing a comparison of Catfish Farmers Income for members of producer
organisations and non-members ................................................................................................................ 48
Figure 28: A graph showing a comparison of access to extension services for producer organisation
members and non-members ...................................................................................................................... 49
Figure 29: MIDCA Assessment .................................................................................................................... 54
Figure 30: Proposed Chain map for Port Harcourt fish farmers Forum...................................................... 65
Figure 31: Proposed CANVAS Business Model for Port Harcourt Fish Farmers Forum .............................. 66

viii
ACRONYMS MEANING
FAO Food and Agriculture Organisation
APP Agricultural Promotion Policy
FMARD Federal Ministry of Agriculture and Rural Development
ADP Agricultural Development Programme
LGA Local Government Area
PFFF Port Harcourt Fish Farmers Forum
CAFAN Catfish Association of Nigeria
PO Producer Organisations
NGO Non-Governmental Organisation
GES Growth Enhancement Programme
KIT The Royal Tropical Institute
ICT Information and Communication Technology

ix
ACKNOWLWDGEMENT First, I would like to give all the glory to God Almighty who has made it possible for me to sail through a year of intensive study for a master’s degree in Van Hall Larenstein, University of Applied Sciences. I acknowledge the staff of Van Hall Larenstein University for the impactful contributions in guiding me through the knowledge and skills I need in my future endeavour and career. Special thanks to Marco Verschuur the course coordinator and my Mentor Albertien Kijne for the tireless mentorship to guide and shape me academically and otherwise. To my supervisor Johan Meinderts, it would have been impossible for me to carry out this research if not for your prompt responses and guidance on what is expected of me through it all. To my colleagues, I am most grateful for all the love and support you lavished on me and my son in such a challenging moment. We made it through. To my most supportive family, thanks for bringing out the best in me. I love you always.

x
DEDICATION I dedicate this report to my dear husband Ariel E. O Umoekah and lovely son Adir A.O.Umoekah who have been with me through this process.

xi
PLAN OF THESIS
This thesis will comprise of seven chapters .chapter one will give an introduction of the topic and a general overview of the topic, it will contain the research problem, the research questions and sub questions, aim and objective of the research, the commissioner and the problem owners.
Chapter two will contain a literature review from online journals, books, articles and websites to know what has been done previously by other researchers .it will also contain a conceptual framework to guide the process of the research.
Chapter three will contain the methodology used in carrying out this research and information about the study area, it will state the different methods and tools used in the data collection and analysis of the data.
Chapter four comprises of the report of findings and analysis, this will be a compilation of all the information gotten from the field for the purpose of the research to answer the research questions.
In chapter five all findings will be discussed and supported or argued with literatures to bring a clear picture of the situation based on data collected with possible solutions
Chapter six will comprise of the conclusion from the data collected and chapter seven will contain short term and long term recommendations and strategies/ plan of actions on which these recommendations can be carried out for the problem owners and commissioner

xii
Abstract
Catfish is a high source of protein and is commonly cultured due to its tolerance for harsh temperatures.
This study looks into analysing the current catfish value chain and assessing the performance of
producer organization for more efficient marketing of catfish for small scale catfish farmers in the
southern part of Nigeria, precisely Nchia in Eleme local government of rivers state. Small scale catfish
farmers are faced with input and output marketing challenges, which have intensified as a result of
many underlining factors, these factors can be categorized into socioeconomic factors, institutional
factors and marketing factors. There is the presence of producer organization expected to solve most of
these problems yet, they persist. Findings show that there is there is a significant difference in the
means of income of catfish farmers in producer organisation compared to catfish farmers not in
producer organisations. Catfish farmers in producer organisation experience less challenges compared
to catfish farmers not in producer organisations however there is low female participation in catfish
production with 81.4% of catfish farmers male and 18.6% female, majority of catfish farmers in the area
being within the age of 30-50years and have had at least formal education. Most catfish farmers have
other sources of income, in spite the potentials in catfish production, producers in the study area still
complain of low farm price, with traders fixing the price for catfish not considering the challenged with
the cost of production for catfish farmers. Production cost is affected of high cost of feed, expensive
transportation, poor infrastructure and poor supply of electricity. Most of these problems can be solved
to increase profitability for small scale catfish farmers through producer organisations by reducing
transaction costs and strengthening farmers bargaining power. For more efficient marketing, the value
chain can be upgraded horizontally and vertically.

1
Chapter one
1.0 Background Fishing contributes to how people secure the necessities of life all over the world; it also contributes richly to their dietary needs (Bino 2016).
In Nigeria, agriculture is a major non-oil international currency earner, source of employment, an important supplier of wealth and poverty mitigation, and contributes largely to Gross Domestic Product (GDP) (Adamu et al, 2013). Fisheries are an essential fragment of the agriculture sector in Nigeria which sustains a constant addition of 3.5 to 4% to total GDP from 2008 to 2012. This translates to about 10% of agricultural GDP (Oladimeji, 2017). In 2015, the total fisheries production was about 1 027 000 tonnes, with a combination of marine catches 36 %, inland waters catch 33% and aquaculture 31% which translated to 0.5% of national GDP (FAO 2017).
With Nigeria’s growing population of about 193 million (Plecher 2020), fish production has contributed in a great way to food security, producing revenue, skills, job opportunities to bring about better living for people in developing nations like Nigeria (Brown et al., 2017). Fish is a very essential source of animal protein; it is also an important source of income in Nigeria. Presently, it makes up about forty percent of animal protein consumption with a great range of vitamins and minerals (Atanda, 2009). It is one of the non-expensive types of animal protein and nutrients. The Nigerian fishery subsector is made up of three sub-categories: namely, the artisanal, the industrial, and aquaculture. The major species cultured and farmed (aquaculture) in Nigeria are Tilapia (Oreochromis niloticus), carp (Cyprinus carpio) and catfish (Clarias gariepinus Heterobranchus spp).
Catfish is outstanding and leads among other farmed fish, its little caloric value, little fat, higher protein holding, and digestion as likened to other protein giving foods. It is also a harmless source of animal protein that is healthy for consumption and this has created high demand for catfish in Nigeria (Adebayo et al., 2013).
However, Marketing of fresh catfish is a challenge to catfish farmers because of increasing competition. The farmers also lack coordination which makes it more difficult (C Martin Webber, Labaste and World Bank, 2010)
According to Ofuoku et al. (2008), producers in the southern part of Nigeria grumbled about their involvements with how they are able to get extension services, influence price for their produce, sell their fish after harvesting, get funds, share experiences and information. This could be as a result of smallholder farmers poorly organized in a formal way and many never grow into formal businesses because of imperfect management abilities, weak organizational capability and serious resource limitations to withstand acceptable performance. With the many challenges of catfish farmers
The farmers have made it known that some of the reasons they consider being a part of cooperatives is to get better marketing benefits like agricultural revenue, profits from price sharing, little selling risk, good products strategy and to be relevant in agricultural matters. However, many farmer cooperatives are mostly motivated by development projects, so when the scheme action is over, it automatically

2
stops the performance of the cooperative (Ochieng et al, 2017). The motivation among farmers for the creation of farmer cooperatives might be additionally hampered due to the history of the ‘old-style socialist cooperatives’ and the established cooperatives may still not be working according to democratic ideologies (Scholl et al., 2016).
In Rivers state with Nchia in view, catfish production face challenges such as fish death, poor quality feed, and low income. Due to inadequate infrastructures like poor electricity and poor water supply, traders do not use appropriate storage facilities thus, exposing the fresh catfish to product loss and lower quality which reduced the gross margin for these traders (Webber and Labaste, 2010). Most of the farmers are characterized by hit-or-miss marketing approaches the farmers have low chances of marketing their products efficiently and do not get full value for their produce (Siddique 2015). These situations encourage the traders to fix prices for fresh catfish irrespective of the associated cost incurred during primary production.
Marketing can be a significant factor to surge the socio-economic position for farmers. The farmers can achieve this through cooperative marketing that gives them a high negotiating position intended for marketing their produce (Raya et al, 2014). However, Farmers cooperatives in though marketing conditions make a number of poor business decisions which can lead to weighty financial strain and at last, the closure of the association due to the lack of necessary expertise to manage the group (Jennifer et al 2009).
There are key factors that can affect the price of fish and in turn affect profitability for example the consumers’ requirement in terms of quality, the method of preservation after harvest before it gets to the market, the weight of the fish and the type of market( George et al 2005) producers often face most challenges associated with the value chain, they are faced with poor quality fingerlings/fish seed, high cost of Feeds and feeding management which account for 70% of production cost, use of traditional techniques, lack of credit, lack of veterinary doctors, and poor infrastructural facilities (Olajide and Omonona, 2019).
Other challenges faced by producers like transaction cost and information asymmetry can result in them making vertical coordination’s along the chain; coordination can therefore be vertical or horizontal. Activities in the chain including marketing can be achieved through vertical coordination where the level of coordination is at the different stages of the value chain (Ton et al, 2007).
Most Producers seem to concentrate more on the production and management of fish than on issues related to the markets and marketing of fish (Oyieng et al, 2015). Production and marketing aspects of agricultural produce are intertwined with each other. For good marketing, the input determines the output and also the price (David et al 2017).
However, producer organisations and farmer cooperatives can strengthen chain coordination horizontally and vertically. lately, they tend to be more vertical taking the tasks of controlling quality, setting up quality standards, and exchanging information in the chain from producers to consumers and vice versa (Ton G et al,2007).
The federal ministry of Agriculture and rural development in 2016 implemented a new policy tagged Agriculture Promotion Policy (APP) to promote food security, import substitution; job creation; and economic diversification. This policy addresses various areas including participation and inclusiveness of

3
farmer groups and cooperatives and sets a quality on the role of these groups or collections as mediators of commercial change in general and farming economy (FMARD, 2016). In this regard, Port Harcourt fish farmers’ forum is a cooperative in Nchia, Eleme L.G.A that oversees production and marketing of catfish in the area and is directly affected by problems relating to catfish production in the area.
Despite the extensively high possibilities in catfish farming, catfish farming is not sufficient to meet the country’s domestic needs (Oladimeji, 2017).
Marketing in groups is an effective and lucrative manner for Small-scale farmers in underdeveloped nations to sell their produce, because the farmers have narrow chances to do so. (Kerstinetal,2016). Catfish producers specify that information inconsistency among the major actors have affected the marketing of fresh catfish. (Animashaun et al,2015).
PROBLEM TREE OF CATFISH FARMERS IN NCHIA, ELEME LGA RIVERS STATE
Figure 1: Problem Tree
LOW INCOME
LOW PRODUCTIVITY
POOR QUALITY
EXPENSIVE INPUT (FEED , FINGERLINGS AND JUVENILES)
INADEQUATE EXTENSION SERVICES
POOR FARM MANAGEMENT
LACK OF TECHNICAL KNOW HOW FARMERS NOT ORGANISED
WEAK CHAIN RELATIONSHIP
LACK OF INFORMATION
UNSTABLE PRICE
LOW VALUE SHARE
HIGH MORTALITY RATE
Causes
Effect
Source: researcher’s design

4
1.1 RESEARCH PROBLEM
Small scale Catfish farmers in Nchia, Eleme L.G.A of Rivers State are faced with a lot of challenges in their business, marketing their produce after harvest is a big challenge for them as they sell for a low price, there is no intensive effort for starting and maintaining a deliberate marketing style, and with the perception of poor performance of producer organisation. Most catfish farmers in Nchia are not organised in groups and are not also interested in joining cooperatives. This has caused them to be dormant as they lack proper coherent marketing. This situation has resulted in reduced gross margin for farmers thereby limiting their interest in the catfish enterprise. It has caused many of the catfish farmers to fall out of business thereby affecting the fish production in River state. Hence, the study seeks to contribute to the knowledge gaps in catfish marketing within Nchia, in Eleme LGA.
1.1.1 PRIMARY PROBLEM OWNER
Port Harcourt Fish Farmers’ Forum is the primary problem owner
The primary problem owner is an informal producer organisation named “The Port Harcourt Fish Farmers’ Forum” very popular in the study area, operates within but is not limited to Eleme L.G.A, with a total of 76 members. PH fish farmer’s forum as fondly called was established in 2017.They foster interaction among catfish farmers in Rivers state by assisting farmers with farming processes from input supply to marketing, presently very involved in input marketing with the supply of high quality fish feed to producers. The group was formed as a result of farmer’s initiative to bring solutions to their problems. The group have identified marketing as a challenge for catfish farmers, leading to poor profitability on their produce which has led to some of them falling out of the catfish business. This has led to the purpose of this research to assess the catfish value chain in the area to discover the bottlenecks that have led farmers in the area to encounter low returns and suggest interventions that will address the marketing challenges faced by farmers in the area.
1.1.2 SECONDARY PROBLEM OWNER/COMMISSIONER:
Federal ministry of Agriculture and Rural development, Nchia, (FMARD) being a government parastatal is responsible for the Agricultural sector in the country is the secondary problem owner.
The secondary problem owner (FMARD) has the responsibility of developing rural and urban communities through (ADPs) agricultural development programmes; these programmes run in all 36 states in Nigeria and are distributed across local governments. Rivers state is one of the leading agricultural producing states; Eleme LGA is under rivers state. FMARD can be involved in facilitating interventions for marketing problems in fish farming using the recommendation from this study.
1.1.3 MY ROLE AS A RESEARCHER
The researcher is an agricultural extension agent working directly with the problem owners and producers in the study area and also a value chain facilitator, with the experience working with farmers. My aim is to identify challenges hindering the value chain performance and suggest recommendations for better value chain performance

5
1.2 RESEARCH AIM
This research aims to explore the current catfish value chain in Nchia, Eleme LGA, for a better chain coordination and development to solve marketing problems in catfish farming and improve income and livelihood for small scale catfish farmers.
1.4 RESEARCH OBJECTIVE
The purpose of the study is to assess a producer organisation’s performance in Nchia, Eleme LGA, in order to suggest recommendations to the problem owners (Port Harcourt fish farmers’ forum) and the commissioner (FMARD) on strategies to adopt in addressing the problems of inefficient marketing of catfish for small scale catfish farmers.
1.5 RESEARCH JUSTIFICATION
This research is necessary to solve the numerous marketing challenges of small scale catfish farmers in Nchia Eleme LGA, Rivers State. While the government is interested in aquaculture and fish production alongside supporting cooperative activities with programs to ensure high productivity, catfish farmers in this region have a bad perception about cooperatives which has hampered proper coordination and so many opportunities in marketing catfish, however this research seeks to improve coordination along the catfish value chain and provide more catfish marketing opportunities for catfish farmers for better income.
1.6 RESEARCH QUESTIONS
What is hindering the performance of the catfish value chain from effective marketing in
Nchia, Eleme LGA?
1 Who are the stakeholders in the catfish value chain and what are their roles in catfish marketing?
• What are the socioeconomic factors affecting farmer cooperatives in catfish marketing in the study area?
• What are the market factors affecting catfish marketing in the study area?
• What are the institutional factors affecting catfish marketing in the study area?
2 What are the marketing strategies for producer organisations to market catfish efficiently?
• What are the strategies for producer organisations to increase access to profitable catfish market?
• What are the ways to improve access to market information for small holder catfish farmers through producer organisations?

6
CHAPTER TWO
2.0 LITERATURE REVIEW
2.1 THE CATFISH INDUSTRY IN NIGERIA
The geometric rise in Nigeria’s population which is estimated to be about 190 million, urbanization and emerging middle-class incomers has resulted in increasing awareness for aquaculture and it has equally increased the demand for Clarias gariepinus and Heterobranchus spp (popularly referred to as Catfish) (Odunze et al., 2019). The demand for such dietary protein like catfish is rising speedily in relation to the growing population and increases in human consumption but also increasing consumer preference due to increasing purchasing power.
Catfish is the most farmed aquatic specie, and it accounts for over 90% of fish cultivated in Nigeria (Anoop et al., 2009). This is associated with its fast growth rate compared to other fish species for example tilapia, efficient feed conversion and it can be incorporated into local aquaculture system to diversify production and income (Olajide and Omonona, 2019). Furthermore, catfish is taking the lead among other farmed fish species because of its taste and high demand in Nigeria. It has low caloric value, low in fat, higher protein retention and absorption as compared to other sources of protein, low fat content and a safe source of animal protein that reduces protein deficiency illnesses (Adebayo, Falayi and Balogun, 2013).
Fish is sold in Nigeria market in various forms, some are sold fresh, others are processed for example iced up, put in cans, smoked, or dried (Adebo and Toluwase, 2014). Fish farming continues to be the fastest-growing animal food-producing sector and it is part of aquaculture which includes the farming of fishes in ponds, tanks, or other hollows. Most times fish farming is done by raising the fish in ponds and tanks. (Anetekhai,2013).
2.2 THE CATFISH INDUSTRY IN RIVER STATE
Rivers State is surrounded by numerous rivers, swamps, abundant rainfall, effective harvesting, and storage surface water that favours catfish production (Egwui, 2001). Catfish farming is the single-most practiced aquaculture in Rivers State. Ninety percent (90%) of fish farming or aquaculture in the State and the Niger Delta is focused on catfish farming and while 4% are into tilapia farming (Alagoa et al., 2011).
Fresh fish request in the region is high as it is the main ingredient in making local delicacies. Considering the great request, most of the fish farmed in the area is purchased within the state and sometimes more is purchased from other states. Fresh and living catfish command a retail price twice that of frozen fish (Webber and Labaste, 2010). Hence, traders and retailer prefer to procure the fish fresh from farmers.
Farmers in the region bear most of the challenges associated with the value chain, producers are faced with poor quality fingerlings/fish seed, expensive feeds which account for seventy percent of production cost, use of traditional techniques, no access to credit, no veterinary doctors and poor infrastructural facilities (Olajide Oyebisi and Omonona, 2019). Various initiatives instituted by the Federal Government under the provisions of the Federal Ministry of Agriculture and Rural Development (FMARD), state government and NGOs over the years seem not to upscale local production. There are

7
provisions to assist farmers’ access loan by the federal government through the Central Bank of Nigeria with interest of twenty percent and a drawback of forty percent after payment (Anetekhai, 2013). Other programmes initiated by the Government and NGOs include Growth Enhancement Support (GES) which provide subsidy for farmers at 50% cost price with the Federal and State Government (River state) providing 25% each for catfish farmers and the Presidential Initiative on fisheries and aquaculture development in 2003 provided technical and financial support (extension services) to government programmes and projects facilitating local fish production (Ugwumba and Chukwuji, 2010).
2.3 CATFISH PRODUCTION SYSTEMS
Fish farming which is sometimes refers to as fish culture is the process of raising fish for personal use or profit, and it is the fastest growing area of animal food production(Nzevu et al., 2018; Onuche et al., 2020). One popular brand of fish farming is the aquaculture catfish farming which serves as a good source of protein, healthy and delicious source of seafood in the across the world (Kumar et al., 2020). According to Tasnoova et al, 2017, they discuss that farming catfish is an easy and flexible agri-business that can be profitable, and also be for personal nutritional needs of the family which comes in different species. The type of catfish that is commonly farmed depends on the market available, the feeding plan and what size of pond is available. Notably, most catfish species are farmed in fresh water can grow easily and be harvested easily as compared to other fishes (Nzevu et al., 2018). For this study I will focus on catfish farming in concrete ponds or tanks. Small scale catfish farmers in this study refer to catfish farmers that use concrete ponds or plastic tanks for production stocking not more than 500 fingerlings per tank or pond with not more than 10ponds or tanks.
According to Alagoa et al. (2011), Catfish production is done using different methods and systems for example some are grown in earthen ponds, concrete ponds and some others in flow through systems and the system of catfish production or farming can be categorized into three: the small scale, medium scale and the large scale production. The flow through system is mostly used by the largescale producers.
The model of value chain in the catfish industry in Nigeria is undeveloped, which positions catfish producers to become reactive to fixed prices. Market size catfishes (200g -1kg/fish) are generally at the farm gate by producers to other actors in the chain including institutional consumers (restaurants who serve 70% of the catfish sold. (Source: Webber and Labaste, (2010))
2.3.1 HATCHERY (PRODUCTION OF CATFISH FINGERLINGS)
A catfish hatchery is a compound construction which is made up of overhead tanks, water is made to flows through tanks where eggs are incubated, hatched, and the hatchlings nursed and grown to fingerlings. 99% of the hatcheries are flow-through and the remaining 1% recirculation systems (Anetekhai, 2013). There are different types of hatcheries, the include indoor hatcheries, outdoor hatcheries, simple hatcheries, and complex hatcheries (Alagoa et al., 2011).
2.3.2 OUT-GROW PONDS (PRODUCTION OF TABLE CATFISH)
The outgrows comprise raising the fingerlings or juveniles to maturity which take place in different
settings and systems such as earthen ponds, concrete ponds, tanks, cages, the intensive recirculation
systems and large containers that can contain the volume of water adequate to keep the catfish alive

8
(Anetekhai, 2013). Actors in the catfish value chain integrate both systems of catfish production that is
hatcheries and ponds (out-grow ponds).
2.4 POST-PRODUCTION OPERATIONS
The Post-production operation activities relevant to the catfish industry include harvesting, processing, marketing, and distribution systems.
2.4.1 HARVESTING
Catfish reaches marketable size usually between three to nine months. This depends on the stocking density of the grow-out pond and the feeding system. Harvesting is manual using drag nets and intensive labour. During harvest, the fishes are sorted and stored in plastic containers or concrete tanks for sales. (Adelakun et al 2015) catfish farmers practice partial harvest as regards to the demand of some costumers at farm gate and also sell off at full maturity stage. (Ibemere and Ezeano2014)
2.4.2 PROCESSING
Anetekhai, (2013) reported that 60-70% of the harvested catfish is sold live to wholesalers at the farm gate, sent to the market to be procured by restaurants, local eateries, and individuals. Other are processed through smoking and drying using smoking kilns, wood, or charcoal.
2.4.3 VALUE ADDITION TO CATFISH
Value is added to catfish through the following initiatives such as smoking and drying. The absence of adequate fish management, processing methods and storage amenities pointedly adds up to the low amount of fish to poor rural residents in developing nations (Ayuba and Omeji, 2006). Catfish is also a raw material for finished products such as catfish oil, catfish fillet, catfish caviar and catfish internal organs for catfish, poultry and livestock meal, amongst others (Anetekhai, 2013). Catfish oil serves as raw material for the manufacture of body creams, cooking oil and other soaps.
2.5 MARKETING AND DISTRIBUTION CHANNELS
Fish marketing may be generally explained as all the tasks involved from the time of harvesting up to consumption, just like other products get nearer and nearly to the final consumer while marketing channels are identifiable routes through which products go through before getting to the last consumers (Sathiadhas, 2015). Pauly et al. (2002) further described marketing channels as marketing institutions through which goods and services are moved along the value chain and are marketing channels are divided into two categories namely: centralized and decentralized channels.
Nwabunike (2015) noted that centralized channels involve the inclusion of middlemen who acts as agents between catfish producers and consumers of catfish while for decentralized channels, the consumers and middlemen purchase fish at farm gate. Under the decentralized system, marketing channels do not make use of traditional large markets facilities or institutions rather wholesalers (traders) and processors procure directly from the catfish producers. According to Anetekhai (2013), the marketing system of fish in Nigeria can be categorized into two. There is the contemporary chain supply method primarily for imported frozen fish and the local fish collection and supply. In the local fish collection system for the fresh catfish, the wholesalers buy from the farm gate and sell to the retailers or other wholesalers, some consumers also purchase from farm gate and the major markets are located in

9
urban. The fresh catfish are usually packed in big plastic containers (30-40kg/basin), covered with sacs and sent to sales points.

10
2.6 PRODUCER ASSOCIATIONS IN THE CATFISH INDUSTRY
Producer organisation can be explained as a urban business, maintained, and organized by producers, and engaged in combined marketing actions. Thus, in another view, POs are groups that are owned by the members controlled by the members and gives benefits to members (Bijman et al,2012).
Presently, the catfish industry has farmer’s organizations cut across various states including Rivers state. Some of these organizations are Catfish Association of Nigeria (CAFAN), Catfish Export Development of Nigeria (AFIN) amongst others. Producer organizations could bring support to the difficulties the farmers are challenged with in production, marketing and all processes involved in getting the product to the finial consumer. The farmers also get support to help improve production and they can share information and knowledge among other producers. These organizations make it easy for their voices to be heard and enables them access benefits from the government and other organizations (Alagoa et al., 2011); However despite these agreed benefits, study conducted by Odebiyi et al. (2013) stated that some farmers are not members of cooperative and are unable to access the benefits associated with the formation of cooperative (Anetekhai 2013).
However, Producer organizations (POs) may not be the solution to all the challenges small-scale producers’ encounter but may be able to reduce the gap and producer Organisations can make it easier and cheaper for the state and other actors to deliver services to small-scale farmers (Chris, 2007).
According to KIIT et al.,(2006), the government supports cooperative movement and collective marketing or example the existence of Producer organisation increased the bargaining power of producers and there by solving marketing challenges of farmers, this was done by vertically integrating with other actors which recorded success in marketing (Teresa et al ,(2018)
2.6.1 FARMERS’ COOPERATIVE
The International Cooperative Alliance, (2007) describes a cooperative as an independent group of persons united to willingly meet their common economic, shared, and cultural desires and goals through an enterprise which is jointly owned and democratically controlled. While a Farmer is someone who work, owns, or operates an agricultural enterprise or farm either commercially or to sustain his or her family (Kling et al., 2019). Hence, businesses owned and controlled by farmers, breeders or growers are refers to as farmers’ cooperative. It serves as an intermediary between the farmers and the public (Grashuis, 2018). Famers’ cooperative engages in both production and marketing of agricultural produces. They are legal business entity that work purposely to benefit it members by providing a wide range of services and marketing agricultural products (Bijman et al.,2012).Therefore, farmers’ cooperative/organisations of this study refer to groups which are owned and controlled by catfish farmers in order to achieve their common goal.
2.6.2 INFORMAL GROUPS
Formal and informal institutions are likewise essential, and often strengthen their performances effectively. Institutional analysis repeatedly emphases a lot on formal rules such as policies and laws. This is important to outline the incentives for actors to obey the rules in particular ways, although informal groups are perceived to be unruly, they also have their roles in building systems. (Woodhill J.2008)

11
Informal groups are also significant because they promote innovations among producers and inclusiveness and develop trading connections within its members (Andrex et al 2016) informal group are inclusive and has a way of bringing all classes of people together for development and achievements in communities for instance for trainings, and education to improve livelihood (Deekor 2019).
2.7 CHALLENGES AND OPPORTUNITY FACED BY FARMER GROUPS
There are a lot of challenges faced by catfish farmers. According to Eze et al. (2010), some problems encountered by marketers in some parts of Nigeria are Processing, preservation, packaging, distribution, and transportation. These problems can be linked directly with the marketing of catfish. The motivation among farmers for the creation of farmer groups might be additionally withdrawn; many farmers believe the cooperatives are managed with the old pattern of socialism with slow economic growth, less opportunities for members as a result of democratic ideologies (Anh et al.,2012).
Catfish Farmers also face challenges associated with the value chain. On the production side, farmers faced with poor quality fingerlings/fish seed, high cost of feeding and feeds which account for 70% of production cost, use of traditional techniques, lack of credit, lack of veterinary doctors, poor infrastructural facilities(Olajide Oyebisi and Omonona, 2019)
Creating farmer groups or cooperatives is a decent approach to increase farmer’s access to markets and give them better opportunities to increase negotiating power in marketing situations (scholl et al., 2016). Farmer groups also complain of issues like farmers refusal to refund group loans as agreed, creating a continuous condition for debt forgiveness some of the farmers see loans as grants since the loans are given without collateral and this on the long run collapse the groups as the farmers become a burden (Uneze, 2013).
Various initiatives instituted by the Federal Government under auspices of the Federal Ministry of Agriculture and Rural Development (FMARD), state government and NGOs over the years seem not upscale local production. There were guidelines in place to allow catfish growers to get loans with a 20% interest rate and a drawback of 40 % of the interest after payment. The loan is guaranteed by the federal government through the Central Bank of Nigeria (Anetekhai, 2013). Other programmes initiated by previous Governments and NGOs include Growth Enhancement Support (GES) which offer support for farmers at 50% cost price with the Federal and State Government (River state) giving 25% each for catfish farmers and the Top-level Resourcefulness on fisheries and aquaculture development in 2003 provided economic and practical assistance (extension services) to government programmes and project facilitating local fish production (Ugwumba and Chukwuji, 2010). Despite these initiatives and efforts of Governments and NGOs catfish fish production has remained low in the country as well as in River state.
2.8 FACTOR INFLUENCING POOR PERFORMANCE OF CATFISH MARKETING
A few researches have been made to investigate the causes of poor marketing and low production encountered in River state of Nigeria. Ugwumba and Nnabuife (2008) linked the low level of catfish production to poor quality using poor fish seeds use, lack of information among actors, expensive feed, old and local methods of production and poor infrastructural amenities. Most challenges encountered and problems faced by the farmers influence the marketing system and could bring about a misrepresentation in the organization, behaviour, and performance of the marketing processes. Agricultural marketing is inefficient resulting in high post-harvest losses, shortage, and exorbitant prices

12
for food (Girei et al., 2013). Catfish marketers indicate lack of storage facilities, equipment and the skills needed for processing is poor resulting in poor managing (Agbebi and fagbote, 2012).
2.8.1 SOCIO ECONOMIC FACTORS AFFECTING CATFISH MARKETING
Socioeconomic factors are socio and economic factors checked on scale which I capable of defining the
status and performance of an individual
Studies showed that socioeconomic factors of farmers can influence production and even marketing.
Ibemere (2014) and Baffoe-Asare et al. (2013) highlighted that factors such as age, sex, experience, and
income were found to affect fish marketing among the actors in the chain.
According to Muhamed (2011), Socio economic factors can influence production output as well as quantity sold, for example how the farmer gets information, extension services, the size of his/her family and even the sex of the farmer. These variables can determine the type of farming and the behaviour and outcome of production. These reasons explain more of what is expected of the farmer and his farm management practices and his output after production. The quality of the product, information and relationship for marketing are very essential for the business. (Ardjouman and Asma, 2015).
2.8.2 MARKET FACTORS AFFECTING CATFISH
Market factors such as distance to market, price of output, price information and marketing experience are key factors that influence efficient marketing. The marketing system for fresh farmed catfish is mainly done by traders and they are challenged with issues as such high price of fish, expensive transportation, and marketing damage due to transactions made of weak and lifeless fish, fish leftover which results in little market prices (Ohen, 2017). According Ayeloja, et al., (2017) also highlighted that fish marketing challenges are numerous considering it as highly perishable, the possibilities in fish production, a lot of species, no stable price, transportation difficulties, poor electricity, poor storage and poor market structure among others.
Fish marketing system is highly involuntary and understanding exists among wholesalers, retailers and their customers neglecting the producers (Adeyemo, R. 1986)
(Okaeme.1992).Discusses how fish mongers mishandle fish, stressing on paying close attention should be given to fish hygiene, insects and pests of fish, preservation, handling, transportation, packaging as factors that can affect fish marketing and distribution.
Catfish prices are fixed by traders with little or no flexibility for changes in market conditions. This has resulted in a disorganised market for catfish farmers. Profitable marketing of catfish is a constant challenge to the industry (Nwabunike, 2015). The problem is compounded with the unavailability of adequate infrastructure including roads, transportation systems (roads, vehicles, rails, etc.), lack of credits also constitutes difficulties in the marketing process. Thus, marketing problem to a greater extent deters efficient marketing of catfish and its products. Furthermore, post-harvesting operations which include processing, storage and preservation are underdeveloped due to high capital

13
requirements and technical knowledge required to maintain quality criteria important to consumers (Nwabunike, 2015).
2.8.3 INSTITUTIONAL FACTORS
Institutional factors are factors, patterns, or models of performance, controlled by societal actors. These patterns of behaviour give structure to human and social interaction. Institutional systems can facilitate, hinder, or have neutral effects on the development of a value chain.(lundy et al., 2014). Catfish farming is affected by some of these institutional factors some of which are high cost of fish feed high cost of transportation, inadequate access to credit and poor road networks. (Ohen 2017) also highlighted that among these, poor water supply, inadequate extension service and inadequate training on new technologies can also affect catfish production and marketing (Issa et al., 2014).
In the past most programs in African countries were organised to develop rural communities thereby supporting farming and farmers with input subsidies, market schemes, extension services, research, telecommunication electricity but all have deteriorated the decline in recent times have hindered economic development and access to market for rural farmers, producers coordination and cooperation with possible solutions can find solutions around these challenges (KIT et al.,2006)
2.9 ECONOMIC EFFICIENCY
Explains economic efficiency as a pattern in which cost is used to derive intended target which can be categorized into productive efficiency and allocate efficient; productive efficiency simply means using less cost for input and output to achieve productivity and allocate is the ability as to which there is adequate supply to meet demand with long term price measuring per unit (Lesego 2007)
Figure 2: Market Interest Matrix
Source: KIT and IIRR 2008.

14
The market interest matrix above shows how market situations and how trade relationship can be developed or improved horizontally or vertically, and up scaled either upward or downward for a more stable market structure.
2.9.1 VERTICAL INTEGRATION
Vertical integration is a kind of ownership in which a firm maintains one or more stage of trade or value chain. For example, a farmers associations can vertically upgrade forward or backward into other activities. (Mitchell, et al. 2009).
2.9.2 HORIZONTAL INTEGRATION
Horizontal integration is the collaboration with horizontal partners in the chain e.g. formation of producer’s organisations and cooperatives. Horizontal organisation is the development of bigger intra-nodal organisation, frequently in the production and processing nodes, in some form of combined arrangement (normally a producer group)
2.10 CHAIN GOVERNANCE
There are 5 types of chain governance, the market which involves dealings that are relatively simple, it is controlled by price the others are modular, relational, captive, hierarchy is usually controlled by the lead firms at different level of coordination and power asymmetry as shown below(Dietz 200). Identifying the relationship between buyers, sellers and institutions as well as the system that governs the interaction between the various stakeholders is important in marketing and value chain coordination (Gereffi et al.,2005)
Figure 3: Chain Governance
Source: Gereffi et al., (2005)
2.11 CHAIN ACTORS
The actors in the catfish value chain in Rivers state include the input suppliers, the producers, wholesalers, the processors, retailers, and the consumers. Value is added from each actor in the chain. The value chain further shows the processes involved from catfish production. Catfish when harvested in

15
this study area are sold to the various actors of the chain including institution consumers Restaurants. (C.Martin2010)

16
2.12 DEFINITION OF KEY TERMS
VALUE CHAIN: A value chain is a related sequence of groups, properties and information streams combined in the formation and transport of value to the final consumer (Lundy et al., 2014). Borch, (2011) defined a value Chain is a set of successive value-adding roles done by a set of independent but interdependent actors, working in a market for revenue.
Value chain depletes stages of linked productive and commercial functions from production, processing storage and even marketing and sales in all forms until it gets to the final consumers. At each stage of the chain, value is added to the product to become more attractive to the end consumers. (Schrader et al., 2015).
AQUACULTURE: Aquaculture can be defined as water farming or under water farming; it is also the production of aquatic organisms for human consumption. (Lawson 2013).
For the sake of this study, aquaculture will be narrowed down to fish farming in ponds, concrete tank, and plastic tank particularly catfish farming.
FISH MARKETING: Fish marketing is said to be all those activities from the point of catching fish to the point it gets to the final consumption. As the fish, like any other product moves closer and closer to the ultimate consumer.(Sathirathai, 2015) and (Rahman et al 2019).
VALUE CHAIN CONCEPT: A value chain is a related series of activities, resources and knowledge streams involved in the production and delivery of value to the end consumer. (Lundy et al., 2014)
UPGRADING IN VALUE CHAIN: Upgrading can be explained as attaining the technical, official and market competencies that allow target group (small scale catfish producers) to improve their effectiveness and move into higher value actions. (Mitchell,et al., 2009).

17
2.13 CONCEPTUAL FRAMEWORK
The conceptual framework is a breakdown of the concept of the research. It explains the concept, dimensions, and aspects of the research.
Figure 4: Conceptual FrameworK
Source: Authors Design

18
CHAPTER THREE
3.0 RESEARCH METHODOLOGY
3.1 RESEARCH DESIGN AND METHODOLOGY
The research methodology covers a study area, a research framework, a method of data collection, and data analyses. The research includes both quantitative and qualitative approaches based on primary data collected from the survey interviews and focus group discussions, secondary data was obtained from the study of literature related to the study from online journals, articles and books.
3.2 STUDY AREA
The study area is Eleme LGA in Rivers State, one of Nigeria’s 36 states. Rivers state capital is Port Harcourt; it is situated between latitudes 4°15N and 5°45N and longitudes 5°22E and 7°35E having two seasons rainy and dry season. The State is bounded on the south by the Atlantic Ocean, on the North by Imo and Abia States, the East by Akwa Ibom State, and the West by Bayelsa and Delta States.
Farming and fishing is the main source of livelihood for the people of Rivers State. Rivers state belongs to one of the coastal states in the Niger Delta region of the country with vast potential for fish farming and the need to increase food supply sustainably providing animal protein that is good and important to human health and nutrition in Nigeria. (Ibemere I.F.and Ezeano,C.I 2014.)
Eleme Local Government Area in (figure3) is one of the twenty-three (23) Local Government Areas in Rivers State, with its administrative headquarters at Ogale in ward 3. Eleme LGA is made up of ten major clans (ten political wards) of one hundred and ninety-nine communities (settlements) with a population of about 267000 people (city population 2017). It is bounded by Tai LGA in the East, Obio Akpor LGA in the West, Oyibo LGA in the North and Okirika/Ogu-bolo LGA in the South. The study area covers a land area of 138km2 and a population of 190,194 inhabitants with 52% male and 48% females according to National population Census conducted in 2006.

19
Source:
3.3 RESEARCH STRATEGY
The research involved a qualitative and quantitative approach based on field survey, focus group discussion, interviews, literature from past researches and the researches experiencers’ .Based on the research objective and research questions, this research framework guided the research process.
Figure 5: Map showing Nchia in Eleme L.G.A of Rivers state Nigeria.

20
Figure 6: Research Design
RESEARCH PROBLEM
RESEARCH OBJECTIVE
RESEARCH QUESTIONS
FOCUS GROUP DISCUSSION
SURVEY INTERVIEWS (SMALL
43 SCALE CATFISH FARMERS )
DESK STUDY (ONLINE JOURNALS,
BOOKS, REPORTS AND WEBSITES)
INTERVIEW (KEY INFORMANTS
AND CHAIN ACTORS)
DISCUSSION AND TRIANGULATION
LITERATURES AND FIELD WORK
DATA ANALYSIS SPSS
MARKET MIXMIDCASWOT
CONCLUSION AND RECOMMENDATION
Source: Researchers Design
3.4 DATA COLLECTION METHODS
DESK STUDY: My desk study involved searching for recent literatures that is relevant to my research from reliable sources (online journals, articles, books and websites).the literatures enabled me get a background information about the topic, relevant information about my topic an research question to give a solid background and justification of the research .it gave an idea of what other researchers have done relating to my research topic and the study area. FIELD WORK: My field study was conducted using online platforms mostly on WhatsApp. As a result of the COVID-19 pandemic, the researcher was unable to travel to home country for data collection considering the lock down rules and travel restrictions. However, a research assistant was hired for the purpose of collecting information and connecting the researcher to respondents for interviews. Firstly, survey was distributed to 50 small scales catfish farmers out of 60 catfish farmers registered under the ministry of agriculture in Nchia, Alesa and Aleto in the same region and having the same characteristics. The area is dominated by small scale farmers using plastic tanks and concrete ponds with stocking not more than 1000 fingerlings per pond growing to maturity or table size before harvesting.
The out growers are catfish farmers that grow fingerlings gotten from input suppliers, with the use of feed until it gets to maturity, these catfish farmers relate with almost all the other actors in the chain and are affected with input, production and marketing challenges.
Information from survey will tackle socioeconomic factors, market factors, performance of producer organisation and current characteristics of the value chain; including gross margins, value share distribution among actors, choice of market outlets for catfish farmers, and membership status of the catfish farmers in cooperative

21
Secondly, qualitative interviews was used to analyse results gotten from the survey and focus group discussions to explore the marketing problems in the catfish value chain in Nchia and get expert recommendations as it relates to the study area. The interview and focus group discussion methods enabled me to understand the views and experience of the actors of the chain and key informants for more in-depth information about the marketing problems and performance of producer organisations in the study area.
3.5 SAMPLING PROCEDURE
The study employed multistage sampling for selecting catfish farmers in the study area that took part in the survey. One ward was purposively selected from 10 wards in Eleme LGA. The reason for choosing one ward is because all the wards in the L.G.A have similar characteristics and one ward can be used to represents the whole area. Key informants are a source of more detailed information about factors affecting catfish marketing and were selected for interviews. 4 Key informants included an informal group (PFFF) leader, a formal group secretary, a staff from government subsidiary in charge of agriculture and aquaculture in Rivers State and a professor in fisheries department of one of the educational institutions. The interview also involved two producers, one wholesaler, one retailer and one processor; they were purposively selected from the ward because their number is limited. In addition, the 3 key informants were purposively selected on state level for interview to gather rich information to answer the research questions. A total of 9 people were interviewed. Two catfish farmers were purposive selected as members of a producer organisation. Open questions were generated from the checklist. The interviews were used to gather information about product flow, information flow in the chain, marketing challenges associated with the chain. Key informants selected for interviews were individuals who are operating along the catfish value chain in the area.
INTERVIEW WITH PORT HARCOURT FISH FARMERS FORUM MEMBERS The interview with the leader and member of Port Harcourt fish farmers forum was to get information about the involvement of the group in catfish marketing, stakeholders and their roles, the activities and how effective it has been, members interest and participation, the challenges and opportunities of catfish farming in the study area, sources of input supply, marketing challenges, activities as an informal group. Information was useful to assess the group’s performance, the capabilities and functioning ability as a group to become a formal cooperative. INTERVIEW WITH A STAFF OF A GOVERNMENT SUBSIDIARY (ADP) The interview gathered information about the activities of formal cooperatives in the study area, challenges cooperatives face with catfish farmers, government support to catfish farmers, information flow, stakeholder’s involvement, relationship and roles, government activities to support small scale catfish farmers, cooperatives roles, current activities and strategies to market efficiently. INTERVIEW WITH A FORMAL COOPERATIVE’S SECRETARY The interview covered a wide range of information, the existence of CAFAN in rivers state, their role and the role of other stakeholders, production and marketing challenges and opportunities, cooperatives’ involvement in catfish marketing, external support assessed as a cooperatives, the cooperative

22
experience with catfish farmers and strategies for efficient marketing in the study area, catfish farmers participation and access to information. INTERVIEW WITH A PROFESSOR, FISHERY DEPARTMENT (EDUCATIONAL INSTITUTIONS) The interview gathered information about the stakeholders in catfish farming and their roles, role and functions of producer organisations, activities and effectiveness of producer organisations, catfish marketing challenges and opportunities, strategies for cooperatives to link small scale catfish farmers to more efficient market, institutional and market factors affecting catfish. INTERVIEW WITH PRODUCERS The interview gathered information about farmers experience in the business, cost of production, production challenges and opportunities, dealings with marketers, price, value addition, consumer’s perception, institutional and market challenges, source of input supply and sales information, farmer’s perception about cooperatives and possible strategies for efficient marketing. INTERVIEW WITH WHOLESALERS, PROCESSOR AND RETAILER The interview was to get information about current prices, challenges faced by these actors with purchasing, transporting, and marketing, the price margin, and value addition, requirements for catfish their experiences and challenges with the catfish farmers and strategies for efficient marketing.
3.6 FOCUS GROUP DISCUSSION
The focus group discussion involved six value chain actors (2 small scale catfish farmers,1 input supplier/hatcher ,1 wholesaler, 1processor and 1retailer) to get confirmation about information on the problems along the value chain, all the information previously gathered from the interviews and survey Focus group discussion was also conducted involving one representative from 5 functions in the chain. Making it a total of 6.This number was chosen due to social distancing measures that are put in place to curb the spread of corona.
3.7 DATA ANALYSIS
Survey was used on small scale catfish farmers, interviews on chain actors and a focus group discussion was conducted to get an in-depth knowledge the research topic. the survey was created through google docs and sent to catfish farmers in the area through WhatsApp messaging, some were filled on printed forms and sent through WhatsApp, all responses was transferred to excel sheets and further transferred to SPSS and analysed using inferential statistics SPSS version 25, the responses for the qualitative analysis were coded in Microsoft excel sheets and analysed using marketing mix for the market development, chain map to show the various actors and stakeholders involved in the chain, MIDCA tool to access producer organisation’s performance, swot to view the strength, weakness opportunities and threats, and theory of change to suggest interventions.

23
MIDCA ASSESSMENT
MIDCA tool, was used to analyse the performance of Port Harcourt fish farmers forum based on 2
aspects .the first is related to production, market and the internal organisation scored in percentages
and the second aspect covers scoring from 1-5 as shown in annex 1A, 1B and 1C in areas of membership
base, products, services, long term perspective, relationship with stakeholders based on information
from interviews 1 = Strongly Disagree. 2 = Disagree. 3 =agrees, 4 = Agree strongly 5 = Agree very strongly
The result interpretation shown in annex 1D. in percentages
➢ 53% and 60% means a score slightly above average; the score was given because the statement
was agreed with by all interviewees but had some uncertainties
➢ 61% means a high score agreed by all interviewees with very little doubts
➢ 73% means a high score, strongly commended by interviewees but still had few areas with the
hope for improvement
➢ 23% and 28% means a very low score disagreed by majority with some uncertainties
➢ 80% means a very high score strongly agreed by all but accommodated some level of doubt
➢ 44% means a low score slightly below average with agreed by some and disagreed by majority

24
Table 1: Research analysis table
Source: Researcher’s compilation

25
3.8 RESEARCH LIMITATIONS
The were some limitations encountered during the period of the research ➢ The researcher depended completely on the research assistant for data collection which
sometimes was not timely and could not get all information needed ➢ The online means had a lot of poor network challenges; the lines were interrupted on several
occasions during interviews, recordings were no so good because of the poor network ➢ It was difficult to get to key informants and schedule online meetings because of their busy
schedule. ➢ It was possible to organise a focus group discussion obeying the social distancing and other
rules set as a result of the pandemic ➢ Observation was impossible to do since the research was conducted online ➢ Due to the short time given for the research, only a few areas were considered.
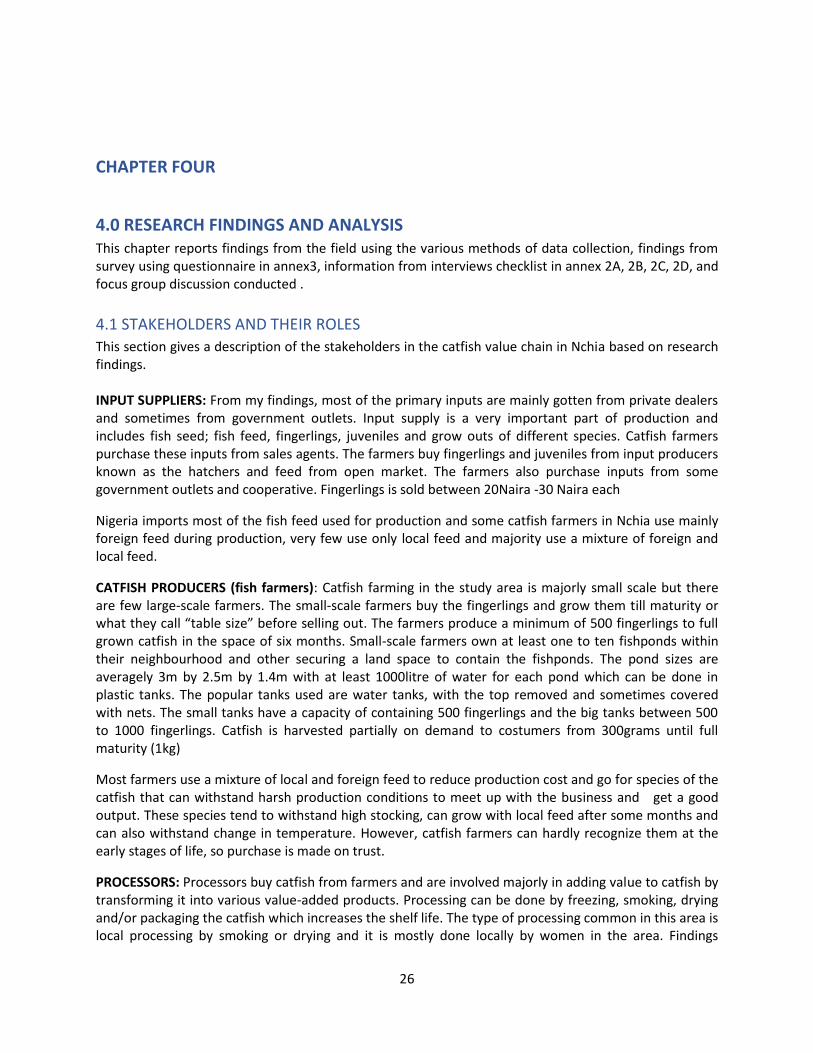
26
CHAPTER FOUR
4.0 RESEARCH FINDINGS AND ANALYSIS This chapter reports findings from the field using the various methods of data collection, findings from survey using questionnaire in annex3, information from interviews checklist in annex 2A, 2B, 2C, 2D, and focus group discussion conducted .
4.1 STAKEHOLDERS AND THEIR ROLES
This section gives a description of the stakeholders in the catfish value chain in Nchia based on research findings. INPUT SUPPLIERS: From my findings, most of the primary inputs are mainly gotten from private dealers and sometimes from government outlets. Input supply is a very important part of production and includes fish seed; fish feed, fingerlings, juveniles and grow outs of different species. Catfish farmers purchase these inputs from sales agents. The farmers buy fingerlings and juveniles from input producers known as the hatchers and feed from open market. The farmers also purchase inputs from some government outlets and cooperative. Fingerlings is sold between 20Naira -30 Naira each
Nigeria imports most of the fish feed used for production and some catfish farmers in Nchia use mainly foreign feed during production, very few use only local feed and majority use a mixture of foreign and local feed.
CATFISH PRODUCERS (fish farmers): Catfish farming in the study area is majorly small scale but there are few large-scale farmers. The small-scale farmers buy the fingerlings and grow them till maturity or what they call “table size” before selling out. The farmers produce a minimum of 500 fingerlings to full grown catfish in the space of six months. Small-scale farmers own at least one to ten fishponds within their neighbourhood and other securing a land space to contain the fishponds. The pond sizes are averagely 3m by 2.5m by 1.4m with at least 1000litre of water for each pond which can be done in plastic tanks. The popular tanks used are water tanks, with the top removed and sometimes covered with nets. The small tanks have a capacity of containing 500 fingerlings and the big tanks between 500 to 1000 fingerlings. Catfish is harvested partially on demand to costumers from 300grams until full maturity (1kg)
Most farmers use a mixture of local and foreign feed to reduce production cost and go for species of the catfish that can withstand harsh production conditions to meet up with the business and get a good output. These species tend to withstand high stocking, can grow with local feed after some months and can also withstand change in temperature. However, catfish farmers can hardly recognize them at the early stages of life, so purchase is made on trust.
PROCESSORS: Processors buy catfish from farmers and are involved majorly in adding value to catfish by transforming it into various value-added products. Processing can be done by freezing, smoking, drying and/or packaging the catfish which increases the shelf life. The type of processing common in this area is local processing by smoking or drying and it is mostly done locally by women in the area. Findings

27
revealed that some processors buy the fish at 3-4 months and dry or smoke and then sell out to wholesalers, retailers, and consumers.
WHOLESALERS: Wholesalers buy 40% fresh and processed catfish, 20% is fresh and 20% processes and distribute to other marketers. It is capital intensive; therefore, few marketers are into wholesales marketing. Also, catfish farming require serious and careful post-harvest management, to ensure that the fish does not lose its quality (freshness, colour and taste) therefore, marketers may not be able to procure good storage to manage left overs. Findings also revealed that the wholesalers purchase catfish at any stage of production including catfish weighing from 300g up to1kg.
RETAILERS: Retailers buy catfish from farm gate, processors, and wholesalers. Retailers sell in market stalls and shops although 20% are sold in supermarkets. Retailing requires a reasonable amount of money to start catfish retailing business. Retailers in the area sell smoked, frozen and fillet catfish types. They have their stall and shops located in strategic business locations that are densely populated and mostly within the market environs. Roadside marketers known as hawkers also exist as retailers, they can start with selling as low as 2 pieces of catfish are usually found along the roadside. In some cases, the hawkers market their products at offices such as schools, churches, banks, and government institutions. They market mostly smoked and dry catfish because they are already packaged in plastic bags and sealed. Also, most unemployed youths are involved in the roadside catfish marketing.
CONSUMERS: Farmed fish is consumed at home and sold in shops, supermarket, hotels, hospitals, and government institutions, among others. Most of the bigger (heavier) fish are sold to large hotels and restaurants in Port Harcourt the Rivers state capital.
4.2 VALUE CHAIN SUPPORTERS AND ROLES This section gives a description of catfish chain supporters and their roles in Nchia Local Government.

28
Table 2: Chain supporters and their roles
Source: Field Data
4.3 CHAIN CORDINATION
The chain coordination shows the current performance based on the activities in the chain which
includes, relationship with the actors, marketing channels and the chain governance,
4.3.1 GOVERNANCE STRUCTURE IN THE CHAIN
Figure 7: A Graph Showing the Type of Transaction between Producers and Traders
VALUE CHAIN SUPPORTERS ROLES
➢ (ADP) agricultural development program Rivers State
➢ A government subsidiary and channel for promoting agriculture and aquaculture in River State
➢ Oversee agriculture and aquaculture activities in the state ➢ Channels for accessing input supply and government aid for
agricultural purposes
➢ Port Harcourt fish farmers forum (PFFF)
➢ Farmers association in Nchia bringing catfish farmers together to solve most of their challenges. actively assisting farmers with input supply, and extension services.
➢ Supply of catfish fish feed
➢ Financial institutions ➢ giving loans to farmers and traders
➢ Catfish farmers associations of Nigeria
➢ Supports and aids catfish farmers to build capacity and represent farmers giving them a voice while suggesting policies in their favour
➢
➢ Federal ministry of agriculture and rural development
➢ Work with other bodies to make policies and assist aquaculture the relevant assistance to increase production
➢ Providing the enabling environment for aquaculture. ➢ Promoting agriculture in Rural communities
➢ Educational institutions ➢ Trains and conducts researches on better practices and make suggestions for new policies to be implemented

29
Source: survey result
Findings from survey show that 92.9% of catfish farmers d not have any form of agreement or contract
with buyers, 7.1% of catfish farmers have agreements and contracts with buyers
Findings from interviews and survey reveal that market governance exist in the catfish chain in Nchia, because the actors are driven by the price of the catfish, some customers build relationship overtime with the producers( relational governance ) but even in such cases ,it is still driven by the price offered and no contract exists between the producers and buyers.
4.3.2 CHAIN RELATIONSHIP
Figure 8: A graph showing the Relationship between Catfish Farmers and Buyers
Source: Survey results
The graph above shows that 81.3% of catfish farmers sell to customers based on the weight of the
catfish, 28.6% sell based on estimated weight, 35,7% fix sell based on the quantity to be bought and
12% have relationship with buyers.
Findings from interviews also revealed that the relationship among the actors of the chain is poor, the actors meet mainly at point of transaction, interviews with key informants reveal that there is no coordination among the actors, supporters and enablers; everyone acts individually.

30
4.3.3 PRODUCT FLOW
Figure 9: A Graph showing the Purchase of Catfish from Farm Gate
Source: survey results
Result from survey shows that 83.3% of catfish farmers sell to consumers at farm gate, 71.4 sell to
retailers at farm gate,52.4% sell to wholesalers and 33.3% sell to hotels and restaurants.
The product (Catfish) flows from input suppliers to the producers, the producers grow and sell to all the other actors; from 3 months(partial harvest to full maturity) producers, sell catfish at farm gate to the various actors of the chain until it gets to the final consumers. The flow of the products also goes from the catfish farmers, to all the actors as shown in figure 9.
4.3.4 INFORMATION FLOW
Information flow in the chain is inadequate as some producers get information from buyers, relatives , co farmers and from cooperatives as shown in figure 18.
4.3.5 CASH FLOW
Cash flows downwards from the consumers towards the actors to the producers and then the input suppliers.as gathered from survey and interviews.
4.4 VALUESHARE
This explains how value is added and distributed among the value chain actors. Due to unstable prices, the average selling price of each actor was used to calculate the value share on each level in the chain. Informant 6 stated that the distance of some farms from the major road is quite far and it affects her sales, buyers go for the farms closer to where they can easily access transportation. As a result, her price has to be attractive (lower) to enable her sell off her produce to avoid more production cost. The farm locations affect the marketability, thereby making the farmers that fall within this category device other means to sell to other actors more profitably.
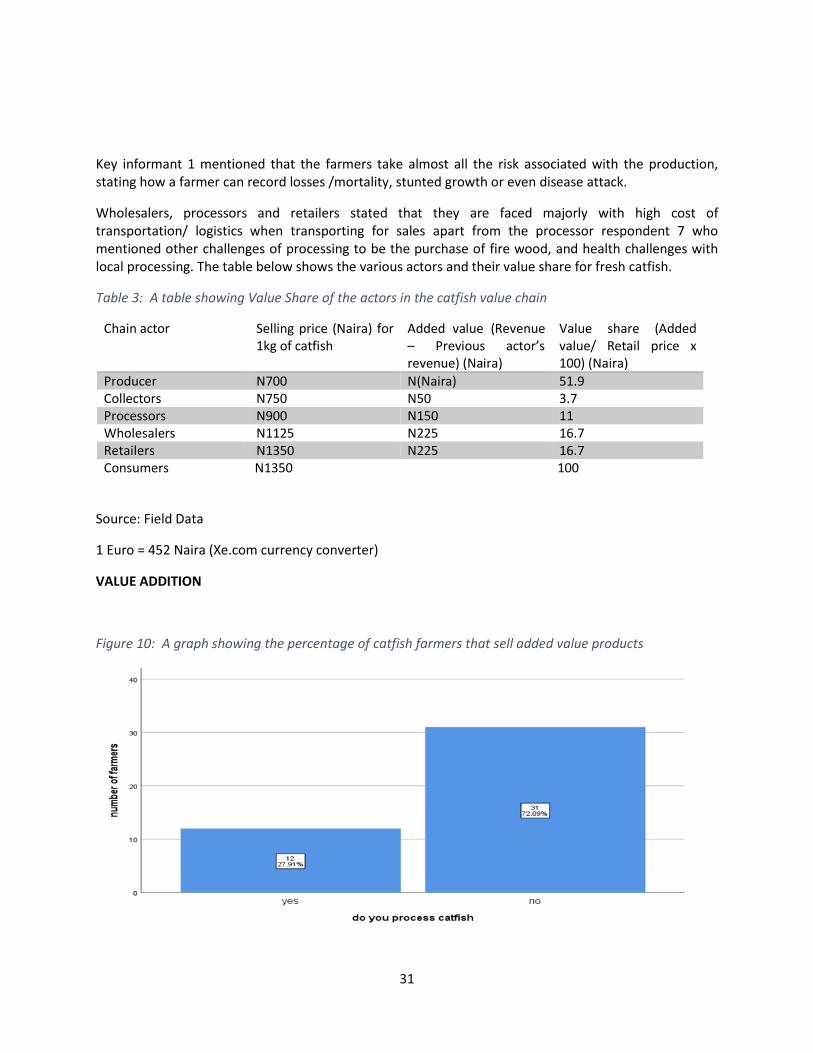
31
Key informant 1 mentioned that the farmers take almost all the risk associated with the production, stating how a farmer can record losses /mortality, stunted growth or even disease attack.
Wholesalers, processors and retailers stated that they are faced majorly with high cost of transportation/ logistics when transporting for sales apart from the processor respondent 7 who mentioned other challenges of processing to be the purchase of fire wood, and health challenges with local processing. The table below shows the various actors and their value share for fresh catfish.
Table 3: A table showing Value Share of the actors in the catfish value chain
Source: Field Data
1 Euro = 452 Naira (Xe.com currency converter)
VALUE ADDITION
Figure 10: A graph showing the percentage of catfish farmers that sell added value products
Chain actor Selling price (Naira) for 1kg of catfish
Added value (Revenue – Previous actor’s revenue) (Naira)
Value share (Added value/ Retail price x 100) (Naira)
Producer N700 N(Naira) 51.9 Collectors N750 N50 3.7 Processors N900 N150 11 Wholesalers N1125 N225 16.7 Retailers N1350 N225 16.7 Consumers N1350 100

32
Source: Survey Results
Survey shows that only 12.91% of catfish farmers also sell catfish with added value by processing while
72.09% do not add value, they only sell fresh catfish after production
Key respondents highlighted that most catfish farmers do not add value or process their produce; catfish
farmers mainly grow to point of maturity and sell out to interested customers.
4.5 CHALLENGES IN THE CHAIN
The challenges faced by the actors of the chain as regards the activities in the chain which has influence
on the value share are shown in fig 21
4.5.1 PRODUCTION CHALLENGES
Findings in fig 19 reveal that Catfish farmers encounter some challenges in the cause of production, challenges such as high cost of feed, purchase of diesel and fuel to power generators for water supply due to lack of electricity, some farmers employ skilled labour, pay for consultation/extension services and other cost which adds up to the cost of production in addition to their fixed cost. As indicated in. They have a value share of 51% as seen in table 3 which seems high but due to these challenges is low compared to the other actors.
4.5.2 PROCESSING CHALLENGES
The processors are faced with the challenge of using poor or local processing equipment; this in turn is hazardous to their health as stated by a processor.
“The smoke makes me sick and I spend money treating myself after processing” (Respondent 7)
Findings from interview with a processor also discovered that processing also incurs additional cost to purchase the necessary materials Processing using poor equipment consumes so much time and energy, can only process a limited quantity per time but can also produce poor quality processed fish. The value share of processors is 11% as indicated in the table above.
4.6 SOCIOECONOMIC FACTORS
Socioeconomic factors will reflect factors such as gender, age, income, experience, and occupation of small-scale catfish farmers that can affect production. The survey results are shown below and questionnaire used to collect the data used to is shown in the annex 3
4.6.1 GENDER
Results from the survey showed that 81.40% of catfish farmers in the area are mal e while 18.6 are
female; this shows that there are more male catfish farmers in the area and there is no gender balance
in catfish production as shown below.

33
Table 4: A Table showing the percentage and number of male and female catfish farmers
Frequency Percent Valid Percent Cumulative Percent
Valid Male 35 81.4 81.4 81.4
Female 8 18.6 18.6 100.0
Total 43 100.0 100.0
Source: Survey Results Key informants mentioned during interviews using the checklist in annex 2A that most women engaging in catfish business are mainly in marketing and processing activities. Catfish farming is capital intensive with high production costs which the respondent gave as some of the reasons why women do not engage in catfish production. According to key informants interview and focus group discussion. “Catfish farming needs land, drums or ponds to begin and most women do not have the space and capital to farm catfish”
(Respondent 3) Figure 11: A graph showing Gender presentation of catfish farmers in percentages
Source: Survey Results
4.6.2 AGE
Responses gotten from survey in annex 3 shows that 48.8% of catfish farmers are between age 41-50years, 16.2% with age 30-40 years 25.5% aged from 50 years and above and 9.3% below 30years as shown in the table below. This means that majority of catfish farmers are in a young group as shown in

34
the table below. All Interviewees established the fact that young people are very interested in catfish farming and engage in it despite cost. Given that catfish farming is lucrative many young people venture into it with the expectation of making good profit.
Table 5: A table showing the age range of catfish farmers in percentages
Frequency Percent Valid Percent Cumulative Percent
Valid 30-40 years 7 16.3 16.3 16.3
41-50 years 21 48.8 48.8 65.1
50 years and above 11 25.6 25.6 90.7
Below 30 years 4 9.3 9.3 100.0
Total 43 100.0 100.0
Source: Survey Results Figure 12: A Graph showing the age bracket of catfish farmers in percentages
Source: Survey Result
4.6.3 LEVEL OF EDUCATION OF CATFISH FARMERS
Findings derived from survey questions in annex 3shows that catfish farmers in the area are educated with 34.8% of the respondents attaining secondary education and 60% of the respondents with tertiary education, 4% has primary education as shown in the table below; this means that catfish farmers in the area are mostly educated with at least the basic form of education.

35
Table 6: A table showing the Level of Education of catfish farmers in percentages
Frequency Percent Valid Percent Cumulative Percent
Valid Primary 2 4.7 4.7 4.7
Secondary 15 34.9 34.9 39.5
Tertiary 26 60.5 60.5 100.0
Total 43 100.0 100.0
Source: Survey Results Figure 13: A Graph showing the level of education of catfish farmers in percentages
Source: Survey Results
4.6.4 YEARS OF EXPERIENCE OF CATFISH FARMERS
Findings from Survey in annex 3 shows that 41.8% of catfish farmers have had experience in the business for a period of 1-3years,34.8% have had experience for 4-6 years, 34.8%, 11.63% with 7-10 years of experience, 9.3% of catfish farmers are new in the business with below one year experience, and 2.33% have above 10years of experience. This means that a large number of catfish farmers in the study area are experienced with less than 10 years of experience in the catfish business. Interviewees mentioned that many catfish farmers get discouraged along the line and stop the business because they enter into catfish farming not considering the cost of production. Table 7:A Table showing the level of experience of catfish farmers in percentages
Frequency Percent Valid Percent Cumulative Percent
Valid below 1year 4 9.3 9.3 9.3

36
Source: Survey results Figure 14: A graph showing the years of Experience of Catfish farmers in percentages
Source: Survey Results
4.6.5 PRIMARY OCCUPATION OF CATFISH FARMERS
From the survey responses, 32%of catfish farmers take catfish farming as their Primary occupation, and 11% have a primary source of education and catfish farming as another source. Key informants highlighted that catfish production needs skilled labour and time; information gotten also revealed that some farmers go into it as an alternative source of income while some others invest time into it thereby taking it as their main source of income because of the state of the economy; no one wants to be idle. The categories of farmers that venture into catfish farming as their primary occupation are mostly the unemployed youth and retirees.
1-3years 18 41.9 41.9 51.2
4-6years 15 34.9 34.9 86.0
7-10years 5 11.6 11.6 97.7
Above 10years 1 2.3 2.3 100.0
Total 43 100.0 100.0

37
Figure 15: A graph showing catfish farmers that take catfish farming as Primary Occupation
Source: Survey Results
4.6.6 SOURCE OF INCOME OF CATFISH FARMERS
60.5% of the respondents have other sources of income apart from income from catfish farming and 39.5% as shown below depend on catfish farming as their only source of income; findings from interviews indicated that most catfish farmers are involved in many other activities to bring income, a key informant indicated that the business can be unpredictable sometimes with increase in production and for the fear of uncertainties after production many producers try to get other income sources. “Many of them do catfish farming along with other business; a catfish farmer on a very small scale can have a very big company somewhere” (Respondent 2)
Table 8: A table showing catfish farmers that have other sources of Income in percentages
Frequency Percent Valid Percent Cumulative Percent
Valid Yes 26 60.5 60.5 60.5
No 17 39.5 39.5 100.0
Total 43 100.0 100.0 Source: Survey Results

38
Figure 16: A Graph showing catfish farmers with other sources of income
Source: Survey Results
4.7 MARKET FACTORS
Market factors covers the direct problems affecting the marketing of catfish, factors such as price of output, price information, and consumer requirements. Figure 17: A graph showing channels through which catfish farmers sell catfish
Source: Survey Results
The channels through catfish farmers market is displayed in the graph above. 95.2% of catfish farmers sell catfish at farm gate, 28.7% take it to the market, 16.4 sell through cooperatives and 26.2 supply to customers, this means most farmers sell after harvest at farm gate.

39
Source: Survey Results
4.7.1 COSTOMERS REQUIREMENT
Catfish farmers indicated what determines the price of the fish; these are what buyers look out for. The determinants were sectioned among colour, size, specie and freshness. Figure 19: A graph showing what customers require in catfish
Source: Survey Results
The survey showed that 95.2% of farmers chose size as the price determinant.50% indicated the freshness of the fish, 26.2% indicated that the specie of the fish was important and relates with the price and 14.3 picked the colour as a factor that determines price of catfish.
4.7.2 PRICE OF CATFISH
Figure 18: A Graph Showing the Source of Price Information

40
Source: Survey Results
The price for 1kg of fish varies in the study area as indicated in the graph above. 2.27% sell below N600, 61.36% sell between 600-700 Naira, 34.09% sell between 710-800Naira and 2.27% sell above 800 Naira. This means that in the same environment different farmers sell 1kg of fish at different prices.
An interview with a catfish farmer in the area revealed that some farms are located in hidden locations that are far from the major roads. These farms suffer low prices compared to farms located close to the main town. Another interviewee stated that farmers out of fear of increase in cost of production sell off at prices offered by the traders.
Key informant interview mentioned that the price of the produce is usually different because of the quality of harvest ,at point of sale, very big sizes attract better price than smaller catfish, despite the scale measurements which some farmers do not adhere strictly to, buyers are usually attracted to big sixes.
4.7.3 INPUT MARKET
Using survey in annex 3, Catfish farmers were asked to indicate the major challenges they encounter during production and the responses from survey shows 88,1% indicated expensive feed, 54,8% noted that they experienced stunted growth., 23.8% chose high death rate and 11.9% picked poor specie as their major challenge during production.
Key informants mentioned some of the reasons for these issues stating that almost all catfish farmers use foreign fish feed for production which is of high quality but also very expensive due to all the logistics associated with providing it to the farmers, findings reveal that stunted growth is caused mainly by malnutrition or bad stocking of the fish. Key informant 2 said most catfish farmers tend to overstock
Figure 20: A Graph Showing the Selling Price of 1kg of Catfish among Catfish Farmers
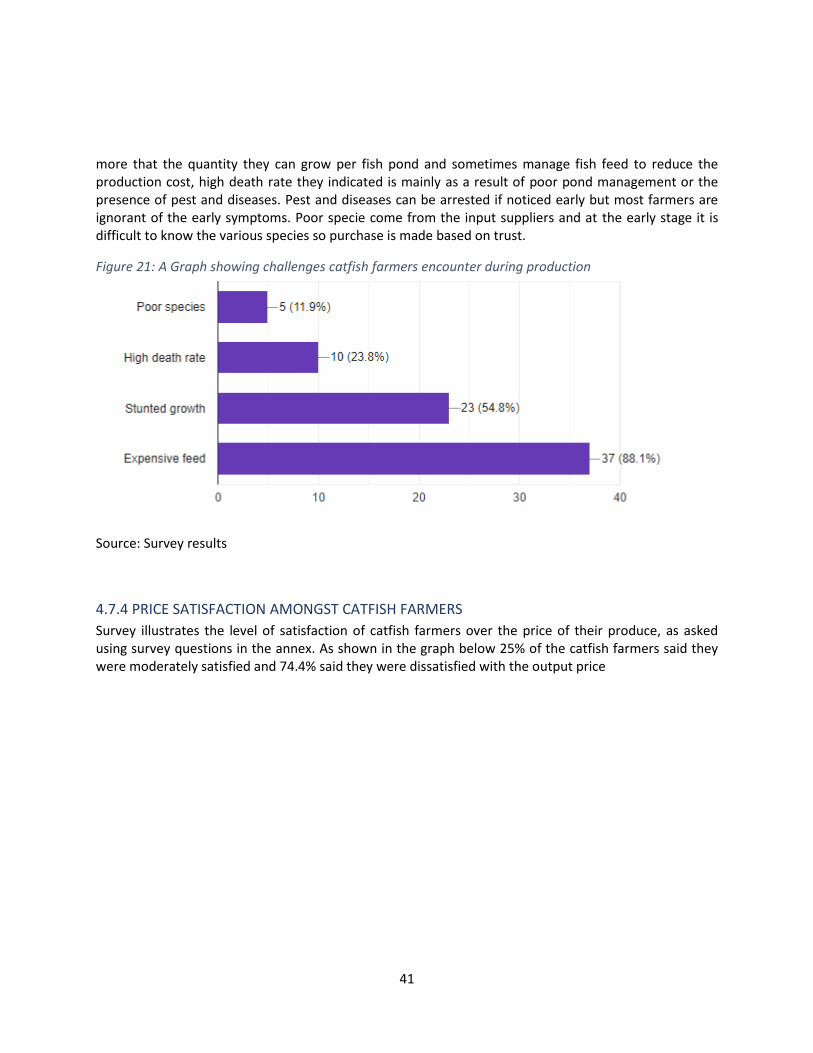
41
more that the quantity they can grow per fish pond and sometimes manage fish feed to reduce the production cost, high death rate they indicated is mainly as a result of poor pond management or the presence of pest and diseases. Pest and diseases can be arrested if noticed early but most farmers are ignorant of the early symptoms. Poor specie come from the input suppliers and at the early stage it is difficult to know the various species so purchase is made based on trust.
Figure 21: A Graph showing challenges catfish farmers encounter during production
Source: Survey results
4.7.4 PRICE SATISFACTION AMONGST CATFISH FARMERS
Survey illustrates the level of satisfaction of catfish farmers over the price of their produce, as asked using survey questions in the annex. As shown in the graph below 25% of the catfish farmers said they were moderately satisfied and 74.4% said they were dissatisfied with the output price

42
Figure 22: A Graph showing how satisfied catfish farmers are with catfish price in percentages
Source: Survey Results

43
4.8 INSTITUTIONAL FACTORS
Institutional factors will cover factors controlled by the various institutions affecting catfish production,
these factors will include access to market, good infrastructure, access to credit facilities and access to
extension services.
Figure 23: A graph showing institutional challenges catfish farmers encounter in percentages
Source: Survey Results
The survey response shows that there are so many institutional challenges catfish farmers in this area face. The farmers were asked to state these challenges and 95.2 percent of the respondents indicated poor electricity as a major constraint, 71.4% noted poor water supply, 69% marked low farm gate price of catfish, 28.6% of the farmers complained of insecurity in their business, 9.5% said no extension visit is a challenge and 2.4% picked bad road.
Information from interviewees pointed that in Rivers State, including Eleme, electricity is a major challenge for catfish farmers. Electricity powers the pumping machines that produce water for the ponds. The area uses the borehole system of water supply and catfish production needs constant water supply, interview with a respondent made mention of poor security in the area, stating that their produce are stolen from time to time in the cost of production.
A large number of catfish farmers noted low farm price, all interviewees mentioned how poor price of fish is a problem for the catfish farmers. Most farmers sell to traders who tend to fix the price of the fish after production. Catfish farmers complained of the high cost of production and sometimes losses they encounter in the cause of production and these issues are not considered by the traders during purchase.
“How can I go through all these and these women will tell me how to sell my fish”. (Respondent 4)

44
Key informants described some of the wholesalers as “fish mongers”. They mentioned that these fish mongers have a habit of purchasing fish at farm gate at a very low cost; in fact, they look at for farms that seem to be challenged and eager to sell out.
Bad road is another challenge for the farmers as 2.4% of the respondents highlighted. The bad roads challenge their customers from getting to them and the purchase of input supply. The survey also reported that catfish farmers encounter various challenges with transportation.
Table 9: A table showing Transportation Challenge of catfish farmers in percentages
Frequency Percent Valid Percent Cumulative Percent
Valid expensive transportation 17 39.5 39.5 39.5
bad road 7 16.3 16.3 55.8
no good market structure 1 2.3 2.3 58.1
far distance to market 4 9.3 9.3 67.4
losses during transportation 14 32.6 32.6 100.0
Total 43 100.0 100.0 Source: Survey Results As shown in the table above, 39.5% of the respondents point to expensive transportation as a problem, 32.6% encounter losses during transportation,16.3% mentioned bad roads, 9.3% sad the distance to market is far and 2.3% mentioned that bad market structure is also a challenge they face with taking fish to the market. Interviewees also agreed that some challenges are limiting factors to the catfish farmers for example bad roads, expensive transportation and far distance to market. Most catfish farms are located a few distances away from the market because of the availability of land and enough space for the business. The problem with bad road and far distance to market is the cause of expensive transportation and fresh Catfish is highly perishable and in course of transporting the fish to the market, the fish can lose its freshness, become weak and even die in some cases attracting low price.
4.9 PRODUCER ORGANIZATION PERFORMANCE WITH CATFISH FARMERS
The research set out to discover the performance of producer organizations and their effects on catfish farmers in the study area. Table 10: A Table showing catfish farmers in producer organisations in percentages
Frequency Percent Valid Percent Cumulative Percent
Valid Yes 16 37.2 37.2 37.2
No 27 62.8 62.8 100.0
Total 43 100.0 100.0 Source: Survey results

45
The table above was analysed from survey in annex 3 and it shows that 37.2% of the catfish farmers are in producer organizations while 62.8% are not members of any producer organization or farmer groups. The reasons given for not belonging to groups or organizations were many. The reasons given were that they were not interested because of the group’s poor performances, some were ignorant of active groups, and others complained of not having access to join, the rest did not give any good reasons.
4.9.1 RELATIONSHIP BETWEEN LEVEL OF EXPERIENCE AND INCOME OF CATFISH FARMERS
The scattered graph was drawn from the response from the survey in annex 3, it defines the relationship between experience and income per month, and catfish farmers that have stayed longer in the business seem to get more income compared to the farmers with few years of experience. Findings show that majority of the producers in the area had between 1-6 years of experience and just a few had stayed in business for at least 7years and above. From the graph below the years of experience has a relationship with income. The regression line in the correlation shows that there is a perfect relationship between level of experience and income of catfish farmers. Figure 24: A graph showing the relationship between level of Experience and income of catfish farmers
Source: Survey results
4.9.2 CHALLENGES WITH CATFISH SALES
Findings show that catfish farmers in the area in producer organizations have fewer challenges compared to those who do not belong to producer organizations. Information from interviewees noted that producer organizations give some forms of aid to members. Respondent 4 happens to be a member of a producer organization and he mentioned that though the group’s activities are limited it has helped to solve most of its member’s problems. Some of the

46
problems highlighted when comparing cooperative members and non-members are transportation and income and extension services. Figure 25: A graph showing a Comparison of transportation problems amongst catfish farmers in producer organisations and catfish farmers not in producer organisation
Source: Survey Results
As shown in the survey, the graph above shows that out of the total number of catfish farmers in cooperative or groups 13.95% indicated that expensive transportation, 9.3% stated bad road as their problem with transportation, 11.3% experience losses during transportation while 2.3% indicated far distance to market as their problem
For the farmers not in cooperative or groups 25.5% complained of expensive transportation 20.9% experience losses during transportation, 6.9% noted bad road, another 6.9% indicated far distance to market as the problem they face while 2.3% noted bad market structure as a challenge they encounter.
4.9.3 SUPPORT FROM PRODUCER ORGANISATIONS
Catfish farmers indicated that producer organizations are involved with some activities relating to productions.94.1% of the farmers indicated that producer organizations support with providing feed and fingerlings,58.8% indicated marketing, 47.1% picked extension services,11.8% indicated financial support and the remaining indicated they didn’t have any benefit. Interviews from key informants also reveal that producer organizations both formal and informal support their members with input supplies, sometimes subsidized and good specie of fingerlings and sometimes extension services but are usually paid for by the farmers.
Findings also reveal that financial support can only be assessed through formal cooperative members.

47
Figure 26: A Graph showing cooperative activities with marketing for catfish farming
Source: Survey Results
4.9.4 INCOME PER MONTH FOR COOPERATIVE MEMBERS/NON-MEMBERS
A test was done to find out if there is a difference in income between catfish farmers in producer organizations and catfish farmers who are not in producer organizations
Question: is there a difference in income per pond between catfish farmers in producer organizations and catfish farmers who not in producer organizations.
(Hypothesis) H1-There is a difference in income per pond between catfish farmers in producer organizations and catfish farmers who are not in producer organizations.
(Null hypothesis) HO- There is no difference in income per pond between catfish farmers in producer organizations and catfish farmers who are not in producer organizations.

48
Figure 27: A Graph showing a comparison of Catfish Farmers Income for members of producer organisations and non-members
Source: Survey Results
The error bar graph above shows that there is a difference in means between the income of cooperative or group members and non-members. Interviews and survey given to catfish farmers in producer organization mentioned that groups and cooperatives assist with benefits for their businesses. Some of which are lower cost for feed, access to information, extension services, supplies and delivery services for input. The support could be the reasons behind the difference in income.
From the table of Independent Sample T test In ANNEX 5, Probability value, P=0.008<α=0.05 The Null hypothesis rejected, thus there is a difference in monthly income from fish farming between farmers in cooperative and those that did not belong to cooperative, with those in cooperative observed to have higher mean income per fish ponds compared to those who did not belong to cooperative.

49
4.9.5 ACCESS TO EXTENSION SERVICES
Figure 28: A graph showing a comparison of access to extension services for producer organisation members and non-members
Source: Survey results The graph above shows the percentage of catfish farmers that assess extension services according to the survey. 28% of catfish farmers in groups or cooperative get extension services 9% of the catfish farmers do not get extension services while 60% of catfish farmers that are not in groups or cooperative do not get extension service and 2% get extension services.
4.10 SUGGESTIONS FOR PRODUCER ORGANISATIONS FOR EFFICIENT MARKETING The following strategies that could improve efficient marketing were mentioned by respondents during interviews. Some of these strategies were mentioned by farmers and key informants Training members: key informant 1, 2 and 3 mentioned that there is need for the catfish farmers to be trained on how to manage their farms, most catfish farmers lack the technical know-how and proper farm management skills needed for catfish production.
Funding: All three catfish farmers interviewed stated that there is need for producers to be able to assess funds with low interest rate especially through cooperatives
Feed and input subsidies: The high cost of feed and the need for improved variety of fish seeds was mentioned by the farmers.

50
Government support: Most of the respondents seriously think government interventions will enable producers to market efficiently, through infrastructural development and making policies, but also monitoring the processes to address most of these challenges. According to one of the informants:
“Government programs have been running to aid farmers, yet the aid seems not to get to those concerned “
(key informant 2)
Creating artificial scarcity: One farmer interviewed believes that creating artificial scarcity for catfish, by collective agreement by producers in the area can help to stabilize the price for the producers. The low price of fish is fixed by the traders.
4.11 SUGGESTIONS FOR PRODUCER ORGANISATIONS TO IMPROVE MARKET
INFORMATION
Participants of the focus group discussion agreed that a one on one interaction with producers through text messaging, e mails and WhatsApp messages can improve access to information.
Key informants mentioned that a closer interaction with the actors and stakeholders concerned will improve market information
Another strategy mentioned by key informants was to organize for traders/agents to cut off the middlemen and act directly with the main actors.
4.12 MARKET REQUIREMENTS FOR CATFISH
Below is a compilation of market requirements of catfish by consumers, the information was gathered
from, catfish farmers wholesalers, processors and retailers and summarised in the table below
Market requirements for catfish were identified to be size, taste, freshness, colour, and convenience.

51
Table 11: Market Requirement Table
Source: Field Data
4.13 THE EFFECT OF COVID 19 ON CATFISH FARMING
The Covid-19 pandemic had effect on catfish farmers, findings from interview with key informants and producers noted that the pandemic caused a lot of challenges with getting input such as fish feed. Catfish farmers during interviews complained of the increase in fish feed due to the lock down measures and even scarce to find. Many catfish farmers were frustrated with low sales and sold at losses; some farmers also got discouraged about the business and have stopped production .However very few farmers through cooperative could assess support like funds from donors and input supply as shown in survey results. Interviews also revealed the existence of two types of producer organisations. The formal and the informal, both operate at different levels to support catfish farmers with the numerous challenges; yet operate on different capacities. Below is a swot analysis showing the strength weaknesses opportunities and threats of these organisations as obtained from the field.
Size ➢ The size: most consumers demand for fresh catfish which weigh between 300g to 1kg, this size contain a reasonable among of fish meat
Taste ➢ Catfish with natural flavour is most preferable, farmed catfish can have a different taste which is determined mainly by the type of breeding, water management and the specie.
➢ Farmed catfish can be produced naturally just as the natural captured fish but can also lose its natural taste when breed or feed with chemical flavours and too many antibiotics.
➢ Processed: catfish especially using local means of smoke drying. Catfish can lose its taste with having the smoke taste.
➢ Taste can also be affected by the salting and seasoning when processing by drying or cooking.
Freshness ➢ Fresh catfish: Consumers are usually in high demand of alive and active fresh catfish,
➢ processed : dried consumers have different preference depending on the use some prefer it very dry with very low water content to increase its shelf life while others that use them for snacks prefer it not too dry without breakage on the skin
Colour ➢ Most consumers prefer the light brown skin colour catfish
Convenience ➢ Fresh catfish: Fresh catfish can only be packaged when slaughtered at the point of sale
➢ Processed: dry catfish consumers preferred a nicely packaged dry fish ready to be sold to be sure it is free from contamination
➢ Frozen catfish is also preferred when nicely packed in sealed plastic bags
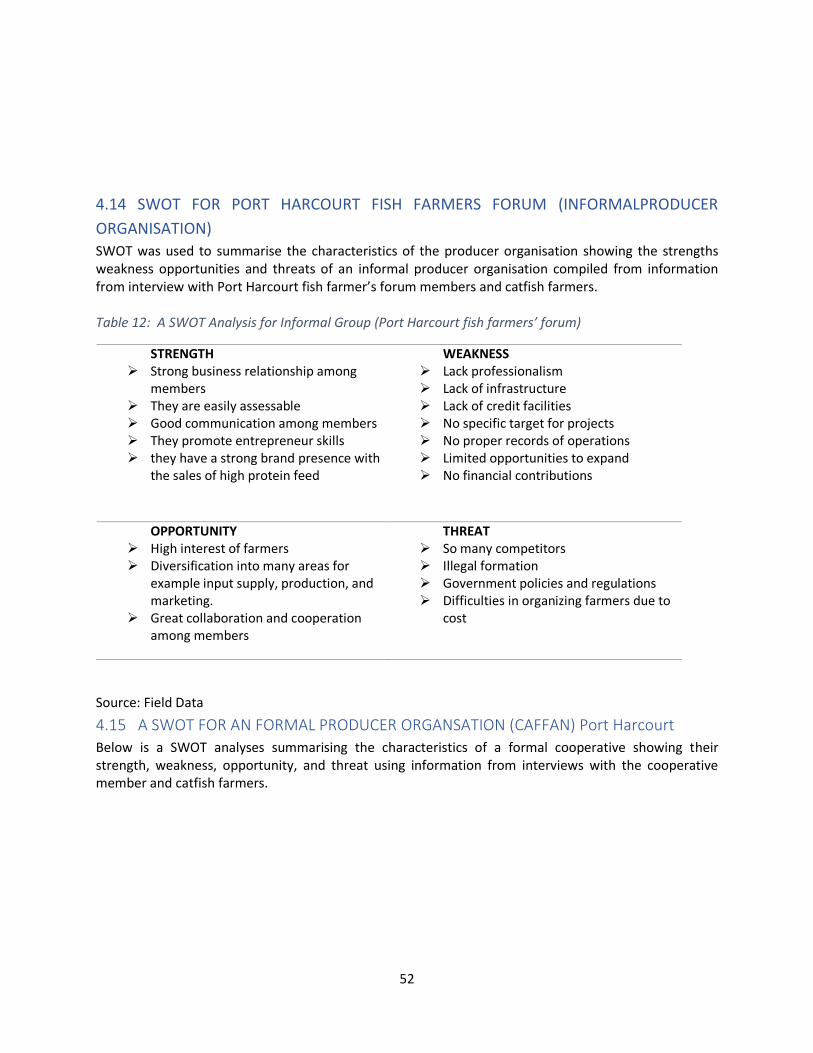
52
4.14 SWOT FOR PORT HARCOURT FISH FARMERS FORUM (INFORMALPRODUCER
ORGANISATION)
SWOT was used to summarise the characteristics of the producer organisation showing the strengths weakness opportunities and threats of an informal producer organisation compiled from information from interview with Port Harcourt fish farmer’s forum members and catfish farmers. Table 12: A SWOT Analysis for Informal Group (Port Harcourt fish farmers’ forum)
Source: Field Data
4.15 A SWOT FOR AN FORMAL PRODUCER ORGANSATION (CAFFAN) Port Harcourt
Below is a SWOT analyses summarising the characteristics of a formal cooperative showing their strength, weakness, opportunity, and threat using information from interviews with the cooperative member and catfish farmers.
STRENGTH ➢ Strong business relationship among
members ➢ They are easily assessable ➢ Good communication among members ➢ They promote entrepreneur skills ➢ they have a strong brand presence with
the sales of high protein feed
WEAKNESS ➢ Lack professionalism ➢ Lack of infrastructure ➢ Lack of credit facilities ➢ No specific target for projects ➢ No proper records of operations ➢ Limited opportunities to expand ➢ No financial contributions
OPPORTUNITY ➢ High interest of farmers ➢ Diversification into many areas for
example input supply, production, and marketing.
➢ Great collaboration and cooperation among members
THREAT ➢ So many competitors ➢ Illegal formation ➢ Government policies and regulations ➢ Difficulties in organizing farmers due to
cost

53
Table 13: SWOT analysis for a formal cooperative
Source: Field Data
4.16 PRODUCER ORGANISATION ASSESSMENT USING MIDCA
MIDCA was used to analyse the problem owners being a producer organization to access the areas of good performance and the areas for improvement. The assessment was done answering the questions and scoring the organisations as shown in annex 1A, 1B and 1C.
STRENGTH ➢ High bargaining power for farmers ➢ High membership ➢ Members can access credit facilities ➢ Experienced management and skilled
staff ➢ Good reputation ➢ Legally registered ➢ Detailed record and data base of
members ➢ Able to access external support
WEAKNESS ➢ Information gap ➢ Very busy and complex with multiple
projects ➢ Leadership is chosen through
democratic practice ➢ Sometimes non- challant about
entrepreneur and business skills ➢ Not easily accessible
OPPORTUNITY
➢ Farmers willingness to join ➢ Develop good ideas for development ➢ Conducts regular trainings ➢ Has high potentials to attract more
members ➢ Strong leadership direction
THREAT
➢ Leadership is Influenced politically ➢ Loose enthusiasm in projects ➢ Overlook quality to meet up with time ➢ Difficulties in organizing farmers due to
large membership

54
Figure 29: MIDCA Assessment
Source: Field Data
4.17.1 INTERNAL ORGANIZATION ASSESSMENT
MIDCA was used to assess Port Harcourt fish farmer’s forum, to pinpoint their performance as a producer organization. STAFF CAPACITY The organizations governance structure is a divisional structure, where they govern their own resources. The management has trained staff, but it is not sufficient for the organizational responsibilities, the technical staffs engages fish farmers with extension services and visit fish farms of members to give the necessary assistance needed. But the organization lacks the adequate number of technical staff to meet up all the members need. FINANCIAL MANAGEMENT The organization being informal does not have financial involvements or dealings thereby they do not meet up with financial needs of the members. The various departments are dependent on each other to perform effectively
53%61%
73%
28%23%
80%
60%44%
48%
Membership Base
The Product
The Services
Staff Capacity
Financial ManagementLong Term Perspective
Sales
Relationships
Total

55
LONG TERM PERSPECTIVE
There is a very clear mission and vision stated to guide the process of operations and outline the focus
of the organization and how to achieve set goals.
4.17.2 MARKET
MIDCA was used to access how producer organisation affects market in terms of sales and relationships
as shown in annex 1B
SALES The producer organization aid with sales of produce by advertising on the groups and promote patronage among members. The trainings given aid with better productivity and more income though the average price of catfish members of the organization produce compared non-members is not significantly high, due to other institutional challenges RELATIONSHIP WITH STAKEHOLDERS Stakeholder’s relationship is poor, the organization is unable to relate with the stakeholders involved with catfish farming especially financial institution, the government and others than give external support. but has very good relationship with producers and the community
4.17.3 PRODUCTION
MIDCA was used to access how producer organisation affects production in terms of product, services,
and their membership base as shown in annex 1c
THE PRODUCT PFF is involved with trainings to increase productivity and good farm practices providing room for good quality and price of the product, as well as water management and disposal systems to support the environment. SERVICE PFF delivers fish feed to members and clients , members relate with each other on their products, needs and services to be rendered, these activities go on through the group medium for communication, the participants rate the organization fairly for services but still have expectations.
MEMBERSHIP BASE
PFF has a high membership involvement and participation, there is no proper certification, and however members are kept informed on issues concerning the group.

56
4.18 CURRENT BUSINESS CANVAS
The business canvas model of Port Harcourt fish farmer’s forum shows their key activities, partners, value proposition, customer relationship and segment and relating to the current business operations
Figure 28: Existing Business Model for Port Harcourt Fish farmers Forum
• SKREETING NUTRECO COMPANY
• RIVERS STATE GOVERNMENT
• MINSITRY OF AGRICULTURE
• PRODUCTION OF FISH FEED
• PACKAGING OF FISH FEED
• SALE OF FISH FEED• CONSULTATION
• HIGH QUALITY AFFORDABLE PROTEIN RICH FEED
• DELVERY VANS
• ONLINE APP
• HUMAN RESOURCE• FINANCIAL RESOURCE
• SMALL SCALE AND LARGE SCALE CATFISH FARMERS
• OFFICE RENT • GENERATOR/FUEL COST
• SALES OF FEED • DELIVERY FEE • CONSULTATION FEE
KEY PARTNERS KEY ACTIVITIES VALUE PROPOSITION
CUSTOMER RELATIONSHIP
CHANNELSKEY RESOURCES
CUSTOMER SEGMENT
COST STRUCTURE REVENUE STREAM
• CARBON EMMISSION FROM SMOKING FISH AND MACHINERY •
ENVIRONMENTAL/SOCIAL COSTS
ENVIRONMENTAL/SOCIAL BENEFITS
Source: Field Data

57
CURRENT VALUE CHAIN MAP
Figure 29 : Current Value Chain Map
INPUT SUPPLYING
PRODUCING
WHOLESALING
PROCESSING
COLLECTING
RETAILING
CONSUMING
HATCHERIES/INPUT SUPPLIERS
(PRIVATE & GOVT)
FARMERS(DRYING)
TRADERS
SMALL SCALE CATFISH
FARMERS
WHOLESALERS
N15-N30 PER FINGERLING
N650-N750 PER KG
N700-N750 PER KG
N800-N1000
N1100-N1150
N1150-N1500
LOCAL PROCESSORS (DRIED FISH)
LOCAL PROCESSORS
(DRYING)20%
FISH MONGERS
FE
DE
RA
L M
INIS
TR
Y O
F A
GR
ICU
LTU
RE
AN
D R
UR
AL
DE
VE
LOP
ME
NT
(F
MA
RD
)
AG
RIC
ULT
UR
AL
DE
VE
LOP
ME
NT
P
RO
GR
AM
ME
S
(AD
P)
PO
RT
HA
RC
OU
RT
F
ISH
FA
RM
ER
S
FO
RU
M
FIN
AN
CIA
L IN
ST
ITU
TIO
NS
CA
TF
ISH
FA
RM
ER
S A
SS
OC
IAT
ION
OF
NIG
ER
IA (
CA
FA
N)
SUPERMARKET AND STORES
OPEN MARKETS
AND SHOPS
HAWKERS, OPEN
MARKET
LOW END CONSUMERS
(LOCAL BUKAS)
HIGH END CONSUMERS
(RESTAURANTS & HOTELS)
MIDDLE END CONSUMERS
ED
UC
AT
ION
AL
INS
TIT
UT
ION
S
----------information flow
-----------product floww
---------cash flow
30%
30%20%
30%
20%
30%
100%
70%
40%
20%
20% 20%
20%
Source: Field Data

58
Table 14: SWOT and PESTEC for Catfish Farming
Source: Field Data
STRENGHT WEAKNESS OPPORTUNITIES THREATS
POLITICAL ➢ Government strong support in aquaculture
➢ Enabling environment and policies
➢ Support of cooperatives and governing bodies
➢ No access to loans and credit facilities
➢ Little support from chain supporters
➢ Availability and strong interest of producer organizations
➢ No policy on the price of fish causing irregularities
ECONOMIC ➢ Catfish is hardly and can adapt to temperature change
➢ It is carnivorous in nature and can eat each other during production
➢ High demand ➢ It can be used to
manufacture other products
➢ High competition with the presence of other fish species
➢ Capital intensive
SOCIO-CULTURAL ➢ Low percentage of female involvement in catfish farming
➢ Involvement of youth in catfish farming
➢ catfish is a fish without scale and not consumes by some because of religious believes
➢ Used for preparing a lot of traditional dishes
TECHNOLOGICAL ➢ High percentage educated farmers making it easy to adopt to technology
➢ Training and workshops organized for new technology adoption
ENVIRONMENTAL ➢ ➢ Poor pond management
➢ Introduction of new innovations for fish farming
➢ Pollution of the environment from waste and uneaten feed etc.

59
CHAPTER 5
5.0 DISCUSSION AND CONCLUSION
5.1 STAKEHOLDERS AND THEIR ROLES
The research identified the various stakeholders of the value chain and their roles; the primary actors
which are the input suppliers (hatchers and feed producers) mainly private and government dealers, the
producers, the collectors, the processors, wholesalers, retailers and the consumers. The supporters of
which are FMARD, CAFFAN, PFFF, ADP, financial institutions, and educational institutions, all making up
the value chain. This matches the description of value chain by Mukandekezi (2014), which composes of
all actors and stakeholders
Notwithstanding the stakeholders and their roles in the catfish value chain, there is no proper
coordination and information flow among the various stakeholders as gathered from the field data; this
is highlighted by Henry C.(2009) that lack of coordination is critical for any sector and can cause negative
externalities which is capable of causing weak collaboration, lack of cooperation and no development
among actors, also it is noted by Hupe et al 2014 and Bharosa et al. (2010) that public policies are top-
down and the coordination of stakeholders is key in solving problems, Elbakidze (2010) that multi
stakeholder coordination can be done on various levels that can include local authorities and public-
private partnerships to strengthen state coordination.
Findings reveals that there are a lot of factors hindering and supporting the catfish value chain from
effective marketing, data collected from surveys and interviews actualise to some of these factors.
5.2 SOCIOECONOMIC FACTORS
Looking closely at socioeconomic factors such as gender, age, education level and number of years of
experience and catfish farming as a primary occupation was considered.
Gender: Survey indicates that in catfish production female participation is low with only 18.6% of female
been catfish farmers in the area, information from interviews made some facts clear why there is low
percentage of women in catfish farming with reasons such as no access to land and capital for start-up
available for women; this conforms to Brugere, and Williams. (2017) and Ahmed et al(2012) who
mentioned that women are limited to opportunities in aquaculture in Malaysia because they hardly can
access finance and lands compared to the men and can be involved only if they are assisted or by the
help of policies and laws to enhance such opportunities.
Findings presents that the income of men is significantly different to that of the women despite the fact
that there are fewer women in catfish farming, their income per pond is higher this is in total
disagreement with World fish (2014) that states that the income of women in aquaculture is lower than
that of the men. From findings it is assumed that female catfish farmers are good marketers and bargain
better for good prices compared to men. Given that a large percentage of the traders are women that

60
control the price of the fish. Female catfish farmers might have better dealings with female traders
which is in line with Freeman and Varley (1997) stating that women are inherent marketers and have
very great skills as sellers.
Education: Survey has shown that that all catfish farmers in the area have attended basic formal
education, which seems to be an advantage. having formal education which could affect the way the
farmers accept or reject information are able to coordinate, making it easy to adopt to new theory and
technologies which is in line with Paltasingh (2018) and (Oduro-ofori et al.2014) mentioned from a
research in Ghana, that the educational level of farmers have a positive effect on production, it
increases production output But recognises that extension services, trainings and non-formal education
has more impact on farmers than formal education. It could be assumed that the producers rely on their
formal basic educational in any field and ignore the need to the adequate knowledge needed for the
business.
Age: The age of most of the catfish producers in the study area is within 41-50, which is labelled as
middle useful age. Interviews with key informants also captured that so many young people go into the
catfish farming business with high projections to make good profit. With this age advantage, production
is still challenged, this could mean that the younger farmers might not be so determined to stay long
and endure all the risks involved with catfish farming, which is in line with Guancheng et al., (2015), and
Tauer 2017 notions that in China and the U.S respectively that older farmers are more productive due to
the fact that are more determined and do not plan to leave the business in a short time meaning
younger farmers have contrary effects of variations., until an older age of about 64years before
productivity begins to decline.
Experience: An additional factor highlighted from findings was the level of experience; from the findings
the number of years of experience has a positive relationship with income per month. Key informants
and farmers during the interviews stated that many catfish farmers in the area fall in and out of business
using trial by error method. The positive relationship however could be as a result of the catfish farmers
learning better over time from experience and getting better output and income. This is in line with
Ainembabazi and Mugisha(2014) and stating that good years of experience helps to make innovations,
build networks, coordinate and negotiate, and also resolve conflict among stakeholders which can result
in high productivity.
Findings from survey show that 74.42% of the catfish farmers take catfish farming as their primary
occupation, interviews with key informants made it clear that many catfish farmers do not depend on
the business as their main source of livelihood; many have other sources of income. This could be as a
backup in cases of uncertainties but is in context with Rayasawath,(2018)that notes that the primary
occupation to of producers have great influence on the attitude given to the business and will develop
its constancy as a source of livelihood.

61
5.3 INPUT AND OUTPUT MARKET FACTORS
Input market factors are factors in which the resources are used for production challenges catfish
farmers face during production include the high cost of feed, which findings show is as a result of the
numerous cost associated with the imported feed, expensive transportation, far distance to market and
poor specie of seed that may result in stunted growth. All of which points at high cost of production
output market factors are factors in which goods and services exchange depend on which in this case is
the price unfortunately is low which is in contrast with the concept from Ahmed et al (2016 ) states that
the higher the price loomed at production costs for input which may include high cost of input,
expensive transportation costs and other factors that contribute to production, gives rise to an increase
In price on output.
However, in some states in America catfish farmers increase production solving the problem of poor
specie by growing hybrid catfish which produces more per pond, which recorded success by getting over
supply according to Mayer, (2019).
And kiIt et al., (2006) also stated that transaction cos can be reduced when producers are organised and
operate jointly which will lower the cost of production.
The price of catfish is such that any farmer can decide to sell at any price which is encouraging
customers and buyers to source for the lowest possible price, because the price differ even in the same
location with high competition among producers, as a result of farm location some farmers reduce their
prices just to be able to make sales. Even though the sales are made the farmers are not satisfied about
their income. This is in line with Ofuoku et al. (2008) outlook that farmers are unable to fix prices of their
produce due too poor organisation.
In Indonesia, the low farm-gate price of commodities is usually triggered by poor quality and complex
value chain. Value addition and direct selling through agents are piloted to increase farm-gate price and
negotiating power of smallholder farmers and income (Hartatri,2016)
Market channels: Findings show that the channels for sale of catfish are numerous catfish is sold
through so many channels; the catfish farmers sell to almost all the chain actors at farm gate as seen in
fig 15.
There is poor coordination and no information about price, the price is usually determined by the
traders causing the price of catfish to be unstable; Quality is also not checked, the catfish farmers
operate individually and are dependent on the traders; this could be the reason traders are appear very
powerful to the extent of setting prices this complies with KIIT et al., (2006) which notifies that
producers and traders always have problems with price but these problems by a better coordination
between producers, producing good quality building trust and stronger relationship between producers
and traders and negotiations.

62
Lee et al.,(2012) also added that good farm gate prices are due to fewer middlemen and lower
transaction costs in market channels. When farmers are not informed of prices the middle men take
advantage of the situation to make transactions with big margins although they link producers with
buyers.
5.4 MARKET ANALYSIS USING MARKET MIX
Market mix was used to analyse the current market strategies for catfish using information from field
data and desk study.
PRODUCT
Findings reveal that Catfish is sold fresh and processed by drying or smoking; it is a perishable
commodity with a very short shelf life. In Rivers State, the growth, specie and output size is very
important to consider during production (Onoja and Achike 2011)
PRICE
Finding from survey shows that the price of catfish is not stable and fluctuates among producers shown
in figure 20 this agrees with Ohen (2007) and Asa (2014).that catfish prices in Nigeria. Onoja and Achike
2011 noted that in Rivers State, the prices of input which are unstable affect the output.
PLACE
Catfish is sold mostly at farm gate by the producers but also sold in open markets, shops, supermarkets,
and 20% from catfish farmers go to restaurants, and hotels the wholesalers, female collectors/ traders,
retailers, processors and even the consumers prefer to purchase fresh catfish at farm gate as indicated
from survey results shown in figure 9.This is in contrast with Webber and Labaste (2010) that says 70%
of catfish goes to hotels and restaurants. This however could be as a result of the various market
channel shown in survey result in Figure 17, or the presence of middle men.
PROMOTION
Promotion of catfish in Nchia is deficient as the product is presently promoted by its sellers majorly by
word of mouth, as shown in annex 6.this is in compliance with Anukwa et al 2013 that states catfish
farmers in Rivers State are known to promote their product through very few channels with major sales
done at farm gate. Not much is done on advertisement.
5.5 INSTITUTIONAL FACTORS
Findings show that catfish farmers in Nchia are also challenged with institutional factors; these are
factors that are controlled and managed by different institutions. Survey shows that 95.2% of the catfish
farmers indicated that there is poor electricity supply in the area; this was also stated during interviews
with key informants. Electricity is important in catfish farming as it is directly linked with water
supply.71.4% of the farmers also indicated water supply as a challenge. Information from interviews

63
stated that electricity is needed to power pumping machine as the most popular type of water supply is
the borehole system
Catfish farming needs a lot of water supply to keep the pond clean and fresh for good pond
management. Information from Interviews gathered that water should be pumped twice a day at least
for concrete pond or tank system and a steady 2-way flow of water for hatchers which is lacking due to
poor supply
Kit et al., (2006) made it known that though it is the government responsibility to provide these
amenities but they have failed to do so severally therefore all actors concerned should make intentional
steps and make combine effort towards achieving a more conducive situation.
It can be assumed from findings that poor electricity can affect production but can also affect value
addition. Value is added by freezing, smoking, drying packaging etc., catfish can also be used to other
products like oil, etc as mentioned by Sathivel et al.,(2003) all of which are difficult and expensive
processes for producers operating individually, as identified by Riisgaard (2010).
Extension services: Few farmers according to survey noted lack of extension services as a challenge,
survey also revealed that a lot of catfish farmers do not get extension services, key informants
interviews revealed that most catfish farmers neglect the importance of extension services, it is
assumed from findings that the farmers are educated with at least the basic form of education and
believe they will be able to cope with their farms adequately with little or no extension visits. However,
Kumaran et al (2012)and Dickson et al., (2016) stresses how vital aquaculture farmers need extension
services to be able to access the right information needed for production, it was also noted in India that
public funded extension is not sufficient and the farmers have to depend on paid extension Chowdhury
et al., (2016) also agrees that extension service is a necessity as it enhances good relationship among
stakeholders and have a positive effect on fish farmers with increase in productivity and income even
though public extension are deficient.
5.6 SUGGESTIONS FOR PRODUCER ORGANISATIONS TO INCREASE PROFIT IN CATFISH
MARKETING
From findings, strategies for producer organisations can aid to increase profit for small scale catfish
farmers are organising trainings for farmers. This is in agreement with KIIT et al., (2006) who states that
it is very difficult for producers to understand market demands and access information as individuals but
they have a better chance of getting information of demand and supplies, required volumes, quality
required timely.
The need for training and extension visits was stressed by all key informants, being that most catfish
farmers lack the technical know-how. this is however in line with Heijden 2007, an example given by the
Dutch aquaculture system which is a success because the fish farmers are well organised in producer

64
organisations but still have to go through a short or long course in preparation for the type of
aquaculture business to venture into.
Providing loans with low interest rates was an additional strategy generated from interviews and focus
group discussion; however it is also in compliance with Roduner (2007) who highlighted that some
actors are stuck in value chains that attract low income chances, these actors have the need of funds to
search for new opportunities. By supporting one actor there is high chances of generating reasonable
advantages for the entire system. This method can be adopted in challenging markets. Subsidizing for
input supply especially feed and sourcing for government support Akinrotimi, O.A. (2018) and Gbigbi,
T.M. (2019) that made it clear that input in aquaculture is a major drivers for development and needs
government interventions, even though it looks like a positive intervention it is indicated by KIT et al.,
(2006) that the government fail most times to intervene adequately to institutional needs and other
times sometimes it takes too long to get government support. Therefore, producers can jointly organise
themselves for better options like reducing transaction costs etc.
However, it is assumed from findings that creating artificial scarcity will not be a good strategy for
efficient marketing; catfish has high demand but also has a lot of competition with other types of fish in
the market, artificial scarcity can make consumers fall back to other substitutes for catfish which might
end up as a failed strategy by creating artificial scarcity of catfish for buyers to appreciate the value of
the product this is in contrast with Dasgupta,(2004) who states that creating artificial scarcity will
increase the risk of future price for the product and will also increase transaction costs
Additionally, Toledano 2018 noted that with the modern awareness of information and communication
technology (ICT), it is difficult to successfully create scarcity as technology has the reduced scarcity of
goods
Moreover, catfish is highly perishable and price issues should be treated with diplomacy using the right
strategies to avoid attracting lower prices or wastage. (Díaz 2017)
The researcher thinks most of these strategies can be achievable with less limitations if the producer
organisation is formally registered, findings show that informal producer organisations and farmer
groups are limited to a lot of possibilities and opportunities thereby being unable to perform
appropriately and adequately this complies with Bijman et al.,(2012) that stresses how legally
registered cooperatives can benefit largely from policies and can take advantage of the opportunities
that emanates from it.
5.7 SUGGESTIONS FOR PRODUCER ORGANISATIONS TO INCREASE MARKET
INFORMATION
Some strategies to increase market information gotten from findings are direct interaction with farmers
through personal phones, emails and phone applications, agreement by meeting the various
stakeholders will also increase stakeholder’s involvement and information among the various
stakeholders which is in accordance to Vozniuk (2015) Communication can be increased through

65
increasing the communication channels using conventional methods and digital methods, to pass
information to stakeholders concerned including the chain actors which will over time grow into a good
development system
Key informants also suggested organising agents to work for the groups and cut off the middlemen will
enable those agents pass information to the farmers. This agrees with Oguoma et al., (2010) who states
that the middlemen tend to have the information needed for efficient marketing but take advantage of
the bulk profit in the bid to assist with marketing for producers.
Below is a proposed chain map showing various improvements in the chain based on cooperative and
stakeholder’s involvement in the chain.
Figure 30: Proposed Chain map for Port Harcourt fish farmers Forum
INPUT SUPPLYING
PRODUCING
WHOLESALING
PROCESSING
COLLECTING
RETAILING
CONSUMING
HATCHERIES/INPUT SUPPLIERS
(PRIVATE & GOVT)
FARMERS & COOPERATIVE
(DRYING)
TRADERS & COOPERATIVE
SMALL SCALE CATFISH
FARMERS
WHOLESALERS LOCAL
PROCESSORS (DRIED FISH)
LOCAL PROCESSORS
(DRYING)
FEDE
RAL
MIN
ISTR
Y O
F AG
RICU
LTU
RE A
ND
RURA
L DE
VELO
PMEN
T (F
MAR
D)
AGRI
CULT
URA
L DE
VELO
PMEN
T PR
OGR
AMM
ES (A
DP)
PORT
HARC
OU
RT F
ISH
FARM
ERS
FORU
M
FIN
ANCI
AL IN
STIT
UTI
ON
S
CATF
ISH
FARM
ERS
ASSO
CIAT
ION
OF
NIG
ERIA
(CAF
AN)
SUPERMARKET, STORES,
OPEN MARKET & HAWKERS
OPEN MARKETS,
SHOPS AND HAWKERS
HIGH,MIDDLE & LOW END
CONSUMERS
HIGH, MIDDLE & LOW END
CONSUMERS
EDU
CATI
ON
AL IN
STIT
UTI
ON
S
----------information flow
-----------product floww
---------cash flow
MANUFACTURINGCOOPERATIVE
WHOLESALERS
SUPERMARKET, SHOPS & ONLINE
HIGH & MIDDLE END CONSUMERS
NGO
s
Source: Researchers Design
5.8 MIDCA Tool for PFFF assessment
Using MIDCA to assess Port Harcourt fish farmer’s forum the organization, the discussion highlights on
the areas of poor performance as it concerns the organization.
STAFF CAPACITY: Findings have shown that the staff capacity of the organization is poor, the
organization lacks the adequate number of staff for proper functioning, findings from key informants
mentioned that the staff are volunteers and are not paid, the group is also not involved financially with
members which makes it difficult to raise internal funds. The few staff engages in input supply,

66
consultations, and farm visits. This can be better with the active involvement of members as it come to
an agreement with KIT et al, 2006 stating that the role of all actors involved is important to bring about
solutions to problems faced by producers
FINANCIAL MANAGEMENT: The organization lacks financial records, being an organization the financial
aspect is important for the smooth running of organizational needs, this however must operate under
good leadership and competence which disagrees with the operations of a producer organization by Ton
and Bijman(2006), that a producer organization can render financial aid based on its set rules and
regulations of operation. Aquaculture needs improvement which can be boosted by finances (Oparinde
et al.,2017).
The reasons for lack of proper financial managements can be assumed to be the lack of professionalism
in operations and no payment of dues by the members. Nandeesa et al.,2013) noted that savings and
prober financial management can be a way to meet with the needs of members which is essential for
producer organisations.
RELATIONSHIP WITH STAKEHOLDERS: Stakeholders relationship is poor, the organization is limited and
is unable to relate with all stakeholders involved with catfish farming especially donors, financial
institution, the government and others than give external support .this is in agreement with (Woodhill
J.2008) noting that informal groups are not often recognised and characterised as disorderly and unruly.
Below is a proposed business model for Port Harcourt fish farmer’s forum on strategies for efficient
marketing of catfish. The new activities are highlighted in red.
Figure 31: Proposed CANVAS Business Model for Port Harcourt Fish Farmers Forum

67
Source: Researchers Design
• SKREETING NUTRECO COMPANY
• RIVERS STATE GOVERNMENT
• MINSITRY OF AGRICULTURE
• PPPs
• PRODUCTION OF FISH FEED
• PACKAGING OF FISH FEED
• SALE OF FISH FEED• PRODUCTION AND
SALE OF FINGERLINGS (HATCHERY)
• CONSULTATION • ONLINE SALES AND
DELIVERY
• HIGH QUALITY AFFORDABLE PROTEIN RICH FEED
• QUALITY CATFISH FILLET AND CATFISH OIL
• OVEN DRIED CATFISH•
• DELVERY VANS• SALES POINT
• ONLINE APP• CONTACT DISPLAY
(PHONE NUMBER AND EMAIL ADDRESS)
• OFFICE CUSTOMER SERVICE
• HUMAN RESOURCE• FINANCIAL RESOURCE• INFRASTRUCTURE
• SMALL SCALE AND LARGE SCALE CATFISH FARMERS
• INDIVIDUAL CONSUMERS
• WHOLESALERS AND RETAILERS
• OFFICE RENT • GENERATOR/FUEL COST • STAFF SALARIES• PROCESSING EQUIPMENT
• SALES OF FEED • DELIVERY FEE • CONSULTATION FEE• SALE OF VALUE ADDED PRODUCTS LIKE FISH OIL AND FILLET
KEY PARTNERS KEY ACTIVITIES VALUE PROPOSITION
CUSTOMER RELATIONSHIP
CHANNELSKEY RESOURCES
CUSTOMER SEGMENT
COST STRUCTURE REVENUE STREAM
• CARBON EMMISSION FROM SMOKING FISH AND MACHINERY. • IMPROVED LIVELIHOODS FOR CATFISH FARMERS
ENVIRONMENTAL/SOCIAL COSTS
ENVIRONMENTAL/SOCIAL BENEFITS

68
5.9 REFLECTION This research was focused on the Assessment of producer’s organisations performance in order to link
small scale catfish farmers to efficient market in Nchia, Eleme LGA of rivers state in Nigeria, and to make
recommendations for my problem owners which is Port Harcourt catfish farmers forum on strategies for
efficient marketing and to my commissioners federal ministry of agriculture and rural development
Nchia, Eleme Rivers state strategies for implementation to solve marketing challenges for small scale
catfish farmers in Nchia, Rivers state
Reflecting on the research topic: My topic was first chosen during my first block, I had the need to
spotlight my chain and with my experience as an extensions officer, I had quite a number of chains to
choose from, I Chose the catfish chain due to my interest in catfish and my experience with working
closely with catfish farmers but also because of benefits and usefulness of catfish and the popularity it
has gained over time in my state and country (Nigeria). I was also told by the course coordinator, Marco
Verschuur that I was the first student that had interest in the catfish value chain and that made me even
more interested, I was happy to do something different from what others have done previously but also
appreciated the usefulness and relevance of catfish having high nutritional values, can be consumed by
the rich, poor, young and old, it also has a lot of potentials and serves as a source of livelihood for many
worldwide
Working with smalls scale farmers overtime has given me the passion to meet their need with every
given opportunity being that they contribute greatly to production but are faced with so many
challenges which are sometimes ignored.
In the course of my study and experience as a student I got to acknowledge the power of cooperatives
and how cooperatives can be very effective in solving most problems faced by farmers with so many
opportunities associated with working in groups.
I decided to look closely at cooperative performance to link small scale farmers to efficient marketing,
knowing with the help of desk study by other researches on how marketing is a challenge for catfish
farmers and the non-visible involvement and bad perception of cooperative in the study area. Nchia in
Eleme L.G.A was chosen having majority of the catfish farmers on small scale production and being that
it is the location of my commissioner.
Reflection on picking a problem owner: My primary problem owners being Port Harcourt fish farmers’
forum, they happen to be a popular producer organization in the study area with a reasonable number
of members. The group is interested in challenges catfish farmers are confronted with and are actively
involved in a few marketing related activities for catfish farmers. The group is also interested in this
research and is expected to act on the recommendations from this research to mitigate marketing
problems in the study area.

69
Reflection on data collection: The data collection method was very interesting; the research was carried
out in the time of ‘Covid-19 pandemic’. The pandemic came with a lot of restriction of movement and
travel bans. For this reason the researcher was unable to go on the field to carry out the research, all
data was collected online with the help of a research assistant and a mixture of online survey for catfish
farmers that had smart phones and distributed questionnaire for the remaining small scale catfish
farmers that didn’t own smartphones. Checklist was used for key informants’ interviews and interviews
involving other actors of the chain.
The process was challenging but also interesting. There were a lot of challenges with the network
connections, planning schedule with respondents, time difference challenges, recording challenges,
communication, and delay in receiving responses from respondents. Though challenging it made me
creative on how best to make the process successful given that it was also time bound.
I devised a lot of means like using voice notes, emails translating interview checklist to interview
questions and creating online survey, sending text messages and emails regularly to make the process
doable. Even though I had a research assistant volunteer from my organisation, his schedule and plans
couldn’t fit with mine because he had a lot of responsibilities at the time, I saw the need to hire another
assistant to ensure I get all the data needed for my research.
It was a demanding process getting all the data, but this was not such a surprise because of the mini
thesis conducted during my third block still in the time of the pandemic. The mini thesis experience was
an eye opener and made me familiar with the data collection methods. All efforts made summed up to
fetch me data sufficient to carry out my analysis.
Researching about cooperatives, I had a mixture of catfish farmers who were not interested in
participating because of the perception they had about cooperatives, some did not know much about
cooperatives and others were happy and enthusiastic to participate.
One striking experience I had was that I was able to still probe during my interviews, even though it was
not an on-sight interview and I discovered quite a lot as a researcher. In the cause of my data collection I
discovered something new about my problem owners which made my research focus on an aspect
originally not intended in my proposal. My problem owner was an informal group though popular in the
study area and has quite many members. This vital information drifted my research a little to a new
concept and broadened my scope to look a little more into informal producer organizations to suggest
implementable recommendations. The relieving part of it was that my problem owners got so interested
about my research and were willing to assist with all the information I needed from them.
I had to improvise on my method of collecting data to enable me gather all the information required to
do my analysis, though it was tasking but again it made me feel on the track as a researcher.
Reflection on data processing: Data processing needed a lot of concentration. It was quite interesting
for me using qualitative and quantitative analysis. I used inferential statistics (SPSS) for my quantitative
analysis and coding using Microsoft excel sheets for my qualitative, the analysis was sufficient to answer

70
my research questions. In the process, I realized some questions were unanswered by most of the
respondents, questions related to accountability, this depletes that most of the farmers do not keep
records or take note of their cost and revenue, and number of mortality in the cause of production.
Reflection on writing my report: Writing my report was the most challenging aspect of my research. I
had to play two major roles effectively during my research, first a nursing mother and a researcher. I
managed with the process until I had to put my report together.
I realized it was a master’s thesis report and as such needs professionalism and attention to produce a
good report. Even though I had most of the information I needed, I was under so much pressure coming
from the complexity of my new status. I kept pushing but then I almost broke down; then I realized how
important creating a balance will be. In all the severity I was able to discover my hidden strength and
made a lot of sacrifices to get it done.
Relevance and reliability of my data: There was a need to analyse the catfish value chain in order to
suggest strategies to upgrade the chain which will mitigate some of the problems faced by catfish
farmers in the study area. The problems had lingered for quite time and needed urgent attention;
however this research has contributed to existing knowledge and will suggest interventions that can be
implemented almost immediately to solve some of these problems for better value chain performance.
Data collected from the field is first-hand information from catfish farmers and actors of the chain in the
study area, therefore the data is reliable to represent the situation in the study area. The data was also
collected using the ethical conduct of a research, data collection was done without bias and it has been
analysed accordingly.
Reflecting on the limitation and reliability of the research:
This research incorporated some limitations. Given that it was a short time given for the research, not
many aspects was considered critically, the effect of the corona pandemic also had an influence in the
process, meeting respondents was not so easy, there was restriction of movement for some time and
communication was done only through mobile phones, social media and emails. The process was longer
as responses did not come in timely.
The researcher totally depended on the research assistant for data collection and had to hire extra
hands to meet up with the process.
Some respondents were not willing to share information especially on hearing about cooperative, most
of them were so not interested with the notion they had previously about cooperatives.

71
CHAPTER SIX
6.0 CONCLUSION The purpose of this research was to analyse the catfish value chain in Nchia to identify the factors
limiting the value chain from performing effectively, and to assess producer organisations performance
to help profitable marketing of catfish for small scale catfish farmers. The research discovered the
following:
The catfish value chain has a lot of stakeholders but lack proper organisation and coordination, there is
lack of information between the stakeholders and the actors the chain with limited information
between the actors of the chain. The lack of information and coordination has led to poor value chain
performance including marketing
The research gathered that producer organisations are actively contributing to solving problems of
catfish farmers even though they are perceived to be not active.
Port Harcourt fish farmer’s forum as well as other informal producer organisations maybe involved with
marketing activities but are limited to a lot of opportunities because they are not formally registered
and are unable to perform adequately, however the informal groups are very popular and attract a
strong membership base
SOCIOECONOMIC FACTORS HINDERING THE VALUE CHAIN
There are some factors categorised as socioeconomic which have limited production and in turn
marketing, gender imbalance in catfish production. Female are well represented in the chain mainly on
the processing and marketing and tend to perform so well but the level of female participation is low in
catfish farming in this area, this is a limiting factor as women are natural marketers and sellers.
Most of the catfish farmers in the area have very little experience in catfish farming. A very small
percentage of producers lack experience of production and marketing which is capable of affecting
output market and their income.
MARKET FACTORS HINDERING THE CATFISH VALUE CHAIN
The research discovered that Catfish farmers produce independently without quality checks or measures
put in place, attracting a low and unstable price, Most Catfish farmers do not add value sell to their
produce and sell to every actor at farm gate. The presence of middlemen negatively influencing the
chain, and traders buying at low prices without taking into consideration that the cost of production for
catfish farmers is high with challenges of high cost of feed, and high transportation cost.

72
INSTITUTIONAL FACTORS HINDERING THE CATFISH VALUE CHAIN
Catfish farmers are challenged with bad road networks, poor electricity supply, poor water supply,
expensive transportation and high cost of feed which increases production cost. Most of these
challenges are to be solved by various institutions for example the government but have lasted over a
very long time with little or no solution.
MARKETING STRATEGIES FOR FARMER GROUPS TO MARKET CATFISH EFFICIENTLY?
Producer organisations are of two categories: the formal and the informal. These two groups operate in
different capacities but are involved in solving marketing problems of small scale catfish farmers;
however the informal producer organisations have limitations in their operations and poor relationship
with stakeholders but have a very strong membership base and closer relationship with catfish farmers.
The formal groups are legally registered and can operate in a wider range but have complexities in their
mode of operations but have good relationship with donors and other stakeholders. There are strategies
for both groups for efficient marketing such as conducting trainings, reducing transaction cost, bulk
purchase of input and sales, access to loans for expansion and many more; however the strategies for
formal organisations will be more sustainable.
From all information gathered from primary and secondary data, market information is very vital for
efficient marketing but is seemingly lacking along the catfish value chain in Nchia, Eleme local
government.it is also important for information flow between the various actors and amongst the
stakeholders , information can be accessed and disseminated through producer organisations,
extension agents and through digital platforms.
Using Midca tool, these areas needs to be improved for the better performance of PFFF
Staff capacity is low due to inefficiency of funds to pay wages and salaries, PFFF has poor financial
management, there is no savings as a producer organization, due to the non-payment of monthly dues
and contributions thereby is unable attend appropriately to individual or collective financial assistance
in times of need and cannot also access external support.
PFFF also have poor stakeholder relationship, being an informal group, they can relate with only a few
stakeholders and is limited to several opportunities.

73
CHAPTER SEVEN
7.0 RECOMMENDATIONS After analysing the catfish value chain and assessing producer organisation performance, the
information gathered from the field was used to recommend strategies for the commissioner and
problem owners of this research. These recommendations are as follows:
FOR CATFISH FARMERS
➢ Catfish farmers should Increasing value addition by drying, and packaging their catfish. This will
assist access trade and service agreements between the catfish farmers and the marketers.
➢ Catfish farmers should increase demand through alternative uses of the produce. Catfish
farmers should identify alternatives uses and users of catfish to meet market requirements
rather than for only food consumption such as for example catfish oil etc.
➢ Catfish farmers should build strong relationship with traders, it will enable quality and price
control for the buyers and cause the producers to meet up quality requirements for a secure
market.
Below is a strategy plan on how to begin implementation based on the recommendations using the
theory of change tool for the Port Harcourt fish farmer’s forum.
FOR PFFF SHORT TERM
➢ First PFFF needs to be formally registered considering that they have most of the requirements
as an informal cooperative to become formal as shown in Annex 4. Being formal will aid the
group to meet up with many of the expectations of the small scale catfish farmers and will grant
them the opportunity to access support from external sources: It will also encourage good
relationship with stakeholders.
This can be achieved by using this strategy plan below and followed up by other recommendations
stated below

74
➢ PFFF should Engage in bulk purchase of input to reduce costs
➢ Provide trainings for catfish farmers to educate them on the business to improve their
aquaculture skills and productivity.
➢ Facilitate a system that encourages financial management by promoting monthly cash
contributions by cooperative members to help build up staff capacity and provide revenue for
the group’s needs.
FOR PFFF LONG TERM
➢ PFFF can reduce transaction cost of the producers by making bulk supplies. Input such as feed
can be delivered in bulk to the farmers to reduce the cost of transportation.
➢ Organize Programs targeted to improve market opportunities. This can be achieved by Checking
quality and specifications for members and investing in product differentiation.
➢ PFFF can set up bulk storage for excess catfish that are not sold and cannot be kept longer
because of increase in the cost of production and further price increase. Products kept in the
storage can be processed which will increase the final price and reduce the risk of making losses.
➢ PFF can also encourage bulk sales and make contract with sales agent which will act as collectors
and cut off the middlemen “fish mongers”. This can control the price catfish will be sold as the
catfish farmers will be able to set the price for their catfish after harvest.
Relevance
Increase bargaining
Power
Access to incentives
economic and social
development
Efficiency
Increase capacity of
farmers.
High chances of
expanding
Effectiveness
Improve chain
coordination and
stakeholder
relationship
Sustainability
Better price and coordination.
Improve productivity.
Improved profit and livelihood
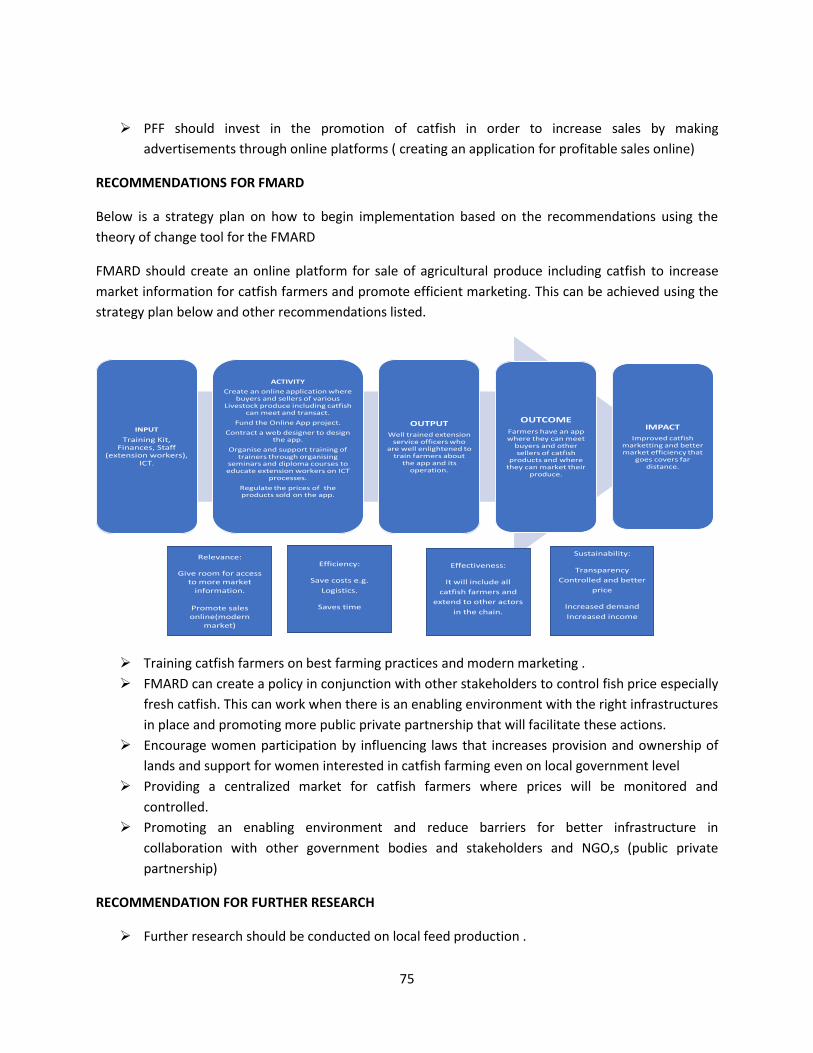
75
➢ PFF should invest in the promotion of catfish in order to increase sales by making
advertisements through online platforms ( creating an application for profitable sales online)
RECOMMENDATIONS FOR FMARD
Below is a strategy plan on how to begin implementation based on the recommendations using the
theory of change tool for the FMARD
FMARD should create an online platform for sale of agricultural produce including catfish to increase
market information for catfish farmers and promote efficient marketing. This can be achieved using the
strategy plan below and other recommendations listed.
➢ Training catfish farmers on best farming practices and modern marketing .
➢ FMARD can create a policy in conjunction with other stakeholders to control fish price especially
fresh catfish. This can work when there is an enabling environment with the right infrastructures
in place and promoting more public private partnership that will facilitate these actions.
➢ Encourage women participation by influencing laws that increases provision and ownership of
lands and support for women interested in catfish farming even on local government level
➢ Providing a centralized market for catfish farmers where prices will be monitored and
controlled.
➢ Promoting an enabling environment and reduce barriers for better infrastructure in
collaboration with other government bodies and stakeholders and NGO,s (public private
partnership)
RECOMMENDATION FOR FURTHER RESEARCH
➢ Further research should be conducted on local feed production .
INPUT
Training Kit, Finances, Staff
(extension workers), ICT.
ACTIVITY
Create an online application where buyers and sellers of various
Livestock produce including catfish can meet and transact.
Fund the Online App project.
Contract a web designer to design the app.
Organise and support training of trainers through organising
seminars and diploma courses to educate extension workers on ICT
processes.
Regulate the prices of the products sold on the app.
OUTPUT
Well trained extension service officers who
are well enlightened to train farmers about
the app and its operation.
OUTCOME
Farmers have an app where they can meet
buyers and other sellers of catfish
products and where they can market their
produce.
IMPACT
Improved catfish marketting and better market efficiency that
goes covers far distance.
Relevance:
Give room for access to more market
information.
Promote sales online(modern
market)
Efficiency:
Save costs e.g.
Logistics.
Saves time
Effectiveness:
It will include all
catfish farmers and
extend to other actors
in the chain.
Sustainability:
Transparency
Controlled and better
price
Increased demand
Increased income

76
References
Abbas, A. M. and Ahmed, B. (2016) Poverty Reduction Potential of Fish Farming in Ondo State, Nigeria.
Scientia Agriculture. [Online] Google Scholar. 14(3). pp. 306–313. Available from:
https://www.researchgate.net/deref/http%3A%2F%2Fdx.doi.org%2F10.15192%2FPSCP.SA.2016.14.3.30
6313?_sg%5B0%5D=DmXf6pykQGD5yX0GNaLCmLdY3L1Wv7EwXrTkv1kVyZn8XvbAcnDvxvyiBQ_4CmQft
mT13fy2iyUf0js2uXD1K12ywQ.7xN0wDX9uhN1JeTjhYpOkEpydx3EErg_2qR3IjTpsjIWXrB2GmYLXHO03U8
2Z3ntE3xnGUhvSXZruH769l0Uqw.[Accessed on: 25th August, 2020].
Adamu, M.T.,Biwe, E.R. and Suleh, y. g (2013).Socio-Economic Characteristics of Farmers under National
Fadama Development Project in Billiri Local Government Area of Gombe State, Nigeria. Pro-journal of
Agricultural Science research.[Online] Greeni 1(2). p7-21.Available from:
http://a.xueshu.baidu.com/usercenter/paper/show?paperid=47b35727a7a3c5e348a0a5735856120d
[Accessed on: 20th September, 2020]
Adebayo, O.T., Falayi, B.A. and Balogun, A.M., (2003).Comparative evaluation of some binding agents for
water stability and nutrient retention in aquaculture diets. Tropical agriculture.[Online] Google
Scholar.80(2), pp.128-131. Available from: https://agris.fao.org/agris-
search/search.do?recordID=US201300972746 [Accessed on: 15th October, 2020)
Adebo, G. M. and Toluwase, S. O. W. (2014) ‘Comparative analysis of fresh and smoked catfishmarketing
in Ekiti and Ondo States of Nigeria.’, Journal of Biology, Agriculture and Healthcare, 4(19),pp. 6–11.
Adelakun KM, Amali RP, Ogundiwin DI, Bakare K. 2015. Assessment of catfish farming in Osogbo
(Nigeria) and its environs.PeerJ PrePrints 3:e1108v1 https://doi.org/10.7287/peerj.preprints.1108v1
Adeyemo, R. (1986). Aquatic Commons.The power of fish trader associations in the marketing of fish in
Lagos State.[online] Greeni. Available at: http://aquaticcommons.org/3435/ [Accessed on: 14 October,
2020].
Ahmed, M.K., Halim, S. and Sultana, S.,( 2012) Participation of women in aquaculture in three coastal
districts of Bangladesh: Approaches toward sustainable livelihood.World Journal of Agricultural Sciences,
8(3), pp.253-268.
Ahmed, U.I.,Ying, L.,Bashir, M.K., Abid, M., Elahi, E. and Iqbal, M.A., (2016). Access to output market by
small farmers: The case of Punjab, Pakistan.Journal of Animal and Plant Sciences, 26(3), pp.787-793.
Ainembabazi John Herbert , Mugisha Johnny (2014) The Role of Farming Experience on the Adoption
of Agricultural Technologies: Evidence from Smallholder Farmers in Uganda.Journal of Development
Studies 50(5) DOI: 10.1080/00220388.2013.874556

77
Akinrotimi,O. A. Edun, O. M.,& Ukwe, O. I. K. (2018). Effects of anaesthetics on metabolic enzyme
activities in african catfish, Clarias gariepinus (Burchell, 1822).Journal of FisheriesSciences. com, 12(1),
22-28.
AKINROTIMI, O.A., ABU O.M.G., ARANYO, A.A. (2011) Transforming Aquaculture from Subsistence to
Commercial Level for Sustainable Development in Niger Delta Region of Nigeria.Journal of Agriculture
and Social Research (JASR) African Regional Aquaculture Centre/Nigeria Institute for Oceanography and
Marine Research. [Online] Greeni.vol. 11(2). p. 22-23. Available from:
https://www.ajol.info/index.php/jasr/article/view/78616 [Accessed on : 22nd August, 2020]
Alagoa, Y. et al. (2011) Aquaculture Value Chain Analysis in the Niger Delta.Nandeesa, P., Sanjeev, R. and
Hopper, R.S.S.,Farmer producer organizations.Farmers and markets.
Alagoa, Y. et al. (2011) Aquaculture Value Chain Analysis in the Niger Delta.
Anetekhai, M. A.(2013) ‘Catfish aquaculture industry assessment in Nigeria’, Inter-African Bureau
forAnimal Resources, African Union, (January), p. 84. doi: 10.13140/RG.2.2.31600.87047.
Anetekhai, M.A., Akin-Oriola, G.A., Aderinola, O.J. and Akintola, S.L., (2004). Steps ahead for aquaculture
development in Sub-Saharan Africa : the case of Nigeria. Aquaculture [Online] Greeni. 239(1-4), pp.237-
248. Available from :
https://www.researchgate.net/profile/Martins_Anetekhai/publication/223757227_Steps_ahead_for_aq
uaculture_development_in_Sub-Saharan_Africa_-
The_case_of_Nigeria/links/5a5c260c458515450278a91d/Steps-ahead-for-aquaculture-development-in-
Sub-Saharan-Africa-The-case-of-Nigeria.pdf. [Accessed on : 24th August, 2020]
Anoop, K.R., Sundar, K.G., Khan, B.A. and Lal, S., (2009). Common moorhen Gallinula chloropus in the
diet of the African catfish Clarias gariepinus in Keoladeo Ghana National Park, India. Indian Birds 5(2),
pp.22-23.
Atanda, A. N.(2009) Freshwater Fish Seed Resources in Nigeria.Fish Network.[Online] Greeni. pp. 26–57.
Available from: [Accessed on: 24th August, 2020]
Ayeloja AA, George Sodeeq and Adebisi GL, Fish Aqua J (2017). Fisheries and Aquaculture Journal. Price
Modulation Policy of Federal Government of Nigeria: Effects on Fish Production. [Online] Google Scholar
[8:1] Available from: https://research.wur.nl/en/publications/support-for-farmers-cooperatives-final-
report . [Accessed on: 25th September, 2020]
Ayuba, V. O. and Omeji, N. (2006) ‘Effect of insect infestation on shelf life of smoked dried fish.’, in
Proceedings of the 21st Annual Conference of the Fisheries Society of Nigeria. Calabar, Nigeria, pp.357-
359.
Ayuba, V.O. and Omeji, N.O. (2006). Effect of insect infestation on the shelf life of smoked dried fish.In
Proceedings of the 21st Annual Conference of the Fisheries Society of Nigeria (FISON), Calabar, Nigeria.

78
[Online] Google Scholar. pp. 357-359. Available from: https://agriscitech.eu/wp-
content/uploads/2020/03/15_AST_1_March_2020.pdf [Accessed on: 26th August, 2020]
Bijman, J., Iliopoulos, C., Poppe, K. J., Gijselinckx, C., Hagedorn, K., Hanisch, M., Hendrikse, G. W. J., Kühl,
R., Ollila, P., Pyykkönen, P., & van der Sangen, G. (2012). Support for Farmers' Cooperatives : executive
summary. Wageningen UR. [Online] Greeni. Available from: https://edepot.wur.nl/245007 [Accessed
on: 24th August, 2020]
Bijman, J., Iliopoulos, C., Poppe, K.J., Gijselinckx, C., Hagedorn, K., Hanisch, M., Hendrikse, G.W., Kühl,
R.,Ollila, P., Pyykkönen, P. and van der Sangen, G., 2012. Support for farmers' cooperatives.
Wageningen UR
Bino. J.P, Radhika R. (2016) Problems of Fish Marketing – With Special Reference to Kanyakumari
District. Journal of Chemical and Pharmaceutical Sciences. [Online] Greeni. ISSN: 0974-2115. Available
from:
https://www.jchps.com/issues/Volume%209_Issue%201/jchps%209(1)%2093%20Jasbin%20Bino%2043
0-433.pdf. [Accessed on: 21st August, 2020]
Bond, J.K., Carter, C.A. and Sexton, R.J., 2009. A study in cooperative failure: Lessons from the Rice
Growers Association of California. Journal of Cooperatives. [Online] Greeni. 23(1142-2016-92775),
pp.71-86. Available from: https://ageconsearch.umn.edu/record/56929/ [Accessed on: 18th August,
2020]
Borch, S. M. (2011). A Guide to Value Chain Guides. Danish Development Research Network (DDRN).
[Online] Greeni. pp. 24–25. Available from: http://www.condiv.dk/gvcmeta/report-gvc-metaguide-
ddrn-may2011.pdf. [Accessed on: 24th August, 2020]
Brugere, C. and M. Williams. (2017). Profile: Women in Aquaculture.
https://genderaquafish.org/portfolio/women-in-aquaculture/
C Martin Webber, Labaste, P. and World Bank (2010). Building competitiveness in Africa’s agriculture : a
guide to value chain concepts and applications. Washington, Dc: World Bank.
Chenyambuga, S. W., Nazael, A. M. and Berno, V. M. (2012). Management and Value Chain of Nile
Tilapia Cultured In Ponds of Small-Scale Farmers In Morogoro Region, Tanzania. International Institute of
Fisheries Economics and Trade(IIFET). [Online] Google Scholar. Available from:
http://hdl.handle.net/1957/37878. [Accessed on: 20th August, 2020]
Chowdhury, M.M.H. and Quaddus, M.A.,( 2016). A multi-phased QFD based optimization approach to
sustainable service design. International Journal of Production Economics, 171, pp.165-178.https://doi-
org.hvhl.idm.oclc.org/10.1016/j.ijpe.2015.09.023
Cong, Y., Zheng, Y. (2017) Study on Operation Mode of Agricultural Supply Chain in WeChat Business
Environment. Journal of Service Science and Management. Vol. 10 No.3.

79
Dasgupta, B. (2004) Role of Commodity Futures Market in Spot Price Stabilization, Production and
Inventory decisions With Reference to India. JSTOR Vol. 39, No. 2. PP. 315-325.
Deekor Holly (2019 ) Non-Formal Education Needs Of Rural Farmers For Improved Participation In
Community Development In Rivers State
Formal_Education_Needs_Of_Rural_Farmers_For_Improved_Participation_In_Community_Developmen
t_In_Rivers_State Research 7(1):110-11. ISSN: 2360-8978. [accessed Oct 21 2020].
Diaz B. A . Lozano, S. & Palacio, A.(2017) Effects of Dynamic Pricing of Perishable Products on Revenue
and Waste. Applied Mathematical Modelling. Vol. 45 PP. 148-164.
Dickson, M., Nasr-Allah, A., Kenawy, D. and Kruijssen, F., 2016. Increasing fish farm profitability through
aquaculture best management practice training in Egypt. Aquaculture, 465, pp.172-178.
Dixie, G. and Ohen, S. (2010) Nigerian Aquaculture Marketing Study.Dutsin-Ma Local GovernmentArea,
Katsina State, Nigeria.’ PAT, 10(2), pp. 131-144.
Egwui, P. C. (2001) ‘Yields of the African catfish, Clarias gariepinus (Burchell, from a low
inputhomesteadfish pond concrete pond. Umudike, Abia State. Nigeria’, Agricultural Journal, 38(1),
pp.170–175.
Elbakidze, M., P. K. Angelstam, C. Sandström, and R. Axelsson. (2010). Multi-stakeholder collaboration in
Russian and Swedish Model Forest initiatives: adaptive governance toward sustainable forest
management? Ecology and Society 15(2): 14. [online] URL:
http://www.ecologyandsociety.org/vol15/iss2/art14/
FAO (2013) A value-chain analysis of international fish trade and food security with an
impactassessment of the small-scale sector.
FAO (2014) Small holder First buyer Inclusive Business Models Expert Workshop Report. Rome,
Italy.Available at: www.fao.org/publications (Accessed: 22 June 2020).
FAO (2017) Fishery and Aquaculture Country Profiles; the Federal Republic of Nigeria. [Online] Available
from: http://www.fao.org/fishery/facp/NGA/en#pageSection2. [Accessed: 3rd June 2020].
FMARD.(2016) Building on the Successes of the ATA, Closing Key Gaps. Policy and Strategy Document.
[Online] Google Scholar. Available from: https://fscluster.org/sites/default/files/documents/2016-
nigeria-agric-sector-policy-roadmap_june-15-2016_final1.pdf. [Accessed: 31st June 2020].
Freeman, S., Varey, R. (1997)Women Communicators in the Workplace: Natural Born Marketers?
Marketing Intelligence & Planning. Vol 15 Issue 7.
Gbigbi, Theophilus Miebi, Felix Odemero Achoja, and Sunny O. Temile. (2019)"Cooperative Funding as
Driver of Aquaculture Development: Evidence from Nigeria." European Journal of Social Sciences 58, no.
2 (2019): 124-133.

80
George Matiya, Yoshikazu Wakabayashi and Naruhito Takenouchi , 2005.Factors Influencing the Prices
of Fish in Central Region of Malawi and its Implications on the Development of Aquaculture in Malawi.
Journal of Applied Sciences, 5: 1424-1429.DOI: 10.3923/jas.2005.1424.1429
URL:https://scialert.net/abstract/?doi=jas.2005.1424.1429
George, F.O.A., Olaoye, O.J., Akande, O.P. and Oghobase, R.R., (2010). Determinants of aquaculture fish
seed production and development in Ogun State, Nigeria.Journal of Sustainable Development in Africa.
[Online] Greeni. 12(8), pp.22-34. Available from: https://thefishsite.com/articles/determinants-of-
aquaculture-fish-seed-production-and-development-in-ogun-state-nigeria [Accessed on: 25th July, 2020]
Gereffi, G., Humphrey, J.,& Sturgeon, T. (2005).The governance of global value chains. Review of
international political economy, 12(1), 78-104.
Grasuis, J., (2018). Joint ownership by farmers and investors in the agri-food industry: an exploratory
study of the limited cooperative association.Agricultural and Food Economics. [Online] Greeni. 6(1),
p.24. Available from: 10.1186/s40100-018-0118-0 [Accessed on: 28th July, 2020]
Guancheng Guo, Qiyu Wen, Jingjuan Zhu, (2015)The Impact of Aging Agricultural Labor Population on
Farmland Output: From the Perspective of Farmer Preferences", Mathematical Problems in
Engineering, vol. 2015, Article groups in Vietnam. Journal of Co-operative Organization and
Management vol 4, pp 31–41 accessed 4th
ID 730618, 7 pages, 2015. https://doi.org/10.1155/2015/730618
Hartatri, D. F. S. (2016). Influence of quality improvement activities and direct selling through mediated
partnership model on supply chain, farm-gate price and Indonesian households specialty coffee farmers’
income. Pelita Perkebunan (a Coffee and Cocoa Research Journal), 32(1), 52-66.
https://www.ajol.info/index.php/jasr/article/view/78616. [Accessed 24 th April 2020].
Hupe, P., Hill, M. and Nangia, M., (2014). Studying implementation beyond deficit analysis: The top-
down view reconsidered. Public Policy and Administration, 29(2), pp.145-163.Impact of farmer
education on farm productivity under varying technologies: case of paddy growers in India
Ibemere I.F.and Ezeano,C.I (2014).Status of Fish Farming in Rivers State, Nigeria.Journal of Fisheries and
Aquatic Science. [Online] Greeni. 9: 321-329. Available from: 10.3923/jfas.2014.321.329. [Accessed on:
28th August, 2020]
Ica.coop.(2019). What is a cooperative? | ICA. [Online] Available at:
https://www.ica.coop/en/cooperatives/what-is-a-cooperative.
Issa, F.O., Abdulazeez, M.O., Kezi, D.M., Dare, J.S. and Umar, R. (2014).Profitability analysis of small-scale
catfish farming in Kaduna State, Nigeria. Journal of Agricultural Extension and Rural Development.
Academic Journal.[Online] Greeni. 6(8), pp.267–273. Available from:

81
https://academicjournals.org/article/article1405614692_Issa%20et%20al.pdf . [Accessed on: 18th JULY,
2020]
Jackman D. and Breeze, J. A Guide to inclusive business .international business leaders forum
Jennifer Keeling Bond, Colin A. Carter Richard, J. Sexton (2009) A Study in Cooperative Failure: Lessons
from the Rice Growers Association of California. Available A Study in Cooperative Failure Lessons from
the Rice Growers Association of California.accessed Jun 24 2020.
Jennifer Keeling Bond, Colin A. Carter Richard, J. Sexton (2009) A Study in Cooperative Failure:
Lessonsfrom the Rice Growers Association of California. Available A Study in Cooperative Failure Lessons
from the Rice Growers Association of California.accessed Jun 24 2020.
KIT, Faida Mali and IIRR, 2006. Chain Empowerment: Supporting African Farmers to Develop Markets.
Amsterdam: Royal Tropical InstiuteFaida Market Link, Arusha; and International Institute of Rual
Reconstruction, Nairobi.
Kling, C.L., Mackie, C.D.,National Academies of Sciences, Engineering, and Medicine (U.S.). Committee
On National Statistics and National Academies Of Sciences, Engineering, And Medicine (U.S.) Division of
Behavioural And Social Sciences And Education (2019).Improving data collection and measurement of
complex farms. Washington, Dc: The National Academies Press.
Kumaran, M., D. Deboral Vimala, V. S. Chandrasekaran, M. Alagappan, and S. Raja.(2012) "Extension
approach for an effective fisheries and aquaculture extension service in India." The Journal of
Agricultural Education and Extension 18, no. 3 (2012): 247-267.
Lawson, T.,(2013) Fundamentals of Aquacultural Engineering.Springer Science & Business Media.
Lee, j G. Gereffi, J. BeauvaisGlobal value chains and agrifood standards: challenges and possibilities for
smallholders in developing countries Proc. Natl. Acad. Sci., 109 (2012), pp. 12326-12331
https://doi.org/10.1073/pnas.0913714108
Lundy M, Alexandra Amrein, Jhon Jairo Hurtado, Gertjan Becx, Nancy Zamierowski, Fernando Rodríguez,
Erika Eliana Mosquera. (2014). A participatory guide to business models that link smallholders to
markets. LINK methodology: Centro Internacional de Agricultura Tropical (CIAT). [Online] Greeni. (CIAT
Publication No. 398) ISBN 978-958-694-114-3 pp179. Available from:
https://hdl.handle.net/10568/49606 . [Accessed on 29th September, 2020]
Marbaniang E. & Kharumnuid P. (2019) Farmer Producer Organization (FPO). The need of the hour:
AGRICULTURE & FOOD E-Newsletter. [Online] Greeni. Volume 1, Issue 12. Available from:
https://www.researchgate.net/publication/339850687. [Accessed on: 25th September, 2020].
Mayer Liza( 2019) The challenge of oversupply for US catfish farmers

82
Mitchell T.( 2011)Middlemen, Bargaining and Price Information: Is Knowledge Power . Accesses from
[https://www.tcd.ie/Economics/assets/pdf/JMPTara_Mitchell1.pdf]
Mitchell, J., Keane, J. and Coles, C. (2009).Trading up: How a value chain approach can benefit the rural
poor. London: COPLA Global: Overseas Development Institute (p.82) [Online] Greeni. Available at:
https://www.odi.org/sites/odi.org.uk/files/odi-assets/publications-opinion-files/5656.pdf [Accessed on:
6th October, 2020].
Mukandekezi, A., 2014. Which marketing strategies can lead to a higher value share in the mushroom
value chain?. In: s.l.:s.n., p. 93.
NCDC (2020) NCDC Coronavirus COVID-19 Microsite, Nnamdi, Onyirioha. Available
at:https://covid19.ncdc.gov.ng/ (Accessed: 3 June 2020).
Nwabunike, M. O. (2015) ‘Constraints of Fish Marketing in Abakaliki Metropolis’, InternationalJournal of
Fisheries and Aquatic Studies, 2(4), pp. 337–344.
Nzevu, J.M., Amwata, D.A. and Mutua, A.K., 2018.The contribution of fish farming to household
wellbeing of Fish Farmers in Kitui Central Sub-County, Kitui County.Journal of Agriculture and Veterinary
Science, 11, pp.69-76.
Nzevu, J.M., Amwata, D.A. and Mutua, A.K., 2018.The contribution of fish farming to
householdwellbeing of Fish Farmers in Kitui Central Sub-County, Kitui County.Journal of Agriculture and
VeterinaryScience, 11, pp.69-76.
Odebiyi, O. C. et al. (2013)‘Value-chain analysis for coastal fisheries development in Nigeria’,
GlobalJournal of Science Frontier Research Agriculture and Veterinary, 13(11), pp. 6–15.
Odunze, E. et al. (2019) The future of livestock in Opportunities and challenges in the face ofuncertainty.
Available at: http://www.wipo.int/amc/en/mediation/rules (Accessed: 27 March 2020).
Oduro-Ofori Eric, Aboagye Anokye Prince and Acquaye Naa Aku Elfreda 2014 Effects of education on the
agricultural productivity of farmers in the offinso municipality ISSN: 2230-9926 International Journal of
Development Research Vol. 4, Issue, 9, pp. 1951-1960.
Ofuoku, A. U., Emah, G. N., & Itedjere, A. B. (2008).Information utilization among rural fish farmers in
central agricultural zone of Delta State, Nigeria. World Journal of Agricultural Sciences, 4(5), 558-564.
Okaeme A.N,(1992).Fish Mongers and Public Awareness on Fish-Food Hygiene in Nigeria Research
Article [Online] Greeni. Available from: https://doi.org/10.1177/146642409211200402. [Accessed on:
28th September, 2020]
Olajide and Omonona, B. T. (2019) ‘PRODUCTIVITY OF CATFISH PRODUCTION IN OSUN STATE ,NIGERIA’,
international Jourmal of Agricultural Research, Sustainability, and Food sufficiency,6(04), pp. 409–420.

83
Olajide Oyebisi, O. and Omonona, B. T. (2019) ‘PRODUCTIVITY OF CATFISH PRODUCTION IN OSUN STATE
NIGERIA’, international Jourmal of Agricultural Research, Sustainability, and Food sufficiency,6(04), pp.
409–420.
Olajide Oyebisi, O. and Omonona, B. T. (2019) ‘PRODUCTIVITY OF CATFISH PRODUCTION IN OSUN
STATENIGERIA’, international Jourmal of Agricultural Research, Sustainability, and Food
sufficiency,6(04), pp.409–420.
Oparinde, L. O. and Ojo, S. O. (2014) ‘Structural Performance of Artisanal Fish Marketing in OndoState,
Nigeria.’, ” American Journal of Rural Development, 2(1), pp. 1–7.
Oparinde, L.O., Amos, T.T. and Adeseluka, M., 2017. Influence of agricultural credit guarantee scheme
fund (ACGSF) on fishery development in Nigeria. Scientific Papers Series Management, Economic
Engineering in Agriculture and Rural Development, 17(1), pp.323-332.
Oyieng E P, Charo H K, Kahi A K and Ojango J M K 2013: Characterization of fish production and
marketing practices under small-holder fish farming systems of Eastern Kenya. Livestock Research for
Rural Development.Volume 25, Article #32. Retrieved July 8, 2020, from http://ww
w.lrrd.org/lrrd25/2/oyie25032.htm
Oyieng E P, Charo H K, Kahi A K and Ojango J M K 2013: Characterization of fish production and
marketing practices under small-holder fish farming systems of Eastern Kenya. Livestock Research for
Rural Development.Volume 25, Article #32. Retrieved July 8, 2020, from
http://www.lrrd.org/lrrd25/2/oyie25032.htm
Paltasingh Kirtti Ranjan , Phanindra Goyari (2018) Farmer Education and Farm Productivity Agricultural
and Food Economics 6(1)DOI: 10.1186/s40100-018-0101-9
Pauly, D. et al. (2002) ‘Towards Sustainability in world Fisheries’, Nature, 418, pp. 689–95.Presidential
Forum on Fisheries and Agriculture (2005) Status and opportunities. Abuja, Nigeria.
Pauly, D. et al. (2002) ‘Towards Sustainability in world Fisheries’, Nature, 418, pp. 689–
95.PresidentialForum on Fisheries and Agriculture (2005) Status and opportunities. Abuja, Nigeria.
Penrose-Buckley C. (2007). Producer Organisations: A Guide to Developing Collective Rural Enterprises.
[Online] Greeni. ISBN 978-085598-575-2. United Kingdom: Oxfam GB. Available from:
https://oxfamilibrary.openrepository.com/bitstream/handle/10546/115532/bk-producer-organisations-
300807-en.pdf;jsessionid=380985BEB6806AEDE60313160109DB4A?sequence=8 . [Accessed on 19th
September, 2020]
Peter G.M. van der Heijden.(2020)National Aquaculture Sector Overview. Netherlands. National
Aquaculture Sector Overview Fact Sheets. In: FAO Fisheries Division [online]. Rome.[Cited 21 October
2020].

84
Plecher, 2020 Statistica. . Nigeria: Total population from 2020 to 2024
https://www.statista.com/statistics/382264/total-population-of-nigeria/
Rahman Ahmadi, Emmy Sri Mahreda (2019) Marketing channels of marine fish in Banjarmasin fishing
port, Indonesia International Journal of Fisheries and Aquatic Research ISSN: 2456-7248; Volume 4;
Issue 3; Page No. 15-22 www.fishjournals.com
Rayasawath, C. (2018) Factors Affecting the Household Succession in Agricultural Occupation in Nakhon
Ratchasima Province, Thailand. Agriculture Vol. 8 Issue 7.
Reuver, D. et al. (2013) ‘“Business model roadmapping: A practical approach to come from anexisting to
a desired business model”.’, International Jounral of Innovation Management, 17(1).
Riisgaard, L., Bolwig, S., Ponte, S., Du Toit, A., Halberg, N. and Matose, F., (2010). Integrating poverty and
environmental concerns into value‐chain analysis: a strategic framework and practical
guide. Development policy review, 28(2), pp.195-216.
Roduner, D., 2007. Donor interventions in value chain development (Working paper). Switzerland: VCRD
CoP.
Rose, D., Parker, C., Fodey, J., Park, C., Sutherland, W., & Dicks, L. (2018). Involving stakeholders in
agricultural decision support systems: Improving user-centred design. International Journal of
Agricultural Management, 6 (3-4), 80-89. https://doi.org/10.5836/ijam/2017-06-80
Rural Poor. In: s.l.:COPLA, p. 82
Sathiadhas, R and Kanagam, A (2015) Distribution problems and marketing management of marine
fisheries in India.
Sathivel, S., Bechtel, P.J., Babbitt, J., Smiley, S., Crapo, C., Reppond, K.D. and Prinyawiwatkul, W.( 2003).
Biochemical and functional properties of herring (Clupea harengus) by product hydrolysates. Journal of
Food Science, 68(7), pp.2196-2200.
Schöll k a,, André Markemanna, Bekele Megersa b, Regina Birner c,Anne Valle Záratea (2016)Impact of
Schrader, T., Benthum, L. van, Kormelinck, A.G., Wennink, B. and Janssen, I. (2015). Agri Pro Focus. It
takes Two to Trade: Understanding and improving farmer–firm relations in Africa. [online] Greeni.
Available from: https://research.wur.nl/en/publications/it-takes-two-to-trade-understanding-and-
improving-farmerfirm-rela . [Accessed on: 14 October, 2020].
Shoko, C. and Mutanga, O., 2017.Examining the strength of the newly-launched Sentinel 2 MSI sensor in
detecting and discriminating subtle differences between C3 and C4 grass species. ISPRS Journal of
Photogrammetry and Remote Sensing, 129, pp.32-40.

85
Siddique AMB (2015) The Role of Cooperative Society for Marketing Agriculture Producs in Bangladesh
Global Journal of Management and Business Research: EMarketing Volume 15 Issue 5 Version 1.0 Year
2015Publisher: Global Journals Inc. (USA)Online ISSN: 2249-4588 & Print ISSN: 0975-5853
Tasnoova, S., Iqbal, K.M., Iwamoto, I. and Haque, M., (2017). Livelihoods of the people involved in
pangasiid catfish (Pangasius hypophthalmus) farming in Mymensingh, Bangladesh. World Sustainable
Development Outlook 2007: Knowledge Management and Sustainable Development in the 21st Century,
p.241
Tauer Loren W. (2017) Working Paper Dyson School of Applied Economics and Management Cornell
University, Ithaca, New York 14853-7801 USA Farmer Productivity By Age Over Eight U.S. Census Years
The Fish Site. (2011) Scarcity & Price Fluctuations Threaten Food Supply.
Tiri, G. D. et al. (2014) ‘Assessment of the Performance and Barriers to Small-Scale Fish Marketing in
Toledano, J. R. (2018) Private Property Concerning Digitized Cultural Goods: Artificial Scarcity and
Appropriation through Reproduction.The Journal of Arts Management, Law and Society. Vol. 48 Issue 5.
Ton G, Jos Bijman, Joost Oorthuizen (2007) Producer organisations and market chains
facilitatingtrajectories of change I developing countries.
Ton, G., Bijman, J., Oorthuizen, J. (2007) Producer Organizations and Market Chains: Facilitating
Trajectories of Change in Developing Countries. Wageningen Academic Publishers.
Ugwumba, C.O.A. and Chukwuji, C.O., (2010). The economics of catfish production in Anambra State,
Nigeria: a profit function approach. Journal of Agriculture and Social Sciences. [Online] Greeni. 6(4),
pp.105-109. Available from: http://www.fspublishers.org/published_papers/71507_..pdf [Accessed on:
18th June, 2020]
UNIDO (2009) Agro-value Chain Analysis and Development, A Staff Working Paper: The
UNIDOApproach,. Vienna, Austria.
Webber, C. M & Labaste, P. (2010).Building Competitiveness in Africa's Agriculture. A Guide to Value
Chain Concepts and Applications. Agriculture and Rural Development. License: CC BY 3.0 IGO.
Washington, Dc: World Bank. [Online] Greeni. Available from:
https://openknowledge.worldbank.org/handle/10986/2401 . [Accessed on: 25th September, 2020]
Webber, M. and Labaste, P.(2010) Building Competitiveness in Africa’s Agriculture: a guide to valueChain
concepts and applications. Washington, DC, USA.
Woodhill, A.J., 2008. Shaping behaviour: how institutions evolve. The broker, 2008(10), pp.4-8.

86
Annexes ANNEX 1: PO ASSESSMENT USING MIDCA
Internal organization
No Type Concept Indicator CriteriaMax.
Score
Comments/ Observations/
Information Score
1 Staff capacity 25 7
1.1 O Management Staff (office)
There is sufficient management staff
and they are well trained for their tasks
and responsibilities.
Range: Definitely Yes=5
Definitely No=05
there are trained staff but not
sufficient for the organisational
responsibilities
2
1.2 O Technical Staff (field)
There is sufficient technical staff and
they are well trained for their tasks and
responsibilities.
Range: Definitely Yes=5
Definitely No=05
there are technical staff but not
sufficient for the task 2
1.3 O Technical staff coverageThe needs of all producers in terms of
Field Technical Assistance are covered.
Range: Definitely Yes=5
Definitely No=05
field technical assistance are not
met due to insufficient staff 1
1.4 OOrganizational (operational) structure
evaluation
Does the current organizational
structure works?
Range: Definitely Yes=5
Definitely No=05 works but not very effective 1
1.5 O Governance structure evaluationIs the current governance structure
sufficient and does it perform well?
Range: Definitely Yes=5
Definitely No=05
governance structure is not
sufficient 1
2 Financial management 35 8
2.1 F Trade Finance Needs Percentage of financial needs covered. Percentage (%) * 5 5unable to meet members financial
needs 0
2.2 F Access to local financial resources
The organization has access to local
bank/financial institutions to cover their
financial needs.
Yes=5, No= 0 5 unable to access loans from banks 0
2.3 FOrganized and up-to date administrative
processes, audited statements
Financial information of the last three
years is available and auditedYes=5, No=0 5 poor record keeping 2
2.4 F Financial Performance: solvency Good score on solvency ratio, above
30%
Above 30%=5, less than
30% is 05 low solvency 2
2.5 F Financial performance: liquidity ratioGood score on liquidity ratio, every
month is above 1.Yes=5, No= 0 5 low liquidity ratio 1
2.6 FFinancial Independency between
Departments
Each organ, committee, department
operates with its own budget and/or
financial resources.
Yes=5, No= 0 5
all departments depend on each other
1
2.7 F Funding SourcesThe organisation's dependency on
sources of grant funding.
% of operations costs
covered by donations
1/(%*5)
5 the organisation do not depend on
grants but have the need to
2
3 Long-term perspective 15 12
3.1 F Vision and Mission There is a written declaration of the
organization's vision and mission. Yes=5, No= 0 5
very clear vision and mission to
stated 4
3.2 F Long term strategy There is a Long term strategic plan Yes=5, No=0 5 has a clear long term plan 4
2.7 Strategic long term financial vision.
The organization has a clear vision on
building capital and becoming
financially self-sufficient in the long
term.
Range: Definitely Yes=5
Definitely No=05
Members work independently with
financial related issues 3
Maximum score 75 Total score obtained 27
36%

87
ANNEX 1B
ANNEX 1C
Market
No Type Concept Indicator CriteriaMax.
Score
Comments/ Observations/
Information Score
1 Sales 25 15
1.1 F Average sales priceAverage sales price received for catfish
sold increases
Increased: 5 points,
remained the same: 3
points, lowered: 0
points.
5average price is not significantly high due
to other institutional challenges 3
1.2 O Marketing activities
The organization efficiently executes
marketing activities to broaden the client
portfolio.
Range:
Definitely Yes=5
Definitely No=0
5organisation has a medium to advertise
products for producers 4
1.3 O Flow Harvest - Sales
Time from harvest to sales is the
appropiate and allows the organization to
function properly and fulfill obligations to
internal and external clients.
Range:
Definitely Yes=5
Definitely No=0
5organisation does not partake so much
with harvest 1
1.4 O Diversified product offer
The organizations offers a sufficiently
diversified product range (catfish qualities
and/or different products) so that the
organization is not overly dependant on
one single product.
Range:
Definitely Yes=5
Definitely No=0
5
organisation offers training on production,
farm management and feed management
as well as sale of fish feed
3
1.5 O Diversified client base
The organizations has a sufficiently
diversified client portfolio so that they are
not overly dependant on a few clients.
Range:
Definitely Yes=5
Definitely No=0
5 organisation treats all clents equally 4
2 Relations with stakeholders 25 11
2.1 O Producers 5good relationship with producers 4
2.2 O Clients 5relates very well with clients to promote the
brand 4
2.3 O Financers, 5cannot access funds from banks as an
organisation 1
2.4 O Supporters (NGO's) 5 unable to get support from supporters 0
2.5 O Community 5 relates well with community 2
Maximum score 50 Total score obtained 26
52%
What is the relationship of the
organisastion with each of the parties.
To be evaluated in terms of constructive
cooperation, transparancy, trust, mutual
respect, win-win, long term.
Range (per category):
Very strong=5
Improvements needed
urgently=0

88
Production
No Type Concept Indicator CriteriaMax.
Score
Comments/Obs
ervations/
Information
Score
1 Membership Base 15 8
1.1 FActive Membership % of active members out of total members
Percentage (%) * 5 5high percentage of
active members 4
1.2 F Certified members % of members that are certified Percentage (%) * 5 5 no proper certification 1
1.3 O Actions to increase membership
The actions to increase (active) membership are the
appropriate and have resulted in increments of active
membership.
Range: Def yes, 5 Def no=0 5
keeping members
informed and solving
problems 3
2 The Product 28 17
2.1F Production capacity Productivity per pond is increasing
Increased: 5 points, remained the same: 3
points, lowered: 0 points.5
organisation is
involved in training 4
2.2
F Average Price paid to producers Average price paid to members increasesIncreased: 5 points, remained the same: 3
points, lowered: 0 points.3
cooperative support
via trainings improves
farm management 3
2.3 F Quality of Product. % feed and catfish sold as non-conventionalIncreased: 5 points, remained the same: 3
points, lowered: 0 points.5
good qua;ity
produced
3
2.4 O Quality Management A good Quality Management System (QMS) is in place
and guarantees good quality catfish.
No QMS=0 points; QMS in place, but not able to
measure improvement=3 points; QMS in place,
constant monitoring of quality and measurment
of improvement= 5 points
5
no quality
management system,
members produce
individuallybut good
quality is encouraged
1
2.5 F ProductivityAverage production per pond compared to averages in
the area (community). More=5, same=3 less:0 5
a little increase in
productivity
4
2.6 O Environmental measures
The organization has a written plan and implements
measures and techniques to minimize the impact of its
operations on the environment.
Range: Def yes, 5 Def no=0 5
water management
is encouraged by the
organisation
2
3 Services 11 8
3.1 FAdditional value offered to
producers
Extra price producers received in comparison to local
market/commercialization conditions. More=5, same=3 less:0 3 quality feed delivered
to producers
2
3.2 F Commercialization services% of catfish produced by the producers that is sold via
the organization. Percentage (%) * 5 4
marketing is
encouraged through
information mediums
3
3.3 O Quality of Services Evaluation
Internal clients (producers) are satisfied with the
services provided by the organization (quality and
range).
Range: Completely satisfied = 5 points
Definitely not satisfied= 0 points 4 services are rated
fairly by members
3
Maximum score 54Total score
obtained33
61%

89
ANNEX 1D
Organization:
Max Score %
Membership Base 15 8 53%
The Product 28 17 61%
The Services 11 8 73%
Staff Capacity 25 7 28%
Financial Management 35 8 23%
Long Term Perspective 15 12 80%
Sales 25 15 60%
Relationships 25 11 44%
Total 179 86 48%
Production
Internal
Organization
Market
Port Harcourt fish farmers forum

90
ANNEX 2A
CHECK LIST FOR INTERVIEW key informants/ cooperative leaders
• Introduction
• Background and experience in catfish farming
• Ownership and leadership (How are officials selected)
• External financial support
• Firm size (What categories of farmers are members of the organization) for example small. Medium
and large-scale farmers
• How is information passed to members?
• Firm assets
• Staff
• Risk taken as a cooperative
• Farmers knowledge about firms’ activities
• Organizational level
• Membership participation
• Challenges working with farmers
• Production challenges
• Marketing challenges
• Perception about POS
• Working capacity of POS
• Opportunities
• Strategies for marketing
ANNEX 2B
CHECKLIST FOR PROCESSORS
• Market experience
• Purchase prices
• Sales prices
• Measurement
• Location (distance from purchase point and to sales point)
• Transportation challenges
• Processing challenges
• Storage
• Additional costs
ANNEX 2C
Checklist for wholesalers/ retailers
• Market experience

91
• Purchase prices
• Sales prices
• Measurement
• Location (distance from purchase point and to sales point)
• Transportation challenges
• Storage
• Additional costs
ANNEX 2D
Check list for Port Harcourt fish farmer’s members for PO assessment (Midca)
➢ How many farmers are active?
➢ Are the farmers certified?
➢ Production challenges
➢ Marketing challenges
➢ Are more farmers joining?
➢ What are the group’s activities?
➢ Have you noticed difference in production since you joined?
➢ Have you improved in farming since you joined?
➢ Is there a chance in your income?
➢ Do you produce more catfish?
➢ Do you receive trainings on quality?
➢ Are there penalties for not producing good quality?
➢ Do you produce more than non-members?
➢ Are there policies to minimize environmental hazards?
➢ Do you sell fish through the group?
➢ Are you satisfied with the group’s performance?

92
ANNEX 3
Survey for catfish farmers
Dear catfish farmer,
Please take out 7 minutes to fill in the survey for small scale catfish farmers in Nchia Eleme L.G.A of
Rivers State for my thesis research to assess producer organization and linking small scale catfish
farmers for more profitable marketing. Thank you.
Sotonye Mangibo.
1. What is your gender*
Male Female 2. How old are you? Below 30 years 30-40 years 41-50 years 51 years and above
3. What is your education level? None Primary level Secondary level Tertiary level
4. How many people do you live with? (Put only one number) ………………………..
5. Is catfish farming your primary occupation? Yes No
6. Do you have other sources of income? Yes No
7. What is your income per month/pond from fish farming? (In Naira) …………………..
8. How long have you been in the catfish farming business? Below 1 year 1-3 years 4-6 years 7-10 years Above 10 years
9. What type of pond do you use? Concrete pond

93
Big gee pee tanks Small gee pee Earthen ponds Others
10. Are you a member of any fish farmer organization/group? Yes No
11. If no, why have you not joined? ..................................
12. If yes, what are the benefits you get from the organization/group? Financial support Extension services Input supplies (Feed & fingerlings) Catfish marketing No benefit
13. How do you sell your catfish? At farm gate I take to the market Through cooperative I supply to customers
14. What are the transportation issues affecting your business? Far distance to market Bad roads Losses during transporting Expensive transport
15. What are the production challenges you have? Poor species High death rate Stunted growth Expensive feed
16. What problems affect you the most? No extension visits No electricity Low farm gate price Insecurity Poor water supply
17. Where do you mainly buy feed from? Open market Through cooperative

94
Through government outlets Private dealers
18. How do you promote your business? Word of mouth Phone calls Social media Through cooperative
19. How do you get fingerlings? Through cooperative Government outlets Private input dealers Open market
20. How many fingerlings do you stock per pond at 2 months? ……………………
21. How much do you sell 1kg of fresh fish? .............................
22. Rate your income from catfish farming? Very good Good Fair Bad Very bad
23. How do you get information on price? Co-farmers Buyers Cooperative Relatives

95
24. What determines the price of fish? Color Size Specie Freshness
25 Do you sell only fresh catfish? Yes No
26. What kind of fish feed do you use? Foreign feed Local feed Both foreign and local feed
27. Who do you often sell directly to? Wholesalers Retailers Hotels and restaurant Consumers
28. Do you have a contract with selling to the same buyers? Yes No
29. Do you get extension services? Yes No
30. How is the price determined at the point of sale? Weighing by scale Weighing by estimation Quantity to be bought Relationship with buyer
31. Are you satisfied with the price of your catfish? Very satisfied Moderately satisfied Dissatisfied

96
ANNEX 4
Building blocks for formalinizing informal producer organization.
The following questions aim to enable members of Port Harcourt fish farmers forum evaluate a number
of significant building blocks that contribute to a strong PO foundation.
From box 1-5 with 1 means least agree and 5 means most agreed statement
1 Basic motivation 1 2 3 4 5
• Is the participants’ main motivation for forming or joining the group the
desire to solve their own marketing problems or to access external assistance?
4
• Do producers view group formation as a condition for accessing external
assistance or resources?
3
• Can the producers provide a clear explanation of why collective action is
necessary and how it will improve their market access?
3
• Do the producers have a shared experience of exploitation in the market,
which they want to overcome through collective action?
2
2 Sense of ownership
• Do the producers want external assistance to support their own efforts to
address their problems or do they expect external help to solve their problems
for them?
5
• Do the producers talk about the proposed PO as their own idea and their own
organization, even if it was first suggested by the FA, or do they talk about it as
the FA’s initiative and organization?
3
• Are the producers interested in discussing how the PO should be organized,
what activities they should undertake, and who should be members, or do such
discussions have to be initiated by the FA?
3
• Are the producers willing to invest their own limited resources, including
time, assets, and financial contributions, to set up the PO, before any external
resources are offered, or do they expect all start-up resources to be provided
by the FA?
4

97
3 Initiative
• Have individual or groups of producers already tried to address marketing
problems in various ways?
4
• Have the producers already shown initiative and taken steps, even if
unsuccessful, to solve their problems or are they passively waiting for the FA to
start the process?
3
4 Business orientation
• Do the producers talk about the proposed initiative as a business or
commercial activity rather than a means of accessing support more easily?
2
• Do the producers recognise a difference between the proposed PO and other
types of community-based organisations which have been set up in the past?
2
• Do at least some of the producers have entrepreneurial skills and experience
selling products and dealing with traders?
3
• Do at least some of the producers have production skills and experience of
sharing practices with others and accessing production services?
4
5 Social capital
• Do the producers already have experience of working together successfully in
informal marketing initiatives or in other joint community activities?
2
• Have the producers already shown a commitment to work together by
forming an informal organization?
5
• Do the producers who are interested in forming a PO all know each other? 3
• Are they from the same local area/neighborhood? 2
Adopted from: Penrose-Buckley C. (2007).

98
ANNEX 5
The table below explains figure 24 graph: the error bar showing there is a difference in means between
members of producer organisation and non-members between.
Annex 6
A graph showing how farmers promote their business
Source:survey results
Independent Samples Test
Levene's
Test for
Equality of
Variances t-test for Equality of Means
F Sig. t df
Sig. (2-
tailed)
Mean
Difference
Std. Error
Difference
95%
Confidence
Interval of the
Difference
Lower Upper
7. What is your
income per
month/pond
from fish
farming? (In
Naira)
Equal
variances
assumed
1.360 .250 -
2.787
41 .008 -.914 .328 -1.577 -.252
Equal
variances not
assumed
-
2.834
33.287 .008 -.914 .323 -1.571 -.258

99