the arts child policy civil justice … overview of military recruiting programs in fy 2007, the...
TRANSCRIPT
This document and trademark(s) contained herein are protected by law as indicated in a notice appearing later in this work. This electronic representation of RAND intellectual property is provided for non-commercial use only. Unauthorized posting of RAND PDFs to a non-RAND Web site is prohibited. RAND PDFs are protected under copyright law. Permission is required from RAND to reproduce, or reuse in another form, any of our research documents for commercial use. For information on reprint and linking permissions, please see RAND Permissions.
Limited Electronic Distribution Rights
This PDF document was made available from www.rand.org as a public
service of the RAND Corporation.
6Jump down to document
THE ARTS
CHILD POLICY
CIVIL JUSTICE
EDUCATION
ENERGY AND ENVIRONMENT
HEALTH AND HEALTH CARE
INTERNATIONAL AFFAIRS
NATIONAL SECURITY
POPULATION AND AGING
PUBLIC SAFETY
SCIENCE AND TECHNOLOGY
SUBSTANCE ABUSE
TERRORISM AND HOMELAND SECURITY
TRANSPORTATION ANDINFRASTRUCTURE
WORKFORCE AND WORKPLACE
The RAND Corporation is a nonprofit research organization providing objective analysis and effective solutions that address the challenges facing the public and private sectors around the world.
Visit RAND at www.rand.org
Explore the RAND National Defense Research Institute
View document details
For More Information
Purchase this document
Browse Books & Publications
Make a charitable contribution
Support RAND

This product is part of the RAND Corporation documented briefing series. RAND
documented briefings are based on research briefed to a client, sponsor, or targeted au-
dience and provide additional information on a specific topic. Although documented
briefings have been peer reviewed, they are not expected to be comprehensive and may
present preliminary findings.

NATIONAL DEFENSE RESEARCH INSTITUTE
The Cost-Effectiveness of Military AdvertisingEvidence from 2002–2004
James N. Dertouzos
Prepared for the Office of the Secretary of Defense
Approved for public release; distribution unlimited

The RAND Corporation is a nonprofit research organization providing objective analysis and effective solutions that address the challenges facing the public and private sectors around the world. RAND’s publications do not necessarily ref lect the opinions of its research clients and sponsors.
R® is a registered trademark.
© Copyright 2009 RAND Corporation
Permission is given to duplicate this document for personal use only, as long as it is unaltered and complete. Copies may not be duplicated for commercial purposes. Unauthorized posting of R AND documents to a non-R AND Web site is prohibited. R AND documents are protected under copyright law. For information on reprint and linking permissions, please visit the RAND permissions page (http://www.rand.org/publications/ permissions.html).
Published 2009 by the RAND Corporation1776 Main Street, P.O. Box 2138, Santa Monica, CA 90407-2138
1200 South Hayes Street, Arlington, VA 22202-50504570 Fifth Avenue, Suite 600, Pittsburgh, PA 15213-2665
RAND URL: http://www.rand.orgTo order RAND documents or to obtain additional information, contact
Distribution Services: Telephone: (310) 451-7002; Fax: (310) 451-6915; Email: [email protected]
The research described in this report was prepared for the Office of the Secretary of Defense (OSD). The research was conducted in the RAND National Defense Research Institute, a federally funded research and development center sponsored by the OSD, the Joint Staff, the Unified Combatant Commands, the Department of the Navy, the Marine Corps, the defense agencies, and the defense Intelligence Community under Contract W74V8H-06-C-0002.
Library of Congress Cataloging-in-Publication Data is available for this publication.
ISBN 978-0-8330-4566-9

iii
Preface
This annotated briefing documents research findings from a RAND project titled “Evaluat-ing the Effectiveness of Military Advertising.” The project was sponsored by the Director for Accession Policy (Military Personnel Policy).
This briefing examines the Services’ advertising expenditures for the 2002–2004 time period and quantifies their impact on active-duty enlistments. Consistent with past research, the study concludes that advertising was very cost-effective at generating enlistments during the 2002–2004 period. While improvements could have been made (such as increasing the budget or adjusting the timing or allocation of dollars across programs), advertising compares favorably with other methods of generating enlistments, such as adding recruiters or increasing bonuses.
Unfortunately, data deficiencies were a significant obstacle that limited the scope of the analysis. Most importantly, gaps in the data made it impossible to assess two categories of marketing efforts that have been increasing in importance: Internet advertising and sponsored events. Further, although the results indicate that competition between the Services is impor-tant, it was not possible to evaluate the separate effects for individual programs other than the Army.
This research was sponsored by the Office of the Secretary of Defense (OSD) and con-ducted within the Forces and Resources Policy Center of the RAND National Defense Research Institute, a federally funded research and development center sponsored by the Office of the Secretary of Defense, the Joint Staff, the Unified Combatant Commands, the Department of the Navy, the Marine Corps, the defense agencies, and the defense Intelligence Community.
For more information on RAND’s Forces and Resources Policy Center, contact the Director, James Hosek. He can be reached by email at [email protected]; by phone at 310-393-0411, extension 7183; or by mail at the RAND Corporation, 1776 Main Street, Santa Monica, California 90407-2138. More information about RAND is available at www.rand.org.

v
Contents
Preface . . . . . . . . . . . . . . . . . . . . . . . . . . . . . . . . . . . . . . . . . . . . . . . . . . . . . . . . . . . . . . . . . . . . . . . . . . . . . . . . . . . . . . . . . . . . . . . . . . . . . . . . . . . iiiTables . . . . . . . . . . . . . . . . . . . . . . . . . . . . . . . . . . . . . . . . . . . . . . . . . . . . . . . . . . . . . . . . . . . . . . . . . . . . . . . . . . . . . . . . . . . . . . . . . . . . . . . . . . . . viiSummary . . . . . . . . . . . . . . . . . . . . . . . . . . . . . . . . . . . . . . . . . . . . . . . . . . . . . . . . . . . . . . . . . . . . . . . . . . . . . . . . . . . . . . . . . . . . . . . . . . . . . . . . ix
Introduction . . . . . . . . . . . . . . . . . . . . . . . . . . . . . . . . . . . . . . . . . . . . . . . . . . . . . . . . . . . . . . . . . . . . . . . . . . . . . . . . . . . . . . . . . . . . . . . . . . . . . 1Overview of Military Recruiting Programs . . . . . . . . . . . . . . . . . . . . . . . . . . . . . . . . . . . . . . . . . . . . . . . . . . . . . . . . . . . . . . . 3Review of Past Research . . . . . . . . . . . . . . . . . . . . . . . . . . . . . . . . . . . . . . . . . . . . . . . . . . . . . . . . . . . . . . . . . . . . . . . . . . . . . . . . . . . . . . 11The Changing Policy and Media Landscape . . . . . . . . . . . . . . . . . . . . . . . . . . . . . . . . . . . . . . . . . . . . . . . . . . . . . . . . . . . . . 17Research Challenges . . . . . . . . . . . . . . . . . . . . . . . . . . . . . . . . . . . . . . . . . . . . . . . . . . . . . . . . . . . . . . . . . . . . . . . . . . . . . . . . . . . . . . . . . . 21New Research Findings . . . . . . . . . . . . . . . . . . . . . . . . . . . . . . . . . . . . . . . . . . . . . . . . . . . . . . . . . . . . . . . . . . . . . . . . . . . . . . . . . . . . . . 27Implications for Policy and Future Research . . . . . . . . . . . . . . . . . . . . . . . . . . . . . . . . . . . . . . . . . . . . . . . . . . . . . . . . . . . . . 35


vii
Tables
1. Regression Results: Army Contracts Per Recruiter . . . . . . . . . . . . . . . . . . . . . . . . . . . . . . . . . . . . . . . . . . 30 2. Regression Results: Log of Total DoD Contracts . . . . . . . . . . . . . . . . . . . . . . . . . . . . . . . . . . . . . . . . . . . . 34

ix
Summary
The four military Services spent over $600 million on recruiting advertising in 2007. This rep-resents a 150 percent increase since the 1999 fiscal year (FY). In addition, the mix of advertis-ing programs has changed significantly. In particular, the Army share of traditional advertising (primarily print, radio, and television advertising) has gone down relative to the other Services, especially the Air Force and Marine Corps. In addition, all the Services are spending relatively more on new advertising vehicles, namely, the Internet and cable television.
These patterns in the data suggest several policy questions worthy of investigation. First, does all this spending on advertising produce enlistments? On a marginal cost basis, how does advertising compare with such alternatives as bonuses or adding more recruiters? Which Ser-vice programs are most effective? Does this depend on the size or mix of the budget? Finally, what are the inter-Service effects? Has the increase in the Air Force and Marine Corps budgets harmed the Army’s and/or Navy’s recruiting efforts?
These questions are addressed in an econometric analysis of military enlistments. Using data on advertising expenditures for the 2002–2004 time period, the study controls for other factors (such as recruiters, bonuses, the local economy, demographic changes, and the mission) and isolates the impact of advertising on active-duty enlistments.
The results for the Army indicate that advertising remains a very effective recruiting tool. At spending levels that prevailed during 2000–2002, contracts increased annually by about 13,000. With expansions in the budget, the marginal advertising cost of a contract was about $10,000. In contrast, the cost from adding recruiters was $15,000. The cost from increasing bonuses, even if targeted effectively, was over $90,000.
Advertising could have been made even more effective by smoothing spending across the entire year, allocating a larger portion of the budget to magazine advertising, and increasing the total advertising budget.
During this time period, the Army was hurt by competing Service programs. In com-parison with earlier periods, the Air Force, Navy, and Marine Corps had relatively higher budget levels. This competition reduced the incremental value of advertising to the Army by 50 percent.
Finally, it also worth noting that the marginal costs of all types of military recruiting efforts (not just advertising) appear to have increased. Given the overall difficulty in meeting enlistment objectives, this result is not surprising. To meet stable recruiting objectives, the Army will need more resources than were required previously.


1
Introduction
2 The Cost-Effectiveness of Military Advertising: Evidence from 2002–2004
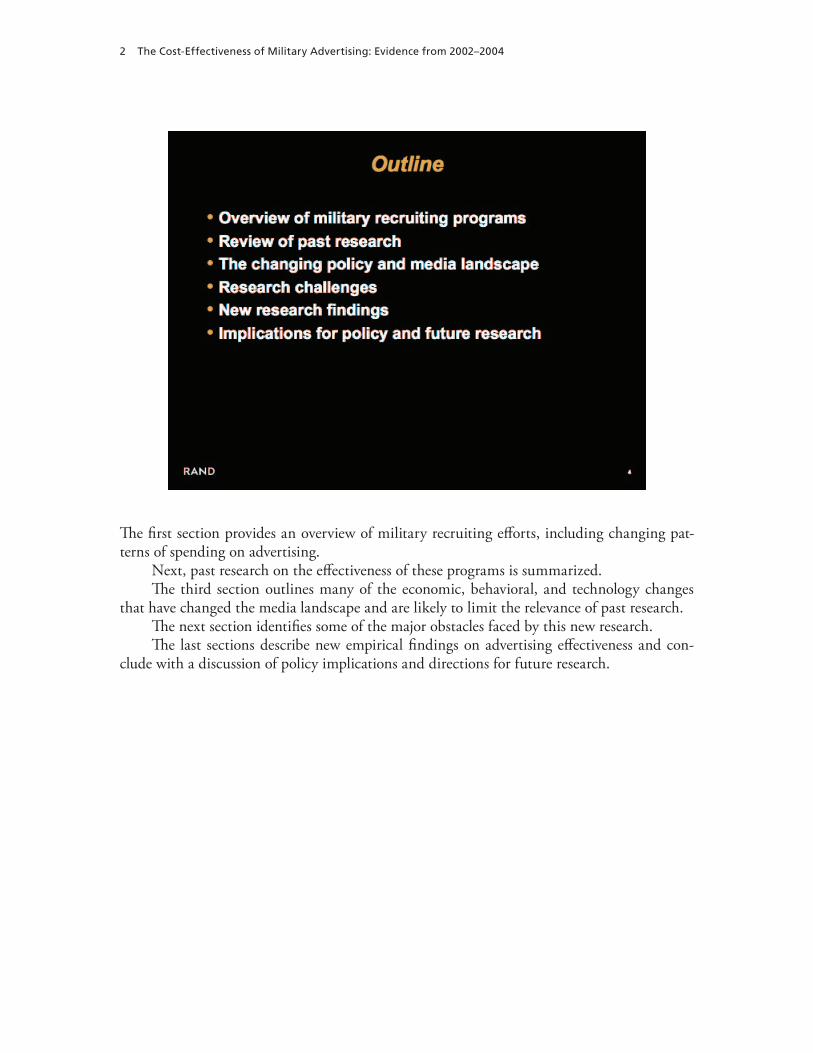
The first section provides an overview of military recruiting efforts, including changing pat-terns of spending on advertising.
Next, past research on the effectiveness of these programs is summarized.The third section outlines many of the economic, behavioral, and technology changes
that have changed the media landscape and are likely to limit the relevance of past research.The next section identifies some of the major obstacles faced by this new research.The last sections describe new empirical findings on advertising effectiveness and con-
clude with a discussion of policy implications and directions for future research.

3
Overview of Military Recruiting Programs
In FY 2007, the total recruiting budget for the Army, Navy, Air Force, and Marine Corps exceeded $3.2 billion, in current dollars. On average, the nominal recruiting budget increased at an annual rate of over 9 percent, far in excess of inflation. For example, the increase in the gross domestic product (GDP) deflator over this same period increased at an average annual rate of less than 2 percent.
Of this total, about $1.8 billion was spent paying and supporting over 13,000 recruit-ers, including infrastructure and organizational expenses. Advertising and enlistment bonuses each totaled in excess of $600 million, while college benefits cost $129 million.
In comparison with earlier years, the Services have increased enlistment bonuses the most, showing a fourfold increase since 1999. Advertising expenditures have increased by 150 percent. Spending on recruiters has increased by 70 percent. In contrast, spending on supple-mental college benefits (funds that are in addition to the U.S. Department of Defense (DoD)–wide GI Bill spending) has actually diminished in nominal terms.
4 The Cost-Effectiveness of Military Advertising: Evidence from 2002–2004
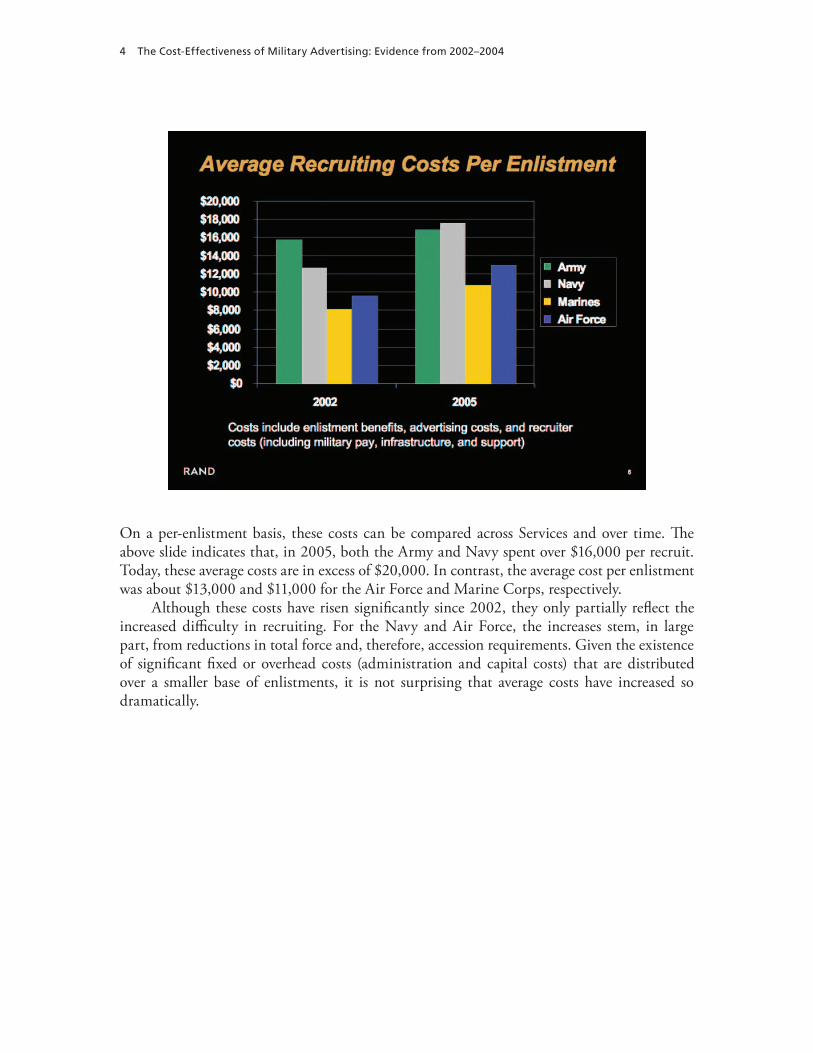
On a per-enlistment basis, these costs can be compared across Services and over time. The above slide indicates that, in 2005, both the Army and Navy spent over $16,000 per recruit. Today, these average costs are in excess of $20,000. In contrast, the average cost per enlistment was about $13,000 and $11,000 for the Air Force and Marine Corps, respectively.
Although these costs have risen significantly since 2002, they only partially reflect the increased difficulty in recruiting. For the Navy and Air Force, the increases stem, in large part, from reductions in total force and, therefore, accession requirements. Given the existence of significant fixed or overhead costs (administration and capital costs) that are distributed over a smaller base of enlistments, it is not surprising that average costs have increased so dramatically.
Overview of Military Recruiting Programs 5
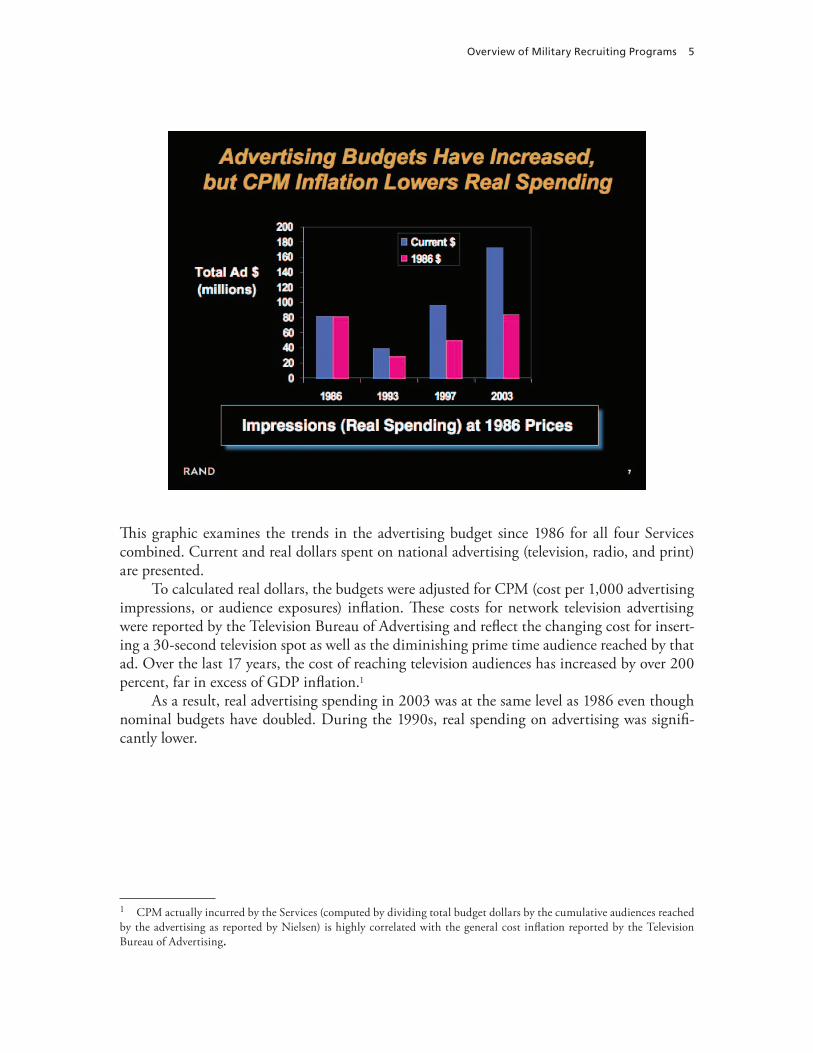
This graphic examines the trends in the advertising budget since 1986 for all four Services combined. Current and real dollars spent on national advertising (television, radio, and print) are presented.
To calculated real dollars, the budgets were adjusted for CPM (cost per 1,000 advertising impressions, or audience exposures) inflation. These costs for network television advertising were reported by the Television Bureau of Advertising and reflect the changing cost for insert-ing a 30-second television spot as well as the diminishing prime time audience reached by that ad. Over the last 17 years, the cost of reaching television audiences has increased by over 200 percent, far in excess of GDP inflation.1
As a result, real advertising spending in 2003 was at the same level as 1986 even though nominal budgets have doubled. During the 1990s, real spending on advertising was signifi-cantly lower.
1 CPM actually incurred by the Services (computed by dividing total budget dollars by the cumulative audiences reached by the advertising as reported by Nielsen) is highly correlated with the general cost inflation reported by the Television Bureau of Advertising.
6 The Cost-Effectiveness of Military Advertising: Evidence from 2002–2004
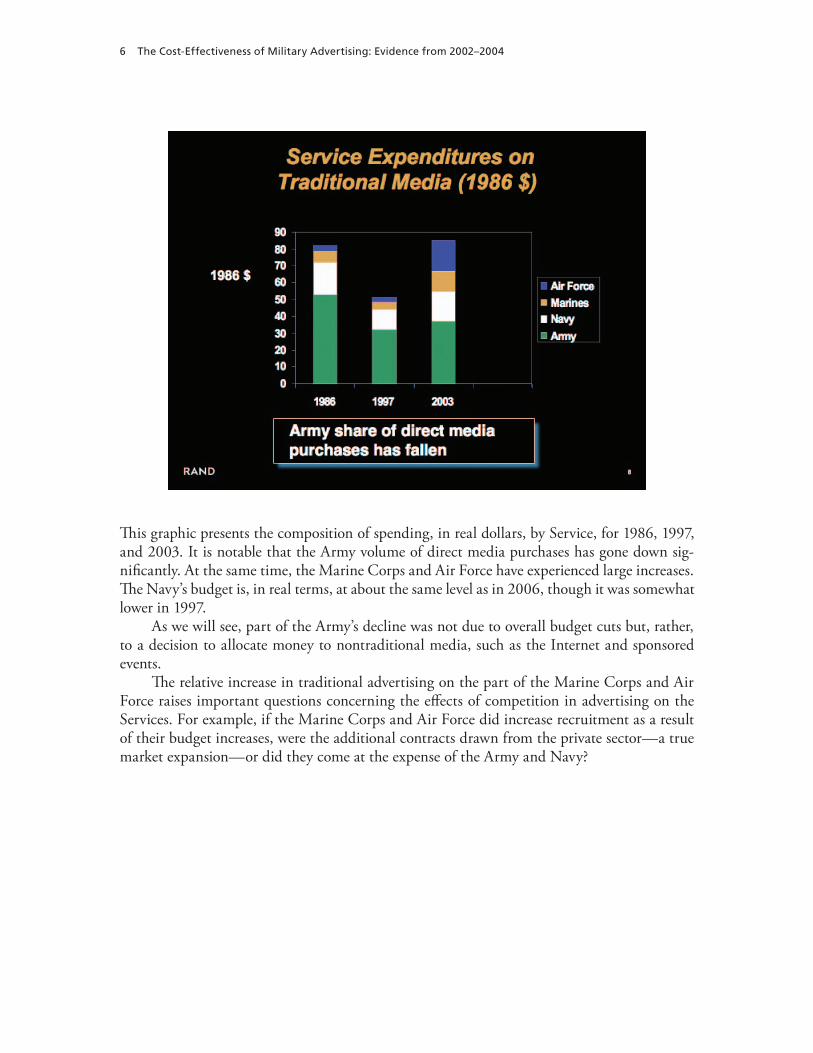
This graphic presents the composition of spending, in real dollars, by Service, for 1986, 1997, and 2003. It is notable that the Army volume of direct media purchases has gone down sig-nificantly. At the same time, the Marine Corps and Air Force have experienced large increases. The Navy’s budget is, in real terms, at about the same level as in 2006, though it was somewhat lower in 1997.
As we will see, part of the Army’s decline was not due to overall budget cuts but, rather, to a decision to allocate money to nontraditional media, such as the Internet and sponsored events.
The relative increase in traditional advertising on the part of the Marine Corps and Air Force raises important questions concerning the effects of competition in advertising on the Services. For example, if the Marine Corps and Air Force did increase recruitment as a result of their budget increases, were the additional contracts drawn from the private sector—a true market expansion—or did they come at the expense of the Army and Navy?
Overview of Military Recruiting Programs 7
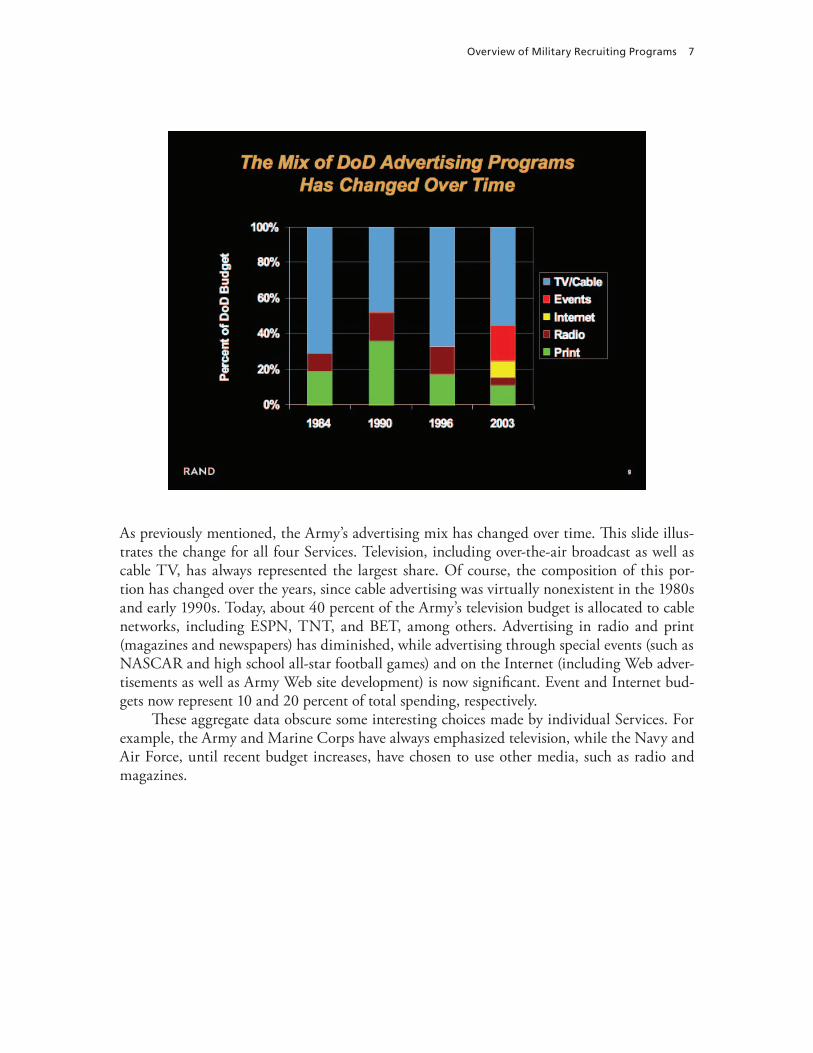
As previously mentioned, the Army’s advertising mix has changed over time. This slide illus-trates the change for all four Services. Television, including over-the-air broadcast as well as cable TV, has always represented the largest share. Of course, the composition of this por-tion has changed over the years, since cable advertising was virtually nonexistent in the 1980s and early 1990s. Today, about 40 percent of the Army’s television budget is allocated to cable networks, including ESPN, TNT, and BET, among others. Advertising in radio and print (magazines and newspapers) has diminished, while advertising through special events (such as NASCAR and high school all-star football games) and on the Internet (including Web adver-tisements as well as Army Web site development) is now significant. Event and Internet bud-gets now represent 10 and 20 percent of total spending, respectively.
These aggregate data obscure some interesting choices made by individual Services. For example, the Army and Marine Corps have always emphasized television, while the Navy and Air Force, until recent budget increases, have chosen to use other media, such as radio and magazines.

8 The Cost-Effectiveness of Military Advertising: Evidence from 2002–2004
These patterns in the data suggest several policy questions worthy of investigation. First, does all this spending on advertising produce enlistments? On a marginal cost basis, how does advertising compare with such alternatives as bonuses or adding more recruiters? Which Ser-vice programs are most effective? Does this depend on the size or mix of the budget? Finally, what are the inter-Service effects? Has the increase in the Air Force and Marine Corps budgets harmed the Army and/or Navy?
Overview of Military Recruiting Programs 9
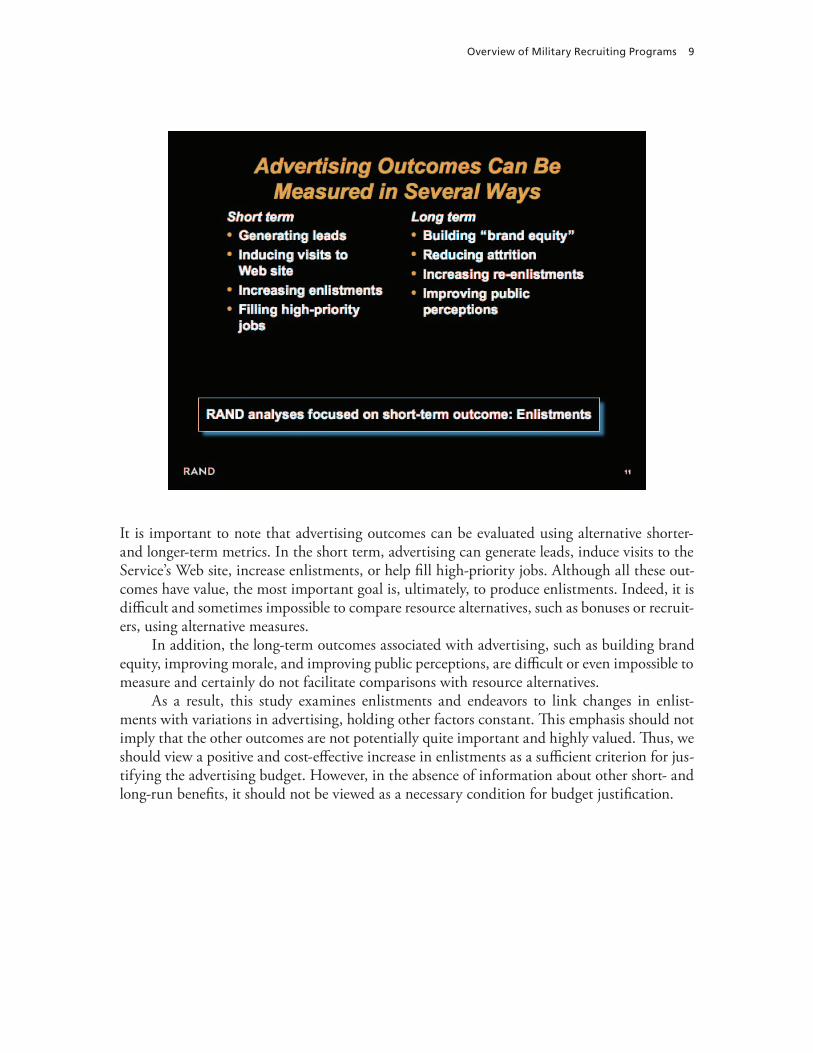
It is important to note that advertising outcomes can be evaluated using alternative shorter- and longer-term metrics. In the short term, advertising can generate leads, induce visits to the Service’s Web site, increase enlistments, or help fill high-priority jobs. Although all these out-comes have value, the most important goal is, ultimately, to produce enlistments. Indeed, it is difficult and sometimes impossible to compare resource alternatives, such as bonuses or recruit-ers, using alternative measures.
In addition, the long-term outcomes associated with advertising, such as building brand equity, improving morale, and improving public perceptions, are difficult or even impossible to measure and certainly do not facilitate comparisons with resource alternatives.
As a result, this study examines enlistments and endeavors to link changes in enlist-ments with variations in advertising, holding other factors constant. This emphasis should not imply that the other outcomes are not potentially quite important and highly valued. Thus, we should view a positive and cost-effective increase in enlistments as a sufficient criterion for jus-tifying the advertising budget. However, in the absence of information about other short- and long-run benefits, it should not be viewed as a necessary condition for budget justification.
10 The Cost-Effectiveness of Military Advertising: Evidence from 2002–2004
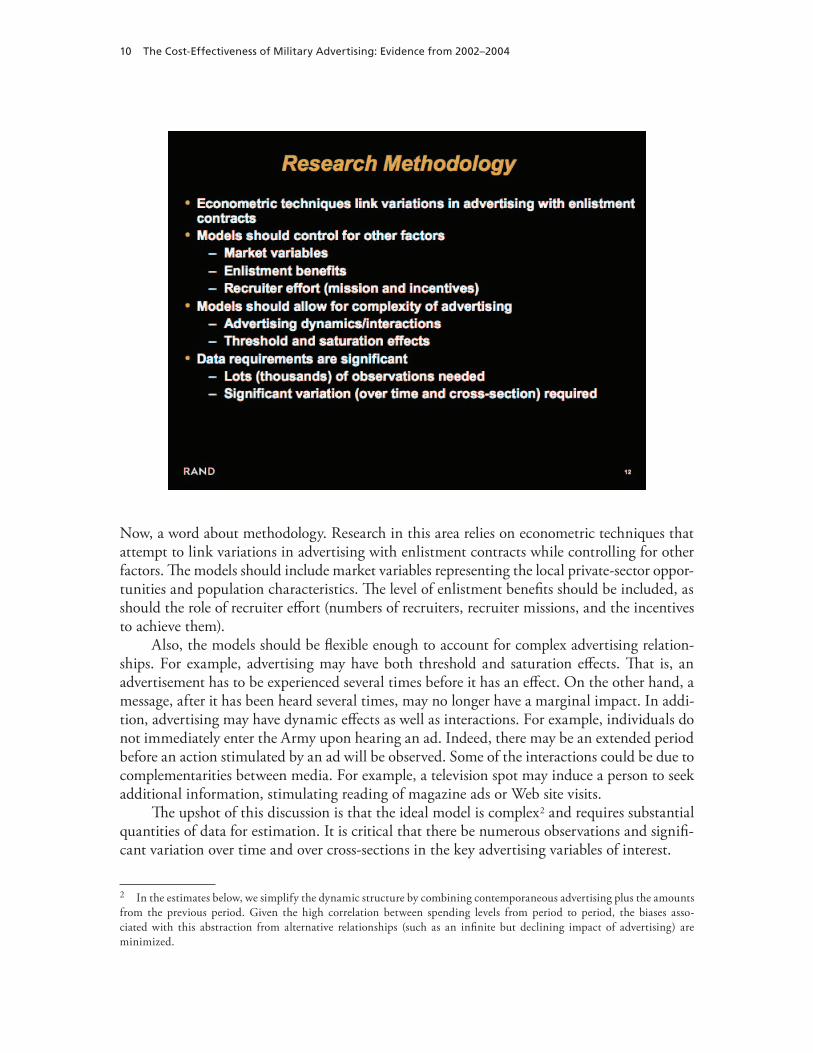
Now, a word about methodology. Research in this area relies on econometric techniques that attempt to link variations in advertising with enlistment contracts while controlling for other factors. The models should include market variables representing the local private-sector oppor-tunities and population characteristics. The level of enlistment benefits should be included, as should the role of recruiter effort (numbers of recruiters, recruiter missions, and the incentives to achieve them).
Also, the models should be flexible enough to account for complex advertising relation-ships. For example, advertising may have both threshold and saturation effects. That is, an advertisement has to be experienced several times before it has an effect. On the other hand, a message, after it has been heard several times, may no longer have a marginal impact. In addi-tion, advertising may have dynamic effects as well as interactions. For example, individuals do not immediately enter the Army upon hearing an ad. Indeed, there may be an extended period before an action stimulated by an ad will be observed. Some of the interactions could be due to complementarities between media. For example, a television spot may induce a person to seek additional information, stimulating reading of magazine ads or Web site visits.
The upshot of this discussion is that the ideal model is complex2 and requires substantial quantities of data for estimation. It is critical that there be numerous observations and signifi-cant variation over time and over cross-sections in the key advertising variables of interest.
2 In the estimates below, we simplify the dynamic structure by combining contemporaneous advertising plus the amounts from the previous period. Given the high correlation between spending levels from period to period, the biases asso-ciated with this abstraction from alternative relationships (such as an infinite but declining impact of advertising) are minimized.

11
Review of Past Research
This section briefly describes previous RAND research on the effectiveness of military advertising.
12 The Cost-Effectiveness of Military Advertising: Evidence from 2002–2004
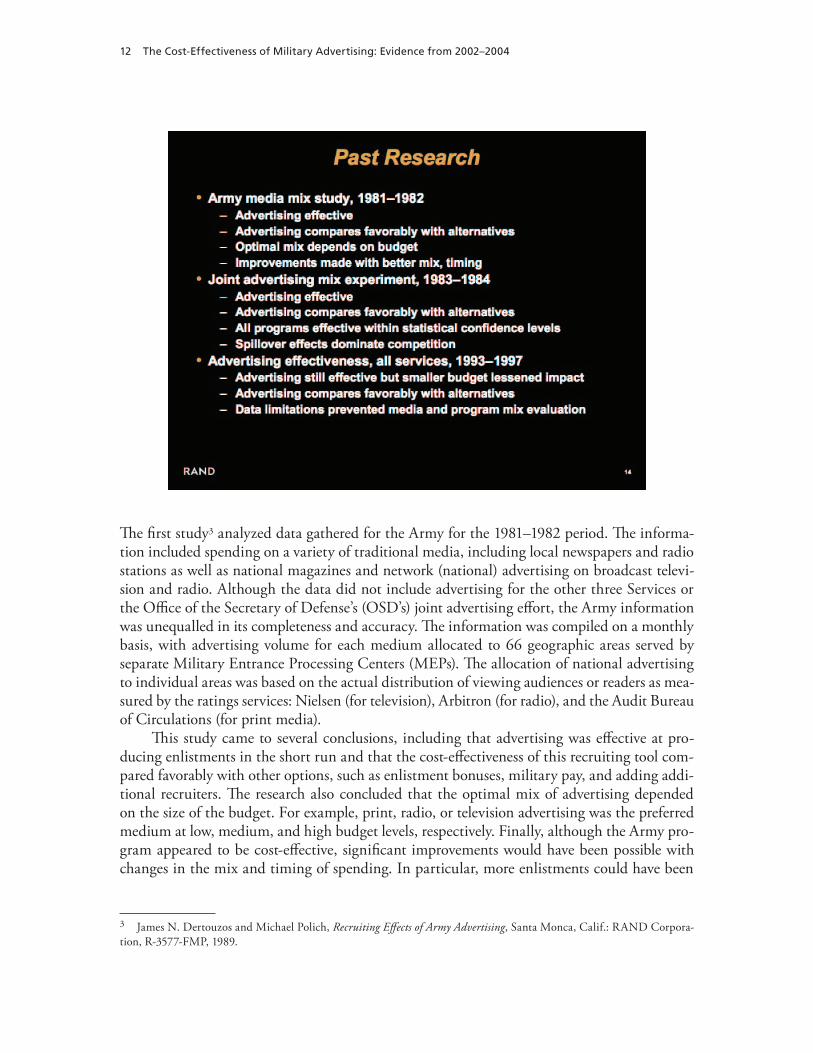
The first study3 analyzed data gathered for the Army for the 1981–1982 period. The informa-tion included spending on a variety of traditional media, including local newspapers and radio stations as well as national magazines and network (national) advertising on broadcast televi-sion and radio. Although the data did not include advertising for the other three Services or the Office of the Secretary of Defense’s (OSD’s) joint advertising effort, the Army information was unequalled in its completeness and accuracy. The information was compiled on a monthly basis, with advertising volume for each medium allocated to 66 geographic areas served by separate Military Entrance Processing Centers (MEPs). The allocation of national advertising to individual areas was based on the actual distribution of viewing audiences or readers as mea-sured by the ratings services: Nielsen (for television), Arbitron (for radio), and the Audit Bureau of Circulations (for print media).
This study came to several conclusions, including that advertising was effective at pro-ducing enlistments in the short run and that the cost-effectiveness of this recruiting tool com-pared favorably with other options, such as enlistment bonuses, military pay, and adding addi-tional recruiters. The research also concluded that the optimal mix of advertising depended on the size of the budget. For example, print, radio, or television advertising was the preferred medium at low, medium, and high budget levels, respectively. Finally, although the Army pro-gram appeared to be cost-effective, significant improvements would have been possible with changes in the mix and timing of spending. In particular, more enlistments could have been
3 James N. Dertouzos and Michael Polich, Recruiting Effects of Army Advertising, Santa Monca, Calif.: RAND Corpora-tion, R-3577-FMP, 1989.

Review of Past Research 13
achieved by spending more on television (instead of radio) and by smoothing spending over the calendar months of the year.
The second study4 was also based on information from the early 1980s, but this study was unique in that it included advertising allocations for all 5 programs (including the joint pro-gram). Most importantly, the advertising volumes were determined by an experimental design that allowed for significant variation over time and across geographic units (MEPs). Although the experiment did not facilitate comparisons of individual media types, it did enable analysis of the separate programs. The research confirmed the previous findings that advertising was effective and that it compared favorably with other options for increasing enlistments. All pro-grams appeared to be effective within standard statistical confidence intervals. Most interest-ing was the finding that the Services did not appear to compete with one another. Indeed, the evidence suggested that there were positive spillovers across programs. For example, an increase in the Air Force program not only helped the Air Force, but also increased enlistments in the other Services. An interesting question in today’s recruiting and media environment is whether such effects still prevail or, instead, the Services are increasingly competing with each other for a fixed pool of candidates.
The last study5 analyzed advertising programs for the 1993 –1997 period. Unfortunately, severe data limitations precluded analysis of media mix or the separate Service programs. How-ever, the analysis was able to examine the overall aggregate impact of military advertising on enlistment contracts. Consistent with previous research, the study concluded that advertising was effective but that the small budget lessened the impact. At higher budget levels, the adver-tising programs would have been even more effective.
4 James N. Dertouzos, The Effects of Military Advertising: Evidence from the Advertising Mix Test, Santa Monica, Calif.: RAND Corporation, N-2907-FMP, 1989.5 James N. Dertouzos and Steven Garber, Is Military Advertising Effective? An Estimation of Methodology and Applications to Recruiting in the 1980s and 90s, Santa Monica, Calif.: RAND Corporation, MR-1591-OSD, 2003.

14 The Cost-Effectiveness of Military Advertising: Evidence from 2002–2004
This slide summarizes the marginal cost estimates for two of the earlier studies. The dollar figures can be interpreted as marginal costs for high-quality (test category I-IIIA, high school graduates) male enlistees. In other words, how much of a budget increase (using alternative tools) would be required for each additional high-quality male enlistee. During the early 1980s, recruiters and advertising appeared to be the most cost-effective options, with a marginal cost of $5,400 and $6,000, respectively. This difference is not statistically significant. In contrast, the cost of expanding enlistments via bonuses was about $16,000. It is important to note that the effectiveness of bonuses is limited, because such payments will be made to a larger pool of enlistees, not just those who have been induced to join because of the bonuses.
Not surprisingly, these marginal costs (in current or nominal dollars) increased over the next 10 –15 years. In comparison with military pay, advertising still appeared quite effective. Note that two estimates for advertising are presented. This is because the methodology uti-lized a flexible functional form (a logistic or “S-curve”) that allows for threshold and satura-tion effects. Such effects are consistent with advertising theories that posit the necessity of a minimum number of exposures before advertising has any affect. In addition, beyond a certain number of exposures, additional advertising is thought to have no effect. This approach pro-vides a marginal cost estimate for different levels of spending. The above table provides two such marginal costs. The first, at the sample mean spending level, indicates a marginal cost of almost $26,000. However, at twice the budget level, advertising would have been even more cost-effective, with marginal costs falling below $10,000.

Review of Past Research 15
This slide highlights the latter point by calculating marginal cost estimates at different levels of per capita advertising spending. These were calculated using the 1993–1997 study estimates. Note that the marginal costs fall from over $50,000 to about $5,000 before rising again at high levels of spending. This U-shaped pattern corresponds to the slope of the estimated S-curve for which incremental benefits are small at low levels of spending (one fails to achieve the requisite frequency) as well as high levels (saturation occurs, no new audience penetration is achieved, and recipients are receiving the same messages over and over again).
Note that the level of per capita spending (in 1997 dollars) is indicated for 1986, 1993, 1997, and 2003. In 1993, the ad budget was too small to be effective. The situation improved by 1997, though spending levels remained below the more effective budget that prevailed 11 years earlier in 1986. By 2003, the advertising budget was restored to the level of 2003 and, as a result, marginal costs fell below $10,000. It is important to recognize, however, that advertis-ing could become even more effective with 50 percent increases in the budget.

17
The Changing Policy and Media Landscape
Of course, the relevance of past research on advertising is questionable given recent changes in the policy environment and in the mass media landscape. It goes without question that the nature of military service has changed dramatically since the invasion of Iraq. In addition, there have been significant changes in the structure of the mass media as well as changes in the ways that American youth use such media.
18 The Cost-Effectiveness of Military Advertising: Evidence from 2002–2004
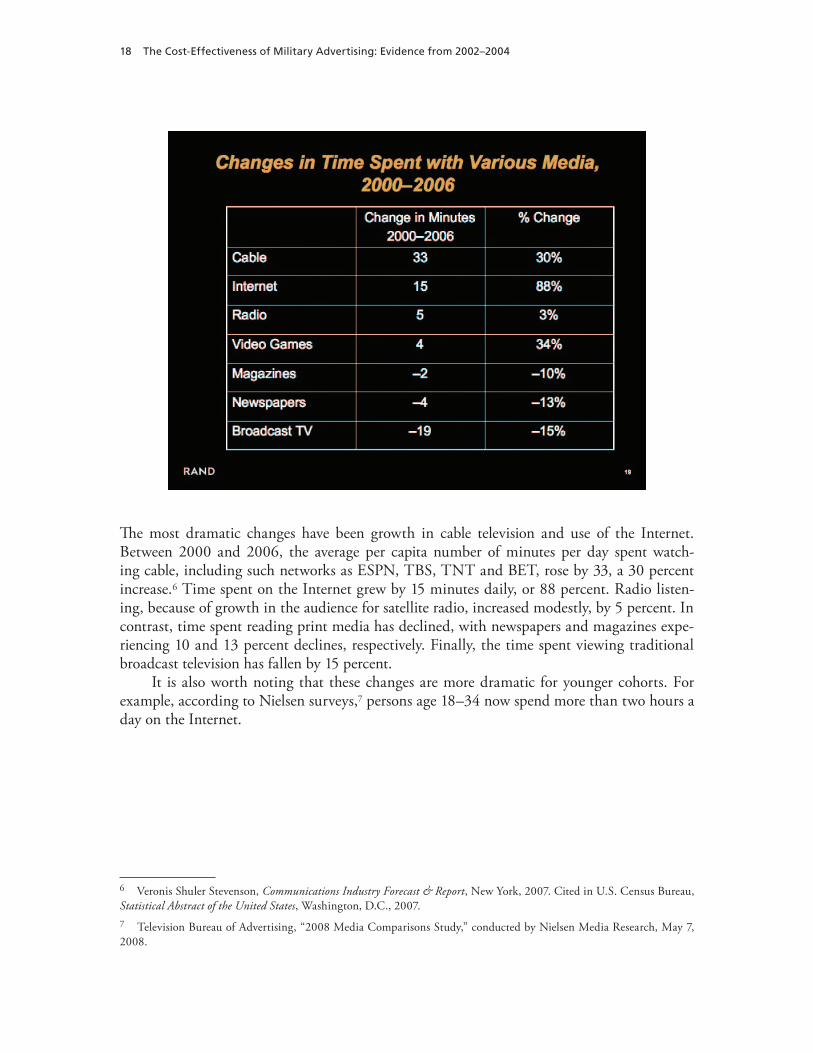
The most dramatic changes have been growth in cable television and use of the Internet. Between 2000 and 2006, the average per capita number of minutes per day spent watch-ing cable, including such networks as ESPN, TBS, TNT and BET, rose by 33, a 30 percent increase.6 Time spent on the Internet grew by 15 minutes daily, or 88 percent. Radio listen-ing, because of growth in the audience for satellite radio, increased modestly, by 5 percent. In contrast, time spent reading print media has declined, with newspapers and magazines expe-riencing 10 and 13 percent declines, respectively. Finally, the time spent viewing traditional broadcast television has fallen by 15 percent.
It is also worth noting that these changes are more dramatic for younger cohorts. For example, according to Nielsen surveys,7 persons age 18 –34 now spend more than two hours a day on the Internet.
6 Veronis Shuler Stevenson, Communications Industry Forecast & Report, New York, 2007. Cited in U.S. Census Bureau, Statistical Abstract of the United States, Washington, D.C., 2007.7 Television Bureau of Advertising, “2008 Media Comparisons Study,” conducted by Nielsen Media Research, May 7, 2008.

The Changing Policy and Media Landscape 19
Not surprisingly, advertising revenues track changes in media activity. This table presents the percentage distributions of national advertising spending across major media for 1984, 1995, and 2004. It is noteworthy that spending on television, magazines, and newspapers has dimin-ished. Cable television has increased in importance. Note that the sum of traditional broadcast television plus cable has remained relatively stable over time. Internet advertising was nonexis-tent in 1984 and 1995. By 2004, Internet advertising represented 9 percent of total advertising dollars. Since 2004, Internet advertising has continued to become more important, growing at an annual rate of nearly 15 percent.
20 The Cost-Effectiveness of Military Advertising: Evidence from 2002–2004
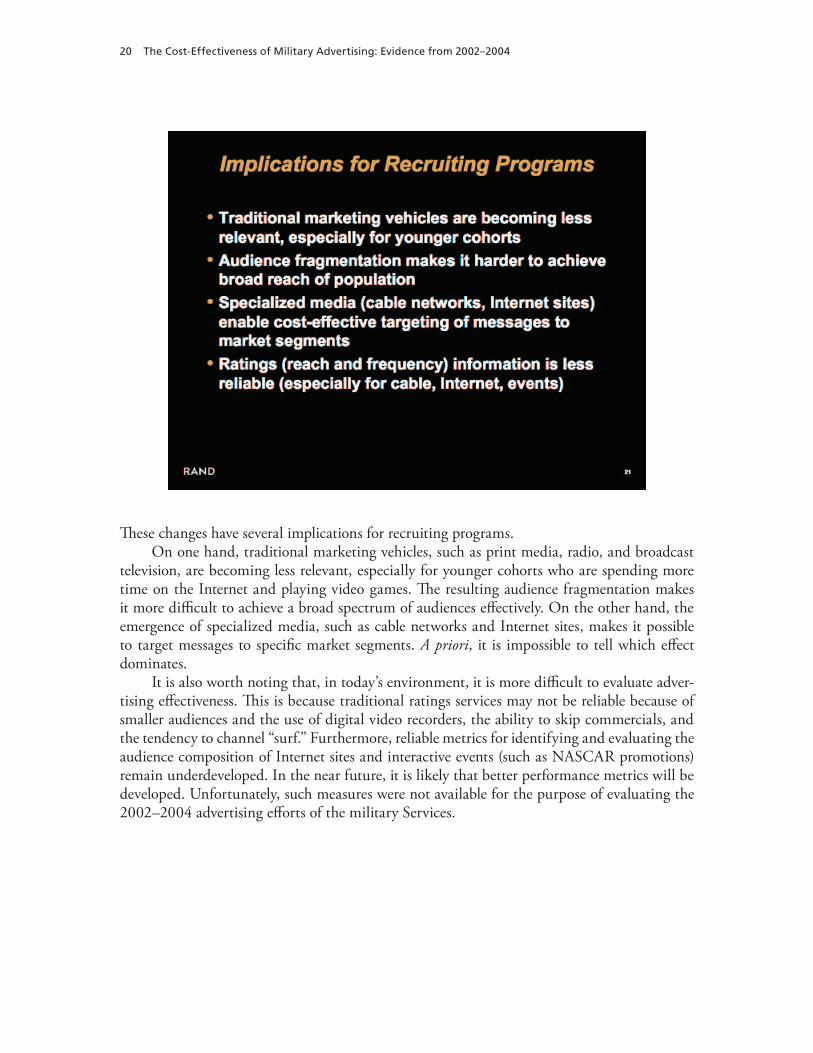
These changes have several implications for recruiting programs.On one hand, traditional marketing vehicles, such as print media, radio, and broadcast
television, are becoming less relevant, especially for younger cohorts who are spending more time on the Internet and playing video games. The resulting audience fragmentation makes it more difficult to achieve a broad spectrum of audiences effectively. On the other hand, the emergence of specialized media, such as cable networks and Internet sites, makes it possible to target messages to specific market segments. A priori, it is impossible to tell which effect dominates.
It is also worth noting that, in today’s environment, it is more difficult to evaluate adver-tising effectiveness. This is because traditional ratings services may not be reliable because of smaller audiences and the use of digital video recorders, the ability to skip commercials, and the tendency to channel “surf.” Furthermore, reliable metrics for identifying and evaluating the audience composition of Internet sites and interactive events (such as NASCAR promotions) remain underdeveloped. In the near future, it is likely that better performance metrics will be developed. Unfortunately, such measures were not available for the purpose of evaluating the 2002–2004 advertising efforts of the military Services.
21
Research Challenges
Before describing research results from a more recent data set for the 2002–2004 period, this section describes some of the empirical and methodological challenges faced.

22 The Cost-Effectiveness of Military Advertising: Evidence from 2002–2004
The information provided by the Services for analysis did not appear to be complete.8 This graphic indicates that official OSD budget totals and advertising categories do not match up with totals and categories provided by the Services. For example, according to OSD, the budget for U.S. Army national advertising was just over $75 million in 2003, including $55 million in television advertising. Reported budgets for radio, print, direct mail, Internet, local advertising, and events were also reported for the Army as well as the Navy, Marine Corps, and Air Force. For each category, the official budget numbers were compared with totals obtained by summing the advertising data files that the Services provided for the RAND analysis.
The color code indicates the apparent degree of data completeness. Green indicates that the sample data sum to 85 percent of the OSD budget totals. Since national ad budgets often include a 15 percent agency commission, 85 percent seemed to be a reasonable indication of a high degree of accuracy or completeness. Yellow indicates a 50 to 85 percent level of complete-ness, suggesting that one should use caution in interpreting results based on analysis of these categories. Red indicates a rate of accuracy that falls below 50 percent, while the black cells indicate the absence of reliable data for these categories.
8 Even under the best of circumstances, one could never expect a perfect match when comparing analytic files provided by the Services with advertising budget totals reported to OSD. Discrepancies could arise because of differences in the treat-ment of creative content development, agency fees, or the timing of budget “add ons.” Industry standards for reporting and monitoring nontraditional media, such as Internet activities, are still evolving and were not well developed at the time these data were collected. In addition, gathering historic information on marketing programs, especially when the identities of advertising agencies change, is costly and difficult. Thus, although the Services complied with the request for data, signifi-cant gaps remain.

Research Challenges 23
In general, it appears that the analytic file is incomplete. While television advertising data for the Army and national advertising reported by the Air Force seem to be accurate, informa-tion for other media appears to be inconsistent. Across all Services, only television advertising data matched the OSD budget totals with a high degree of accuracy. Even then, data for the Navy and Marine Corps summed to less than 85 percent of the official budgets.
24 The Cost-Effectiveness of Military Advertising: Evidence from 2002–2004
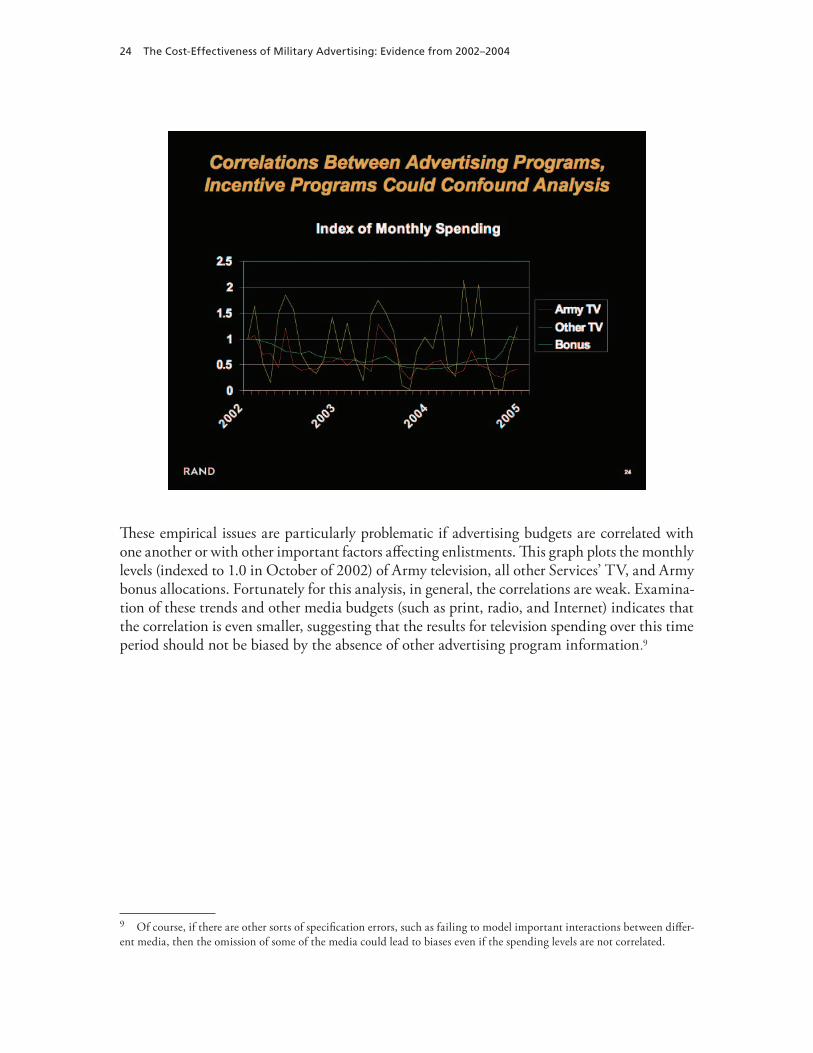
These empirical issues are particularly problematic if advertising budgets are correlated with one another or with other important factors affecting enlistments. This graph plots the monthly levels (indexed to 1.0 in October of 2002) of Army television, all other Services’ TV, and Army bonus allocations. Fortunately for this analysis, in general, the correlations are weak. Examina-tion of these trends and other media budgets (such as print, radio, and Internet) indicates that the correlation is even smaller, suggesting that the results for television spending over this time period should not be biased by the absence of other advertising program information.9
9 Of course, if there are other sorts of specification errors, such as failing to model important interactions between differ-ent media, then the omission of some of the media could lead to biases even if the spending levels are not correlated.
Research Challenges 25
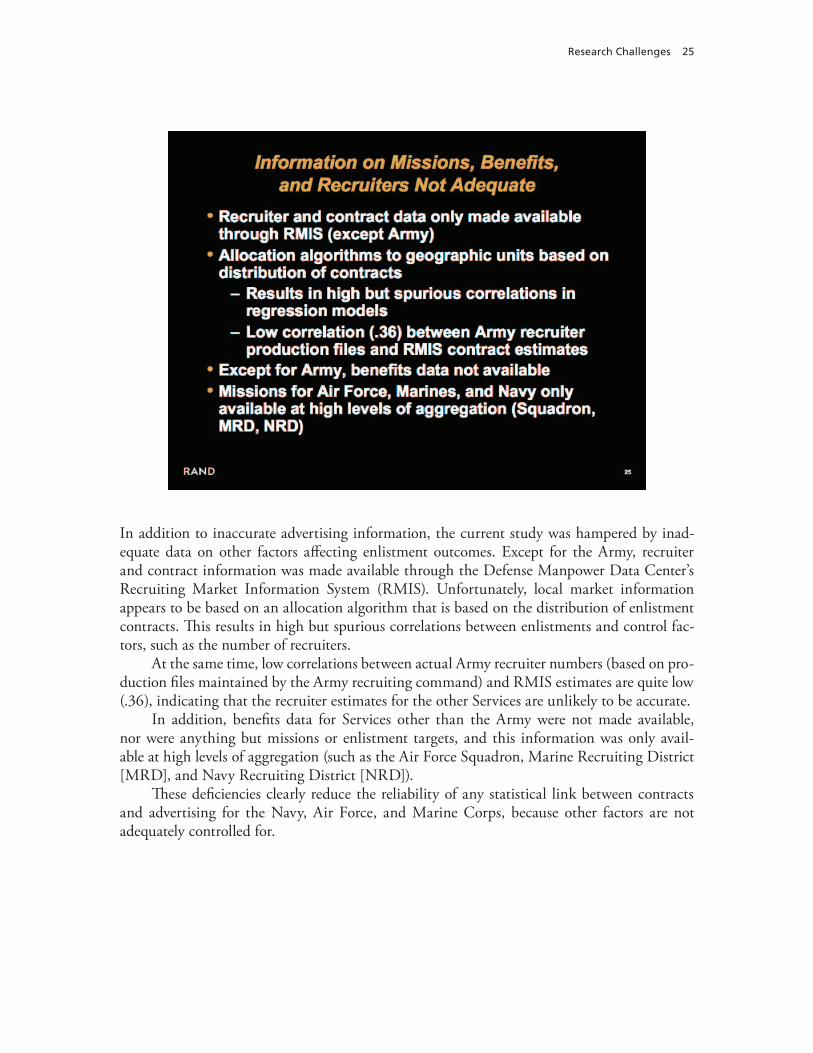
In addition to inaccurate advertising information, the current study was hampered by inad-equate data on other factors affecting enlistment outcomes. Except for the Army, recruiter and contract information was made available through the Defense Manpower Data Center’s Recruiting Market Information System (RMIS). Unfortunately, local market information appears to be based on an allocation algorithm that is based on the distribution of enlistment contracts. This results in high but spurious correlations between enlistments and control fac-tors, such as the number of recruiters.
At the same time, low correlations between actual Army recruiter numbers (based on pro-duction files maintained by the Army recruiting command) and RMIS estimates are quite low (.36), indicating that the recruiter estimates for the other Services are unlikely to be accurate.
In addition, benefits data for Services other than the Army were not made available, nor were anything but missions or enlistment targets, and this information was only avail-able at high levels of aggregation (such as the Air Force Squadron, Marine Recruiting District [MRD], and Navy Recruiting District [NRD]).
These deficiencies clearly reduce the reliability of any statistical link between contracts and advertising for the Navy, Air Force, and Marine Corps, because other factors are not adequately controlled for.


27
New Research Findings
With these caveats in mind, we can now turn to new research findings on the effectiveness of military advertising. But, first, another word about methodology.
28 The Cost-Effectiveness of Military Advertising: Evidence from 2002–2004
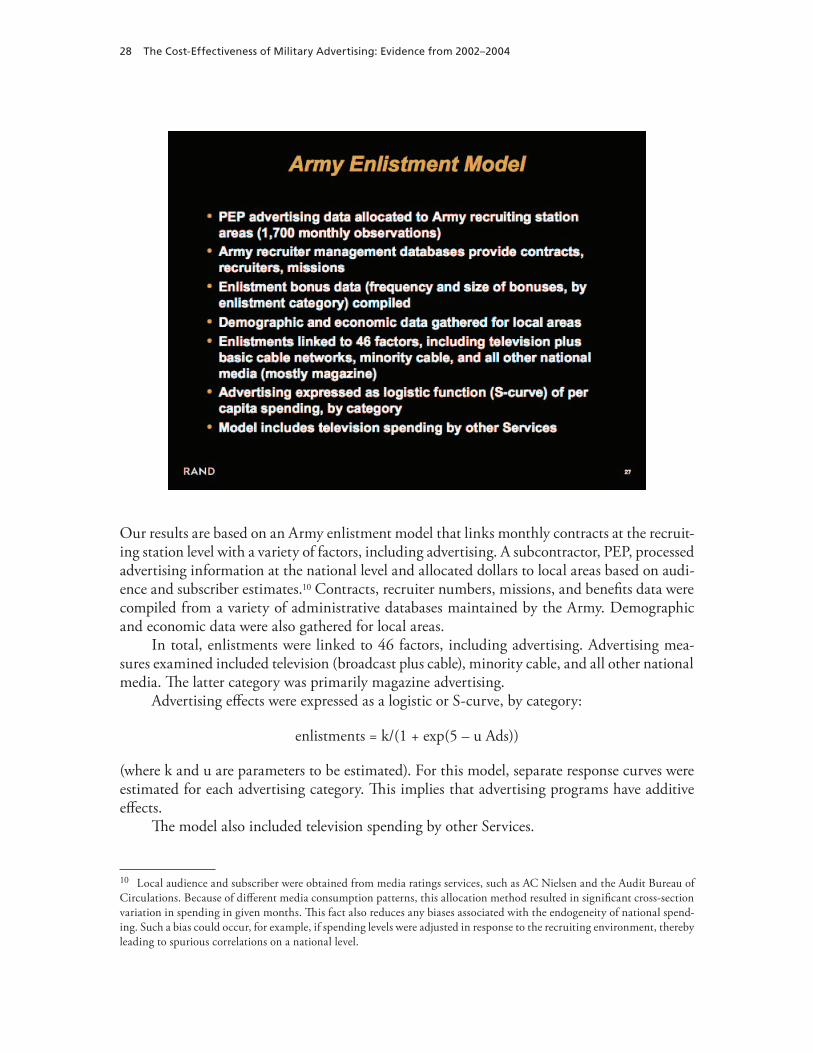
Our results are based on an Army enlistment model that links monthly contracts at the recruit-ing station level with a variety of factors, including advertising. A subcontractor, PEP, processed advertising information at the national level and allocated dollars to local areas based on audi-ence and subscriber estimates.10 Contracts, recruiter numbers, missions, and benefits data were compiled from a variety of administrative databases maintained by the Army. Demographic and economic data were also gathered for local areas.
In total, enlistments were linked to 46 factors, including advertising. Advertising mea-sures examined included television (broadcast plus cable), minority cable, and all other national media. The latter category was primarily magazine advertising.
Advertising effects were expressed as a logistic or S-curve, by category:
enlistments = k/(1 + exp(5 – u Ads))
(where k and u are parameters to be estimated). For this model, separate response curves were estimated for each advertising category. This implies that advertising programs have additive effects.
The model also included television spending by other Services.
10 Local audience and subscriber were obtained from media ratings services, such as AC Nielsen and the Audit Bureau of Circulations. Because of different media consumption patterns, this allocation method resulted in significant cross-section variation in spending in given months. This fact also reduces any biases associated with the endogeneity of national spend-ing. Such a bias could occur, for example, if spending levels were adjusted in response to the recruiting environment, thereby leading to spurious correlations on a national level.

New Research Findings 29
This graphic presents advertising response curves for three media categories: television, minority cable, and other media (primarily magazine). These S-curves are based on regressions reported in Table 1. Data for minority advertising were not made available for 2004, so these results were obtained using 2002–2003 information only.
The regression sample was based on monthly observations at the recruiting station level. However, simulations based on the estimates were converted to annual spending levels and the predicted change in annual contracts. Note the shape of the response curves. At low levels of spending, advertising does not have a significant impact, probably because the requisite mini-mum number of exposures per person reached is not achieved. With increased spending, the ads reach more individuals, and the frequency of exposures increases as well. Eventually, a satu-ration point is reached—there is no additional audience reach, and each individual has received the message multiple times. Thus, there is no incremental value to additional spending.
Note that magazine advertising is most effective at low levels of advertising. This is because one can attain high frequency at low budget levels. Next effective is minority cable. Least effective is general television, which requires a large budget of over $30 million before it is effective.11
Both minority and other media have levels that are significantly below the amounts at which spending on these media would be most cost-effective. In contrast, television spending is approaching a point of saturation.
11 These budget totals are annual, and the underlying assumption is that spending is smoothed over a 12-month period. When budgets are low, it would be more effective to allocate more spending to particular months so that higher frequency is achieved (at the expense of greater reach). The specification also assumes that the relationships are stable across markets.

30 The Cost-Effectiveness of Military Advertising: Evidence from 2002–2004
According to these estimates, the Army attracted nearly 13,000 additional contracts per year at the budget levels prevailing during 2002–2003. But, by increasing the budgets (par-ticularly for magazine and minority cable advertising), the Army could have attracted 12,000 more enlistments.
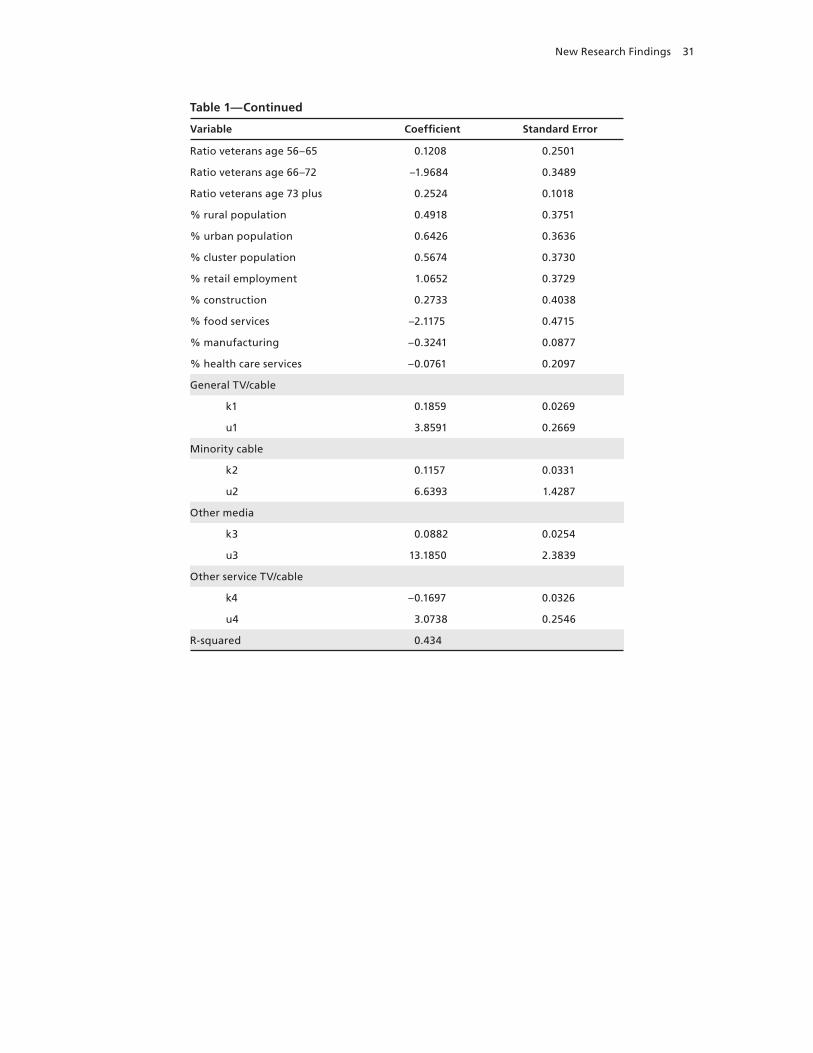
Table 1Regression Results: Army Contracts Per Recruiter
Variable Coefficient Standard Error
Intercept –1.5194 0.4630
“Other” mission per recruiter 0.4951 0.0129
High-quality mission per recruiter 0.6191 0.0115
Military compensation 0.2770 0.0530
2-recruiter station (0,1) 0.0943 0.0163
3-recruiter station (0,1) 0.1174 0.0177
4-recruiter station (0,1) 0.1313 0.0197
5-recruiter station (0,1) 0.1016 0.0225
6 plus recruiter station (0,1) 0.0776 0.0282
2003 fiscal year (0,1) –0.3044 0.0168
February –0.0565 0.0316
March 0.0074 0.0346
April 0.1834 0.0349
May –0.0537 0.0335
June 0.2709 0.0244
July 0.1584 0.0265
August 0.1588 0.0261
September 0.1944 0.0327
October 0.1110 0.0357
November 0.2124 0.0370
December 0.0752 0.0328
Mountain region 0.2735 0.0314
North Central region 0.1414 0.0209
South 0.2361 0.0223
Pacific region 0.1374 0.0247
Qualified miltiary available (QMA) per recruiter
0.0002 0.0000
% Black –0.6614 0.1117
% Hispanic –0.6981 0.1011
log(unemployment rate) 0.1701 0.0197
% college –0.0031 0.0014
Ratio veterans age 33–42 2.5235 0.2441
Ratio veterans age 43–55 –0.2869 0.2086
New Research Findings 31
Ratio veterans age 56–65 0.1208 0.2501
Ratio veterans age 66–72 –1.9684 0.3489
Ratio veterans age 73 plus 0.2524 0.1018
% rural population 0.4918 0.3751
% urban population 0.6426 0.3636
% cluster population 0.5674 0.3730
% retail employment 1.0652 0.3729
% construction 0.2733 0.4038
% food services –2.1175 0.4715
% manufacturing –0.3241 0.0877
% health care services –0.0761 0.2097
General TV/cable
k1 0.1859 0.0269
u1 3.8591 0.2669
Minority cable
k2 0.1157 0.0331
u2 6.6393 1.4287
Other media
k3 0.0882 0.0254
u3 13.1850 2.3839
Other service TV/cable
k4 –0.1697 0.0326
u4 3.0738 0.2546
R-squared 0.434
Table 1—Continued
Variable Coefficient Standard Error
32 The Cost-Effectiveness of Military Advertising: Evidence from 2002–2004
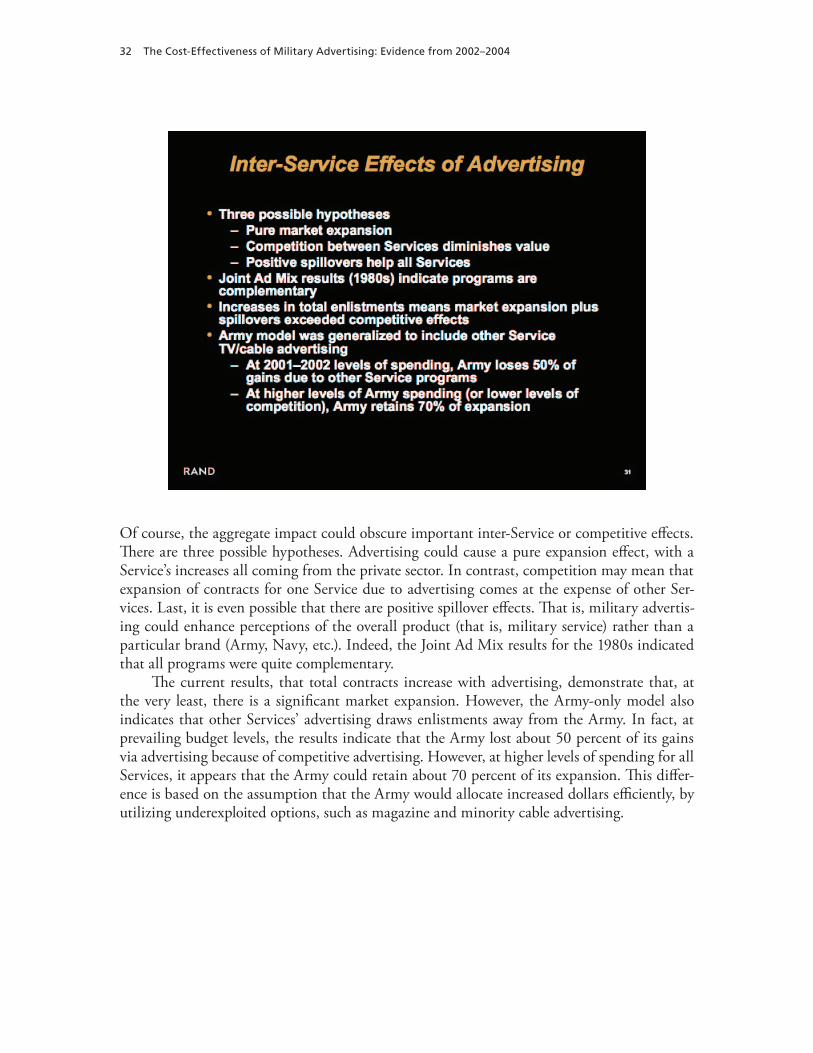
Of course, the aggregate impact could obscure important inter-Service or competitive effects. There are three possible hypotheses. Advertising could cause a pure expansion effect, with a Service’s increases all coming from the private sector. In contrast, competition may mean that expansion of contracts for one Service due to advertising comes at the expense of other Ser-vices. Last, it is even possible that there are positive spillover effects. That is, military advertis-ing could enhance perceptions of the overall product (that is, military service) rather than a particular brand (Army, Navy, etc.). Indeed, the Joint Ad Mix results for the 1980s indicated that all programs were quite complementary.
The current results, that total contracts increase with advertising, demonstrate that, at the very least, there is a significant market expansion. However, the Army-only model also indicates that other Services’ advertising draws enlistments away from the Army. In fact, at prevailing budget levels, the results indicate that the Army lost about 50 percent of its gains via advertising because of competitive advertising. However, at higher levels of spending for all Services, it appears that the Army could retain about 70 percent of its expansion. This differ-ence is based on the assumption that the Army would allocate increased dollars efficiently, by utilizing underexploited options, such as magazine and minority cable advertising.

New Research Findings 33
A regression was also run linking total DoD contracts (expressed in logarithms) with all Ser-vice advertising. The details of this regression are provided in Table 2. As in the case of the Army-only model, the coefficients representing the advertising effect (k, u) were positive and highly significant. The results suggest that nearly 40,000 contracts could be attributed to mili-tary advertising.
It is also the case that even more contracts could have been signed on an annual basis if the advertising budget had been higher. The results indicate that an extra $100 million annual could attract nearly 20,000 recruits.
This regression, because it does not isolate the cross-Service enlistment flows, does not provide enough information to come to strong conclusions about the competition between Services. However, because the overall expansion effect is significant, one can conclude that, at least on average, a Service’s program does more than merely draw enlistees who would have joined another Service.

34 The Cost-Effectiveness of Military Advertising: Evidence from 2002–2004
Table 2Regression Results: Log of Total DoD Contracts
Variable Coefficient Standard Error
Intercept –5.1041 0.2540
log(recruiters) 0.2963 0.0076
2003 fiscal year (0,1) –0.0637 0.0090
2004 fiscal year –0.1345 0.0091
February –0.1577 0.0137
March –0.1891 0.0157
April –0.1835 0.0161
May –0.2132 0.0148
June 0.0254 0.0130
July 0.0966 0.0132
August 0.0497 0.0131
September –0.0034 0.0138
October –0.0438 0.0154
November –0.2533 0.0153
December –0.3102 0.0146
Mountain region 0.1441 0.0183
North Central region 0.0526 0.0114
South 0.1935 0.0122
% Black 1.5375 0.0617
% Hispanic 2.0112 0.0524
log(unemployment rate) 0.1637 0.0112
% college –0.0013 0.0007
Ratio veterans age 33–42 1.3760 0.1298
Ratio veterans age 43–55 1.0808 0.1227
Ratio veterans age 56–65 –0.7045 0.1505
Ratio veterans age 66–72 –0.3110 0.2059
Ratio veterans age 73 plus 0.0365 0.0569
% rural population –1.1315 0.2634
% urban population –1.7875 0.2542
% cluster population –1.2585 0.2617
% retail employment –0.0281 0.2222
% construction –0.3036 0.2392
% food services 0.6365 0.2923
% manufacturing –0.8404 0.0540
% health care services –0.7260 0.1206
Television ads
k 0.2551 0.0144
u 0.9737 0.0287
R-squared 0.410

35
Implications for Policy and Future Research
We now turn to a discussion of the policy implications of these results and conclude by identi-fying remaining knowledge gaps.
36 The Cost-Effectiveness of Military Advertising: Evidence from 2002–2004
The results strongly suggest that advertising remained cost-effective during the early 2000s. But could the program be made even more cost-effective?
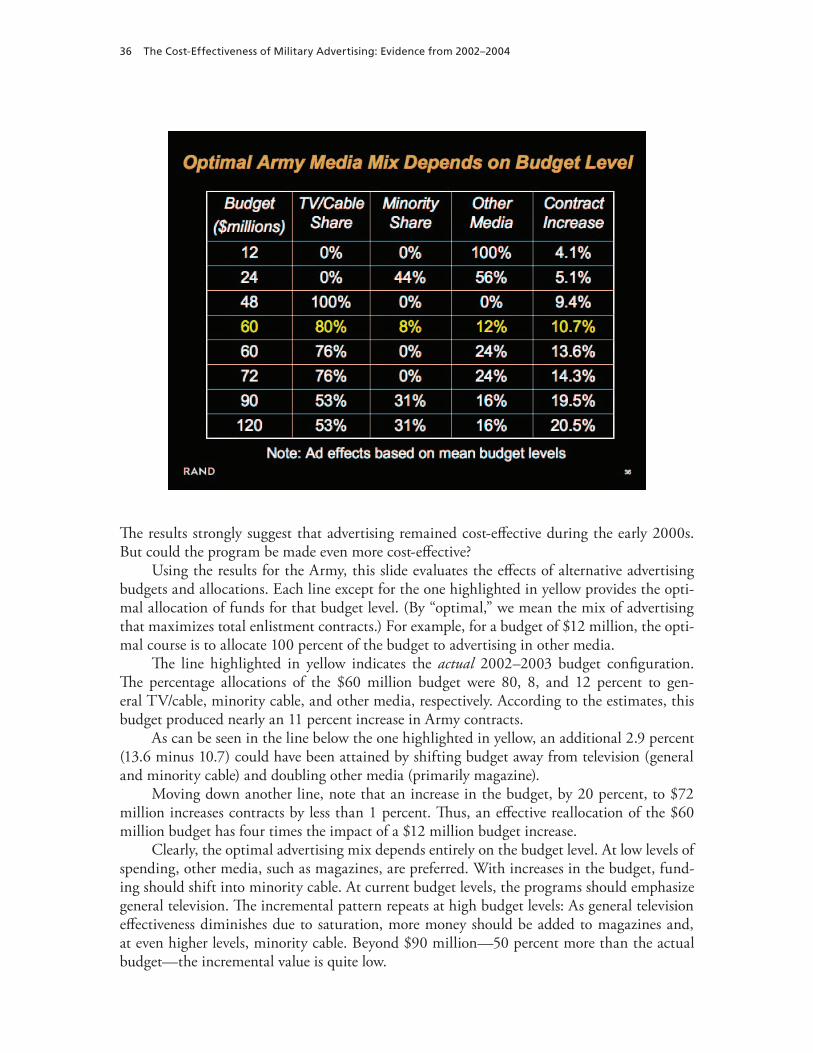
Using the results for the Army, this slide evaluates the effects of alternative advertising budgets and allocations. Each line except for the one highlighted in yellow provides the opti-mal allocation of funds for that budget level. (By “optimal,” we mean the mix of advertising that maximizes total enlistment contracts.) For example, for a budget of $12 million, the opti-mal course is to allocate 100 percent of the budget to advertising in other media.
The line highlighted in yellow indicates the actual 2002–2003 budget configuration. The percentage allocations of the $60 million budget were 80, 8, and 12 percent to gen-eral TV/cable, minority cable, and other media, respectively. According to the estimates, this budget produced nearly an 11 percent increase in Army contracts.
As can be seen in the line below the one highlighted in yellow, an additional 2.9 percent (13.6 minus 10.7) could have been attained by shifting budget away from television (general and minority cable) and doubling other media (primarily magazine).
Moving down another line, note that an increase in the budget, by 20 percent, to $72 million increases contracts by less than 1 percent. Thus, an effective reallocation of the $60 million budget has four times the impact of a $12 million budget increase.
Clearly, the optimal advertising mix depends entirely on the budget level. At low levels of spending, other media, such as magazines, are preferred. With increases in the budget, fund-ing should shift into minority cable. At current budget levels, the programs should emphasize general television. The incremental pattern repeats at high budget levels: As general television effectiveness diminishes due to saturation, more money should be added to magazines and, at even higher levels, minority cable. Beyond $90 million—50 percent more than the actual budget—the incremental value is quite low.
Implications for Policy and Future Research 37
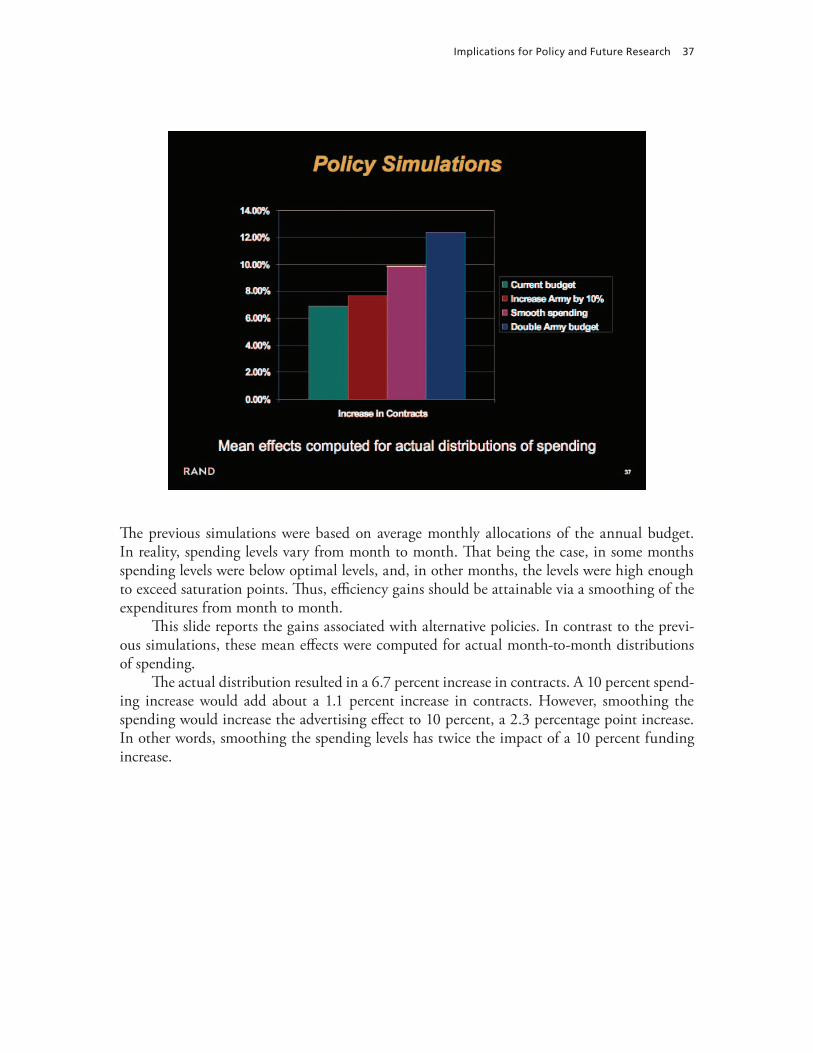
The previous simulations were based on average monthly allocations of the annual budget. In reality, spending levels vary from month to month. That being the case, in some months spending levels were below optimal levels, and, in other months, the levels were high enough to exceed saturation points. Thus, efficiency gains should be attainable via a smoothing of the expenditures from month to month.
This slide reports the gains associated with alternative policies. In contrast to the previ-ous simulations, these mean effects were computed for actual month-to-month distributions of spending.
The actual distribution resulted in a 6.7 percent increase in contracts. A 10 percent spend-ing increase would add about a 1.1 percent increase in contracts. However, smoothing the spending would increase the advertising effect to 10 percent, a 2.3 percentage point increase. In other words, smoothing the spending levels has twice the impact of a 10 percent funding increase.
38 The Cost-Effectiveness of Military Advertising: Evidence from 2002–2004
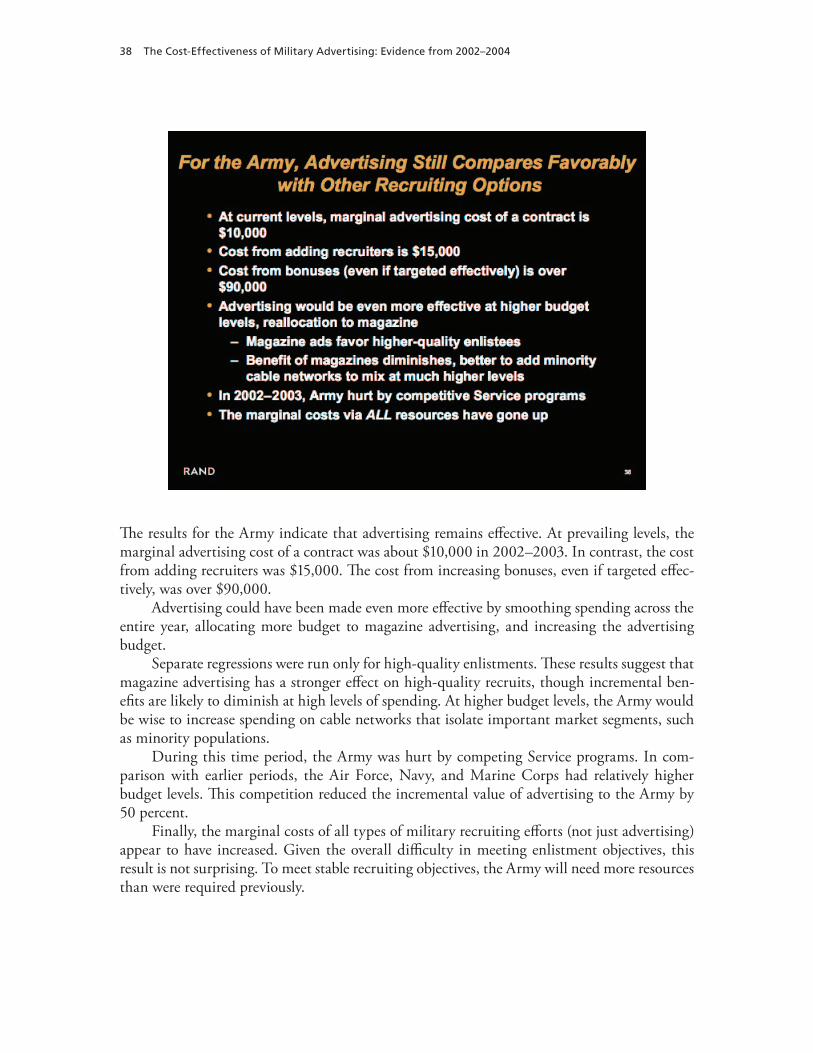
The results for the Army indicate that advertising remains effective. At prevailing levels, the marginal advertising cost of a contract was about $10,000 in 2002–2003. In contrast, the cost from adding recruiters was $15,000. The cost from increasing bonuses, even if targeted effec-tively, was over $90,000.
Advertising could have been made even more effective by smoothing spending across the entire year, allocating more budget to magazine advertising, and increasing the advertising budget.
Separate regressions were run only for high-quality enlistments. These results suggest that magazine advertising has a stronger effect on high-quality recruits, though incremental ben-efits are likely to diminish at high levels of spending. At higher budget levels, the Army would be wise to increase spending on cable networks that isolate important market segments, such as minority populations.
During this time period, the Army was hurt by competing Service programs. In com-parison with earlier periods, the Air Force, Navy, and Marine Corps had relatively higher budget levels. This competition reduced the incremental value of advertising to the Army by 50 percent.
Finally, the marginal costs of all types of military recruiting efforts (not just advertising) appear to have increased. Given the overall difficulty in meeting enlistment objectives, this result is not surprising. To meet stable recruiting objectives, the Army will need more resources than were required previously.
Implications for Policy and Future Research 39
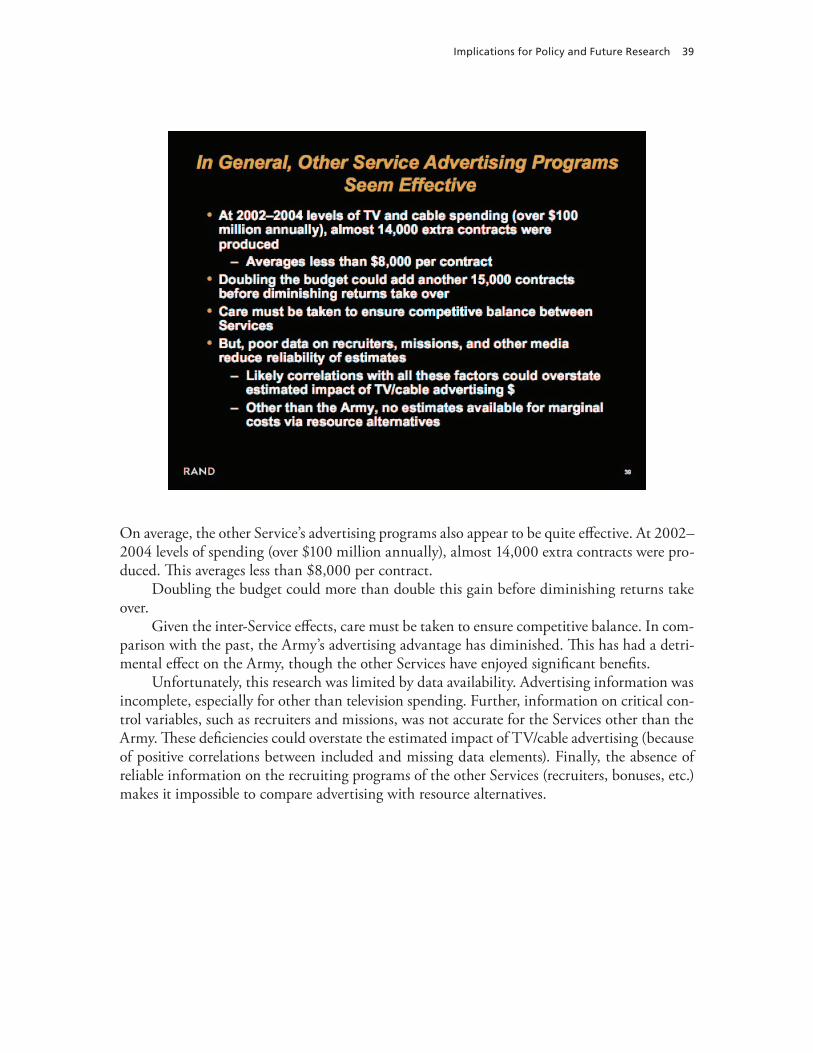
On average, the other Service’s advertising programs also appear to be quite effective. At 2002–2004 levels of spending (over $100 million annually), almost 14,000 extra contracts were pro-duced. This averages less than $8,000 per contract.
Doubling the budget could more than double this gain before diminishing returns take over.
Given the inter-Service effects, care must be taken to ensure competitive balance. In com-parison with the past, the Army’s advertising advantage has diminished. This has had a detri-mental effect on the Army, though the other Services have enjoyed significant benefits.
Unfortunately, this research was limited by data availability. Advertising information was incomplete, especially for other than television spending. Further, information on critical con-trol variables, such as recruiters and missions, was not accurate for the Services other than the Army. These deficiencies could overstate the estimated impact of TV/cable advertising (because of positive correlations between included and missing data elements). Finally, the absence of reliable information on the recruiting programs of the other Services (recruiters, bonuses, etc.) makes it impossible to compare advertising with resource alternatives.

40 The Cost-Effectiveness of Military Advertising: Evidence from 2002–2004
Although these results are reliable enough to justify current budget levels, the aforementioned data deficiencies are a major obstacle to being able to fine tune the advertising programs with confidence. In addition, the estimates are somewhat sensitive to functional form, dynamic structure, and methodology. These issues are relevant for all resource options, not just adver-tising. At this time, there is no reliable information on the individual Services other than the Army. But, the results justify the programs overall.
To be able to set budget levels and allocate dollars effectively, additional research is neces-sary. But, although the methodology is well-developed, additional research would have little pay off without a stronger commitment on the part of OSD, the military branches (including the reserves) to gather required information. Such data should include accurate mission and recruiter information, down to local geographic units. In addition to local television impres-sion data, impression information for print media and, especially, alternative media (such as the Internet) must be routinely gathered and made available to researchers on a timely basis.