the art of put selling: a 10 year study -...
TRANSCRIPT

April 4, 2013
The Art of Put Selling: A 10
year study
Options Research
The search for high yield, low volatility leads to put selling
We expect put selling to become an increasingly common strategy as the
search for yield continues. Equity put selling provides a high current yield,
low volatility returns, and outperforms both bonds and equity in flat market
environments. We estimate that short puts account for 25% of all mutual
fund option positions; another 60% of options positions are buy-writes
which have a similar risk/return profile.
Selling puts: Higher yield and less risk than buying stocks
Over the past 10 years, selling listed 1-month at-the-money puts in S&P
500 stocks allowed investors to collect 3.4% per month in premiums and
showed 7.1% annualized returns with a 12% standard deviation. Over the
same period, the S&P 500 annualized total return was 7.3% with an 18%
standard deviation. The put selling Sharpe ratio was 1.3 times the SPXTR.
Many investors shy away from put selling because they view it as a “high
risk strategy.” Our results quantify the risk reduction and lower draw-
downs of put selling strategies relative to stock portfolios.
Case Study: Using fundamentals to boost returns
We find that choosing stocks and strikes based on Free Cash Flow (FCF)
yield dramatically improved put selling returns. Selling puts on stocks with
FCF yield in the top quintile each month led to annualized return 250bps
higher than the SPXTR and a Sharpe ratio 1.7 times the SPXTR. Further,
choosing put strikes on each stock based on their FCF yield led to a Sharpe
ratio 2.7 times the SPXTR.
FCF Put selling outperformed stocks by 250bps annually with lower vol Put selling on high FCF stocks (top quintile), S&P 500, and iBoxx IG
Goldman Sachs Research; 1-month listed 50-delta put selling.
RELATED RESEARCH
“Bond Buyers Equity Basket,” November 14, 2012.
“Overwriting Observations: a 16 year study,” January 19,
2012.
“Finding Alpha: a 16-year study of index overwriting,”
February 6, 2012.
“Mutual Fund Considerations: Enhancing Alpha with
options,” November 27, 2012.
John Marshall
(212) 902-6848 [email protected] Goldman, Sachs & Co.
Krag Gregory, Ph.D.
(212) 357-3770 [email protected] Goldman, Sachs & Co.
Katherine Fogertey
(212) 902-6473 [email protected] Goldman, Sachs & Co.
Goldman Sachs does and seeks to do business with companies covered in its research reports. As a result, investorsshould be aware that the firm may have a conflict of interest that could affect the objectivity of this report. Investorsshould consider this report as only a single factor in making their investment decision. For Reg AC certification and otherimportant disclosures, see the Disclosure Appendix, or go to www.gs.com/research/hedge.html. Analysts employed bynon-US affiliates are not registered/qualified as research analysts with FINRA in the U.S. This report is intended fordistribution to GS institutional clients only.
The Goldman Sachs Group, Inc. Goldman Sachs Global Economics, Commodities and Strategy Research
80
100
120
140
160
180
200
220
240
260
280
2003 2004 2005 2006 2007 2008 2009 2010 2011 2012 2013
Growth of $100 since 2003
PUT SELLING on high FCF stocks
EQUITY: S&P 500 total return
BONDS: Investment Grade index
(IBOXIG)

April 4, 2013 United States
Goldman Sachs Global Economics, Commodities and Strategy Research 2
Contents
Portfolio Manager Summary 3
Passive put selling returns over the past 10 years 4
Put selling across market environments 5
Strike selection and impact on risk/return 6
Stock/Strike Selection: Fundamentals add value 8
Stock selection based on Implied Volatility and Market Cap 8
Strike Selection based on Free Cash Flow yield 9
Term Selection: 1-month put selling outperforms 12-month 11
Managing risk: Portfolio weighting to improve risk adjusted return 12
The Volatility Risk Premium (VRP): Why put selling works 13
Why does the Volatility Risk Premium (VRP) exist? 14
Transaction costs for options have fallen as liquidity has grown 15
Appendix A: The Basics of Put Selling 17
Risks of put sale 18
Appendix B: Put Selling vs. Buy-write strategies 19
Appendix C: Methodology details and study overview 20
Disclosure Appendix 21

April 4, 2013 United States
Goldman Sachs Global Economics, Commodities and Strategy Research 3
Portfolio Manager Summary
We expect put selling to grow in popularity as investors search for strategies with (1)
high current yield, (2) low volatility, and (3) strong returns in flat market
environments. Put selling activity is most notable among investors with flexibility to invest
across asset classes. We estimate that short puts account for 25% of all mutual fund option
positions; another 60% are buy-write positions with a similar risk/return profile based on
our analysis of SEC filings. Growth has come from both traditional equity investors in
search of low volatility strategies as well as fixed income investors in search of yield with a
margin of safety no longer provided by bonds with low absolute yields.
In this report, we quantify three key benefits of put selling:
High current income: Selling at-the-money puts allowed investors to collect 3.4% per
month in income (40% annually) over the past 10 years. We believe these put
premiums are an attractive source of yield for equity and fixed income investors alike.
Low volatility: The volatility of a portfolio that sells at-the-money puts on S&P 500
stocks has been 12% over the past 10 years in comparison to 18% for the S&P 500 total
return and 7% for the Investment Grade Bond index (iBoxx IG).
Strong returns above bonds, although modestly below stocks. Selling at-the-
money 1-month puts realized an annualized return of 7.1% vs. the total return of the
S&P 500 of 7.3% and total return of the Investment Grade index (iBoxx IG) of 6.5%.
Stock/Strike Selection with Fundamentals
Choosing Stocks with high FCF yield has systematically improved passive put
selling results (added +250bps annually without adding volatility) and has greatly
outperformed the risk adjusted returns of simple screening methodologies based on
absolute implied volatility or market cap.
Choosing Strikes based on FCF yield improved put selling results further to
achieve a Sharpe ratio of 1.35 over the past 10 years, nearly triple the SPXTR.
Choosing Term: We find selling 1-month options had higher returns and risk adjusted
returns than 12-month over the past 10 years.
Risk/Pushback: Put selling is widely regarded as a “dangerous trade”
We believe put selling activity is constrained by the common misperception that selling
puts carries higher risk than owning stocks. After all, if buying a put makes your portfolio
safer, than shouldn’t selling a put make your portfolio riskier. In reality, selling fully-
collateralized puts is less risky than buying stocks. The premium collected acts like a
cushion if shares should fall. In 2008, ATM put selling outperformed the SPXTR by 14%.
Volatility risk premium: Why put selling has higher risk-adjusted-returns than equity
Put sellers not only benefit from the equity risk premium (ERP) that drives stock returns
over time, but also benefit from the volatility risk premium (VRP), which leads to
systematically overpriced options. We illustrate the benefits by comparing the options
implied and actual realized distribution of monthly returns over the past 10 years.
Options prices and volatility levels in this note are indicative only, and are based on our
estimates of recent mid-market levels and exclude transaction costs, unless otherwise
stated. Practical implementation of any trading strategy discussed herein may not be
achievable and as a result, any projected results of any such trading strategy discussed
herein may not be replicable.
What is Put selling?
Selling a put option on
a stock to collect a
premium for agreeing
to buy shares at a
specific strike price
should it drop below
that level by expiration.
See page 17 for Basics
of put selling.
Key Risk: Put sellers
risk losses if stocks
drop below the strike
price by more than the
premium they have
collected.
April 4, 2013 United States
Goldman Sachs Global Economics, Commodities and Strategy Research 4
Passive put selling returns over the past 10 years
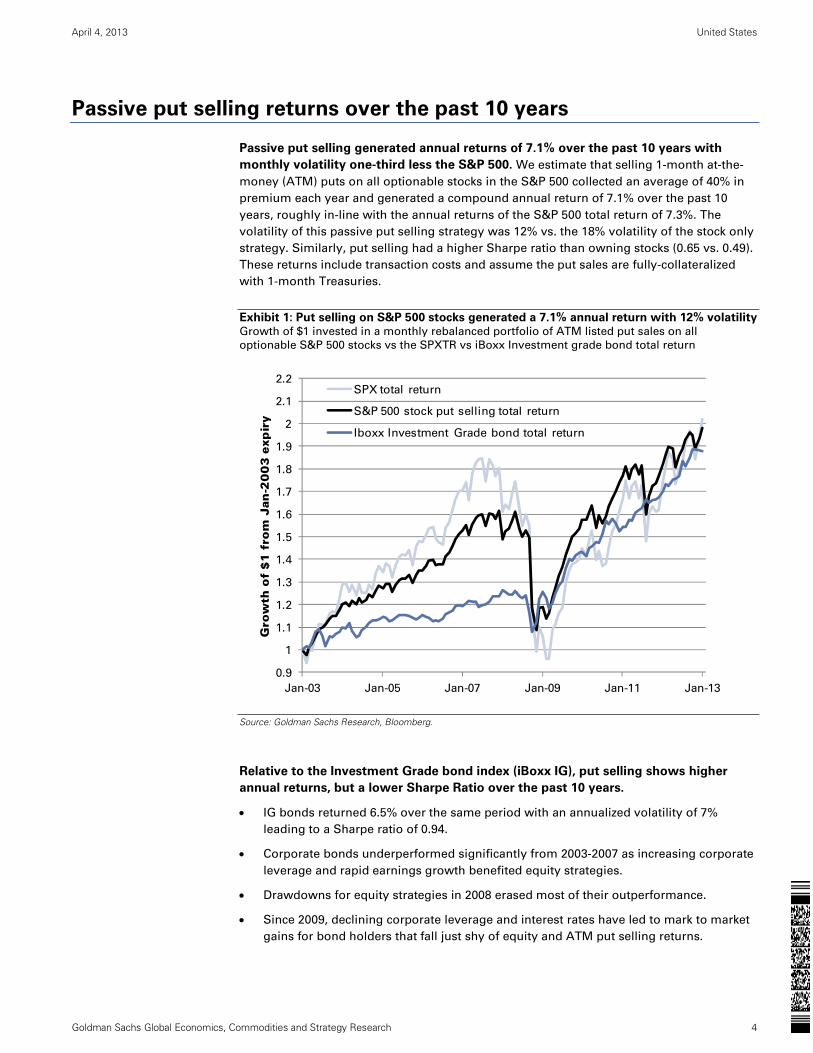
Passive put selling generated annual returns of 7.1% over the past 10 years with
monthly volatility one-third less the S&P 500. We estimate that selling 1-month at-the-
money (ATM) puts on all optionable stocks in the S&P 500 collected an average of 40% in
premium each year and generated a compound annual return of 7.1% over the past 10
years, roughly in-line with the annual returns of the S&P 500 total return of 7.3%. The
volatility of this passive put selling strategy was 12% vs. the 18% volatility of the stock only
strategy. Similarly, put selling had a higher Sharpe ratio than owning stocks (0.65 vs. 0.49).
These returns include transaction costs and assume the put sales are fully-collateralized
with 1-month Treasuries.
Exhibit 1: Put selling on S&P 500 stocks generated a 7.1% annual return with 12% volatility Growth of $1 invested in a monthly rebalanced portfolio of ATM listed put sales on all
optionable S&P 500 stocks vs the SPXTR vs iBoxx Investment grade bond total return
Source: Goldman Sachs Research, Bloomberg.
Relative to the Investment Grade bond index (iBoxx IG), put selling shows higher
annual returns, but a lower Sharpe Ratio over the past 10 years.
IG bonds returned 6.5% over the same period with an annualized volatility of 7%
leading to a Sharpe ratio of 0.94.
Corporate bonds underperformed significantly from 2003-2007 as increasing corporate
leverage and rapid earnings growth benefited equity strategies.
Drawdowns for equity strategies in 2008 erased most of their outperformance.
Since 2009, declining corporate leverage and interest rates have led to mark to market
gains for bond holders that fall just shy of equity and ATM put selling returns.
0.9
1
1.1
1.2
1.3
1.4
1.5
1.6
1.7
1.8
1.9
2
2.1
2.2
Jan-03 Jan-05 Jan-07 Jan-09 Jan-11 Jan-13
Gro
wth
of
$1
fro
m J
an-2
00
3 e
xpir
y
SPX total return
S&P 500 stock put selling total return
Iboxx Investment Grade bond total return

April 4, 2013 United States
Goldman Sachs Global Economics, Commodities and Strategy Research 5
Put selling across market environments
Put selling provides steady returns in bullish market environments and moderate
draw-downs in sharp downside scenarios. In up months, put selling participated in 66%
of the upside of the S&P 500, while in down months, put selling only participated in 55% of
the downside of the S&P 500.
In years when the S&P 500 was up, put selling underperformed equity by 3.7% on
average while outperforming the Investment grade bond index by 5.1% on average.
(Chart 2 in Exhibit 2)
In years when the S&P 500 was down (2007 and 2008), put selling outperformed the
S&P 500 total return by 3% and 14%, respectively, while underperforming the bond
index by 8% and 20%, respectively. (Chart 3 in Exhibit 2)
Exhibit 2: Put selling showed positive performance in 8 of the past 10 years 1-month ATM put selling vs. SPXTR vs. Investment Grade Bonds (iBoxx IG Index)
Source: Goldman Sachs Research.
-40%
-30%
-20%
-10%
0%
10%
20%
30%
40%
50%
2003 2004 2005 2006 2007 2008 2009 2010 2011 2012 CAGR
Retu
rn (
%)
S&P 500 total return
S&P 500 stock PUT SELLING total return
Investment Grade bond total return, Iboxx
Put selling offers the same
return as equities, with
lower drawdown risk.
-10%
-5%
0%
5%
10%
15%
20%
2003 2004 2005 2006 2007 2008 2009 2010 2011 2012 CAGR
Outp
erfo
rmance Put selling - S&P 500 total return Put selling outperformed
SPXTR in years of weak
equity performance
-30%
-20%
-10%
0%
10%
20%
30%
2003 2004 2005 2006 2007 2008 2009 2010 2011 2012 CAGR
Outp
erf
orm
ance Put selling - iBoxx IG total return Put selling outperformed
bonds in years of strong
equity performance

April 4, 2013 United States
Goldman Sachs Global Economics, Commodities and Strategy Research 6
Premiums collected across market environments: On average, 1-month ATM put selling
generated premiums of 3.4% per month for an average annual premium of 40%. Monthly
put premiums reached a maximum of 9.1% during the 2008 crisis, a low of 2.1% in early
2007, and 2.5% in the last month of 2012.
Exhibit 3: Put selling showed positive performance in 8 of the past 10 years 1-month ATM delta put selling vs. SPXTR vs. Investment Grade Bonds (iBoxx IG Index)
Source: Goldman Sachs Research.
Strike selection and impact on risk/return
Selling further out-of-the-money (OTM) puts increased the Sharpe ratio of the
strategy, but reduced the absolute annual returns. We studied selling puts on all stocks
in the S&P 500 at strike prices based on their moneyness (ATM to 15%OTM), their
sensitivity to stock price moves (20-delta to 70-delta), and a target premium collected (1%-
3% per month).
Strike choice methodologies vary across investor types and similarly we don’t find a
particular methodology dominates our study. Most fundamental investors prefer to
target a particular moneyness when selling puts; Yield focused investors prefer to target a
particular premium; and volatility traders tend to focus on delta targeting strategies. The
data does not suggest that any particular standard strike targeting methodologies are
superior to others.
Balancing return and Sharpe Ratio: While selling a 70-delta put provided the highest
annualized return over the period (7.4%), it also had one of the lowest sharp ratios (+0.55).
We find that selling 15% OTM puts or targeting premium collected each month provided
the highest Sharpe Ratios at (+0.83 to +0.85), but shows the lowest absolute level of
annualized return (+4.3% to 5.0%).
42%
35%32% 32%
35%
62%
55%
38%40%
32%
40%
0%
10%
20%
30%
40%
50%
60%
70%
2003 2004 2005 2006 2007 2008 2009 2010 2011 2012 Avg
Pre
miu
m c
ollec
ted
(1
2 m
on
ths)
% premium collected for selling puts has
varied from 32% to
62% annually

April 4, 2013 United States
Goldman Sachs Global Economics, Commodities and Strategy Research 7
Exhibit 4: Fully Collateralized 1-month passive put selling performance from Jan-2003 to Jan-2013 1-mo put selling strategies, index weighted for all optionable stocks; closest listed strike to target delta, moneyness, premium
Source: Goldman Sachs Research.
Put selling returns can be leveraged by holding less than 100% collateral. This
proportionately increases the monthly return and volatility. ATM put selling (12%
volatility) was a lower risk strategy than owning the S&P 500 (18% volatility). When
comparing the return, it is important to compare strategies of equal risk. Leveraging put
selling returns is accomplished by holding less collateral (typically cash or high grade
bonds). For example an ATM put selling strategy collateralized with only $67 for every $100
in notional value of puts sold has a volatility of 18% and an annualized return of 10.1%. We
view this as the “risk-equivalent” return to compare to an equity portfolio. In the right most
columns of Exhibit 4 we show the “risk-equivalent” return and collateral level.
Some investors may not be permitted to leverage put selling returns. Generally, we
find that mutual funds are required to fully-collateralize put sales with cash, treasuries or
other high grade debt instruments. The ability for others to hold less than 100% collateral
depends on exchange rules and collateral arrangements with their financial institution.
Exhibit 5: Strike selection is a tradeoff between potential return and Sharpe ratio Annualized return and Sharpe ratio for 1-month put selling
Source: Goldman Sachs Research.
SPXTR RiskCompound
Return (%) StdDev
Sharpe
Ratio Mean Median Min Max StdDev
Avg.
% OTM
Avg. Prem
(%)
Bid‐Ask
Spread (%)
% times
exercised
Equivalent
CAGR
Risk Equivalent
% collateralized
S&P 500TR 7.3% 18% 0.49 0.72% 1.7% ‐24.9% 13.3% 5.1%
Strategy: Specified Moneyness (1 month puts)
0% OTM 7.1% 12% 0.65 0.63% 1.6% ‐20.8% 9.1% 3.4% ‐0.1% 3.4% 7.3% 45% # 10.1% 67%
2% OTM 6.6% 11% 0.66 0.59% 1.4% ‐20.1% 8.6% 3.1% 1.8% 2.6% 8.7% 35% # 10.4% 60%
5% OTM 5.9% 9% 0.68 0.51% 1.1% ‐18.4% 7.8% 2.6% 4.6% 1.8% 11.3% 23% # 10.7% 51%
10% OTM 5.5% 7% 0.80 0.47% 0.9% ‐15.5% 6.4% 2.0% 9.1% 1.1% 15.0% 12% # 13.0% 40%
15% OTM 5.0% 6% 0.85 0.42% 0.7% ‐14.2% 5.2% 1.7% 12.4% 0.9% 17.6% 10% # 13.8% 34%
Strategy: Specified Delta (1 month puts)
70Delta 7.4% 15% 0.55 0.69% 1.8% ‐23.7% 11.3% 4.3% ‐5.0% 6.5% 5.4% 70% # 8.4% 85%
60Delta 7.1% 14% 0.57 0.65% 1.7% ‐22.7% 10.9% 3.9% ‐2.6% 4.8% 6.1% 58% # 8.8% 78%
50Delta 7.1% 12% 0.63 0.63% 1.6% ‐20.8% 9.9% 3.5% ‐0.3% 3.5% 7.2% 46% # 9.8% 68%
40Delta 6.6% 11% 0.67 0.59% 1.4% ‐19.8% 8.4% 3.0% 2.0% 2.5% 8.6% 34% # 10.5% 60%
30Delta 5.9% 9% 0.71 0.51% 1.2% ‐17.8% 6.4% 2.5% 4.4% 1.7% 10.6% 24% # 11.1% 49%
20Delta 5.0% 7% 0.76 0.43% 0.9% ‐15.0% 4.7% 2.0% 7.2% 1.1% 13.3% 16% # 12.1% 39%
Strategy: Specified Premium collected (1 month puts)
1%Yield 4.3% 5% 0.83 0.37% 0.9% ‐11.2% 3.1% 1.5% 8.5% 0.9% 14.5% 15% # 13.4% 30%
2%Yield 5.8% 8% 0.79 0.50% 1.2% ‐14.3% 3.1% 2.2% 4.7% 1.7% 10.2% 28% # 12.8% 43%
3%Yield 6.8% 9% 0.75 0.59% 1.5% ‐16.9% 3.8% 2.7% 2.2% 2.6% 8.1% 40% # 12.0% 54%
Annualized Monthly Return (%) Option Statistics
0.50
0.55
0.60
0.65
0.70
0.75
0.80
4.0%
4.5%
5.0%
5.5%
6.0%
6.5%
7.0%
7.5%
8.0%
70 60 50 40 30 20
Sh
arp
e R
ati
o
Ret
urn
(C
AG
R)
Delta target for put selling strategy
Return (CAGR) Sharpe ratio
Out of the money options offer higher Sharpe ratios, but lower absolute returns

April 4, 2013 United States
Goldman Sachs Global Economics, Commodities and Strategy Research 8
Stock/Strike Selection: Fundamentals add value
We analyzed the patterns of profitability for put selling based on several fundamental
and non-fundamental factors. We identify several basic attributes correlated with strong
returns and risk adjusted returns including Free Cash Flow (FCF) yield, Market Cap, and
Implied volatility. We find that high FCF yield provided the strongest and most consistent
indicator of put selling performance. While we find many investors focus on selling puts on
high implied volatility stocks, we do not find the Sharpe ratio of that strategy compelling
when done systematically.
Exhibit 6: Stock and Strike selection methodology comparison Sharpe ratio for S&P total return; S&P index weighted 50-delta put selling; equal weighted portfolios of 1-month 50-delta puts
by quintile of factor; 1-month put selling on all optionable stocks targeting premium collected of 1x, 2x, 3x monthly FCF yield
Source: Goldman Sachs research, Bloomberg; High/low refer to the highest and lowest quintile of S&P 500 stocks on each metric.
Stock selection based on Implied Volatility and Market Cap
Selling puts on stocks with high FCF yields outperformed put selling strategies on
low FCF yield stocks, showing both a higher absolute return and higher risk adjusted
return. We estimate a 9.8% annualized return over the past 10 years for selling 50-delta
puts on stocks in the highest quintile based on FCF yield. This return stream had a volatility
of 12%, in line with the volatility of a broad put selling strategy over the same period. We
believe FCF yield has been a valuable proxy for “margin of safety” in equity investments.
Those companies with higher FCF yield likely have higher margins, declining leverage and
a larger cash cushion than their peers. While FCF yield has also been correlated with stock
outperformance over the period, we believe it is a particularly metric useful for identifying
stocks with limited downside.
In our view, the exposure from put selling is most comparable to the yield derived from
credit spreads. In fact, we have shown in our 2010 report, “Turning stocks into bonds using
options” that bond returns can be replicated using stock and options.
Using implied volatility to choose put selling opportunities: Put selling on the highest
implied volatility stocks resulted in stronger outperformance vs. put selling on the lower
implied volatility stocks; however, the volatility of the returns of this strategy was higher,
resulting in a modestly lower Sharpe ratio.
Using market cap to choose put selling opportunities: Larger market cap stocks
appeared to offer higher risk-adjusted returns for put sellers than smaller cap stocks. The
improvement in risk-adjusted returns is mainly derived from the lower volatility of the
strategy; we find that the annualized returns are not significantly different across market
cap.
0.0
0.2
0.4
0.6
0.8
1.0
1.2
1.4
S&P
stocks
S&P
put
selling
Q1 Q2 Q3 Q4 Q5 Q1 Q2 Q3 Q4 Q5 Q1 Q2 Q3 Q4 Q5 1X 2X 3X
Sh
arp
e ra
tio
Stock selection criteria Strike selection
FCF yield showed great value in choosing stocks
and put strikes
Small <-- Mkt cap --> Large Low <-- Implied vol --> High Low <-- FCF yield --> High Target FCF yield
April 4, 2013 United States
Goldman Sachs Global Economics, Commodities and Strategy Research 9
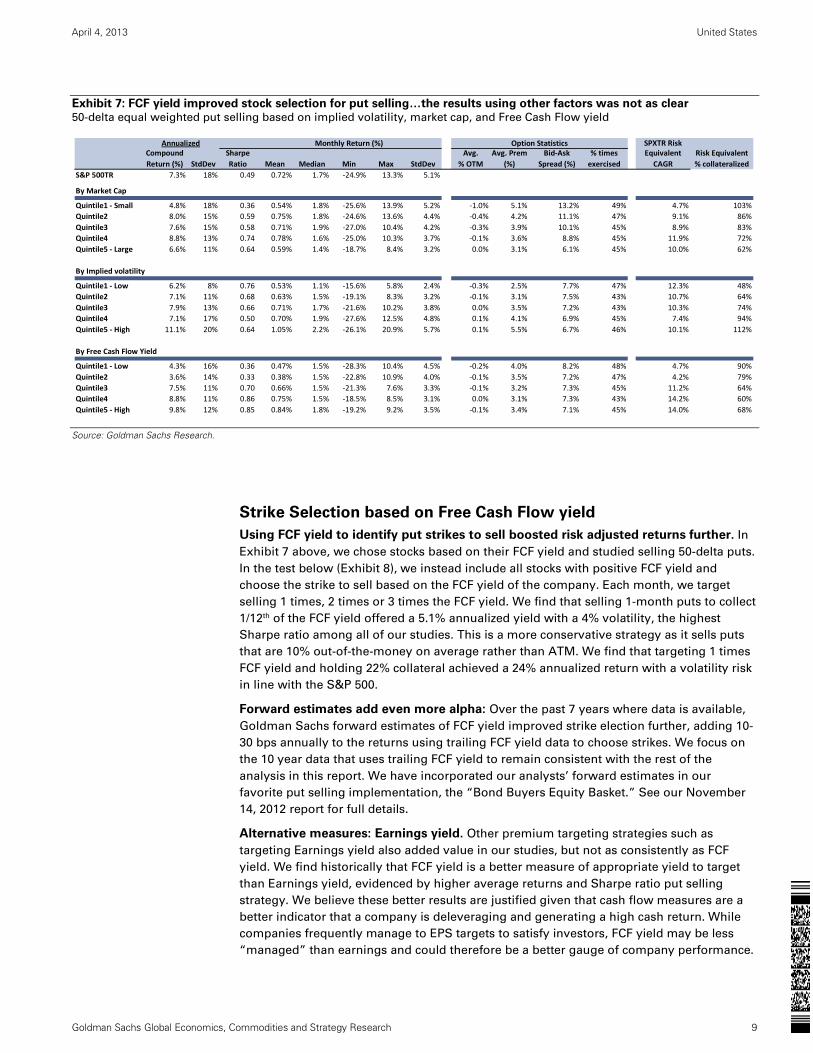
Exhibit 7: FCF yield improved stock selection for put selling…the results using other factors was not as clear 50-delta equal weighted put selling based on implied volatility, market cap, and Free Cash Flow yield
Source: Goldman Sachs Research.
Strike Selection based on Free Cash Flow yield
Using FCF yield to identify put strikes to sell boosted risk adjusted returns further. In
Exhibit 7 above, we chose stocks based on their FCF yield and studied selling 50-delta puts.
In the test below (Exhibit 8), we instead include all stocks with positive FCF yield and
choose the strike to sell based on the FCF yield of the company. Each month, we target
selling 1 times, 2 times or 3 times the FCF yield. We find that selling 1-month puts to collect
1/12th of the FCF yield offered a 5.1% annualized yield with a 4% volatility, the highest
Sharpe ratio among all of our studies. This is a more conservative strategy as it sells puts
that are 10% out-of-the-money on average rather than ATM. We find that targeting 1 times
FCF yield and holding 22% collateral achieved a 24% annualized return with a volatility risk
in line with the S&P 500.
Forward estimates add even more alpha: Over the past 7 years where data is available,
Goldman Sachs forward estimates of FCF yield improved strike election further, adding 10-
30 bps annually to the returns using trailing FCF yield data to choose strikes. We focus on
the 10 year data that uses trailing FCF yield to remain consistent with the rest of the
analysis in this report. We have incorporated our analysts’ forward estimates in our
favorite put selling implementation, the “Bond Buyers Equity Basket.” See our November
14, 2012 report for full details.
Alternative measures: Earnings yield. Other premium targeting strategies such as
targeting Earnings yield also added value in our studies, but not as consistently as FCF
yield. We find historically that FCF yield is a better measure of appropriate yield to target
than Earnings yield, evidenced by higher average returns and Sharpe ratio put selling
strategy. We believe these better results are justified given that cash flow measures are a
better indicator that a company is deleveraging and generating a high cash return. While
companies frequently manage to EPS targets to satisfy investors, FCF yield may be less
“managed” than earnings and could therefore be a better gauge of company performance.
SPXTR RiskCompound
Return (%) StdDev
Sharpe
Ratio Mean Median Min Max StdDev
Avg.
% OTM
Avg. Prem
(%)
Bid‐Ask
Spread (%)
% times
exercised
Equivalent
CAGR
Risk Equivalent
% collateralized
S&P 500TR 7.3% 18% 0.49 0.72% 1.7% ‐24.9% 13.3% 5.1%
By Market Cap
Quintile1 ‐ Small 4.8% 18% 0.36 0.54% 1.8% ‐25.6% 13.9% 5.2% ‐1.0% 5.1% 13.2% 49% # 4.7% 103%
Quintile2 8.0% 15% 0.59 0.75% 1.8% ‐24.6% 13.6% 4.4% ‐0.4% 4.2% 11.1% 47% # 9.1% 86%
Quintile3 7.6% 15% 0.58 0.71% 1.9% ‐27.0% 10.4% 4.2% ‐0.3% 3.9% 10.1% 45% # 8.9% 83%
Quintile4 8.8% 13% 0.74 0.78% 1.6% ‐25.0% 10.3% 3.7% ‐0.1% 3.6% 8.8% 45% # 11.9% 72%
Quintile5 ‐ Large 6.6% 11% 0.64 0.59% 1.4% ‐18.7% 8.4% 3.2% 0.0% 3.1% 6.1% 45% # 10.0% 62%
By Implied volatility
Quintile1 ‐ Low 6.2% 8% 0.76 0.53% 1.1% ‐15.6% 5.8% 2.4% ‐0.3% 2.5% 7.7% 47% # 12.3% 48%
Quintile2 7.1% 11% 0.68 0.63% 1.5% ‐19.1% 8.3% 3.2% ‐0.1% 3.1% 7.5% 43% # 10.7% 64%
Quintile3 7.9% 13% 0.66 0.71% 1.7% ‐21.6% 10.2% 3.8% 0.0% 3.5% 7.2% 43% # 10.3% 74%
Quintile4 7.1% 17% 0.50 0.70% 1.9% ‐27.6% 12.5% 4.8% 0.1% 4.1% 6.9% 45% # 7.4% 94%
Quintile5 ‐ High 11.1% 20% 0.64 1.05% 2.2% ‐26.1% 20.9% 5.7% 0.1% 5.5% 6.7% 46% # 10.1% 112%
By Free Cash Flow Yield
Quintile1 ‐ Low 4.3% 16% 0.36 0.47% 1.5% ‐28.3% 10.4% 4.5% ‐0.2% 4.0% 8.2% 48% # 4.7% 90%
Quintile2 3.6% 14% 0.33 0.38% 1.5% ‐22.8% 10.9% 4.0% ‐0.1% 3.5% 7.2% 47% # 4.2% 79%
Quintile3 7.5% 11% 0.70 0.66% 1.5% ‐21.3% 7.6% 3.3% ‐0.1% 3.2% 7.3% 45% # 11.2% 64%
Quintile4 8.8% 11% 0.86 0.75% 1.5% ‐18.5% 8.5% 3.1% 0.0% 3.1% 7.3% 43% # 14.2% 60%
Quintile5 ‐ High 9.8% 12% 0.85 0.84% 1.8% ‐19.2% 9.2% 3.5% ‐0.1% 3.4% 7.1% 45% # 14.0% 68%
Annualized Monthly Return (%) Option Statistics

April 4, 2013 United States
Goldman Sachs Global Economics, Commodities and Strategy Research 10
Exhibit 8: Free Cash Flow yield targeting improves on the risk-reward of put selling over passive strategies Put selling on S&P 500 stocks based on 1, 2 and 3 times the trailing Free Cash Flow yield of the stock (index weighted)
Source: Goldman Sachs Research.
SPXTR RiskCompound
Return (%) StdDev
Sharpe
Ratio Mean Median Min Max StdDev
Avg.
% OTM
Avg. Prem
(%)
Bid‐Ask
Spread (%)
% times
exercised
Equivalent
CAGR
Risk Equivalent
% collateralized
S&P 500TR 7.3% 18% 0.49 0.72% 1.7% ‐24.9% 13.3% 5.1%
Strategy: Specified Premium based on Free Cash Flow yield (1 month puts)
1xFCFY 5.1% 4% 1.35 0.43% 0.6% ‐6.5% 3.4% 1.1% 10.2% 0.8% 16.2% 11% # 24.3% 22%
2xFCFY 5.5% 6% 0.98 0.46% 0.9% ‐10.9% 3.4% 1.6% 7.5% 1.1% 13.5% 18% # 16.6% 32%
3xFCFY 6.3% 7% 0.96 0.53% 1.1% ‐12.3% 3.7% 1.9% 5.8% 1.5% 11.9% 23% # 16.2% 38%
Annualized Monthly Return (%) Option Statistics

April 4, 2013 United States
Goldman Sachs Global Economics, Commodities and Strategy Research 11
Term Selection: 1-month put selling outperforms 12-month
Selling puts once a year reduces operational costs and transaction costs, but returns
have been lower than 1-month put selling over the past 10 years. In our view, 12-
month put selling less efficiently harvests the volatility risk premium than 1-month put
selling strategies. 12-month put selling on optionable S&P 500 stocks showed a compound
annual growth rate of 6.3% with a standard deviation of 14% (50-delta).
In Exhibit 9, we show the performance summary for 12-month put selling strategies across
both moneyness and delta targeting strategies. Similar to 1-month put selling, the Sharpe
ratios for the further out of the money puts were higher; however, the absolute return was
lower.
Advantages of 12-month put selling over 1-month put selling
Lower annual transaction costs: We estimate in 2012, 12-month put sellers spent 52 bps
of the portfolio on bid-mid spread vs. 1-month put sellers which spent 72 bps(50-delta).
Fewer transactions mean lower operational costs for 12-month put selling relative to 1-
month put selling.
Less path dependency in 12-month strategies benefits investors with long-term views. 1-
month put selling strategies may underperform in highly volatile markets as losses in some
months are not able to be made up in others; 12-month put selling returns are only realized
once a year allowing for more month-to-month volatility.
Disadvantages of 12-month put selling over 1-month put selling
Lower premiums collected: Premium collected annually for selling 1-month 50-delta puts
is 40% annually with the premium collected for selling 12-month 50-delta puts is only 14%.
While a smaller number of 12-month put-sales experience losses than 1-month put-sales,
this is not enough to erode the high level of premium collected for 1-month put-sales.
Lower average returns and lower Sharpe ratios for 12-month put selling relative to 1-
month (table below).
Exhibit 9: Annual put selling reduces the number of transactions, but also has a lower average return annualized return and standard deviation of 12-month put selling strategy on S&P 500 index weighted constituents, Jan-2003 to
Jan-2013
Source: Goldman Sachs Research estimates.
Compound
Return (%) StdDev
Sharpe
Ratio Mean Median Min Max StdDev
Avg.
% OTM
Avg. Prem
(%)
Avg Bid‐Ask
Spread (%)
% Times
exercised
S&P 500TR 7.3% 19% 0.47 9.1% 12.6% ‐34.3% 36.8% 19.5%
Strategy: Specified Moneyness (12 month puts)
0% OTM 5.8% 13% 0.52 6.6% 9.0% ‐23.1% 24.5% 12.7% 0% 11% 4.1% 36%
2% OTM 5.7% 12% 0.52 6.4% 8.8% ‐22.5% 24.0% 12.3% 2% 11% 4.3% 33%
5% OTM 5.5% 12% 0.53 6.1% 8.4% ‐21.2% 23.0% 11.6% 5% 9% 4.7% 28%
10% OTM 5.0% 10% 0.53 5.5% 7.5% ‐18.5% 21.0% 10.3% 10% 7% 5.5% 23%
15% OTM 4.6% 9% 0.55 5.0% 6.5% ‐16.3% 19.4% 9.2% 15% 6% 6.7% 18%
Strategy: Specified Delta (12 month puts)
70Delta 7.1% 17% 0.50 8.5% 10.5% ‐29.4% 33.9% 17.0% # ‐20% 24% 2.9% 68%
60Delta 6.9% 16% 0.51 8.1% 9.8% ‐27.6% 32.7% 16.0% # ‐12% 19% 3.2% 56%
50Delta 6.3% 14% 0.50 7.3% 9.5% ‐25.5% 29.5% 14.5% # ‐5% 14% 3.7% 44%
40Delta 5.6% 13% 0.50 6.4% 8.6% ‐22.6% 25.3% 12.6% # 2% 10% 4.4% 32%
30Delta 4.8% 10% 0.52 5.3% 7.3% ‐18.4% 20.3% 10.1% # 10% 7% 5.4% 23%
20Delta 3.8% 8% 0.54 4.1% 5.7% ‐14.0% 14.7% 7.6% # 19% 4% 7.4% 15%
Annualized Annual Return (%) Option Statistics

April 4, 2013 United States
Goldman Sachs Global Economics, Commodities and Strategy Research 12
Managing risk: Portfolio weighting to improve risk adjusted return
After determining which stocks and strikes to sell, the next question becomes how to
assemble put sales in a portfolio. For the studies above, we have focused on equity index
weighted exposure to aid in comparison with equity only portfolios. We find risk based
weighting methodologies can improve the risk/return profile of put selling portfolios
similar to stock portfolios. We use implied volatility and delta as a guide when assembling
the portfolio and find that each improved the Sharpe ratio over the past decade.
Risk based portfolio weighting for put sales
We base our portfolio weighting on the idea that ignoring difference in correlations among
the assets, the minimum variance portfolio is the one where each asset has equal risk.
Faced with a diverse group of stocks with put strikes that vary across these stocks, we
define risk as the implied volatility of each stock multiplied by the delta of the put sale of
the same stock. For instance, we would consider a 50-delta put sale on a 40 vol stock as
twice as risky as a 50-delta put sale on a 20 vol stock and would therefore have half the
weight in that put sale. Similarly, a 25-delta put sale on a 15 vol stock would have only half
the risk of a 50-delta put sale on the same stock and would also warrant twice the weight.
By equalizing the initial volatility adjusted delta risk to each stock in the portfolio, the initial
risk to each asset is equal.
The risk neutral weighting methodology tends to overweight the lower delta, lower
volatility put sales in the portfolio leading to a higher Sharpe ratio, despite a
modestly lower average return. We estimate that an equal weighted portfolio of 12
month put sales with strikes based on the FCF yield of the underlying stock produced an
average annualized return of 4.1% (0.59 Sharpe Ratio). Using the same stocks and strikes,
but weighting the portfolio such that there was equal delta risk in each name led to a 3.8%
annualized return with a Sharpe ratio of 0.69. Equal risk weighting determined by delta
times 12-month implied volatility led to a return of 3.8% with a Sharpe Ratio of 0.72.
Exhibit 10: Equal risk allocation leads to only marginally
lower average returns… 12m put selling annualized returns for equal dollar, equal
notional exposure and volatility adjusted equal notional
allocations using FCFY as target yields
Exhibit 11: …but leads to an even higher Sharpe ratio Sharpe ratio of 12m put selling for equal dollar, equal
notional exposure and volatility adjusted equal notional
allocations using FCFY as target yields
Source: Goldman Sachs Research.
Source: Goldman Sachs Research.
4.1%
3.8%
3.8%
3.5%
3.6%
3.7%
3.8%
3.9%
4.0%
4.1%
4.2%
Equal allocation Notional weighted
allocation
Notional & Volatility
weighted allocation
Average return
0.59
0.69
0.72
0.50
0.55
0.60
0.65
0.70
0.75
Equal allocation Notional weighted
allocation
Notional & Volatility
weighted allocation
Sharpe ratio
We use risk based portfolio weighting in the “Bond Buyers Equity Basket”; see November 14, 2012 report.

April 4, 2013 United States
Goldman Sachs Global Economics, Commodities and Strategy Research 13
The Volatility Risk Premium (VRP): Why put selling works
Put selling is one method of harvesting the Volatility Risk Premium (VRP). We analyze
the shape of the options market implied distribution relative to realized distribution to
illustrate the effects of the volatility risk premium. The VRP boosts the price of options
across strikes, leading to an over-estimation of volatility. We illustrate these differences
using SPX options over the past 10 years. While the VRP may vary in size across index and
single stock options, our study above suggests that puts are systematically overvalued for
both.
Exhibit 12: Options have overestimated volatility and
skew over the past 10 years Average month SPX implied distribution vs. SPX monthly
realized return distribution 2003-2012
Exhibit 13: Put selling takes advantage of the
overestimation of downside volatility Difference between the estimated implied and actual
distribution of monthly returns.
Source: Goldman Sachs Research.
Source: Goldman Sachs Research.
Over the past 10 years options markets have overestimated overall volatility and
directional skew while moderately underestimating tail risk.
(1) Volatility: The average spread between 1-month volatility and subsequent realized
volatility was 3.0 points over the 10 years of our study. The options market prices a
wider distribution of returns than is typically realized by the equity market. In Exhibit 13
above, this can be seen as the positive difference to the left and right of center, as well as
the negative difference in the middle. Over the past 10 years, the average 1-month ATM
volatility has been 20.1% vs. subsequent realized volatility of 17.1%.
(2) Directional skew: The options market typically priced in a higher probability of
down-moves vs. up moves. This can be seen by the positive bars to the left of center on
the second chart above. The distribution of equity market returns had a downside skew
over the period; however, the options market priced in greater skew than the market
realized (options priced skew of -1.2 vs. -1.1 realized).
(3) Fat tails: Equity return distributions have realized more extreme moves than
options markets implied over the past 10 years. We find that the options market
modestly underestimated the potential for extreme moves over the past 10 years, in
particular, the moves to the upside. Using kurtosis as a measure of tails, we find that the
options market priced 3.7 kurtosis relative to the 4.6 realized over the period.
Rlzd vol = 17.1%
Implied vol = 20.1%
Rlzd Skew = ‐1.1
Imp Skew = ‐1.2
Rlzd Kurtosis = 4.6
Imp Kurtosis = 3.7
0%
2%
4%
6%
8%
10%
12%
‐25 ‐20 ‐15 ‐10 ‐5 0 5 10 15 20 25
Probab
ility (%
of obs)
Stock return (%)
Rlzd distributionImp distribution
Stocks fall less frequently than implied by putoptions.
‐2.5%
‐2.0%
‐1.5%
‐1.0%
‐0.5%
0.0%
0.5%
1.0%
1.5%
2.0%
‐25 ‐20 ‐15 ‐10 ‐5 0 5 10 15 20 25
Diff in probab
ility (Im
p‐Rlzd)
Stock return (%)
Options overestimated the potential for volatility...
...but has underestimated the extreme tails in a few occasions.

April 4, 2013 United States
Goldman Sachs Global Economics, Commodities and Strategy Research 14
Why does the Volatility Risk Premium (VRP) exist?
The ability to hedge allows investment managers to externalize short-term equity market
risk and focus on investing for the long term. As such, hedges are a useful tool, but are not
free. In order to attain downside protection, investment managers must pay a premium for
put hedges—one that is large enough to attract liquidity providers and/or investors to
provide that protection. This cycle of supply and demand creates the Volatility Risk
Premium (VRP) and drives the long-run returns for short index options strategies.
We are often asked why the VRP has not been “arbed” away. Historically, the supply from
arbitrageurs has been small relative to hedging demand and there are limits to arbitrage.
We believe investors are needed to fill in the gap. Even as investors become more involved
in this market, as we show, only a small amount of short volatility exposure is needed to
generate sizable returns within acceptable risk levels. This means that short volatility
investors are unlikely to outsize the hedging market, in our view.
See “Volatility as an
Asset” November 15,
2007 for more on the
Volatility Risk Premium
(VRP)
April 4, 2013 United States
Goldman Sachs Global Economics, Commodities and Strategy Research 15
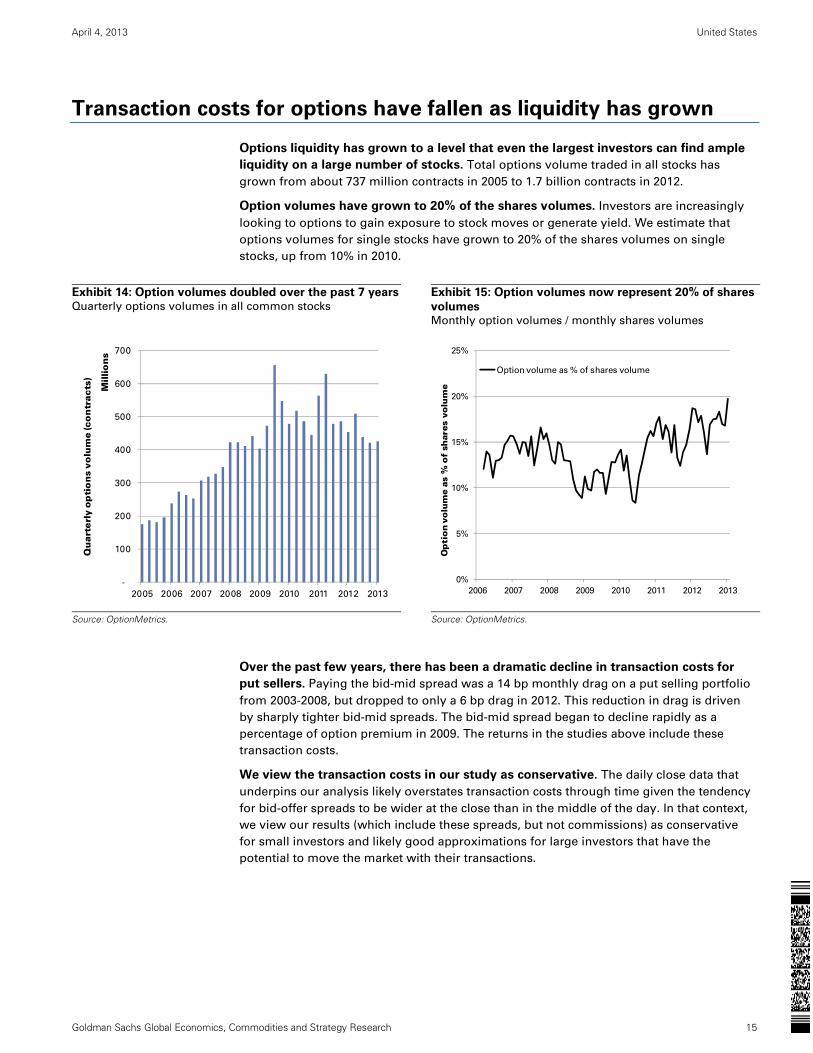
Transaction costs for options have fallen as liquidity has grown
Options liquidity has grown to a level that even the largest investors can find ample
liquidity on a large number of stocks. Total options volume traded in all stocks has
grown from about 737 million contracts in 2005 to 1.7 billion contracts in 2012.
Option volumes have grown to 20% of the shares volumes. Investors are increasingly
looking to options to gain exposure to stock moves or generate yield. We estimate that
options volumes for single stocks have grown to 20% of the shares volumes on single
stocks, up from 10% in 2010.
Exhibit 14: Option volumes doubled over the past 7 years
Quarterly options volumes in all common stocks
Exhibit 15: Option volumes now represent 20% of shares
volumes Monthly option volumes / monthly shares volumes
Source: OptionMetrics.
Source: OptionMetrics.
Over the past few years, there has been a dramatic decline in transaction costs for
put sellers. Paying the bid-mid spread was a 14 bp monthly drag on a put selling portfolio
from 2003-2008, but dropped to only a 6 bp drag in 2012. This reduction in drag is driven
by sharply tighter bid-mid spreads. The bid-mid spread began to decline rapidly as a
percentage of option premium in 2009. The returns in the studies above include these
transaction costs.
We view the transaction costs in our study as conservative. The daily close data that
underpins our analysis likely overstates transaction costs through time given the tendency
for bid-offer spreads to be wider at the close than in the middle of the day. In that context,
we view our results (which include these spreads, but not commissions) as conservative
for small investors and likely good approximations for large investors that have the
potential to move the market with their transactions.
-
100
200
300
400
500
600
700
2005 2006 2007 2008 2009 2010 2011 2012 2013
Qu
art
erl
y o
pti
on
s vo
lum
e (c
on
tracts
)
Millio
ns
0%
5%
10%
15%
20%
25%
2006 2007 2008 2009 2010 2011 2012 2013
Op
tio
n v
olu
me
as %
of
shar
es v
olu
me
Option volume as % of shares volume

April 4, 2013 United States
Goldman Sachs Global Economics, Commodities and Strategy Research 16
Exhibit 16: Monthly bid-mid spread for selling puts on S&P 500 stocks over the past 10yrs Trailing 6 month average bid-mid spread as a percent of the stock price on all S&P 500 stocks
with options
Source: Goldman Sachs Research.
0
5
10
15
20
25
30
2003 2004 2005 2006 2007 2008 2009 2010 2011 2012 2013
Bid‐m
id spread
as % of notional
Bid‐mid spread as % of notional
Transaction costs fell dramatically in 2009 and are now 1/3rd of 2003 levels.

April 4, 2013 United States
Goldman Sachs Global Economics, Commodities and Strategy Research 17
Appendix A: The Basics of Put Selling
What is put selling? Selling a put option on a stock to collect a premium for agreeing to
buy shares at a specific strike price should it drop below that level by expiration.
Example: Selling an at-the-money 1-month put. The payoff diagram below compares
the exposure of a put sale to the underlying stock. In this example, the investor sells a put
at a strike price equal to the current stock price that expires in 1-month. The put is referred
to as an “at-the-money” because it is struck at the current stock price. If put option were
struck below the current stock price, it would be considered an “out-of-the-money” (OTM)
put; if above the strike price, it would be an “In-the-money” put. The investor achieves the
maximum return if the stock is above the strike price at expiration. If shares are below the
strike price at expiration, the intrinsic value of the short put position is the stock price
minus the strike price plus the premium collected. The investor profits on the put sale as
long as shares are above the strike price minus the premium collected (the “breakeven”
point) at expiration.
Put sales offer lower risk than stock positions: Two features of put selling contribute to
its lower risk than stock positions. (1) Put sellers collect an upfront premium, cushioning
returns should the stock fall, (2) to the extent that the put sold is out-of-the-money,
downside exposure to the stock will not begin until the stock has already begun to fall. This
lower risk also lowers the potential return as the maximum return from the put sale is the
premium collected; however, upside to the stock is theoretically unlimited.
Collateral held against a put sale influences returns on capital: This example assumes
that the put sale is fully collateralized by cash equal to the strike price. While some amount
of collateral is almost always required, some investors under-collateralize put selling
strategies to effectively leverage their returns.
Exhibit 17: Put selling provides a fixed yield and outperforms stocks in a down market Payoff diagram for a fully collateralized put sale vs stock
Source: Goldman Sachs Research estimates
($25)
($20)
($15)
($10)
($5)
$0
$5
$10
$15
$20
$25
80 84 88 92 96 100 104 108 112 116 120
Pro
fit /
Lo
ss o
n o
ptio
ns
stra
teg
y a
t exp
iry
Stock Price
Long Stock Only
Short $100 strike put
If shares fall, put sellers have committed to buy shares at lower levels, but have a cushion of the premium collected plus return on their collateral
If shares are flat to up, put sellers keep the premium collected plus interestearned on collateral
April 4, 2013 United States
Goldman Sachs Global Economics, Commodities and Strategy Research 18
Key terms:
Strike price: Stock price above/below which option would be valuable at expiration
Premium: Upfront revenue from initiating the sale of an options position. The option
premium collected is a function of implied volatility and the forward price of the asset.
Higher volatility implied by the options market leads to higher put premiums. The forward
price is driven by expected dividends and interest rates. Higher expected dividends drive
down the forward price, increasing the premium collected for a put. Higher interest rates
increase the expected forward price of the asset, decreasing the put premium.
Term/option expiration: Length of time until options expire
Exercise: Converting options into stock at intrinsic value
Target yield from put sale: Put premium plus yield from collateral as % of total
investment, i.e., equal to the collateral
Return from put sale: Put premium plus yield from collateral minus put payoff at
expiration as % of total investment, i.e., equal to the collateral
Risks of put sale
Downside risk: Put sellers are exposed to downside risk if the stock price goes below put
strike and can lose the amount of the strike price if the stock reaches zero at expiration.
This loss may be partially offset by the premium collected at the initiation of the trade.
As a general rule of thumb, the best candidates for put selling strategy are the stocks that
an investor believes have strong balance sheets, secure business models and have a low
probability of entering distress. If an investor thinks that a stock has a strong upside, they
should own the stock rather than sell puts to capture the strong upside potential.
Mark-to-market risk: Investors that sell puts take mark-to-market risk based on
movements in a number of variables used to determine the time value embedded in an
option including, implied volatility, interest rates, and expected dividends. The mark-to-
market of a put sale can be adversely impacted if (1) stock falls (2) implied volatility rises,
(3) interest rates fall, and/or (4) expected dividends rise.

April 4, 2013 United States
Goldman Sachs Global Economics, Commodities and Strategy Research 19
Appendix B: Put Selling vs. Buy-write strategies
Put selling and covered call selling strategies offer similar risk/return profiles. In the
absence of any arbitrage opportunities, a long stock+ short call strategy can be replicated
using short put of the same strike and cash based on put-call parity relationship.
Put selling tends to be a lower risk strategy than covered call selling strategies when both
investors are focused on out-of-the-money strikes. In Exhibit 18 we show that when call
and put strikes are both out-of-the-money, the payoffs of the two strategies diverge. OTM
put selling provides higher downside cushion in an adverse market than OTM covered call
selling, despite providing smaller upside potential.
Put selling benefits from skew and collateral flexibility, but covered call selling
outperforms if dividends are greater than expected. Out of the money put sellers benefit
from structural skew in the options market that leads out of the money puts to be
overvalued relative to out of the money calls (see page 14 for discussion of the volatility
risk premium). Put sellers often have the flexibility to own interest bearing securities as
collateral, which can boost returns relative to a covered call selling structure. If dividends
are paid as forecast at the beginning of the trade, they have a neutral effect on put sellers
and covered call sellers; however, if dividends are larger than expected, this lowers the
forward price of the asset and benefits call sellers over put sellers. Investors should favor
covered call selling strategies on stocks they expect to pay larger dividends than are priced
into the options market.
Exhibit 18: OTM overwriting has higher upside potential than OTM put sale but has lower
downside protection Example 10% OTM put selling and 10% OTM overwriting
Source: Goldman Sachs Research.
($25)
($20)
($15)
($10)
($5)
$0
$5
$10
$15
$20
$25
80 84 88 92 96 100 104 108 112 116 120
Pro
fit /
Lo
ss o
n o
ptio
ns
stra
teg
y a
t exp
iry
Stock Price
Long Stock Only
Short $110 covered call
Short $90 put
Buy-writes (OTM) typically offer more upside and downside exposure
Put selling (OTM) offers a larger down-side cushion, but less upside than a buy-write
Put selling benefits
from skew and
collateral flexibility, but
covered call selling
outperforms if
dividends are greater
than expected.

April 4, 2013 United States
Goldman Sachs Global Economics, Commodities and Strategy Research 20
Appendix C: Methodology details and study overview
Methodology: We studied selling listed puts each month at expiration on each stock in the
S&P 500 that expires at the next expiration date at the bid price listed on the close. We hold
collateral equal to the strike price. We assume the collateral was held in 1-month treasuries
over the period of the trade. On expiration, 1 month later, we calculated the intrinsic value
of the combined position to determine the return over the period. We weight these
monthly returns in the same weight as the stock was in the S&P 500 at the beginning of the
period. In rare instances options data was not available for an underlier; in those cases, we
omit the underlier and re-weight the remaining trades to continue to approximate the
weighted index exposure.
Universe of stocks: We identify the constituents and index weights of each of the stocks in
the S&P 500 at the beginning of each trade and include only those stocks in our analysis.
Dates, initiation/expiration: On each expiration date, we assume an investor sells a put
that expires 1 month later, on the subsequent expiration day.
Strikes: We studied selling puts based on the moneyness (0%, 5%, 10% and 15% out-of-
the-money relative to the spot price at initiation), the delta exposure of the call (70-delta to
20-delta), and the premium collected (1% per month to 3% per month).
Trade size: We assume the investor sells puts based on the weight of that stock in the S&P
500 at that time to allow for direct comparison with the S&P 500 index.
Price history: We use OptionMetrics daily-close listed bid and ask option price data where
available and estimate prices using Goldman Sachs volatility surfaces and applying a bid-
ask spread in-line with the bid-ask spread observed in OptionMetrics data for that period.
Sample period: We include observations from January 2003 to January 2013.
Dividends: We implicitly assume that dividends would be collected by stock holders but
not by put sellers.

April 4, 2013 United States
Goldman Sachs Global Economics, Commodities and Strategy Research 21
Disclosure Appendix
Reg AC
We, John Marshall, Krag Gregory, Ph.D. and Katherine Fogertey, hereby certify that all of the views expressed in this report accurately reflect our
personal views about the subject company or companies and its or their securities. We also certify that no part of our compensation was, is or will be,
directly or indirectly, related to the specific recommendations or views expressed in this report.
Disclosures
Option Specific Disclosures
Price target methodology: Please refer to the analyst’s previously published research for methodology and risks associated with equity price
targets.
Pricing Disclosure: Option prices and volatility levels in this note are indicative only, and are based on our estimates of recent mid-market
levels(unless otherwise noted). All prices and levels exclude transaction costs unless otherwise stated.
General Options Risks – The risks below and any other options risks mentioned in this research report pertain both to specific derivative trade
recommendations mentioned and to discussion of general opportunities and advantages of derivative strategies. Unless otherwise noted, options
strategies mentioned in this report may be a combination of the strategies below and therefore carry with them the risks of those strategies.
Buying Options - Investors who buy call (put) options risk loss of the entire premium paid if the underlying security finishes below (above) the
strike price at expiration. Investors who buy call or put spreads also risk a maximum loss of the premium paid. The maximum gain on a long call or
put spread is the difference between the strike prices, less the premium paid.
Selling Options - Investors who sell calls on securities they do not own risk unlimited loss of the security price less the strike price. Investors who
sell covered calls (sell calls while owning the underlying security) risk having to deliver the underlying security or pay the difference between the
security price and the strike price, depending on whether the option is settled by physical delivery or cash-settled. Investors who sell puts risk loss of
the strike price less the premium received for selling the put. Investors who sell put or call spreads risk a maximum loss of the difference between the
strikes less the premium received, while their maximum gain is the premium received.
For options settled by physical delivery, the above risks assume the options buyer or seller, buys or sells the resulting securities at the
settlement price on expiry.
Distribution of ratings/investment banking relationships
Goldman Sachs Investment Research global coverage universe
Rating Distribution Investment Banking Relationships
Buy Hold Sell Buy Hold Sell
Global 31% 55% 14% 48% 41% 36%
As of January 1, 2013, Goldman Sachs Global Investment Research had investment ratings on 3,523 equity securities. Goldman Sachs assigns stocks
as Buys and Sells on various regional Investment Lists; stocks not so assigned are deemed Neutral. Such assignments equate to Buy, Hold and Sell
for the purposes of the above disclosure required by NASD/NYSE rules. See 'Ratings, Coverage groups and views and related definitions' below.
Disclosures required by United States laws and regulations
See company-specific regulatory disclosures above for any of the following disclosures required as to companies referred to in this report: manager
or co-manager in a pending transaction; 1% or other ownership; compensation for certain services; types of client relationships; managed/co-
managed public offerings in prior periods; directorships; for equity securities, market making and/or specialist role. Goldman Sachs usually makes a
market in fixed income securities of issuers discussed in this report and usually deals as a principal in these securities.
The following are additional required disclosures: Ownership and material conflicts of interest: Goldman Sachs policy prohibits its analysts,
professionals reporting to analysts and members of their households from owning securities of any company in the analyst's area of
coverage. Analyst compensation: Analysts are paid in part based on the profitability of Goldman Sachs, which includes investment banking
revenues. Analyst as officer or director: Goldman Sachs policy prohibits its analysts, persons reporting to analysts or members of their
households from serving as an officer, director, advisory board member or employee of any company in the analyst's area of coverage. Non-U.S. Analysts: Non-U.S. analysts may not be associated persons of Goldman, Sachs & Co. and therefore may not be subject to NASD Rule 2711/NYSE
Rules 472 restrictions on communications with subject company, public appearances and trading securities held by the analysts.
Additional disclosures required under the laws and regulations of jurisdictions other than the United States
The following disclosures are those required by the jurisdiction indicated, except to the extent already made above pursuant to United States laws
and regulations. Australia: Goldman Sachs Australia Pty Ltd and its affiliates are not authorised deposit-taking institutions (as that term is defined in
the Banking Act 1959 (Cth)) in Australia and do not provide banking services, nor carry on a banking business, in Australia. This research, and any
access to it, is intended only for "wholesale clients" within the meaning of the Australian Corporations Act, unless otherwise agreed by Goldman
Sachs. Brazil: Disclosure information in relation to CVM Instruction 483 is available at http://www.gs.com/worldwide/brazil/area/gir/index.html.

April 4, 2013 United States
Goldman Sachs Global Economics, Commodities and Strategy Research 22
Where applicable, the Brazil-registered analyst primarily responsible for the content of this research report, as defined in Article 16 of CVM Instruction
483, is the first author named at the beginning of this report, unless indicated otherwise at the end of the text. Canada: Goldman, Sachs & Co. has
approved of, and agreed to take responsibility for, this research in Canada if and to the extent it relates to equity securities of Canadian issuers.
Analysts may conduct site visits but are prohibited from accepting payment or reimbursement by the company of travel expenses for such
visits. Hong Kong: Further information on the securities of covered companies referred to in this research may be obtained on request from
Goldman Sachs (Asia) L.L.C. India: Further information on the subject company or companies referred to in this research may be obtained from
Goldman Sachs (India) Securities Private Limited; Japan: See below. Korea: Further information on the subject company or companies referred to
in this research may be obtained from Goldman Sachs (Asia) L.L.C., Seoul Branch. New Zealand: Goldman Sachs New Zealand Limited and its
affiliates are neither "registered banks" nor "deposit takers" (as defined in the Reserve Bank of New Zealand Act 1989) in New Zealand. This research,
and any access to it, is intended for "wholesale clients" (as defined in the Financial Advisers Act 2008) unless otherwise agreed by Goldman
Sachs. Russia: Research reports distributed in the Russian Federation are not advertising as defined in the Russian legislation, but are information
and analysis not having product promotion as their main purpose and do not provide appraisal within the meaning of the Russian legislation on
appraisal activity. Singapore: Further information on the covered companies referred to in this research may be obtained from Goldman Sachs
(Singapore) Pte. (Company Number: 198602165W). Taiwan: This material is for reference only and must not be reprinted without permission.
Investors should carefully consider their own investment risk. Investment results are the responsibility of the individual investor. United Kingdom: Persons who would be categorized as retail clients in the United Kingdom, as such term is defined in the rules of the Financial Services
Authority, should read this research in conjunction with prior Goldman Sachs research on the covered companies referred to herein and should refer
to the risk warnings that have been sent to them by Goldman Sachs International. A copy of these risks warnings, and a glossary of certain financial
terms used in this report, are available from Goldman Sachs International on request.
European Union: Disclosure information in relation to Article 4 (1) (d) and Article 6 (2) of the European Commission Directive 2003/126/EC is available
at http://www.gs.com/disclosures/europeanpolicy.html which states the European Policy for Managing Conflicts of Interest in Connection with
Investment Research.
Japan: Goldman Sachs Japan Co., Ltd. is a Financial Instrument Dealer registered with the Kanto Financial Bureau under registration number Kinsho
69, and a member of Japan Securities Dealers Association, Financial Futures Association of Japan and Type II Financial Instruments Firms
Association. Sales and purchase of equities are subject to commission pre-determined with clients plus consumption tax. See company-specific
disclosures as to any applicable disclosures required by Japanese stock exchanges, the Japanese Securities Dealers Association or the Japanese
Securities Finance Company.
Ratings, coverage groups and views and related definitions
Buy (B), Neutral (N), Sell (S) -Analysts recommend stocks as Buys or Sells for inclusion on various regional Investment Lists. Being assigned a Buy
or Sell on an Investment List is determined by a stock's return potential relative to its coverage group as described below. Any stock not assigned as
a Buy or a Sell on an Investment List is deemed Neutral. Each regional Investment Review Committee manages various regional Investment Lists to a
global guideline of 25%-35% of stocks as Buy and 10%-15% of stocks as Sell; however, the distribution of Buys and Sells in any particular coverage
group may vary as determined by the regional Investment Review Committee. Regional Conviction Buy and Sell lists represent investment
recommendations focused on either the size of the potential return or the likelihood of the realization of the return.
Return potential represents the price differential between the current share price and the price target expected during the time horizon associated
with the price target. Price targets are required for all covered stocks. The return potential, price target and associated time horizon are stated in each
report adding or reiterating an Investment List membership.
Coverage groups and views: A list of all stocks in each coverage group is available by primary analyst, stock and coverage group at
http://www.gs.com/research/hedge.html. The analyst assigns one of the following coverage views which represents the analyst's investment outlook
on the coverage group relative to the group's historical fundamentals and/or valuation. Attractive (A). The investment outlook over the following 12
months is favorable relative to the coverage group's historical fundamentals and/or valuation. Neutral (N). The investment outlook over the
following 12 months is neutral relative to the coverage group's historical fundamentals and/or valuation. Cautious (C). The investment outlook over
the following 12 months is unfavorable relative to the coverage group's historical fundamentals and/or valuation.
Not Rated (NR). The investment rating and target price have been removed pursuant to Goldman Sachs policy when Goldman Sachs is acting in an
advisory capacity in a merger or strategic transaction involving this company and in certain other circumstances. Rating Suspended (RS). Goldman
Sachs Research has suspended the investment rating and price target for this stock, because there is not a sufficient fundamental basis for
determining, or there are legal, regulatory or policy constraints around publishing, an investment rating or target. The previous investment rating and
price target, if any, are no longer in effect for this stock and should not be relied upon. Coverage Suspended (CS). Goldman Sachs has suspended
coverage of this company. Not Covered (NC). Goldman Sachs does not cover this company. Not Available or Not Applicable (NA). The
information is not available for display or is not applicable. Not Meaningful (NM). The information is not meaningful and is therefore excluded.
Global product; distributing entities
The Global Investment Research Division of Goldman Sachs produces and distributes research products for clients of Goldman Sachs on a global
basis. Analysts based in Goldman Sachs offices around the world produce equity research on industries and companies, and research on
macroeconomics, currencies, commodities and portfolio strategy. This research is disseminated in Australia by Goldman Sachs Australia Pty Ltd
(ABN 21 006 797 897); in Brazil by Goldman Sachs do Brasil Corretora de Títulos e Valores Mobiliários S.A.; in Canada by Goldman, Sachs & Co.
regarding Canadian equities and by Goldman, Sachs & Co. (all other research); in Hong Kong by Goldman Sachs (Asia) L.L.C.; in India by Goldman
Sachs (India) Securities Private Ltd.; in Japan by Goldman Sachs Japan Co., Ltd.; in the Republic of Korea by Goldman Sachs (Asia) L.L.C., Seoul
Branch; in New Zealand by Goldman Sachs New Zealand Limited; in Russia by OOO Goldman Sachs; in Singapore by Goldman Sachs (Singapore)
Pte. (Company Number: 198602165W); and in the United States of America by Goldman, Sachs & Co. Goldman Sachs International has approved this
research in connection with its distribution in the United Kingdom and European Union.
European Union: Goldman Sachs International, authorized and regulated by the Financial Services Authority, has approved this research in
connection with its distribution in the European Union and United Kingdom; Goldman Sachs AG and Goldman Sachs International
Zweigniederlassung Frankfurt, regulated by the Bundesanstalt für Finanzdienstleistungsaufsicht, may also distribute research in Germany.
General disclosures
This research is for our clients only. Other than disclosures relating to Goldman Sachs, this research is based on current public information that we
consider reliable, but we do not represent it is accurate or complete, and it should not be relied on as such. We seek to update our research as
appropriate, but various regulations may prevent us from doing so. Other than certain industry reports published on a periodic basis, the large
majority of reports are published at irregular intervals as appropriate in the analyst's judgment.

April 4, 2013 United States
Goldman Sachs Global Economics, Commodities and Strategy Research 23
Goldman Sachs conducts a global full-service, integrated investment banking, investment management, and brokerage business. We have
investment banking and other business relationships with a substantial percentage of the companies covered by our Global Investment Research
Division. Goldman, Sachs & Co., the United States broker dealer, is a member of SIPC (http://www.sipc.org).
Our salespeople, traders, and other professionals may provide oral or written market commentary or trading strategies to our clients and our
proprietary trading desks that reflect opinions that are contrary to the opinions expressed in this research. Our asset management area, our
proprietary trading desks and investing businesses may make investment decisions that are inconsistent with the recommendations or views
expressed in this research.
The analysts named in this report may have from time to time discussed with our clients, including Goldman Sachs salespersons and traders, or may
discuss in this report, trading strategies that reference catalysts or events that may have a near-term impact on the market price of the equity
securities discussed in this report, which impact may be directionally counter to the analysts' published price target expectations for such stocks. Any
such trading strategies are distinct from and do not affect the analysts' fundamental equity rating for such stocks, which rating reflects a stock's
return potential relative to its coverage group as described herein.
We and our affiliates, officers, directors, and employees, excluding equity and credit analysts, will from time to time have long or short positions in,
act as principal in, and buy or sell, the securities or derivatives, if any, referred to in this research.
This research is not an offer to sell or the solicitation of an offer to buy any security in any jurisdiction where such an offer or solicitation would be
illegal. It does not constitute a personal recommendation or take into account the particular investment objectives, financial situations, or needs of
individual clients. Clients should consider whether any advice or recommendation in this research is suitable for their particular circumstances and, if
appropriate, seek professional advice, including tax advice. The price and value of investments referred to in this research and the income from them
may fluctuate. Past performance is not a guide to future performance, future returns are not guaranteed, and a loss of original capital may occur.
Fluctuations in exchange rates could have adverse effects on the value or price of, or income derived from, certain investments.
Certain transactions, including those involving futures, options, and other derivatives, give rise to substantial risk and are not suitable for all investors.
Investors should review current options disclosure documents which are available from Goldman Sachs sales representatives or at
http://www.theocc.com/about/publications/character-risks.jsp. Transaction costs may be significant in option strategies calling for multiple purchase
and sales of options such as spreads. Supporting documentation will be supplied upon request.
In producing research reports, members of the Global Investment Research Division of Goldman Sachs Australia may attend site visits and other
meetings hosted by the issuers the subject of its research reports. In some instances the costs of such site visits or meetings may be met in part or in
whole by the issuers concerned if Goldman Sachs Australia considers it is appropriate and reasonable in the specific circumstances relating to the
site visit or meeting.
All research reports are disseminated and available to all clients simultaneously through electronic publication to our internal client websites. Not all
research content is redistributed to our clients or available to third-party aggregators, nor is Goldman Sachs responsible for the redistribution of our
research by third party aggregators. For all research available on a particular stock, please contact your sales representative or go to
http://360.gs.com.
Disclosure information is also available at http://www.gs.com/research/hedge.html or from Research Compliance, 200 West Street, New York, NY
10282.
© 2013 Goldman Sachs.
No part of this material may be (i) copied, photocopied or duplicated in any form by any means or (ii) redistributed without the prior written consent of The Goldman Sachs Group, Inc.