the art of container monitoring - s.itho.me the... · cadvisor collects, aggregates, processes, and...
TRANSCRIPT

The Art of Container Monitoring
Derek Chen 2016.9.22

Copyright 2016 Trend Micro Inc. 2
About me • DevOps Engineer at Trend Micro
– Agile transformation
– Micro service and cloud service
– Docker integration
– Monitoring system development
• Automate all the things
• Make everything smoother
• Find me at [email protected]

Copyright 2016 Trend Micro Inc. 3
• We want to know when things go wrong
• We want to know when things aren’t quite right
• We want to know in advance of problems
Why monitoring?
Microscope? Magnifier? Telescope?
Copyright 2016 Trend Micro Inc. 4
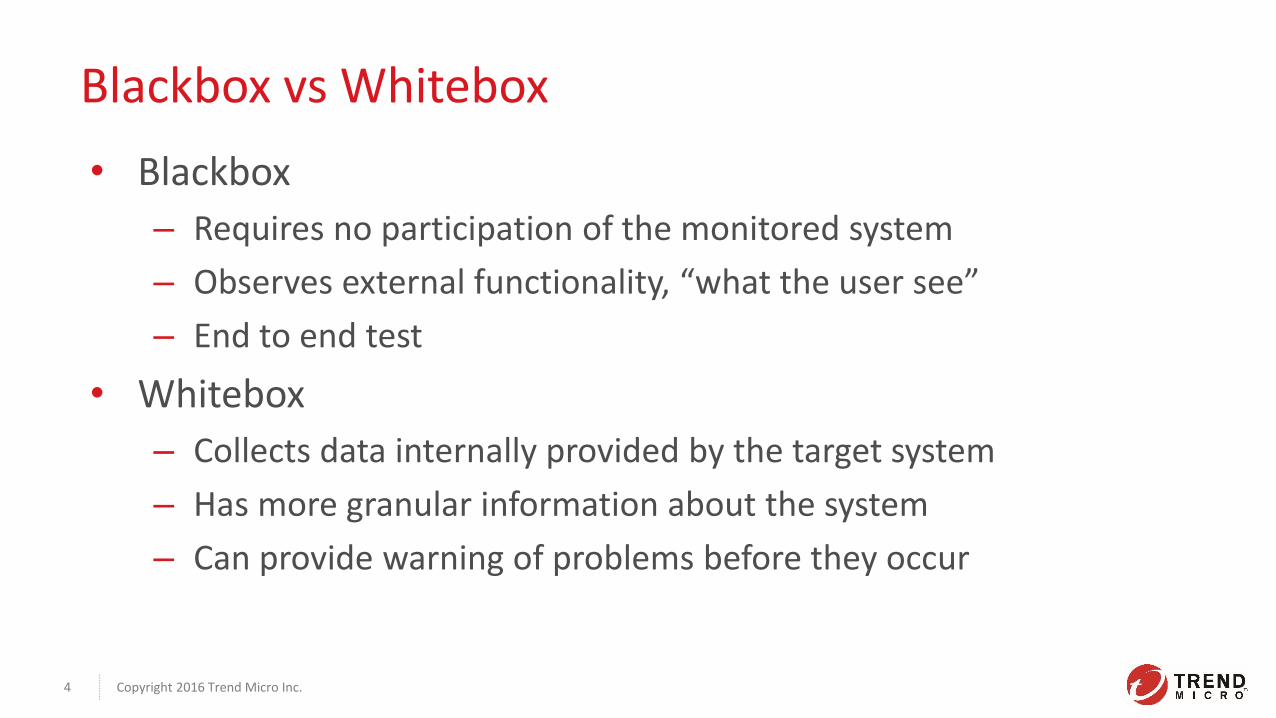
Blackbox vs Whitebox
• Blackbox
– Requires no participation of the monitored system
– Observes external functionality, “what the user see”
– End to end test
• Whitebox
– Collects data internally provided by the target system
– Has more granular information about the system
– Can provide warning of problems before they occur

Copyright 2016 Trend Micro Inc. 5
Blackbox tests measure…
• Can you ping the server
• Can you fetch a page from the server
• Does it have the correct contents
Whitebox monitoring collects…
• Network statistics (packets/bytes sent/received)
• System load (cpu, memory, disk usage)
• Application statistics (connection count, query per second)

Copyright 2016 Trend Micro Inc. 6
Goal
Operating System
Application
Business Logic
Metrics Events Logs
Router Destinations
Store Visualize
Alert
Monitoring Framwork
• Be metric, event, and log
• Allow us to easily visualize the stat of our environment
• Provide contextual and useful notification.
• Focus on whitebox monitoring instead of blackbox monitoring
[image] https://www.artofmonitoring.com

Copyright 2016 Trend Micro Inc. 7
• The practice of system admin is changing quickly
– DevOps
– Infrastructure as Code
– Visualization
– Cloud Platform
• Commercial solution can’t keep up!
Why Open Source Software Monitoring?
[image] http://devops.com/2014/05/05/meet-infrastructure-code
Copyright 2016 Trend Micro Inc. 8
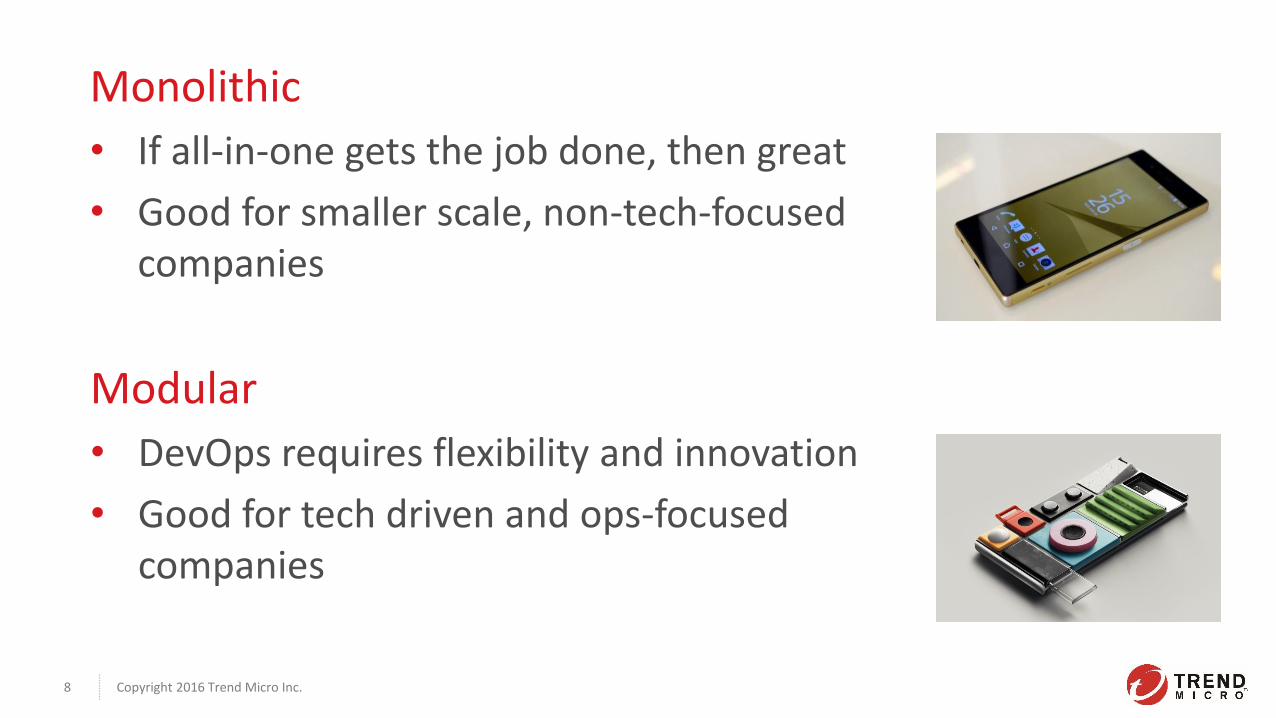
Monolithic
• If all-in-one gets the job done, then great
• Good for smaller scale, non-tech-focused companies
Modular
• DevOps requires flexibility and innovation
• Good for tech driven and ops-focused companies

Metric We’ll rely most heavily on metrics to help us understand
what’s going on in our environment.

Copyright 2016 Trend Micro Inc. 10
Metric
• Provide a dynamic, real-time picture of the state of your infrastructure
Collect Store Visualize
Operating System
Application
Business Logic

Copyright 2016 Trend Micro Inc. 11
Pull Mode A central collector periodically requests metrics from each monitored system
Scrape Metrics
Server #1
Service
Server #2
Service
Server #3
Service
Monitoring
Push Mode Metrics are periodically sent by each monitored system to a central collector
Server #1
Agent
Server #2
Agent
Server #3
Agent
Monitoring
Push Metrics

Collectd The system statistics collection daemon

Copyright 2016 Trend Micro Inc. 13
Database
Host Machine OS Metric
K8S Minion
Collectd
K8S Master
Collectd
Kubernetes Cluster
Elasticsearch
Monitor
Grafana InfluxDB
Collectd Collectd
K8S Minion
Collectd

cAdvisor Collects, aggregates, processes, and exports information
about running containers.

Copyright 2016 Trend Micro Inc. 15
Database
Container OS Metric
K8S Minion
cAdvisor
Heapster
K8S Master
API Server
cAdvisor
Kubernetes Cluster
Elasticsearch
Monitor
Grafana InfluxDB
K8S Minion
cAdvisor

Copyright 2016 Trend Micro Inc. 16
http://127.0.0.1:4194 http://127.0.0.1:4194/metrics

Telegraf Collects time series data from a variety of sources

Copyright 2016 Trend Micro Inc. 18
Database
Application Metric – Pull Mode
K8S Minion
K8S Master
API Server
Kubernetes Cluster
Elasticsearch
Monitor
Grafana InfluxDB
Nginx Postgres ES
Telegraf
K8S Minion
Redis

Copyright 2016 Trend Micro Inc. 19
Database
Application Metric – Push Mode
K8S Minion
Telegraf
K8S Master
API Server
Kubernetes Cluster
Elasticsearch
Monitor
Grafana InfluxDB
Nginx
Telegraf
Postgres
Telegraf
ES
K8S Minion
Telegraf
Redis Pod Pod

Copyright 2016 Trend Micro Inc. 20
Telegraf
• An agent written in Go
• Easy to contribute or develop your plugins
• Supported Input Plugins
– System: cpu, mem, net, disk, processes and etc.
– Application: docker, nginx, postgresql, redis, and etc.
– Third party api: aws cloudwatch
• Supported output plugins
– influxdb, graphite, cloudwatch, datadog and etc.

Copyright 2016 Trend Micro Inc. 21
Pull Mode
• Collector discoveries services periodically
• Collector needs to talk to target services
– Overlay network. Ex: Flannel, Weave, etc.
– Forward proxy
Scrape Metrics
Server #1
Service
Server #2
Service
Server #3
Service
Monitoring

Copyright 2016 Trend Micro Inc. 22
Push Mode
• Agent sends metrics as soon as it starts up
• Suitable for short-lived containers or dynamic environments
Server #1
Agent
Server #2
Agent
Server #3
Agent
Monitoring
Push Metrics

InfluxDB Time series database stores all the metrics
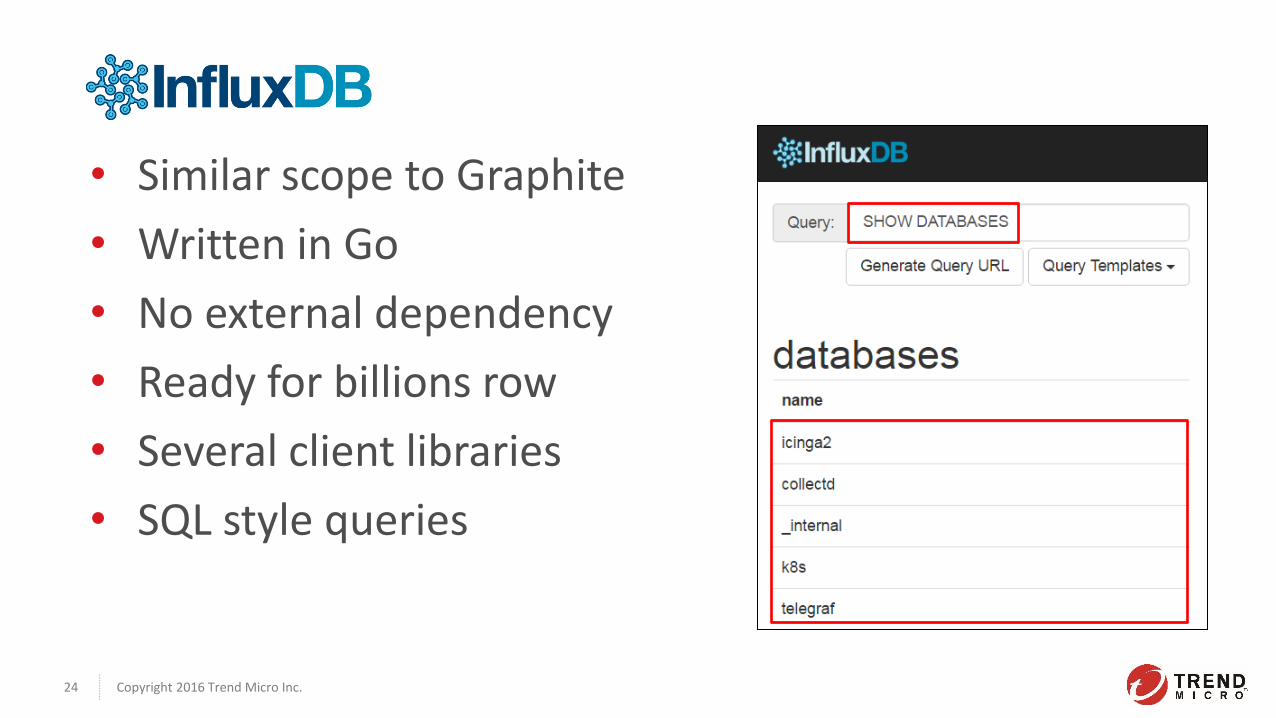
Copyright 2016 Trend Micro Inc. 24
• Similar scope to Graphite
• Written in Go
• No external dependency
• Ready for billions row
• Several client libraries
• SQL style queries

Copyright 2016 Trend Micro Inc. 25
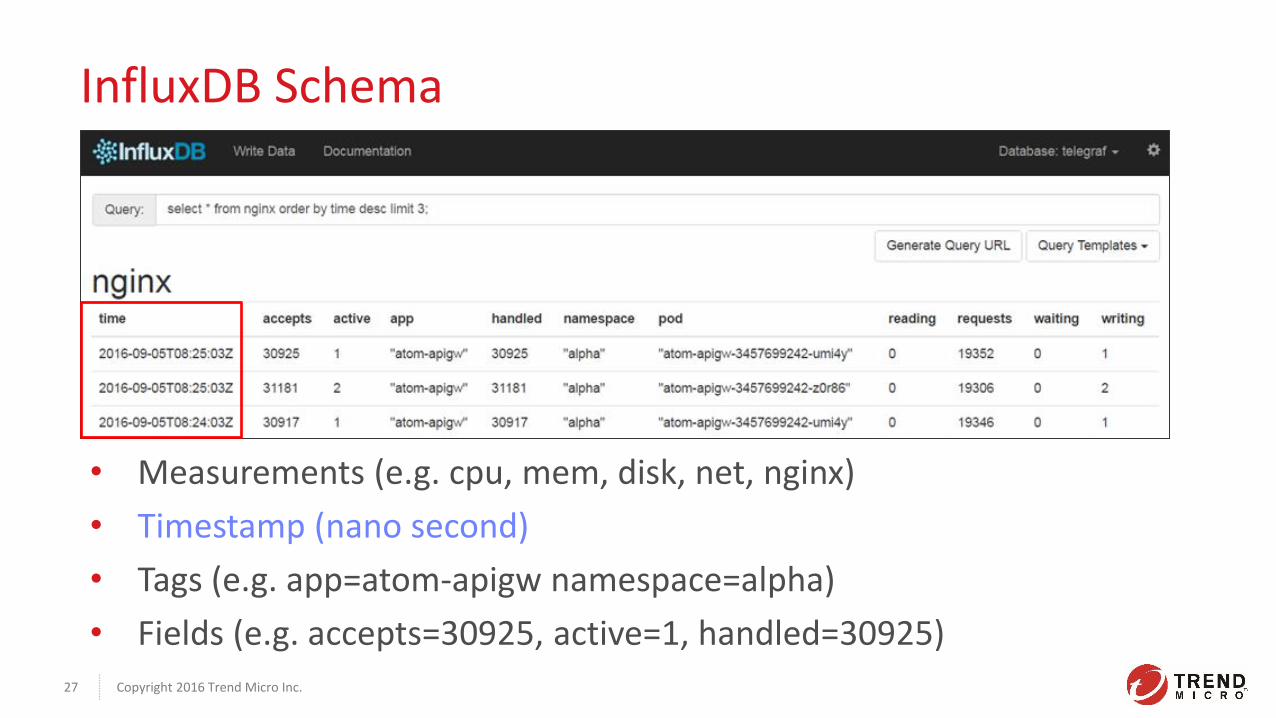
InfluxDB Schema
• Measurements (e.g. cpu, mem, disk, net, nginx)
• Timestamp (nano second)
• Tags (e.g. app=atom-apigw namespace=alpha)
• Fields (e.g. accepts=30925, active=1, handled=30925)

Copyright 2016 Trend Micro Inc. 26
InfluxDB Schema
• Measurements (e.g. cpu, mem, disk, net, nginx)
• Timestamp (nano second)
• Tags (e.g. app=atom-apigw namespace=alpha)
• Fields (e.g. accepts=30925, active=1, handled=30925)
Copyright 2016 Trend Micro Inc. 27
InfluxDB Schema
• Measurements (e.g. cpu, mem, disk, net, nginx)
• Timestamp (nano second)
• Tags (e.g. app=atom-apigw namespace=alpha)
• Fields (e.g. accepts=30925, active=1, handled=30925)

Copyright 2016 Trend Micro Inc. 28
InfluxDB Schema
• Measurements (e.g. cpu, mem, disk, net, nginx)
• Timestamp (nano second)
• Tags (e.g. app=atom-apigw namespace=alpha)
• Fields (e.g. accepts=30925, active=1, handled=30925)

Copyright 2016 Trend Micro Inc. 29
InfluxDB Schema
• Measurements (e.g. cpu, mem, disk, net, nginx)
• Timestamp (nano second)
• Tags (e.g. app=atom-apigw namespace=alpha)
• Fields (e.g. accepts=30925, active=1, handled=30925)

Grafana Querying and visualizing time series and metrics

Finally! What we can to see! Less talk more demo…

Copyright 2016 Trend Micro Inc. 32


Copyright 2016 Trend Micro Inc. 35


Copyright 2016 Trend Micro Inc. 37

Event We’ll generally use events to let us know about changes
and occurrences in our environment.
Icinga2 A monitoring system which checks the availability of
your resources, notifies users of outages

Copyright 2016 Trend Micro Inc. 40
• Originally forked from Nagios in 2009
• Independent version Icinga2 since 2014
• Monitors everything
• Gathering status
• Collect performance data
/use/lib/nagios/plugins/plugin_name
Any program which returns • 0 – OK
• 1 – WARNING
• 2 – CRITICAL
Message to STDOUT

Copyright 2016 Trend Micro Inc. 41
Database
Event Monitoring
K8S Minion
K8S Master
API Server
Kubernetes Cluster
Elasticsearch
Monitor
Grafana InfluxDB Icinga2
Nginx Postgres ES
K8S Minion
Redis


Copyright 2016 Trend Micro Inc. 43

Copyright 2016 Trend Micro Inc. 44
Host
Pod

Copyright 2016 Trend Micro Inc. 45
Server Monitoring
• About changes and occurrences in our environment
– Is cpu load too high?
– Is memory not enough?
– Is docker engine still alive?
External Monitoring
• End to end test from user’s perspective
• Can you connect ssh port 22?
• Can you browse web page?
• Can you request RESTful API successfully?

Dashboard
• Provides a clear view for current environment
Alerting
• Notifies using email, slack, pager and etc.
• Notification escalation
Others…
• Distributed Monitoring
• Reloads config without interrupt checks

Log Logs are a subset of events. They’re often most useful
for fault diagnosis and investigation

Copyright 2016 Trend Micro Inc. 48
• EFK stack is a mature logging solution
EFK
Shipping all of your log to where it should go
The main part to store your data with high availability
Visualize will power your data. To know more about its value.

Summary

Copyright 2016 Trend Micro Inc. 50
Collect Store Visualize
Monitoring Service Stack
Alert
InfluxDB
Elasticserach
Grafana
Kibana
Icinga2 Collectd
Telegraf Fluentd
cAdvisor

Copyright 2016 Trend Micro Inc. 51
Last but Not least
• Data Flow
– Blackbox vs Whitebox
– Pull Mode vs Push Mode
• Data Content
– Opeating System, Application, Business Logic
• Data Type
– Metric, Events, Logs Operating System
Application
Business Logic
Metrics Events Logs
Router Destinations
Store Visualize
Alert
Monitoring Framwork [image] https://www.artofmonitoring.com

THANKS! Any Questions?