the art economy of remote australia
TRANSCRIPT
The Art Economy
of Remote Australia
CRC for Remote Economic Participation
Aboriginal and Torres Strait Islander Art Economies Project
Tim Acker, Curtin University
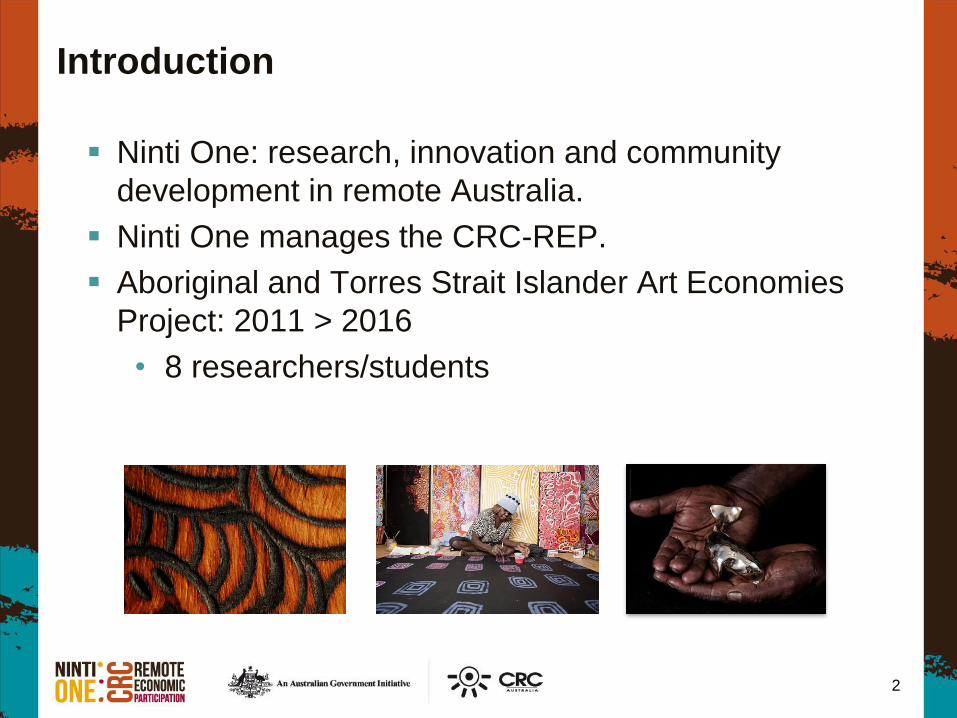
Introduction
Ninti One: research, innovation and community
development in remote Australia.
Ninti One manages the CRC-REP.
Aboriginal and Torres Strait Islander Art Economies
Project: 2011 > 2016
• 8 researchers/students
2
Who?
Value chains: Dr Alice Woodhead
Art Centre sustainability: PhD – Kim Petersen
Art Centre enabling environment: PhD – Susan
Congreve
Buyer behaviour: Masters – Jessica Booth
E-commerce in Art Centres: Honours – Iris Bendor
Art Centre human resources: Honours – Michelle
Whittle
Art Outside Art Centres: Dr Lisa Stefanoff and others
3
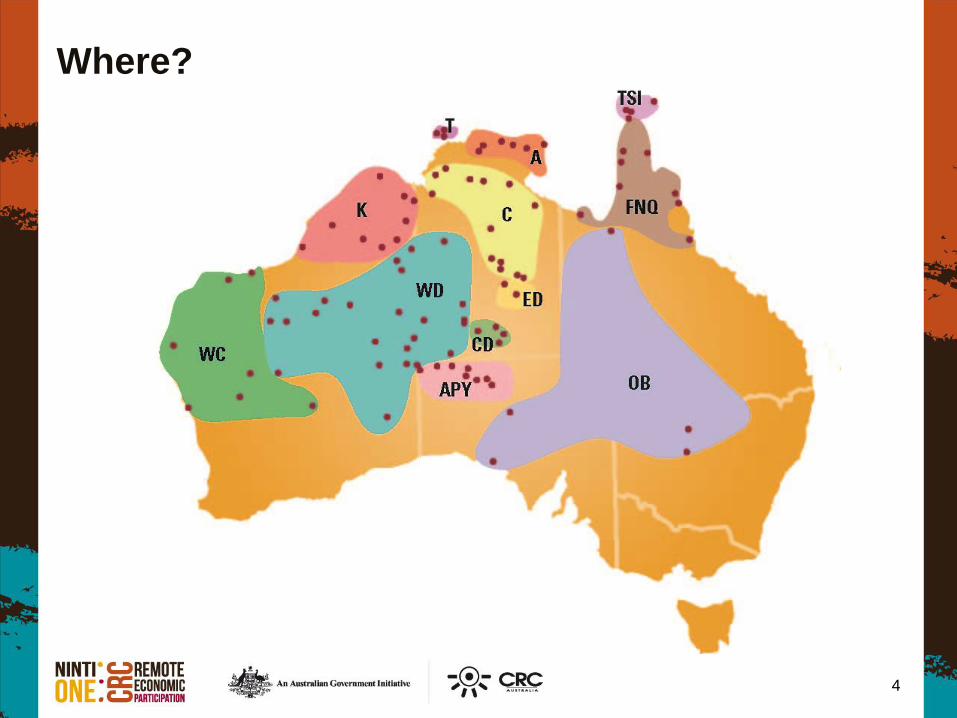
Where?
4
Art Economies Value Chain Project (AEVC)
Understand production and sale of remote-area art.
Aim: enable change and inform artists + art business.
Senate inquiry recommendation.
Value chain analysis: economic not cultural focus.
Primary market focus.
Complicated value chain + cross cultural factors.
Incorporate variability.
Six reports reflecting remote Aboriginal and Torres Strait
Islander art supply chain.
5
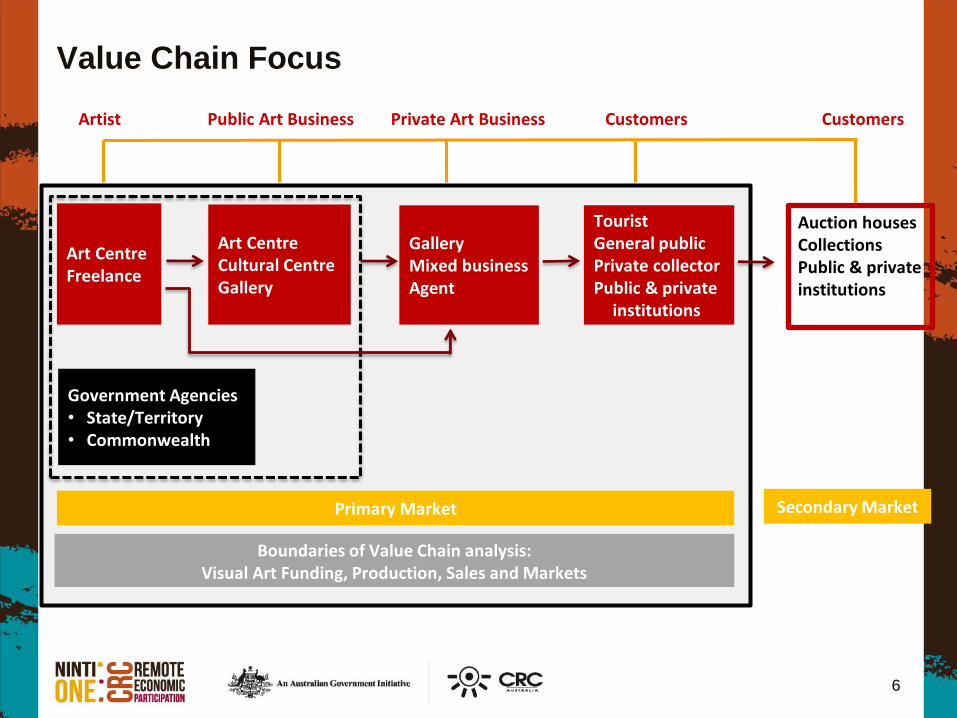
Value Chain Focus
6
Artist Public Art Business Private Art Business Customers Customers
Art Centre Freelance
Art Centre Cultural Centre Gallery
Gallery Mixed business Agent
Tourist General public Private collector Public & private
institutions
Government Agencies • State/Territory • Commonwealth
Auction houses Collections Public & private institutions
Boundaries of Value Chain analysis: Visual Art Funding, Production, Sales and Markets
Primary Market Secondary Market
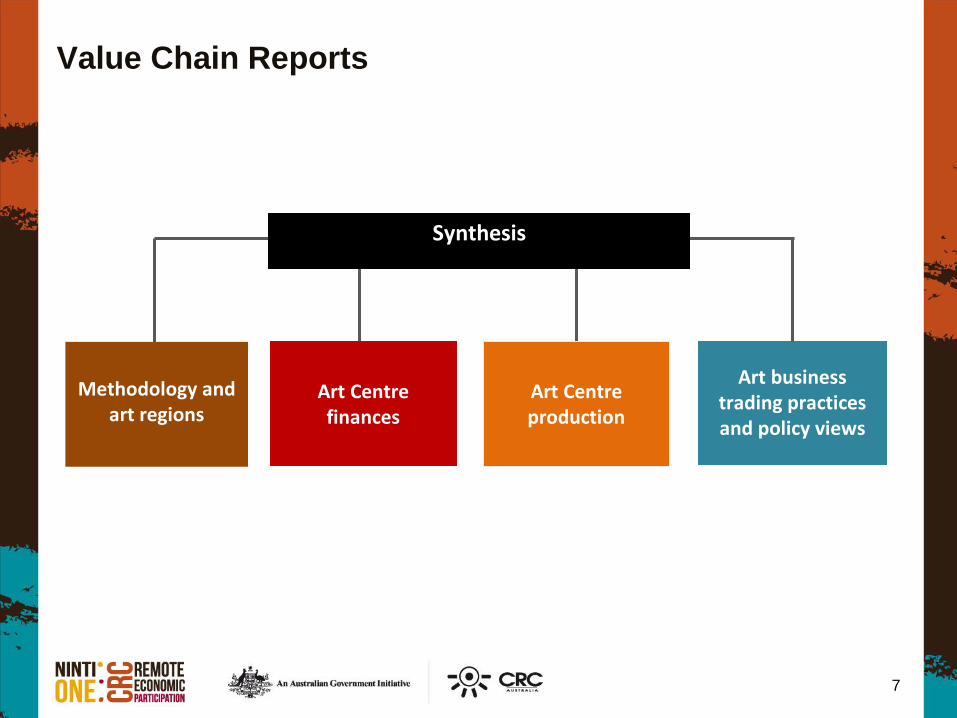
Value Chain Reports
7
Art Centre finances
Art business trading practices and policy views
Methodology and
art regions
Art Centre production
Synthesis
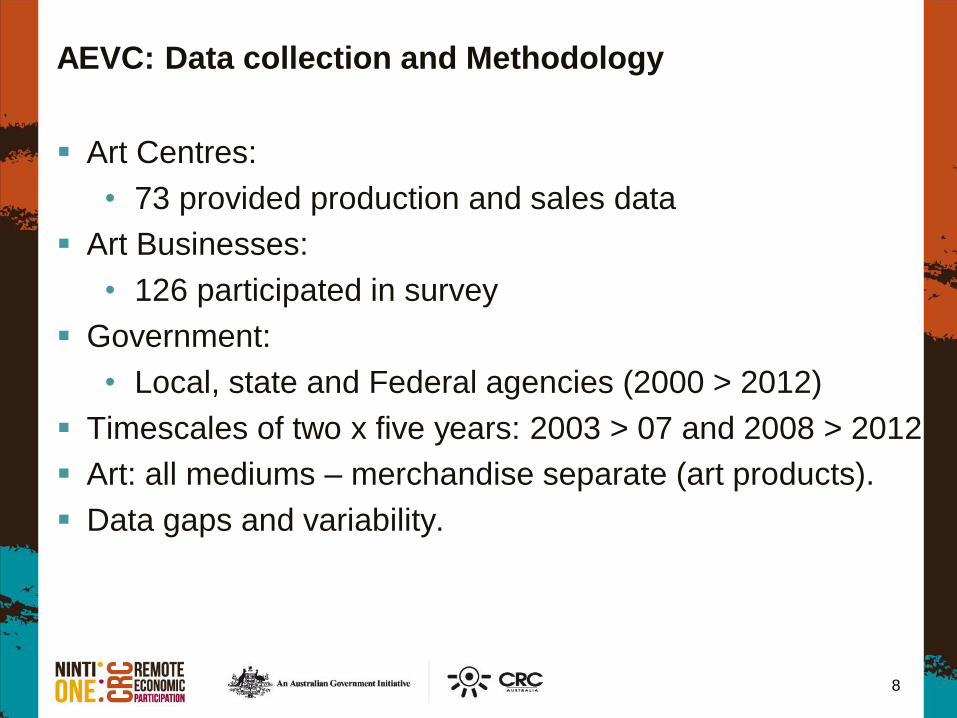
AEVC: Data collection and Methodology
Art Centres:
• 73 provided production and sales data
Art Businesses:
• 126 participated in survey
Government:
• Local, state and Federal agencies (2000 > 2012)
Timescales of two x five years: 2003 > 07 and 2008 > 2012
Art: all mediums – merchandise separate (art products).
Data gaps and variability.
8
Key Findings: Art Centre Finances
Highly effective funding model: over 90% of artists
reached.
Increased funding has seen growth in artists, art
centres and production.
Sales are around $30million p/a – fairly static
Increased funding = increased funding dependency.
New funding is for employment outcomes.
Fall in retained earnings.
Select art centres make most of the sales.
Sales are improving.
9
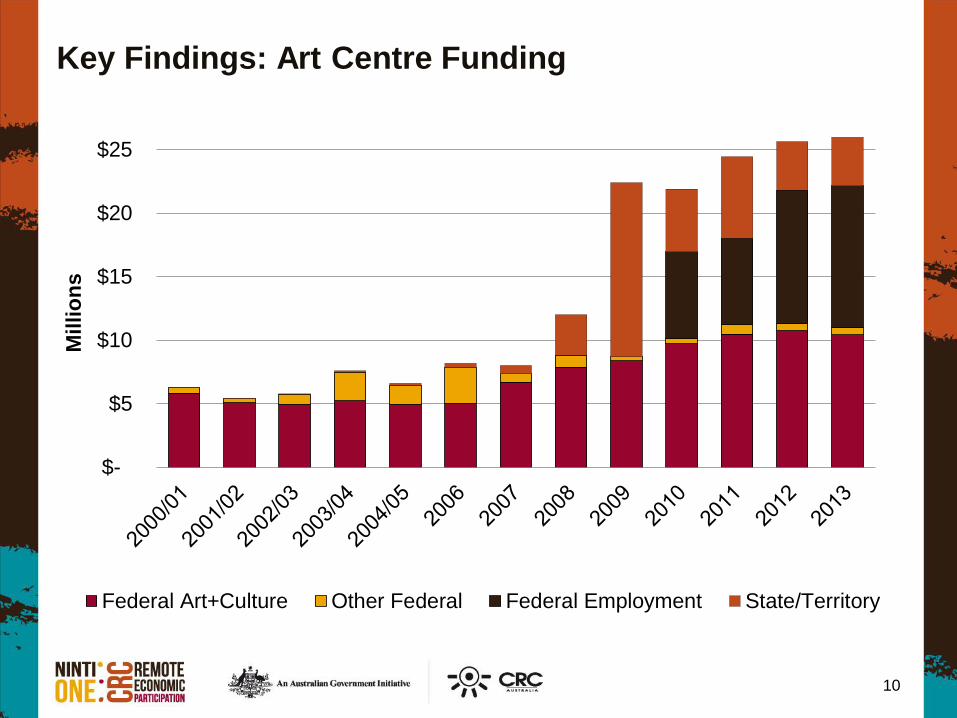
Key Findings: Art Centre Funding
10
$-
$5
$10
$15
$20
$25
Millio
ns
Federal Art+Culture Other Federal Federal Employment State/Territory
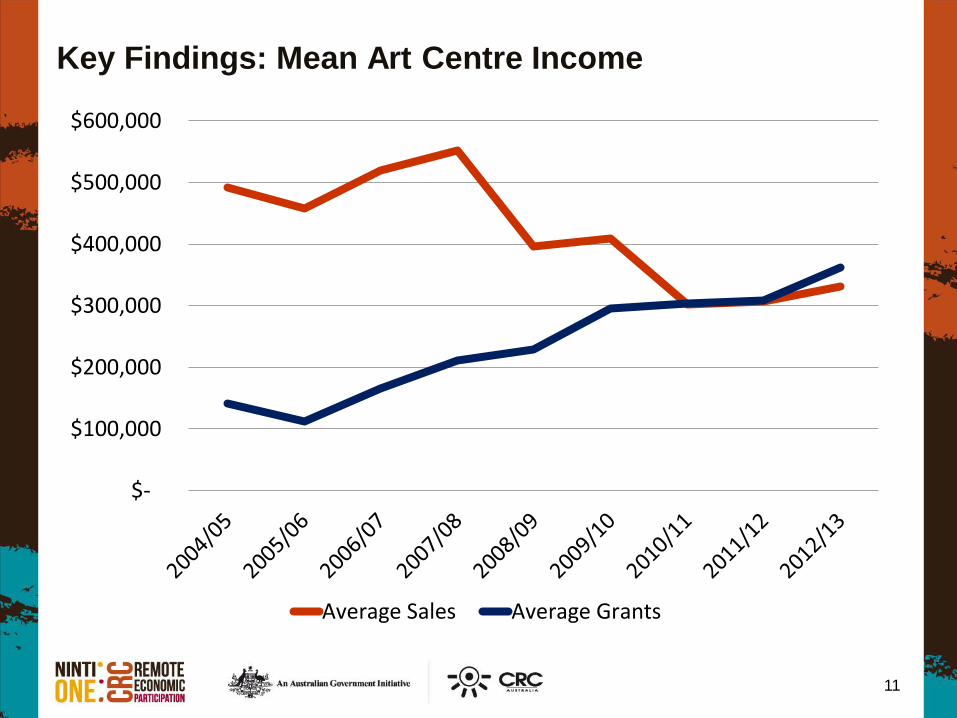
Key Findings: Mean Art Centre Income
11
$-
$100,000
$200,000
$300,000
$400,000
$500,000
$600,000
Average Sales Average Grants
$-
$100,000
$200,000
$300,000
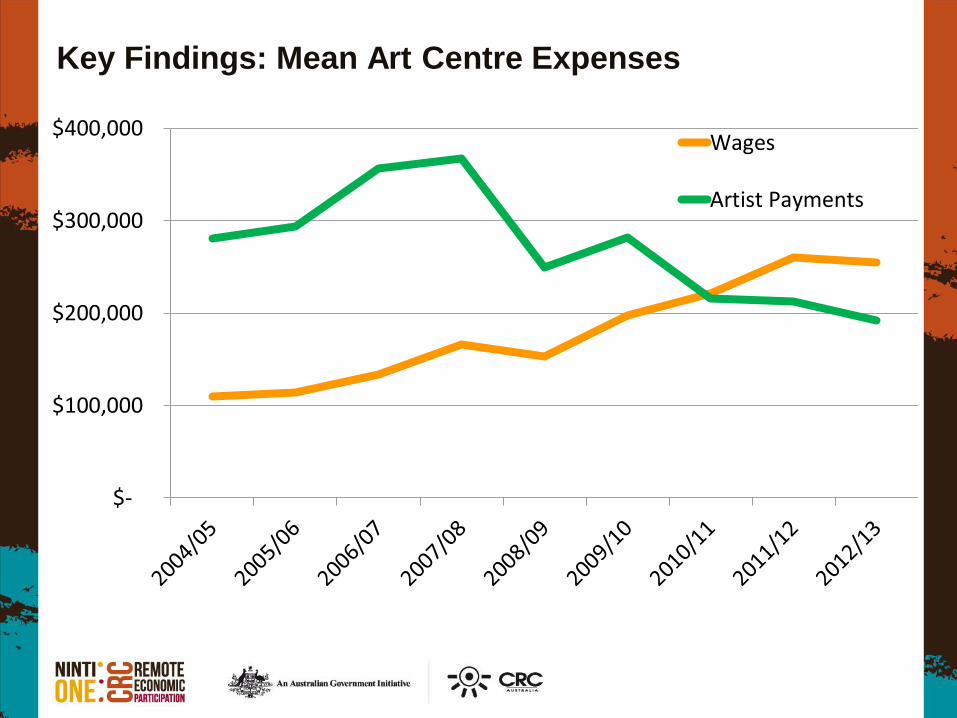
$400,000Wages
Artist Payments
Key Findings: Mean Art Centre Expenses
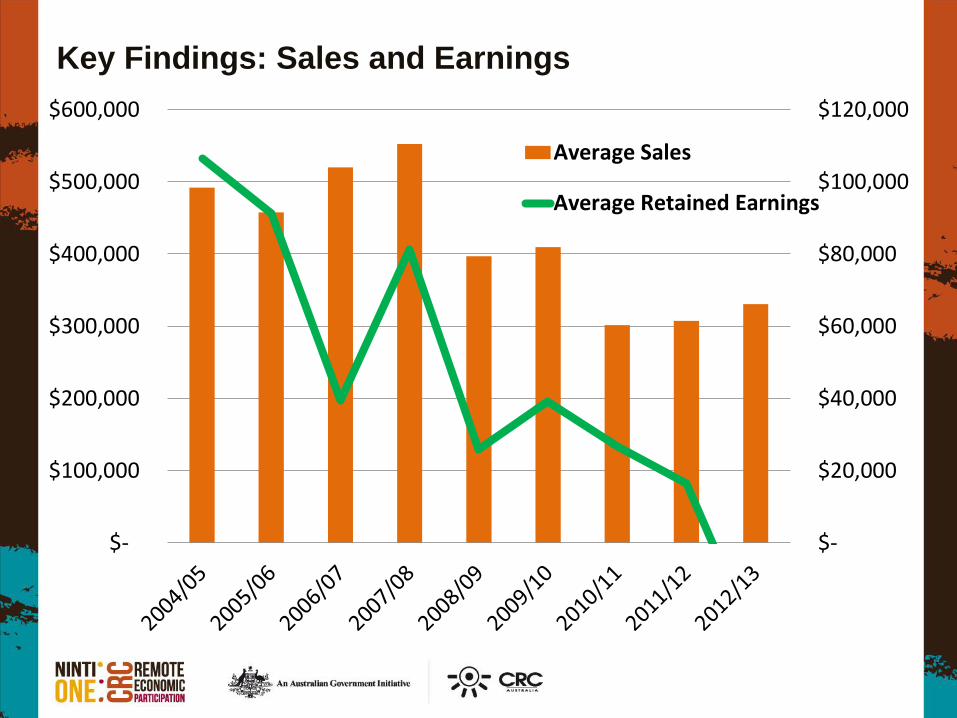
$-
$20,000
$40,000
$60,000
$80,000
$100,000
$120,000
$-
$100,000
$200,000
$300,000
$400,000
$500,000
$600,000
Average Sales
Average Retained Earnings
Key Findings: Sales and Earnings
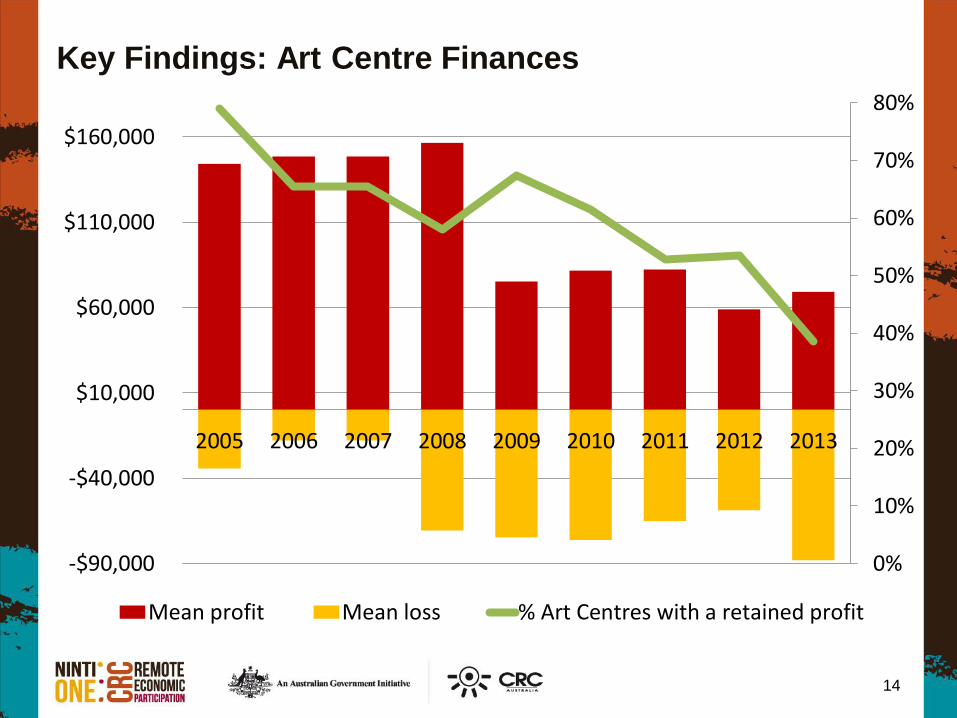
Key Findings: Art Centre Finances
14
0%
10%
20%
30%
40%
50%
60%
70%
80%
-$90,000
-$40,000
$10,000
$60,000
$110,000
$160,000
2005 2006 2007 2008 2009 2010 2011 2012 2013
Mean profit Mean loss % Art Centres with a retained profit
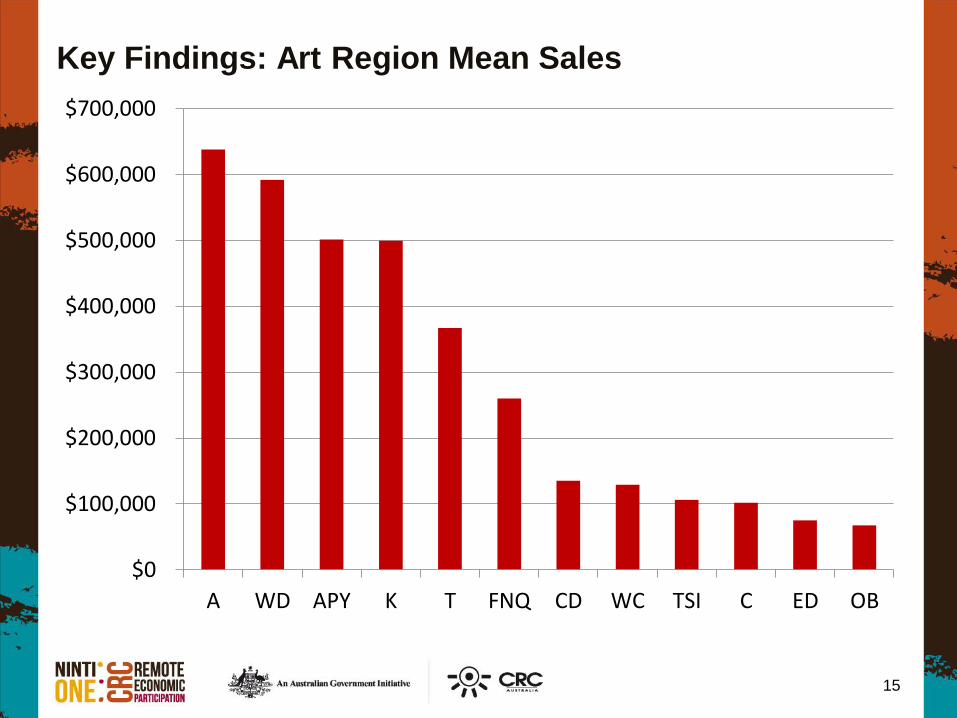
Key Findings: Art Region Mean Sales
15
$0
$100,000
$200,000
$300,000
$400,000
$500,000
$600,000
$700,000
A WD APY K T FNQ CD WC TSI C ED OB
Key Findings: Production and Sales
14,107 artists: 13,196 working with art centres; 70%
female and 30% over 55 years old. Male artists earn
more than female artists.
Growth in sales and production, but production has
grown faster than sales = oversupply.
Average price for artworks is falling.
Paintings dominate: 64% of production, 91% of value
Big, expensive works have seen the greatest falls.
16
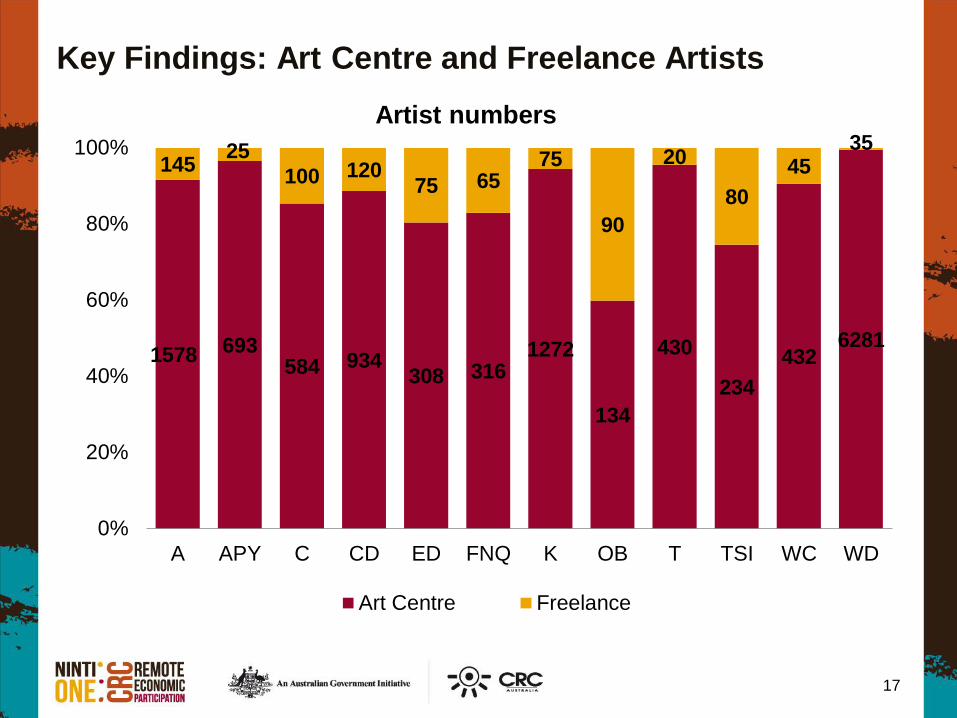
Key Findings: Art Centre and Freelance Artists
17
1578 693 584 934
308 316 1272
134
430
234
432 6281
145 25
100 120 75 65
75
90
20
80
45 35
0%
20%
40%
60%
80%
100%
A APY C CD ED FNQ K OB T TSI WC WD
Artist numbers
Art Centre Freelance
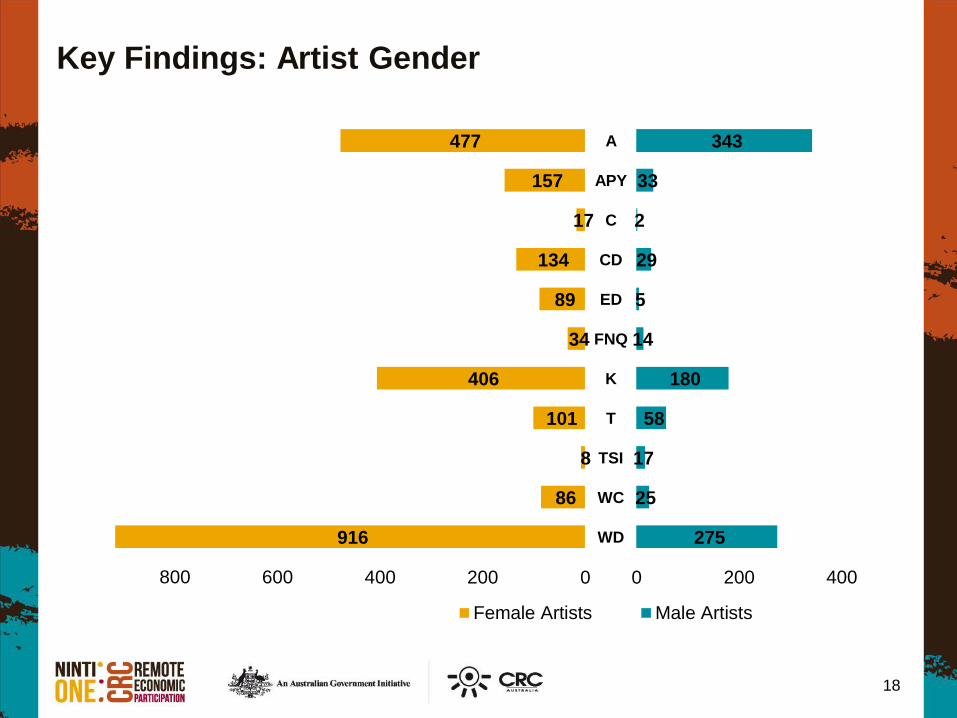
Key Findings: Artist Gender
18
916
86
8
101
406
34
89
134
17
157
477
WD
WC
TSI
T
K
FNQ
ED
CD
C
APY
A
275
25
17
58
180
14
5
29
2
33
343
800 600 400 200 0 0 200 400
Female Artists Male Artists
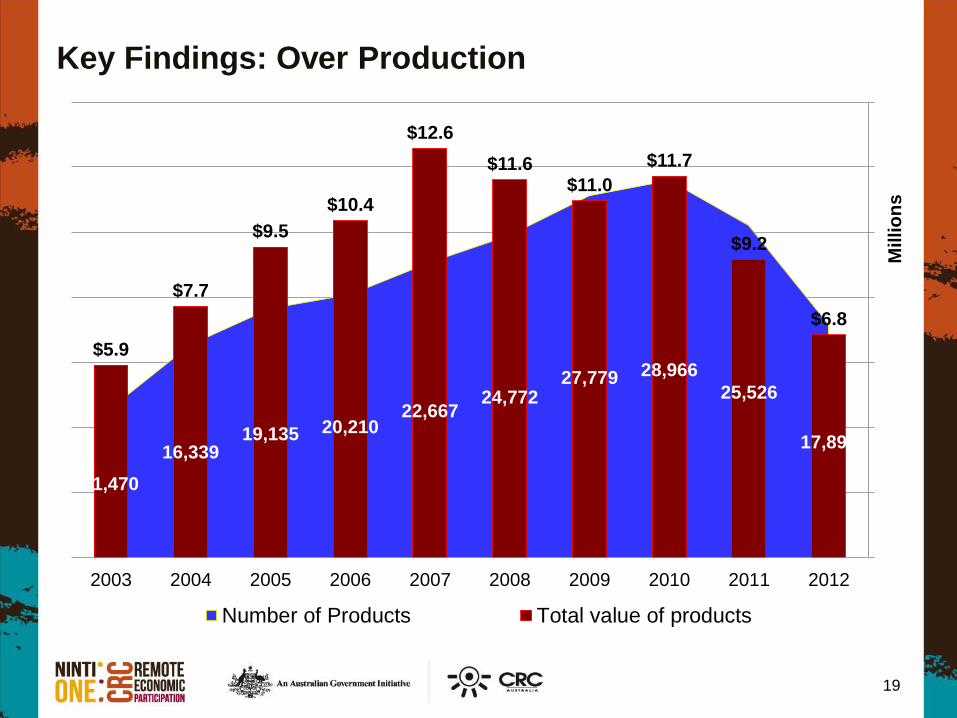
Key Findings: Over Production
19
11,470
16,339 19,135 20,210
22,667 24,772
27,779 28,966
25,526
17,890
$5.9
$7.7
$9.5
$10.4
$12.6
$11.6 $11.0
$11.7
$9.2
$6.8
2003 2004 2005 2006 2007 2008 2009 2010 2011 2012
Millio
ns
Number of Products Total value of products
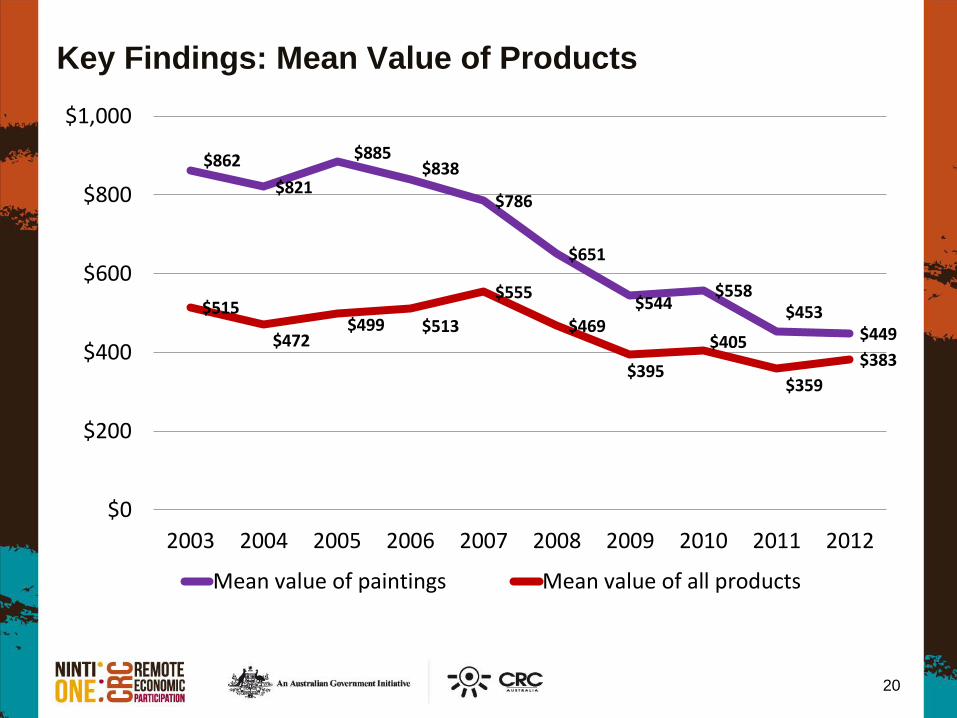
Key Findings: Mean Value of Products
20
$862
$821
$885 $838
$786
$651
$544 $558
$453 $449
$515
$472 $499 $513
$555
$469
$395
$405
$359
$383
$0
$200
$400
$600
$800
$1,000
2003 2004 2005 2006 2007 2008 2009 2010 2011 2012
Mean value of paintings Mean value of all products
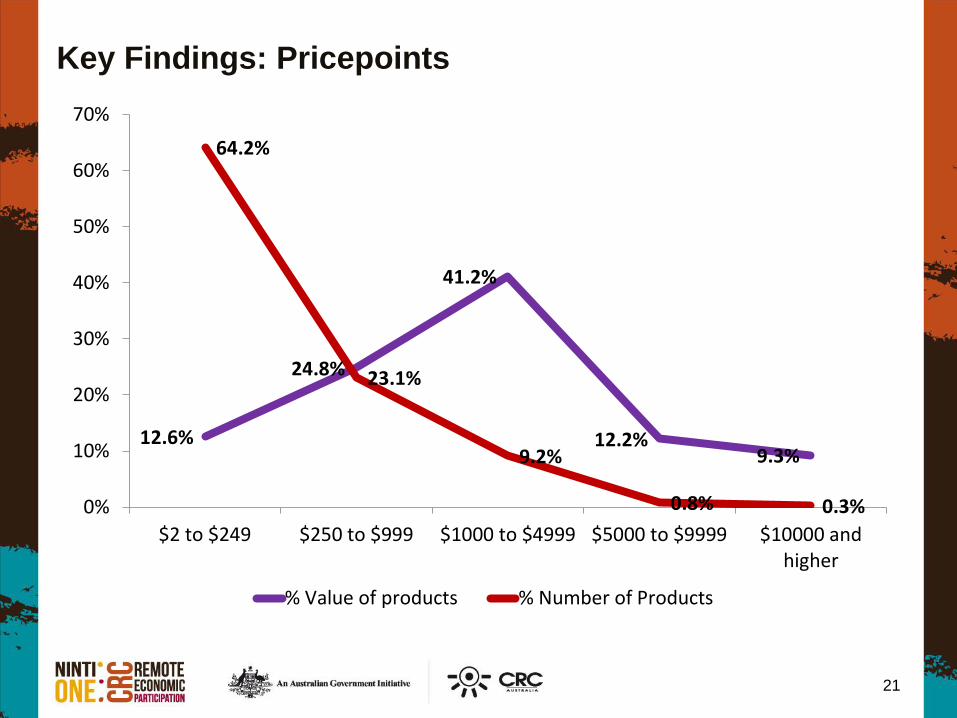
Key Findings: Pricepoints
21
12.6%
24.8%
41.2%
12.2% 9.3%
64.2%
23.1%
9.2%
0.8% 0.3% 0%
10%
20%
30%
40%
50%
60%
70%
$2 to $249 $250 to $999 $1000 to $4999 $5000 to $9999 $10000 andhigher
% Value of products % Number of Products
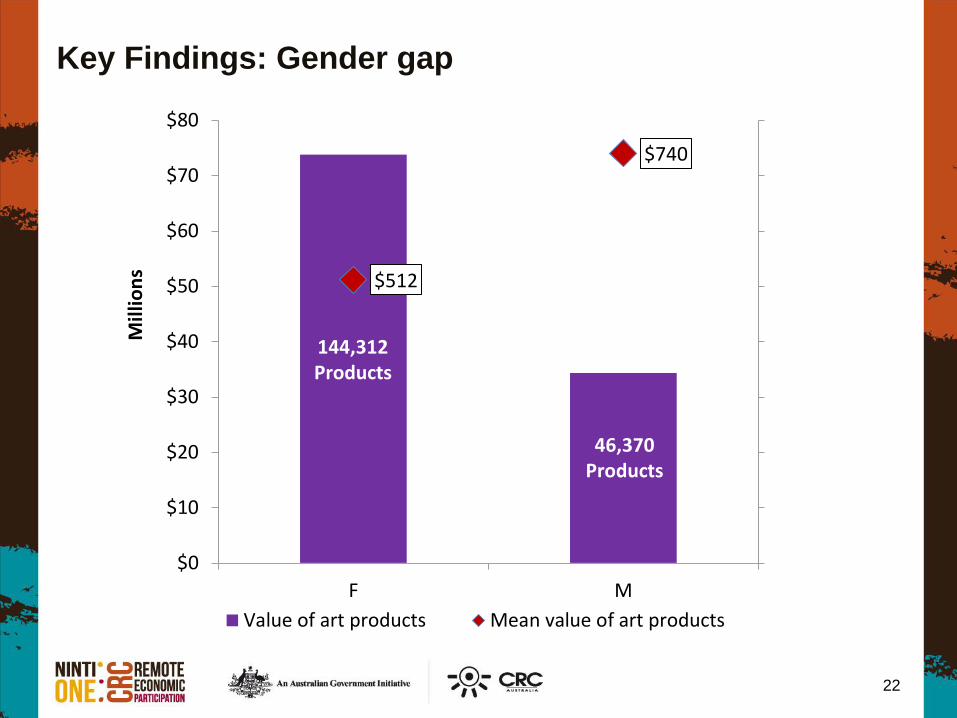
Key Findings: Gender gap
22
$512
$740
$0
$10
$20
$30
$40
$50
$60
$70
$80
F M
Mil
lion
s
Value of art products Mean value of art products
144,312 Products
46,370 Products
Key Findings: Art Businesses
Private art businesses more impacted than public art
businesses.
Some optimism: sales expected to grow.
Western desert art dominates sourcing of works.
Australian customers dominate.
Europe and US are main international markets.
Provenance issues and importance of quality control.
Perceptions + attitudes: buyer / supplier relationships
Business barriers and challenges.
23
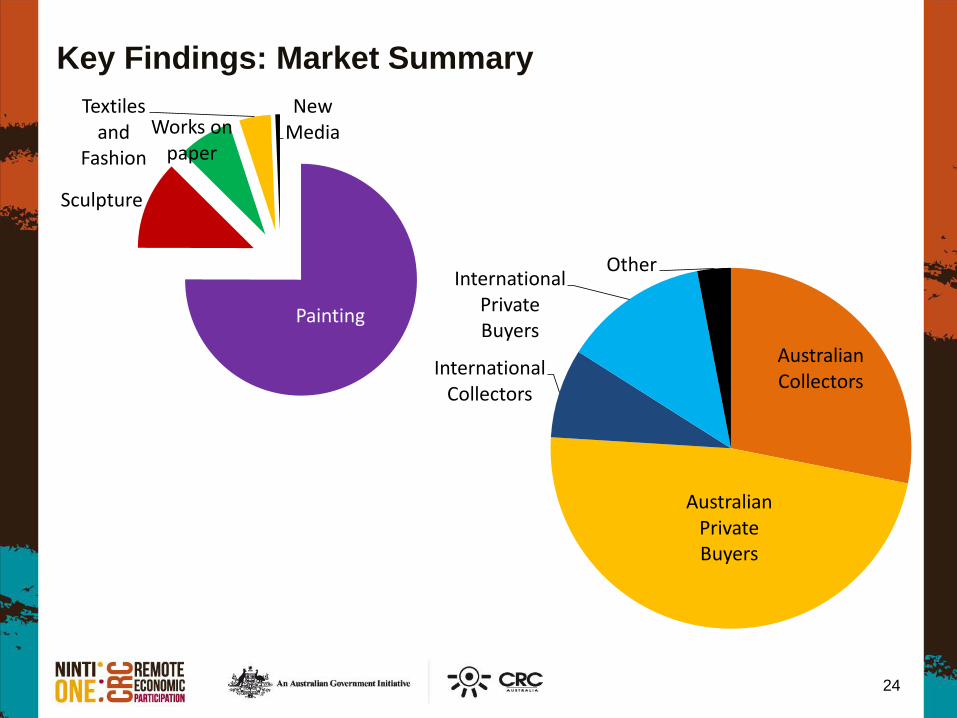
Key Findings: Market Summary
24
Painting
Sculpture
Works on paper
Textiles and
Fashion
New Media
Australian Collectors
Australian Private Buyers
International Collectors
International Private Buyers
Other
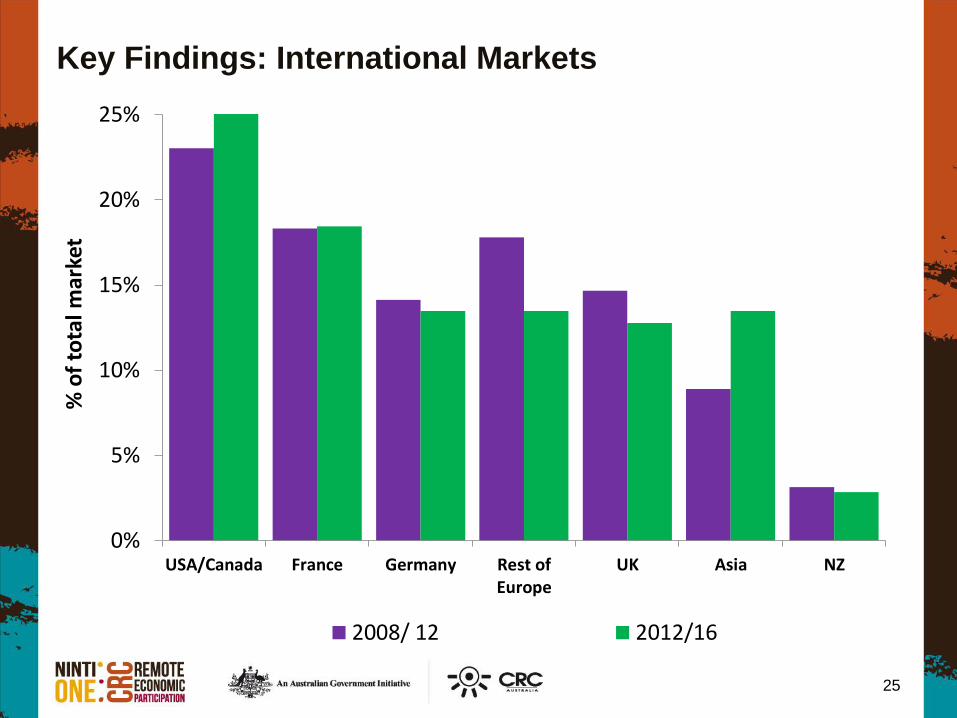
Key Findings: International Markets
25
0%
5%
10%
15%
20%
25%
USA/Canada France Germany Rest ofEurope
UK Asia NZ
% o
f to
tal m
arke
t
2008/ 12 2012/16
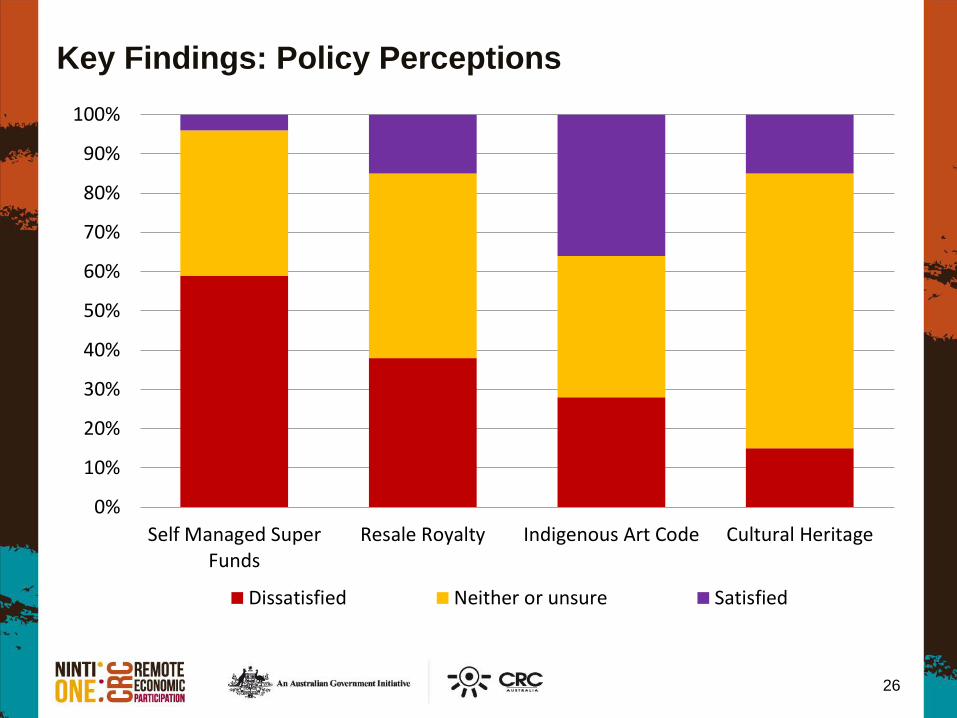
Key Findings: Policy Perceptions
26
0%
10%
20%
30%
40%
50%
60%
70%
80%
90%
100%
Self Managed SuperFunds
Resale Royalty Indigenous Art Code Cultural Heritage
Dissatisfied Neither or unsure Satisfied
Value Chain Project: Informing and Advocating
Outreach for end-users.
Recommendations/Implications
For artists
For art centres
For other art businesses
For peak bodies
For policy makers/funders
For the research community
27
Project Outputs
Reports and other publications:
• http://crc-rep.com/research/enterprise-
development/aboriginal-and-torres-strait-islander-
art-economies/project-outputs
Art Atlas:
• http://www.users.on.net/~s.moyle/Art_Atlas_Financi
als/atlas.html
28
Other Research Topics
Art Centre sustainability: Kim Petersen
Art Centre enabling environment: Susan
Congreve
Buyer behaviour: Jessica Booth
E-commerce in Art Centres: Iris Bendor
Art Centre human resources: Michelle Whittle
Artsworker employment: various.
Art Outside Art Centres: Dr Lisa Stefanoff and
others
29
30