the arrows on the map indicate major migratory patterns of
TRANSCRIPT


African
American
culture is
rooted in Africa
and is a blend
of chiefly sub-
Saharan
African and
Sahelean
cultures.

The arrows on the map indicate major migratory patterns of Africans and their descendants over the past 500 years. Their forced migration during the Atlantic Slave Trade, when people were deported from ports along the west and east coasts of Africa, is shown. Inland ethnic groups were also captured and sold into slavery. Enslaved Africans entered the major port cities, from which they were distributed throughout the Americas. Despite legal sanctions, the contraband trade from Africa and between countries in the Americas continued until the 1870s. The solid lines on the map indicate migration through 1873.

During the Atlantic Slave Trade, twenty million people from West, West-Central and South-east Africa were transported to the Western Hemisphere as slaves. This population would leave a major influence on the culture of English, French, Portuguese and Spanish New World colonies.
The African Diaspora is the story of how Africans, though scattered and dispersed, managed to retain their traditions and reform their identities in a new world. Elements of African culture such as religion, language, and folklore endured and were the links to their past lives. In the process of Americanization, Africans formed another culture known as African-Americans

1619
The first Africans as slave labor are introduced in America. A Dutch trader exchanges his cargo of 20 Africans for food in Jamestown Virginia, in August of 1619. It is believed that these Africans were sold into conditions similar to indentured servitude - a common practice in England and colonial America. The American slavery system became more developed and codified in its inhumane treatment around 1680.
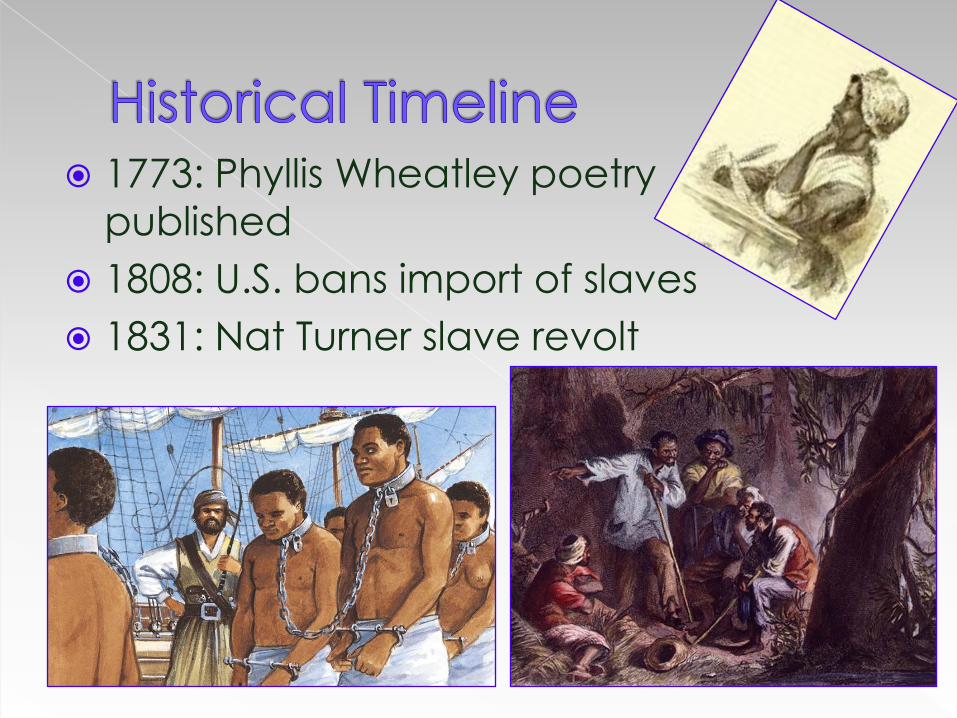
1773: Phyllis Wheatley poetry
published
1808: U.S. bans import of slaves
1831: Nat Turner slave revolt

1839: Amistad Slave
Ship Revolt
1846: Frederick
Douglass
1849: Harriet
Tubman

1850: The Underground Railroad
1852: Uncle Tom’s Cabin
1857: Dred Scott Decision

1861: Civil War begins
1863: Emancipation Proclamation
1865: Civil War ends/Lincoln assassinated
1866: Civil Rights Act passed

1881: Tuskegee Institute Founded
1896: Plessy vs. Ferguson “separate but equal”
1909: NAACP founded
1919: Harlem Renaissance begins

1932: Tuskegee Experiment
begins
1954: Brown vs. Board of
Education
1955: Rosa Parks arrested

1955: Murder of Emmett Till
1963: March on Washington
for Jobs and Freedom
1963: Medgar Evers
assassinated

1964: Civil Rights Act
1965: Voting Rights Act
1965: Malcolm X assassinated
1968: Martin Luther King assassinated

1995: Million Man March
2008: Barack Obama
elected as President of
the U.S.

Christianity is most prevalent
Islam (14% of Muslims in US and Canada
are African American)
Judaism
Buddhism

Kwanzaa or Kwanza , African American scholar and activist "Maulana" Ron Karenga invented the festival of Kwanzaa in 1966, as an alternative to the increasing commercialization of Christmas. Derived from the harvest rituals of Africans, Kwanzaa is observed each year from December 26 through January 1. Participants in Kwanzaa celebrations affirm their African heritage and the importance of family and community by drinking from a unity cup; lighting red, black, and green candles; exchanging heritage symbols, such as African art; and recounting the lives of people who struggled for African and African American freedom.

After the 1896 Supreme Court decision of Plessy vs. Ferguson, the idea of “separate but equal” came to fruition
Black schools and white schools were supposed to be “equal” but most black schools were far inferior to their white counterparts› Fewer resources (Black schools only got 60% of
funding that white schools received)(Lowe, 2004)
› Further distances

In 1954, the Supreme Court decision in Brown vs. Board of Education mandate the desegregation of American schools
BUT it did not require the desegregation of schools by or in a specified time
1957: The Little Rock Nine at Central High School; the first 9 African American students to attend what was a racially segregated school in the U.S.

It was 1968 before courts starting demanding desegregation of schools in the South and 1973 before it was enforced in the North (Lowe, 2004)
Desegregation came at a price
In the South alone:› loss of more than 30,000 black teachers
› and in some states as many as 90 percent of black principals
› loss of many high schools and their cultural traditions.

40.2 million—African Americans in U.S. as of 2006 (including those of more than one race.)
13.4%—of the total U.S. population
18—Number of states with an estimated African American population on July 1, 2006, of at least 1 million. New York, with 3.5 million, led the way. The 17 other states on the list were Alabama, California, Florida, Georgia, Illinois, Louisiana, Maryland, Michigan, Mississippi, New Jersey, North Carolina, Ohio, Pennsylvania, South Carolina, Tennessee, Texas, and Virginia.
US Census Bureau, 2006

31%—the proportion of the population
younger than 18
8%—the proportion of the population 65
and older
US Census Bureau, 2006
2.4 million—Number of military veterans
in the United States in 2006. More military
veterans are African American than any
other minority group.

81%—Percentage of those 25 and older who had at least a high school diploma in 2006.
18%—Percentage of those 25 and older who had a bachelor’s degree or higher in 2006.
1.3 million—the number of those 25 and older who had an advanced degree in 2006 (e.g., master’s, doctorate, medical, or law). In 1996, 683,000 African Americans had this level of education.
2.3 million—Number of African American college students in fall 2005. This was an increase of roughly 1 million from 15 years earlier.
US Census Bureau, 2006

$31,969—The annual median income of single-race households in 2006. In constant dollars, this is up from $26,468 in 1986.
$34,770 & $30,352—The 2006 median earnings of single-race men and women, respectively, 15 and older who worked full time, year-round.
24.3%—Poverty rate in 2006 for single-race African Americans. This rate was down from 31.1% in 1986.
20.5%—The percentage of single-race African Americans lacking health insurance in 2006, up from 19% in 2005.
US Census Bureau, 2006

64%—Percentage of households that contained a family. There were 8.4 million African American family households.
45%—Nationally, the percentage of families containing a married-couple family.
1.2 million—Number of grandparents living with their own grandchildren younger than 18. Of this number, 51% were also responsible for their care.
US Census Bureau, 2006

Homeownership
46%—Nationally, the percentage of households that lived in owner-occupied homes. The rate was higher in certain states, such as Mississippi, where it reached 58%.
Jobs
26%—The percentage of those16 and older who work in management, professional and related occupations. There are 44,900 physicians and surgeons, 80,000 postsecondary teachers, 48,300 lawyers, and 52,400 chief executives.
US Census Bureau, 2006

Movement and kinesthetic abilities highly
developed
Value imagination and humor
Ability to express feelings and emotions,
both verbally and nonverbally; strong
oral language tradition
Richness of imagery in informal language
Experience with independent action
and self-sufficiency

Physical action orientation (learn by doing)
Learn quickly through hands-on
experience, manipulative materials, and
multiple stimuli
People oriented (focus on people rather
than objects)
Resourcefulness, unique problem solving
abilities
Tend to view things in their entirety--not in
separate pieces

Preference for the oral mode of
presentation in learning
Use of inferences, may approximate
time/space/number
Alert, curious, good retention and use of
ideas
Ability to navigate between two cultures,
some subgroups have high assimilation
to mainstream learning styles

Kinesthetic/tactile learning
Subdued lighting rather than bright light
rely heavily on visual input rather than auditory input
respond highly to cooperative learning
discussion style is simultaneous talk instead of alternating talk
Trait of verbal communication is the use of colorful language

prefer to study while music or
conversation occurs in the room
have an outer-directed rather than a
egocentric focus
rely more on information from their
surroundings
prefer and are interested in working with
people
like to work in groups

prefer to maintain close proximity to
other students
react intensely to being praised or
criticized
function better under cooperative
conditions
respond better to rewards such as praise,
smiles, pats on the back, and the like

learn much better when the curriculum is
humanized, attributes human
characteristics to concepts and
principals
Many students avert their eyes while
being confronted about their behavior,
and teachers may misinterpret their lack
of eye contact as indicating insincerity
and guilt.

Note: Cultural learning styles are intended as general guides--not absolutes for all members of an ethnic group. Sources: (Davis, G. & Rimm, S., 1997) (Dresser, N., 1996) (Education Alliance at Brown University, 2002) (Lynch, E. & Hanson M., 1997) (McPhatter, A., 1997) (Murphy, E. & Nesby, T., 2002) (Nash, K., 1999) (Robinson, L., 1998) (Sparks, S., 2000) (Srebalus, D., & Brown, D., 2001) (Ting-Toomey, S., 1999) (Vasquez, J., 1990).

Reference: Effective Education of African American Exceptional Learners- New Perspectives edited by Bridgie Alexis Ford, Festus E Obiakor, and James M. Patton © 1995 by PRO-ED, Inc. 8700 Shoal Creek Boulevard Austin, TX 78757-6897
Reference: Teaching In A Diverse SocietyHerbert Grossman LC 1099.3.G76 1995Copyright 1995 by Allyn & BaconA Simon and Schuster CompanyNeedham Heights, MA

http://www.biography.com/blackhistory/black-history-timeline.jsp
http://www.si.umich.edu/CHICO/Schomburg/text/migration5.html
http://www.as.wvu.edu/~equity/african.html#sect7
http://fycs-diversity.ifas.ufl.edu/diversity%20website/unit2.pdf
Lowe, R. (2004). The strange history of school desegregation. Rethinking Schools Online, 18(3). Retrieved November 3, 2008, from http://www.rethinkingschools.org/archive/18_03/stra183.shtml