the arousal-performance relationship: task characteristics ...€¦ · the inverted-u hypothesis...
TRANSCRIPT

The Sport Psychotogisf, 1988, 2, 13-27
The Arousal-Performance Relationship: Task Characteristics and Performance Measures
in Track and Field Athletics
Vicki Ebbeck and Maureen R. Weiss University of Oregon
Two issues regarding the arousal-performance relationship in sport were ad- dressed in this study: the relationship between task complexity, optimal arousal, and maximal performance, and the appropriateness of using various measures of performance. Data were collected from high school athletes (n=51) across four track and field meets. State anxiety was obtained prior to each performance and three performance measures were obtained (event results, and quality of performance evaluated by the athlete and by the coach). Results indicated that the three performance measures were not equally related to A-state, suggesting that the relationship between arousal and performance results in a different description depending upon the performance measure that is used. Furthermore, degree of task complexity wuld not be distinguished across various track and field events. When individual events were used to examine the arousal-performanceltask complexity relationship, results revealed that level of A-state needed for maximal performance could not be differen- tiated for specific events, nor could it be determined for above average, aver- age, or below average performances on any one event.
The level of arousal an athlete experiences is a major contributing factor to subsequent performance, in terms of both the quality of movements and the quantity of outcome (Beuter & Duda, 1985; Gill, 1986; Landers & Boutcher, 1986; Weinberg & Hunt, 1976). In addition, an inappropriate arousal level may detract from an athlete's motivation to participate in and enjoy movement expe- riences. Therefore it is not surprising that the relationship between arousal and performance has interested not only sport psychologists but also practitioners and participants as well. A clearer understanding of this relationship would facilitate the pursuit of maximal performance by both athletes and coaches and would as- sist in designing tangible methods for monitoring arousal levels.
A number of interpretations have attempted to explain the arousal-perfor- mance relationship, the two most noted being drive theory (Spence, 1956) and
About the Authors: Vicki Ebbeck and Maureen R. Weiss are with the Department of Human Movement Studies, Esslinger Hall, University of Oregon, Eugene, OR 97403.

14 Ebbeck and Weiss
the inverted-U hypothesis (Yerkes & Dodson, 1908). The inverted-U hypothe- sis, which is now preferred to.the drive theory (Gill, 1986), posits that perfor- mance is progressively enhanced as the level of arousal continues to increase. After a certain optimal level of arousal is attained, however, subsequent perfor- mance will deteriorate with further increases in arousal. A greater understanding of the inverted-U hypothesis is gained by examining how certain mediating vari- ables influence this relationship between arousal and performance.
Task Complexity as a Mediator of the Arousal-Performance Relationship
Three variables frequently identified as mediators of the arousal-performance rela- tionship are individual differences, the level of evaluation potential available in each situation, and task characteristics (Bird & Cripe, 1986; Gill, 1986). This study focused on the mediating variable of task characteristics. Specifically, the notion that task demands prescribe the level of arousal required for maximal perfor- mance was examined. Two interpretations have attempted to identify the condi- tions that exist in order to predict the relationship between task characteristics, arousal levels, and maximal performance.
One explanation of the arousal-task interaction has been provided by Oxen- dine (1970). Oxendine suggested that a high arousal level is desirable for maxi- mal performance of gross motor tasks demanding a high amount of endurance, strength, and speed such as football blocking, 200m and 400m sprints, and weight lifting. High arousal levels are considered detrimental to performance of com- plex skills, however, or to those requiring fine muscle movements, coordina- tion, steadiness, and general concentration such as archery, golf putting, and bowling. Despite the frequent occurrence of Oxendine's notion in the arousal- performance literature, limited empirical research has been conducted to exa- mine this hypothesis (Basler, Fisher, & Mumford, 1976; Landers, 1978; Wein- berg & Genuchi, 1980).
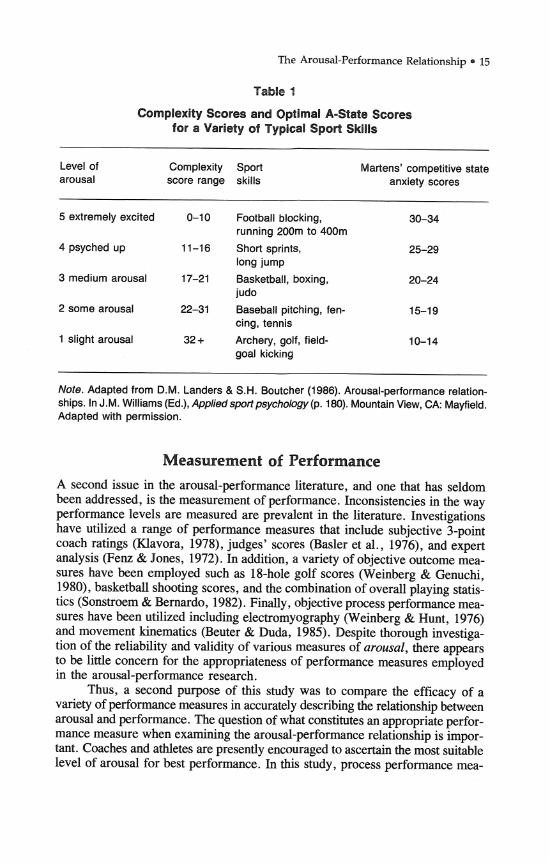
The inability to provide a quantifiable system for classifying different tasks according to arousal levels needed for maximal performance has restrained empirical research that tests Oxendine's hypothesis. A more complete study of the arousal-task interaction requires that levels of optimal arousal and the clas- sification of task characteristics be operationalized. Landers and Boutcher (1986) have attempted to categorize tasks along a complexity scale and to align tasks varying in complexity with an optimal A-state score. Thus, a testable "if, if, then" paradigm was established. Zfthe complexity of a task can be determined by Landers and Boutcher's scale, and if the prescribed optimal arousal level, as measured on the CSAI-1, is attained for that task by an athlete, then it is hypothesized that maximal performance will result. A chart describing task complexity scores, levels of optimal arousal, and examples of specific sport skills is depicted in Table 1. One purpose of this study, therefore, was to investigate this "if, if, then" paradigm as it relates to the arousal-performance relationship. Both the utility of the com- plexity scale and the parallel CSAI-1 optimal arousal scores in predicting maxi- mal performance were examined.
The Arousal-Performance Relationship 15
Table 1
Complexity Scores and Optimal A-State Scores for a Variety of Typical Sport Skills
Level of Complexity Sport arousal score range skills
Martens' competitive state anxiety scores
5 extremely excited 0-10 Football blocking, 30-34 running 200m to 400m
4 psyched up 11-16 Short sprints, 25-29 long jump
3 medium arousal 17-21 Basketball, boxing, 20-24 judo
2 some arousal 22-31 Baseball pitching, fen- 15-19 cing, tennis
1 slight arousal 32+ Archery, golf, field- 10-1 4 goal kicking
Note. Adapted from D.M. Landers & S.H. Boutcher (1986). Arousal-performance relation- ships. In J.M. Williams (Ed.), Applied sportpsychology (p. 180). Mountain View, CA: Mayfield. Adapted with permission.
Measurement of Performance A second issue in the arousal-performance literature, and one that has seldom been addressed, is the measurement of performance. Inconsistencies in the way performance levels are measured are prevalent in the literature. Investigations have utilized a range of performance measures that include subjective 3-point coach ratings (Klavora, 1978), judges' scores (Basler et al., 1976), and expert analysis (Fenz & Jones, 1972). In addition, a variety of objective outcome mea- sures have been employed such as 18-hole golf scores (Weinberg & Genuchi, 1980), basketball shooting scores, and the combination of overall playing statis- tics (Sonstroem & Bemardo, 1982). Finally, objective process performance mea- sures have been utilized including electromyography (Weinberg & Hunt, 1976) and movement kinematics (Beuter & Duda, 1985). Despite thorough investiga- tion of the reliability and validity of various measures of arousal, there appears to be little concern for the appropriateness of performance measures employed in the arousal-performance research.
Thus, a second purpose of this study was to compare the efficacy of a variety of performance measures in accurately describing the relationship between arousal and performance. The question of what constitutes an appropriate perfor- mance measure when examining the arousal-performance relationship is irnpor- tant. Coaches and athletes are presently encouraged to ascertain the most suitable level of arousal for best performance. In this study, process performance mea-
16 Ebbeck and Weiss
sures were assessed as the perceptions of the athlete and of the coach in evaluat- ing components such as timing, concentration, effort, and confidence inherent in executing a skill. In contrast, an objective outcome measure served as a social comparison record of performance results. It was hypothesized that,
1. The three performance measures (objective outcome, process evaluation by athlete, process evaluation by coach) are all related equivalently to A-state scores.
2. Maximal performance can be predicted in track and field events via the following methods: (a) events can be categorized according to their com- plexity, as indicated by Landers and Boutcher (1986), (b) event complexi- ty scores can be aligned with Landers and Boutcher's prescribed range of optimal A-state scores for each event, and (c) optimal A-state scores based on event complexity are positively related to maximal performance.
Method Subjects
Subjects consisted of high school track and field athletes who attended the same large-division high school in the U.S. Pacific Northwest. The sample comprised 5 1 athletes (31 males and 20 females) who ranged in age from 14 to 18. Compe- titors from throwing, jumping, sprinting, and running events were represented. Age and gender of the subjects were distributed approximately equally across track and field events. In addition, the four high school track and field coaches agreed to participate in the study by rating the quality of performance each ath- lete demonstrated during the meets. Finally, 12 track and field coaches with an average of 8 years coaching experience were employed to initially complete the task complexity scale (Landers & Boutcher, 1986) designed to rank track and field events from the most simple to the most complex.
Measures Arousal. State anxiety was measured using the Competitive State Anxiety
Inventory (CSAI-1) developed by Martens, Burton, Rivkin, and Simon (1980). It is a competition-specific self-report measure comprising 10 items. As the CSAI is an abbreviated form of the State Anxiety Inventory (Spielberger, Gorsuch, & Lushene, 1970), it has the support of the SAI validation research completed by Spielberger et al. (1970). Finally, after an examination of the reliability (r = .96) and validity of the CSAI-1, Martens et al. (1980) concluded that "the accumulat- ed evidence presents a strong case for the use of the CSAI in the competitive sport situations" (p. 91). This study utilized the CSAI-1 so that optimal arousal scores, tabulated by Landers and Boutcher (1986), could be tested as predictors of maximal performance for tasks varying in complexity.
Perfonnance. Three performance measures were employed in the study. The actual performance results (objective outcome) of time, height, or distance officially recorded for each athlete during a meet represented one measure. In addition, two paper-and-pencil self-report questionnaires were developed. They were devised in response to the current lack of subjective process-oriented perfor- mance evaluations that are sport-specific.
Questionnaire-A allowed the athlete to assess the quality of his or her per-
The Arousal-Performance Relationship 17
formance by responding to a Likert-type format. The eight items addressed charac- teristics such as the athlete's rhythm and timing, concentration, and effort. This questionnaire acknowledged that an athlete may achieve a personal best but report that the performance "just didn't feel right," or just the reverse. Therefore the main focus was on quality of the performance process as perceived by the ath- lete. This questionnaire is reproduced in Appendix A.
The third performance measure assessed the athlete's performance from the perspective of the coach (called Questionnaire-C). This instrument paralleled Questionnaire-A in that each item was identical but requested information from the coach's perspective. This provided a dual interpretation of the quality of the athlete's performance as viewed by the athlete and by the coach.
Feedback from three track and field coaches provided face validity for both Questionnaire-A and Questionnaire-C. Based on 104 individual performances, the internal consistency of the scale was determined by conducting a Cronbach's (1951) alpha reliability procedure. An alpha coefficient of r = .92 was obtained for both inventories, indicating that the items were all related in their measure- ment of a single construct. As the internal consistency was high, the scores of the items were summed to form a single composite score of athletic performance as perceived by the athlete and by the coach, respectively.
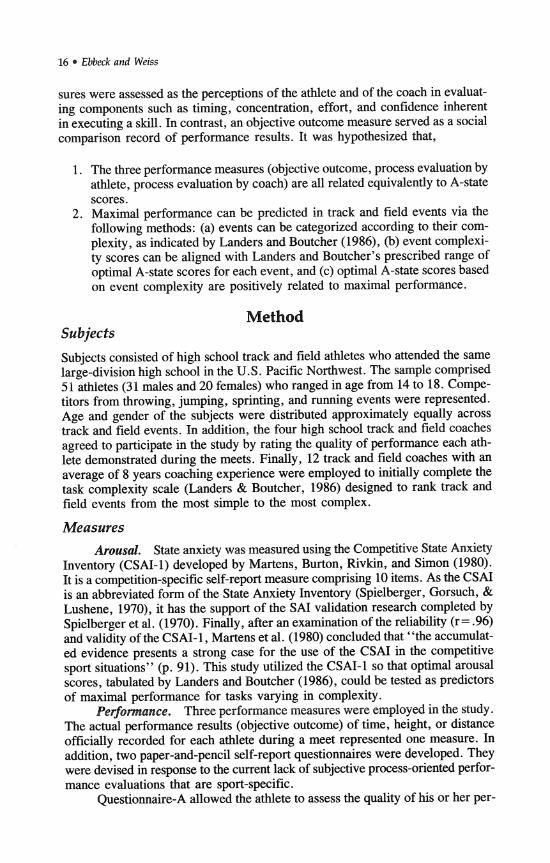
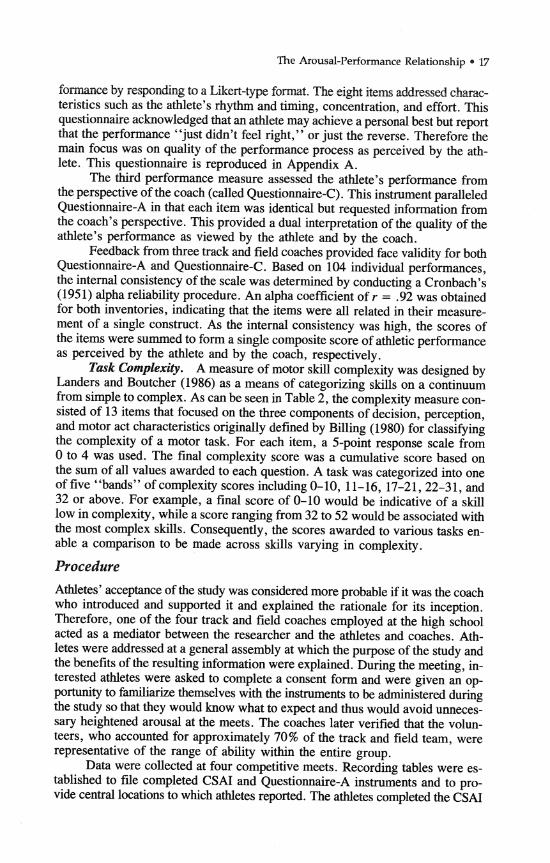
Task Complexity. A measure of motor skill complexity was designed by Landers and Boutcher (1986) as a means of categorizing skills on a continuum from simple to complex. As can be seen in Table 2, the complexity measure con- sisted of 13 items that focused on the three components of decision, perception, and motor act characteristics originally defined by Billing (1980) for classifying the complexity of a motor task. For each item, a 5-point response scale from 0 to 4 was used. The final complexity score was a cumulative score based on the sum of all values awarded to each question. A task was categorized into one of five "bands" of complexity scores including 0-10, 11-16, 17-21,22-31, and 32 or above. For example, a final score of 0-10 would be indicative of a skill low in complexity, while a score ranging from 32 to 52 would be associated with the most complex skills. Consequently, the scores awarded to various tasks en- able a comparison to be made across skills varying in complexity.
Procedure
Athletes' acceptance of the study was considered more probable if it was the coach who introduced and supported it and explained the rationale for its inception. Therefore, one of the four track and field coaches employed at the high school acted as a mediator between the researcher and the athletes and coaches. Ath- letes were addressed at a general assembly at which the purpose of the study and the benefits of the resulting information were explained. During the meeting, in- terested athletes were asked to complete a consent form and were given an op- portunity to familiarize themselves with the instruments to be administered during the study so that they would know what to expect and thus would avoid unneces- sary heightened arousal at the meets. The coaches later verified that the volun- teers, who accounted for approximately 70% of the track and field team, were representative of the range of ability within the entire group.
Data were collected at four competitive meets. Recording tables were es- tablished to file completed CSAI and Questionnaire-A instruments and to pro- vide central locations to which athletes reported. The athletes completed the CSAI
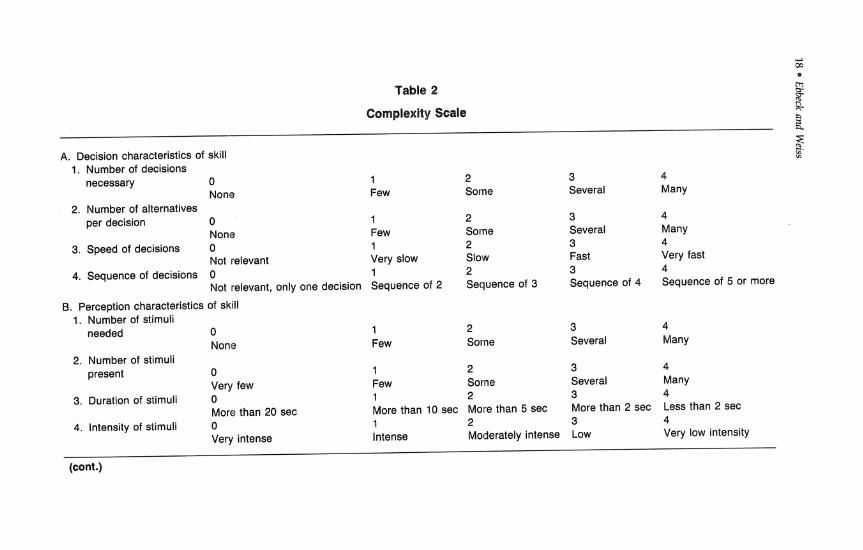
Table 2
Complexity Scale % 9
a
A. Decision characteristics of skill 1. Number of decisions
necessary 0 None
2. Number of alternatives per decision 0
None 3. Speed of decisions 0
Not relevant 4. Sequence of decisions 0
Not relevant, only one decision
6. Perception characteristics of skill 1. Number of stimuli
needed 0 None
2. Number of stimuli present 0
Very few 3. Duration of stimuli 0
More than 20 sec 4. Intensity of stimuli 0
Very intense
1 Few
1 Few 1 Very slow 1 Sequence of 2
2 Some
2 Some 2 Slow 2 Sequence of 3
1 2 Few Some
1 2 Few Some 1 2 More than 10 sec More than 5 sec 1 2 Intense Moderately intense
3 Several
3 Several 3 Fast 3 Sequence of 4
3 Several
3 Several 3 More than 2 sec 3 Low
4 Many
4 Many 4 Very fast 4 Sequence of 5 or more
4 Many
4 Many 4 Less than 2 sec 4 Very low intensity
(cont.)

Table 2 (cont.)
5. Clarity of correct stimulus among con- flicting stimuli ' 0
Very obvious
C. Motor act characteristics of skill 1. Number of muscle
actions to execute skill 0 1-2
2. Amount of coordina- tion of actions 0
Minimal
3. Precision and steadi- ness required 0
None 4. Fine motor skill re-
quired 0 None, only gross motor skill required
1 2 3 4 Obvious Moderately obvious Subtle difference Very subtle difference
1 A little
1 Minimal
1 Minimal
2 Some
2 Some
2 Some
3 4 7-8 9 or more
3 4 Several coordi- A great deal native actions 2 3 4
? 0
Considerable A great deal iki
3 4 Considerable A great deal
Note. From D.M. Landers & S.H. Boutcher (1986). Arousal-performance relationships. In J.M. Williams (Ed.), Applied sport psychology (pp. 178-179). k Mountain View, CA: Mayfield. Reprinted with permission. g.
2 LI 'd
0
CI \D

20 Ebbeck and Weiss
no later than 15 minutes prior to performing each event. It is recognized that in the ideal situation all data would have been collected closer than 15 minutes to the event and recorded prior to each athlete's performance in those events com- prising repeated attempts, such as the high jump. This would have provided a more accurate reflection of each athlete's preperformance anxiety level. How- ever, the constraints imposed by the field setting prevented such frequent and potentially disruptive monitoring of the participants. Most athletes completed Questionnaire-A immediately after or at most within 15 minutes of finishing their event. Athletes repeated this procedure for each event in which they competed, and an accurate account of participation was maintained at the recording tables. After the meet this account was distributed to the coaches, who used it as a direc- tory for completing Questionnaire-C for the athletes whose performances they had observed. The coaches never viewed the completed Questionnaire-A responses returned by the athletes. Finally, actual meet results provided the objective mea- sure of performance.
In addition, 12 track and field coaches were asked to complete the task complexity scale (prior to data collection), and these scores were used to guide the study of optimal state anxiety across tasks of varying complexity. Informa- tion was distributed to track and field coaches at the high school, university, or club level. A letter introducing the study and its purpose was accompanied by a questionnaire designed to quantify the complexity of a motor performance. A list of 25 track and field events represented the selection of tasks to be analyzed. Coaches were asked to apply the questions only to those events with which they felt sufficiently comfortable. It was anticipated that this information would pro- vide a hierarchy of track and field events from the least to the most complex.
Results Repeated performance and A-state measures were recorded for each individual across four meets in order to conduct analyses across events as well as within individuals. Several incidents occurred that prevented obtaining the repeated- measures data across athletes, however, such as illness of or injury to an athlete, an athlete forgetting to complete the performance or A-state questionnaires, or a coach not observing an event and thus preventing the assessment of an athlete's performance. Therefore, results were calculated based on a total of 180 perfor- mances recorded by all athletes across the four meets.
Correlations Among Performance Measures and Anxiety Correlations among the three performance measures (objective outcome, athlete's perception, and coach's perception) and A-state were determined in order to test the first hypothesis, that performance measures would be equally related to A- state scores. A moderate but significant Pearson product-moment correlation co- efficient (r= .51, p < .001) was found between athlete's perception and coach's perception across 104 complete performance data points.
Since the objective outcome performance measure was quantified differently across events, correlations among these measures were computed on an event- by-event basis. Pearson product-moment correlations were computed for those

The Arousal-Performance Relationship 21
events represented by at least 12 performances in a particular event. These events included the javelin, mile relay, 400m, 800111, and 1500m.
The correlations among performance measures by event are presented in Table 3. The relationships are generally low between the objective performance measure and both the athlete's and coach's perceptions. For example, the corre- lations between the athlete's perception and the objective measure of performance ranged from r= .17 to r= - .68.' Four of the five correlations were + -40 or lower. It would appear that the three approaches to assessing performance were suffi- ciently diverse to generally result in a low relationship among the performance measures across events.
Finally, the performance measures and state anxiety were examined. A breakdown of events represented by a minimum of 12 performances (similar to the performance correlations) generally indicated a low relationship between A- state and each performance measure. Table 3 illustrates the correlation coeffi- cients between A-state and each of these scores. Specifically, correlations be- tween A-state and objective performance scores ranged in absolute values from r= .03 to .27 across events. Results indicated relationships of r= -01 to -.42 between A-state and Questionnaire-A scores. Finally, despite a high correlation coefficient of r= .79 in the javelin event, A-state and Questionnaire-C scores tended to demonstrate a low to moderate relationship of r=.02 to -.53.
Table 3
Correlations Among Performance and A-State Measures for Five Track and Field Events
Correlations
Mile Javelin relay 400m 800m 1500m
(n) (n) (n) (n) (n)
QuestionnaireA & Questionnaire-C .49 .17 (6) (15)
Questionnaire4 & objective measure - .28 .17 (13) (20)
Questionnaire-C & objective measure - .08 - .15 (8) (16)
A-State & Questionnaire-A .O1 .05 (14) (20)
A-State & Questionnaire-C .79** - .53* (8) (16)
A-State & objective measure .14 .03 (14) (21)
22 Ebbeck and Weiss
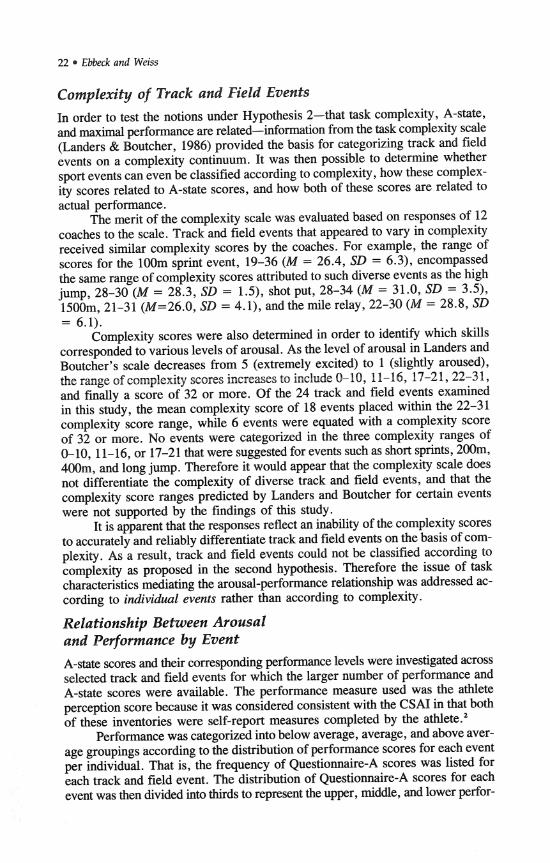
Complexity of Track and Field Events In order to test the notions under Hypothesis 2-that task complexity, A-state, and maximal performance are related-information from the task complexity scale (Landers & Boutcher, 1986) provided the basis for categorizing track and field events on a complexity continuum. It was then possible to determine whether sport events can even be classified according to complexity, how these complex- ity scores related to A-state scores, and how both of these scores are related to actual performance.
The merit of the complexity scale was evaluated based on responses of 12 coaches to the scale. Track and field events that appeared to vary in complexity received similar complexity scores by the coaches. For example, the range of scores for the lOOm sprint event, 19-36 (M = 26.4, SD = 6.3), encompassed the same range of complexity scores attributed to such diverse events as the high jump, 28-30 (M = 28.3, SD = 1.9 , shot put, 28-34 (M = 31 .O, SD = 3.5), 1500m, 21-31 (M=26.0, SD = 4.1), and the mile relay, 22-30 (M = 28.8, SD = 6.1).
Complexity scores were also determined in order to identify which skills corresponded to various levels of arousal. As the level of arousal in Landers and Boutcher's scale decreases from 5 (extremely excited) to 1 (slightly aroused), the range of complexity scores increases to include 0- 10, 11-16, 17-2 1,22-3 1, and finally a score of 32 or more. Of the 24 track and field events examined in this study, the mean complexity score of 18 events placed within the 22-31 complexity score range, while 6 events were equated with a complexity score of 32 or more. No events were categorized in the three complexity ranges of 0-10,ll- 16, or 17-21 that were suggested for events such as short sprints, 200m, 400m, and long jump. Therefore it would appear that the complexity scale does not differentiate the complexity of diverse track and field events, and that the complexity score ranges predicted by Landers and Boutcher for certain events were not supported by the findings of this study.
It is apparent that the responses reflect an inability of the complexity scores to accurately and reliably differentiate track and field events on the basis of com- plexity. As a result, track and field events could not be classified according to complexity as proposed in the second hypothesis. Therefore the issue of task characteristics mediating the arousal-performance relationship was addressed ac- cording to individual events rather than according to complexity.
Relationship Between Arousal and Performance by Event A-state scores and their corresponding performance levels were investigated across selected track and field events for which the larger number of performance and A-state scores were available. The performance measure used was the athlete perception score because it was considered consistent with the CSAI in that both of these inventories were self-report measures completed by the athlete.2
Performance was categorized into below average, average, and above aver- age groupings according to the distribution of performance scores for each event per individual. That is, the frequency of Questionnaire-A scores was listed for each track and field event. The distribution of Questionnaire-A scores for each event was then divided into thirds to represent the upper, middle, and lower perfor-

The Arousal-Performance Relationship 23
mance groupings. Table 4 illustrates the performance score ranges selected for the three performance categories across events.
After the data were recorded into these three performance categories, the corresponding ranges of A-state scores were determined for below average, aver- age, and above average performances. As demonstrated in Table 4, the results failed to support the notion that an optimal A-state level was associated with above average performance specijc to an individual event. Above average performances may have been recorded in the 1500111 event by athletes recording levels of A- state from 19 to 37. However, above average performances were also achieved within the same level of A-state for the mile relay, lOOm hurdles, and javelin events. Therefore, contrary to the notion of task-specific optimal arousal levels, this finding suggests that maximal performance can be achieved with about the same level of arousal across different events.
In addition, it would appear that one A-state level may result in either below average, average, or above average performance in any one event. For example, average performance in the mile relay was associated with an A-state score range of 12-26, yet below average and above average performances also occurred with-
Table 4
Performance Categories and Corresponding Questionnaire-A and CSAl Scores for Six Track and Field Events
CSAl
Performance QuestionnaireA Event category range n M SD Range
400m Above average Average
Below average Discus Above average
Average Below average
Mile relay Above average Average
Below average 100m hurdles Above average
Average Below average
1500m Above average Average
Below average Javelin Above average
Average Below average

24 Ebbeck and Weiss
in this range of A-state score: 19-24 and 18-26, respectively. Similarly, above average, average, and below average performances in the discus event were all achieved by athletes recording A-state scores within the range of 14-27.
Discussion This study examined performance measures and task characteristics as they re- late to the arousal-performance relationship in track and field. Support was not found for the initial hypothesis that three performance measures (objective out- come, performance perceived by the athlete, and performance perceived by the coach) would all relate equally to A-state. The performance measures demon- strated a low relationship with each other; therefore it was not surprising that each performance measure related differently to A-state within an event. This suggests that a different interpretation of the arousal-performance relationship may result from the use of various performance measures.
There is a need to evaluate what it is that performance measures actually assess. For example, norm-referenced measures such as the objective outcome results compare an individual's performance with that of others rather than with his or her own previous performance. Therefore an athlete may record a per- sonal best performance in the lOOm event of 10.3 seconds and yet appear to have performed only moderately well when compared to the performance time of 10.1 seconds recorded bv another competitor. As a result, arousal measures are cor- related with potenti&ly misrepresented measures of a good or poor performance for any one individual. Alternatively, subjective measures relate the perceived performance of an individual that may or may not accurately reflect &individu- al's actual performance. It would seem that further attention should be paid to the appropriateness of various performance measures in describing the arousal- performance relationship.
Until there is further clarification of the suitability of various performance measures, coaches and teachers should discriminate more carefully which perfor- mance measure is used in assessing athletes. The age, experience, and skill level of the athletes should be considered when selecting a measure of performance. In addition, the type of skill being performed might be an influencing factor. It would be to the coach's advantage to employ more than one performance mea- sure in order to derive additional information about both the performance itself and how A-state relates to the different measures of performance. The coach could provide researchers with valuable information about the relationship between arousal and a variety of performance measures.
The second hypothesis, that sport events could be classified according to complexity and that these complexity scores could be used to describe optimal arousal levels and maximal performance, was also not supported. The task com- plexity scale provided by Landers and Boutcher (1986) failed to differentiate the various track and field events. That is, tasks intuitively diverse in complexity recorded about the same range of complexity scores. This finding may indicate a need to better educate coaches utilizing the complexity scale. The degree of familiarity with an event may have influenced each coach's perception of the com- plexity of a task. In addition, coaches may have rated an event relative to other track and field events or considered each event in isolation. Failing to present coaches in the study with the scoring examples provided by Landers and Boutcher

The Arousal-Performance Relationship 25
(1986) may have contributed to the disparity in coach responses. Alternatively, the task complexity scale might need to be reassessed. Despite the merit in at- tempting to classify task complexity, at present the complexity scale may not be sufficiently sensitive to the various demands inherent in any one task.
The measure of task complexity warrants consideration if optimal arousal levels prescribed by task complexity are to be examined. When measured ac- cording to perceptual, decisional, and motor act characteristics, as proposed by Landers and Boutcher (1986), task complexity was constant for each skill. Due to the apparent difficulties in attempting to standardize task complexity scores awarded to various events, however, perhaps task complexity should be deter- mined by the perceived demands inherent in a skill. Consequently each athlete, differentiated by experience and skill level, would describe how complex he or she personally perceives a sport skill to be and therefore determine optimal arousal levels specific to that individual interpretation. Nevertheless, until a more satis- factory measurement of task complexity is developed, the notion of task charac- teristics mediating the arousal-performance relationship will have to be addressed by individual events rather than an overall complexity score, at least based on the data in the present study.
Results still failed to support the notion of optimal arousal levels according to a specific event. The same level of A-state was associated with maximal perfor- mance across the variety of events. In addition, results suggested that a particu- lar level of A-state could be associated with either above average, average, or below average performances on any one task.
Therefore, as it is not yet possible to prescribe task-specific optimal arousal levels, it would seem advisable for a coach to ascertain optimal arousal levels peculiar to each athlete. Over a series of repeated performance and A-state mea- sures, the coach could soon be alert to the most appropriate level of arousal for each individual for specific events. This applies to the athlete as well. Over time, the athlete becomes trained not only to recognize when he or she is appropriately aroused but also to adjust the level of arousal as required. Therefore a systematic monitoring of an athlete's arousal level and subsequent performance may be a way to employ the relationship between arousal and performance to the athlete's advantage.
Consequently, the use of multiperformance measures, alternative methods for determining the complexity of various tasks, and repeated measures for in- dividuals across performances are recommended for future research. The impor- tance of intraindividual analyses when investigating the arousal-performance relationship has previously been demonstrated (Gould, Petlichkoff, Simons, & Vevera, 1987; Sonstroem & Bernardo, 1982). Researchers should be cautious of the limitations incurred, as in this study, by the inability to provide data within individuals. Finally, subsequent investigations of the arousal-performance rela- tionship may gain greater insight with a different measure of arousal than the CSAI-1. The CSAI-1 was selected for this research because it corresponded to recommendations by Landers and Boutcher (1986) to be used to predict maximal performance according to task complexity. However, a multidimensional mea- sure of anxiety, such as the CSAI-2 (Martens, Burton, Vealey, Smith, & Bump, 1982), could provide both psychological and physiological dimensions that poten- tially influence performance.

26 Ebbeck and Weiss
References Basler, M.L., Fisher, A.C., & Mumford, N.L. (1976). Arousal and anxiety correlates
of gymnastic performance. Research Quarterly, 47, 586-589. Beuter, A., & Duda, J.L. (1985). Analysis of the arousal/motor performance relationship
in children using movement kinematics. Journal of Sport Psychology, 7,229-243. Billing, J. (1980). An overview of task complexity. Motor Skills: lheory Into Practice,
4, 18-23. Bird, A.M., & Cripe, B.K. (1986). Psychology and sport behavior. St. Louis: Times
MirrorIMosby College Publ. Cronbach, L.J. (1951). Coefficient alpha and the internal structure of tests. Psychometrika,
16, 297-334. Fenz, W.D., & Jones, G.B. (1972). Individual differences in physiologic arousal and
performance in sport parachutists. Psychosomatic Medicine, 34, 1-8. Gill, D.L. (1986). Psychological dynamics of sport. Champaign, IL: Human Kinetics. Gould, D., Petlichkoff, L., Simons, J., & Vevera, M. (1987). Relationship between com-
petitive state anxiety inventory-2 subscale scores and pistol shooting performance. Journal of Sport Psychology, 9, 33-42.
Klavora, P. (1978). An attempt to derive inverted-U curves based on the relationship between anxiety and athletic performance. In D.M. Landers & R.W. Christina (Eds.), Psychology of motor behavior and sport-1977 (pp. 369-377). Champaign, IL: Hu- man Kinetics.
Landers, D.M. (1978). Motivation and performance: The role of arousal and attentional factors. In W. Straub (Ed.), Sportpsychology: An analysis of athlete behavior (pp. 91 - 103). Ithaca, NY: Mouvement.
Landers, D.M., & Boutcher, S.H. (1986). Arousal-performance reIationships. In J.M. Williams (Ed.), Applied sport psychology: Personal growth to peak pelfannance @p. 163-184). Palo Alto, CA: Mayfield.
Martens, R., Burton, D., Rivkin, F., & Simon, J. (1980). Reliability and validity of the competitive state anxiety inventory (CSAI). In C. Nadeau, W. Halliwell, K. Newell, & G. Roberts (Eds.), Psychology of motor behavior and sport-I979 (pp. 91-99). Champaign, IL: Human Kinetics.
Martens, R., Burton, D., Vealey, R., Smith, D., & Bump, L. (1982, June). Competitive anxiety: Cognitive and somatic dimensions. Paper presented at NASPSPA Confer- ence, College Park, MD.
Oxendine, J.B. (1970). Emotional arousal and motor performance. Quest, 13, 23-30. Sonstroem, R.J., & Bernardo, P. (1982). Intraindividual pregame state anxiety and
basketball performance: A re-examination of the inverted-U curve. Jouml of Sport Psychology, 4, 235-245.
Spence, K. W. (1956). Behavior theory and conditioning. New Haven: Yale Univ. Press. Spielberger, C.D., Gorsuch, R.L., & Lushene, R.E. (1970). Manual for the state-trait
anxiety inventory (self-evaluation questionnaire). Palo Alto, CA: Consulting Psy- chologists Press.
Weinberg, R.S., & Genuchi, M. (1980). Relationship between competitive trait anxiety, state anxiety, and golf performance: A field study. Journal of Sport Psychology, 2, 148-154.
Weinberg, R.S., & Hunt, V.V. (1976). The interrelationship between anxiety, motor performance, and electromyography. Jounuzl of Motor Behavior, 8, 129-224.
Yerkes, R.M., & Dodson, J.D. (1908). The relationship of strength of stimulus to rapidity of habit-formation. Journal of Comparah've Neurology of Psychology, 18,459-482.
The Arousal-Performance ~e la t i onsh i~ 27
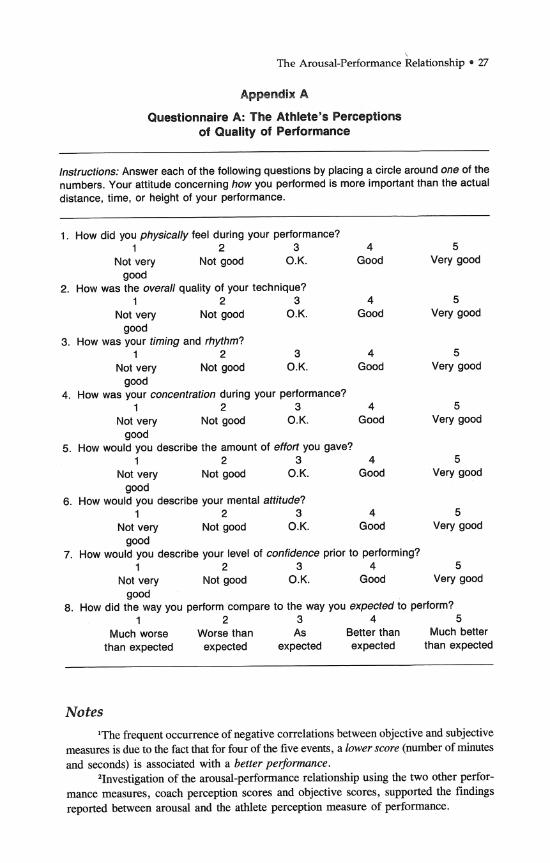
Appendix A
Questionnaire A: The Athlete's Perceptions of Quality of Performance
Instructions: Answer each of the following questions by placing a circle around one of the numbers. Your attitude concerning how you performed is more important than the actual distance, time, or height of your performance.
1. How did you physically feel during your performance? 1 2 3 4 5
Not very Not good O.K. Good Very good good
2. How was the overall quality of your technique? 1 2 3 4 5
Not very Not good O.K. Good Very good good
3. How was your timing and rhythm? 1 2 3 4 5
Not very Not good O.K. Good Very good good
4. How was your concentration during your performance? 1 2 3 4 5
Not very Not good O.K. Good Very good good
5. How would you describe the amount of effort you gave? 1 2 3 4 5
Not very Not good O.K. Good Very good good
6. How would you describe your mental attitude? 1 2 3 4 5
Not very Not good O.K. Good Very good good
7. How would you describe your level of confidence prior to performing? 1 2 3 4 5
Not very Not good O.K. Good Very good good
8. How did the way you perform compare to the way you expected to perform? 1 2 3 4 5
Much worse Worse than As Better than Much better than expected expected expected expected than expected
Notes 'The frequent occurrence of negative correlations between objective and subjective
measures is due to the fact that for four of the five events, a lower score (number of minutes and seconds) is associated with a better performance.
21nvestigation o f the arousal-performance relationship using the two other perfor- mance measures, coach perception scores and objective scores, supported the findings reported between arousal and the athlete perception measure of performance.