the aral sea 1960-2003 - birdvilleschools.net · the aral sea: a lesson in human-environment...
TRANSCRIPT

The Aral Sea 1960-2003


Chart #1 – Aral Sea: Water Volume and Water Surface
0%
10%
20%
30%
40%
50%
60%
70%
80%
90%
100%
% o
f W
ater
Lev
el a
nd
Wat
er V
olu
me
Bef
ore
196
0
1960 1970 1980 1990 2000 2002
Water Surface Water Volume
Chart #2 – Aral Sea: Salt Content in the Aral Sea
0%
1%
2%
3%
4%
5%
Sal
t C
on
ten
t
1960 1970 1980 1990 2000 2002

Aral Sea Vocabulary
Economy
Industry
Raw Materials
Human – EnvironmentInteraction
Irrigation

Soviet EconomyBegins to Fail
Irrigation ditches arebuilt on two major
rivers
Effect #1 Effect #2 Effect #3 Effect #4 Effect#5
The Aral Sea:A Lesson in Human-Environment Interaction
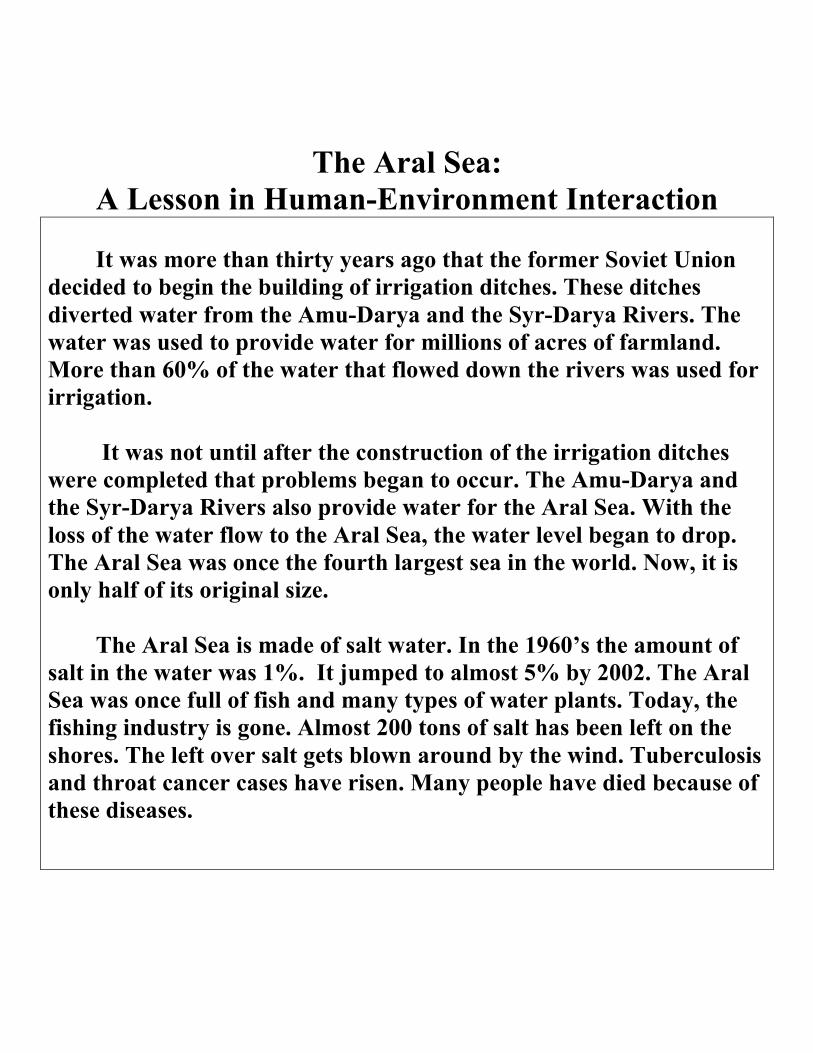
It was more than thirty years ago that the former Soviet Uniondecided to begin the building of irrigation ditches. These ditchesdiverted water from the Amu-Darya and the Syr-Darya Rivers. Thewater was used to provide water for millions of acres of farmland.More than 60% of the water that flowed down the rivers was used forirrigation.
It was not until after the construction of the irrigation ditcheswere completed that problems began to occur. The Amu-Darya andthe Syr-Darya Rivers also provide water for the Aral Sea. With theloss of the water flow to the Aral Sea, the water level began to drop.The Aral Sea was once the fourth largest sea in the world. Now, it isonly half of its original size.
The Aral Sea is made of salt water. In the 1960’s the amount ofsalt in the water was 1%. It jumped to almost 5% by 2002. The AralSea was once full of fish and many types of water plants. Today, thefishing industry is gone. Almost 200 tons of salt has been left on theshores. The left over salt gets blown around by the wind. Tuberculosisand throat cancer cases have risen. Many people have died because ofthese diseases.

Charts on the Aral Sea – Questions
Directions: Using the charts and your knowledge of social studies, answer the followingquestions.
Chart #1
1. What was the approximate water volume in the year 1980?2. In which year was the water surface and water volume the closest after 1960?3. How many years did it take for the water surface to drop 60% of its original level?
Chart #2
1. During what year was the salt content at 3%?2. How many percentage points did the salt content increase from 1970 to 1990?3. During which years was the increase in salt content the least?
Chart #1 and Chart #2
1. What connection do you see between the water level and the salt content of the AralSea?

You Are There
You are the ruler of a large country.Over the past ten years, the economy hasgotten worse. More and more people inyour country are becoming unemployed.One of your advisors proposes to beginbuilding irrigation ditches along twomajor rivers to create new farms. Thesenew farms would grow cotton and otherraw materials that can make money foryour country.
The rivers that the irrigation ditchesare to be built on both flow into a verylarge sea. Many people who live aroundthe sea depend on the fishing andshipping industries the sea provides.

What are You Going to Do?
The nation is waiting for your decisionon whether or not to build the irrigationditches on the two rivers that flow into thesea.
Assignment: In your own words, issue a formal speech that will either begin theconstruction of the irrigation ditches or talk about another plan that you may have to saveyour nation’s economy.


What are the possible benefits of your decision?
What may be some of the consequences of your decision?

UnitEurope
Lesson PlanA Study in human-environment interaction – The Aral Sea
Content ObjectivesThe student will identify examples of human-environment interaction.TEKS – 6.7b, 6.7c
Language ObjectivesThe student will identify vocabulary associated with human-environment interaction andthe Aral Sea. The student will participate in group work, discussions, and create a productbased on the lesson’s vocabulary.
Metacognitive ObjectivesThe students will make predictions and draw conclusions based on information presentedin the lesson. The students will be able to analyze the effects of the alteration to the flowof rivers. The student will be able to explain the effects caused by the lowering of thewater level of the Aral Sea.
Materials• Handouts – Aral Sea Vocabulary and Word Wall Strips• Handouts – Large Maps of the Aral Sea (1960/1990/2003)• Handout – Reading on the Aral Sea• Handout – 3 in 1: Maps of the Aral Sea (1960-2003)• Handouts – Charts on the Aral Sea with questions• Handout – Graphic Organizer – Cause leading to multiple effects• Handouts – You are There (Extension)
Procedure – Building Background
1. Before the lesson, have the vocabulary from the Aral Sea posted on your wordwall. For maximum effectiveness, make each word interactive by folding a pieceof card stock in half, writing the vocabulary term on the front, drawing anexample right next to the word, and in the inside flap, write the definition of theword.
2. Have students copy the words that are going to be used in this lesson into theirnotes.
3. In groups of four, have the students define each word.4. Have the students create a new visual for each of the words.5. Have groups share their visuals and definitions6. On the board or overhead, write “The Gulf of Mexico” and then circle it. Create a
webbing diagram with several features branching off of it.7. Ask students to describe things that we get from the Gulf of Mexico. Write their
responses in the webbing diagram.

8. Ask students to describe the different types of businesses that depend on the Gulfof Mexico. Write their responses in the webbing diagram.
9. Ask students to describe the water of the Gulf of Mexico and write their responsesin the webbing diagram.
10. Have students copy the completed diagram in their notes.11. Underneath their diagrams, have the students answer the following questions:
a. What would happen to the coastal wildlife if the water became saltier?b. How would the coastal economy be impacted if the water became saltier?
Procedure – Comprehensible Input, Lesson Delivery12. Discuss with the students their answers from the two previous questions. Ensure
that the students understand the cause and effect relationship between theconditions of the Gulf of Mexico and how people and the wildlife depend on it.
13. In their groups, students are to look at the three large maps of the Aral Sea.14. Have students discuss how the three maps are different and write their responses
in their notebooks.15. Have students decide on how the changes demonstrated in the maps may have
occurred. Have them write their reflections in their notes.16. Have students look at assorted pictures of the Aral Sea. (Do an image search
using http://images.google.com )17. Ask students about the pictures that show ships stranded on dry land and how the
ships ended up like that.18. As a group have students read the passage on the Aral Sea. Students can look at
the 3 maps in one handout as they read so they can see the effects of irrigationditches.
19. Have students write out the cause of the shrinking of the Aral Sea, Also havethem reflect on the multiple effects of the shrinking Aral Sea
Procedure – Comprehensible Input, Strategies, Practice20. Hand out the charts to each group with the corresponding questions.21. As a group students are to answer the questions in their notes.22. Discuss with each group their findings23. Discuss with the entire class the concept of human-environment interaction.
a. Highlight that people will either adapt to their environment or change it.b. Have students reflect on how people in the community have changed the
surrounding environment.c. Discuss whether or not there have been negative consequences with the
changing of the surrounding environment.
Assessment24. Hand out the graphic organizer to each student. They are to fill out the effects of
the irrigation ditches on the Aral Sea25. Each group member is to pick one of the effects and create either a hand motion
to reflect the effect or role-play a characteristics of an effect.

Technology ApplicationStudents can further use the Google Image Search engine to find other examples ofhuman-environment interaction. They can create an original PowerPoint showdemonstrating what they have learned and apply it to another example. (RainForest/Desertification…)
ExtensionsStudents use You are There and What are you Going to Do? Handouts and give an oralpresentation as a persuasive speech.

Gulf of Mexico Webbing Example
Salt Water Tourism Shrimp
Fishing
TheGulf ofMexico
Oil
Restaurants Boating Hotels

Gulf of Mexico Webbing
TheGulf ofMexico