the applications of surface plasmon resonance...
TRANSCRIPT

1
THE APPLICATIONS OF SURFACE PLASMON RESONANCE BASED ON COMMERCIAL DIGITAL DISKS
By
XUAN DOU
A THESIS PRESENTED TO THE GRADUATE SCHOOL OF THE UNIVERSITY OF FLORIDA IN PARTIAL FULFILLMENT
OF THE REQUIREMENTS FOR THE DEGREE OF MASTER OF SCIENCE
UNIVERSITY OF FLORIDA
2012

2
© 2012 Xuan Dou
3
To my family and friends

4
ACKNOWLEDGMENTS
After my two years’ study and life at Gainesville, I have made several
achievements, and I would like to give my special thanks to my parents who gave me
financial support to continue my study and also, Dr. Jiang, who gave me the opportunity
to improve my research skills. Besides, I feel thankful to my other friends’ help as well.
5
TABLE OF CONTENTS Page
ACKNOWLEDGMENTS .................................................................................................. 4
LIST OF ABBREVIATIONS ............................................................................................. 8
ABSTRACT ..................................................................................................................... 9
CHAPTER
1 INTRODUCTION .................................................................................................... 10
Surface Plasmon Resonance ................................................................................. 10 SPR Bio-Sensing .................................................................................................... 10
Antibacterial Tests Based on SPR .......................................................................... 11
2 BIO-SENSOR APPLICATION OF DVD/DVD-R’S SPR .......................................... 12
Detection Principle .................................................................................................. 12 Bio-Sensing ............................................................................................................ 13
Refractive Index Sensing ........................................................................................ 16
3 STERILIZATION APPLICATION OF DVD’S SPR .................................................. 19
Basic Concept of Sterilization ................................................................................. 19 Fluorescent Test ..................................................................................................... 20
Culture Test ............................................................................................................ 23 Simulation ............................................................................................................... 26
4 FDTD SIMULATION OF GRATING STRUCTURES ............................................... 29
Principle of FDTD Methods ..................................................................................... 29
Different Standards for Disks .................................................................................. 32 Sensitivity of Disks .................................................................................................. 33
5 RELATED PUBLICATIONS .................................................................................... 36
LIST OF REFERENCES ............................................................................................... 37
BIOGRAPHICAL SKETCH ............................................................................................ 39
6
LIST OF FIGURES Figure page 2-1 SEM image of DVD and DVD-R disks .............................................................. 12
2-2 Concept graph to show the basic process of bio-sensing ................................. 14
2-3 Microfludic device with biosensing function ...................................................... 15
2-4 Bio-sensing experimental set-up ...................................................................... 15
2-5 Experimental set up for DVD disk and its reflection spectra ............................. 16
2-6 Reflection spectra of RI test for DVD and DVD-R ............................................. 17
2-7 Sensitivity for SPR shift of DVD and DVD-R..................................................... 17
3-1 Microscope image of burning spot .................................................................... 20
3-2 Fluorescent image of burning spots under different power condition ................ 21
3-3 Fluorescent image of lase scanning ................................................................. 21
3-4 Florescent images of sterilization control test ................................................... 22
3-5 The culture tests for four different control groups ............................................. 24
3-6 Statistical bar of colony numbers for the previous culture test .......................... 25
3-7 Statitical bar of colony numbers for the Spore sterilization test ........................ 25
3-8 Simulation graph of temperature distribution on disk with laser scanning ........ 27
3-9 Simulation of relation between the laser power and disk’s temperature ........... 28
4-1 Differential equition (right) transform from original Maxwell equition (left) ........ 29
4-2 Simplification from 3D (right) to 2D (left) ........................................................... 30
4-3 Simlification of physical parameters in Z axis (right) ......................................... 30
4-4 Differential form for simulation .......................................................................... 31
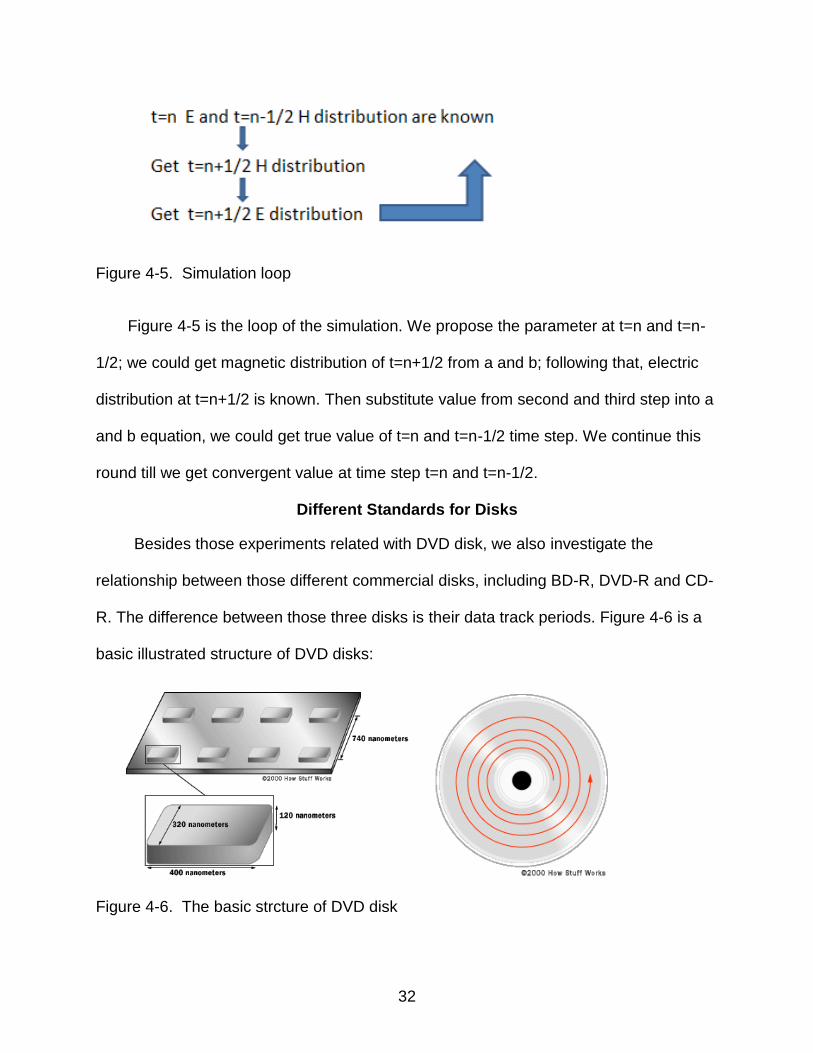
4-5 Simulation loop ................................................................................................. 32
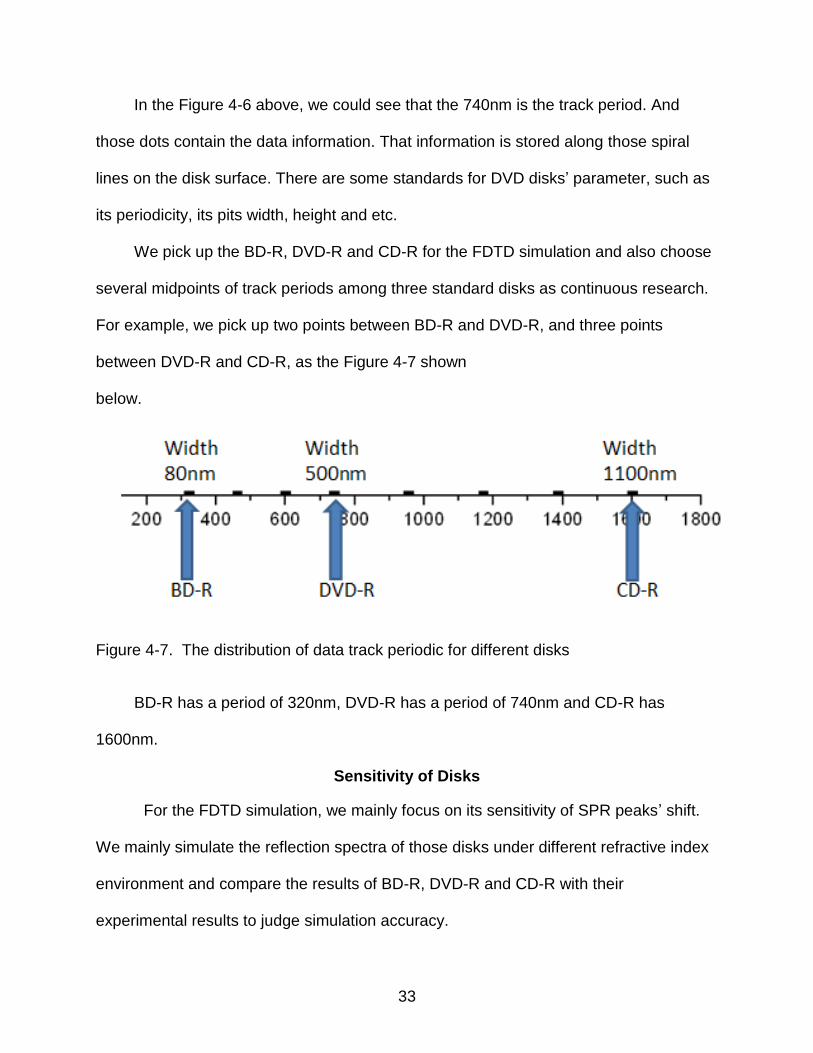
4-6 The basic strcture of DVD disk ......................................................................... 32
4-7 The distribution of data track periodic for different disks ................................... 33

7
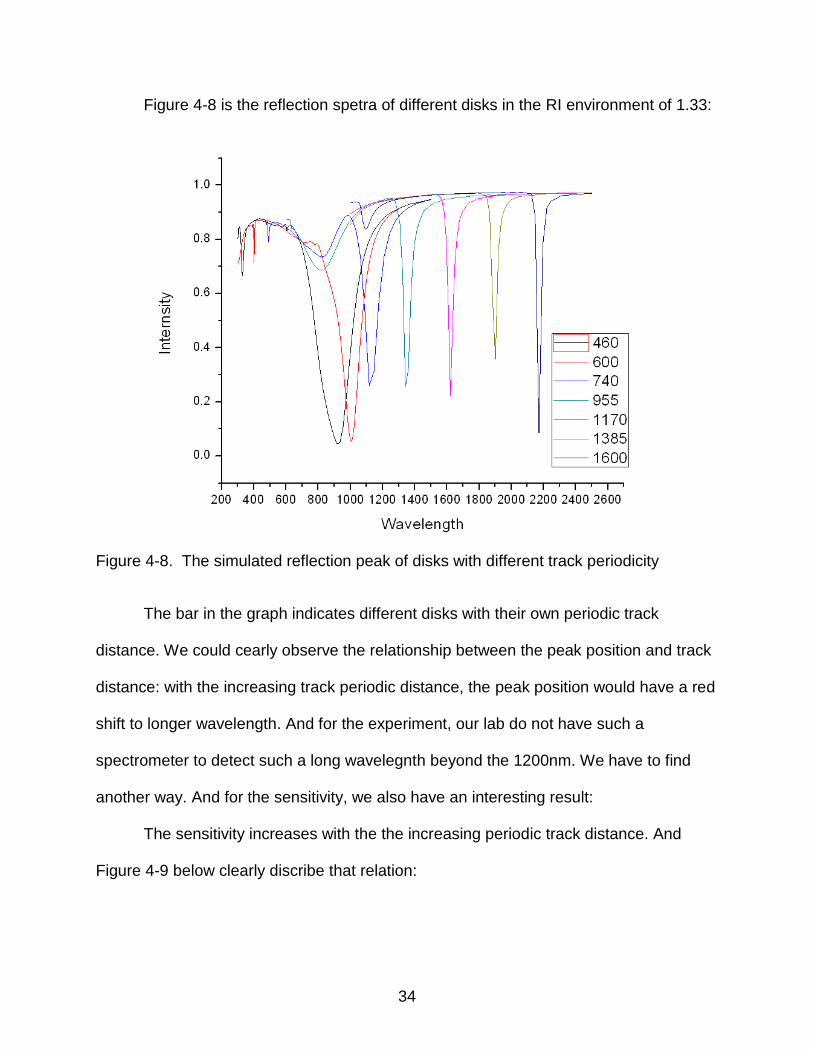
4-8 The simulated reflection peak of disks with different track periodicity ............... 34
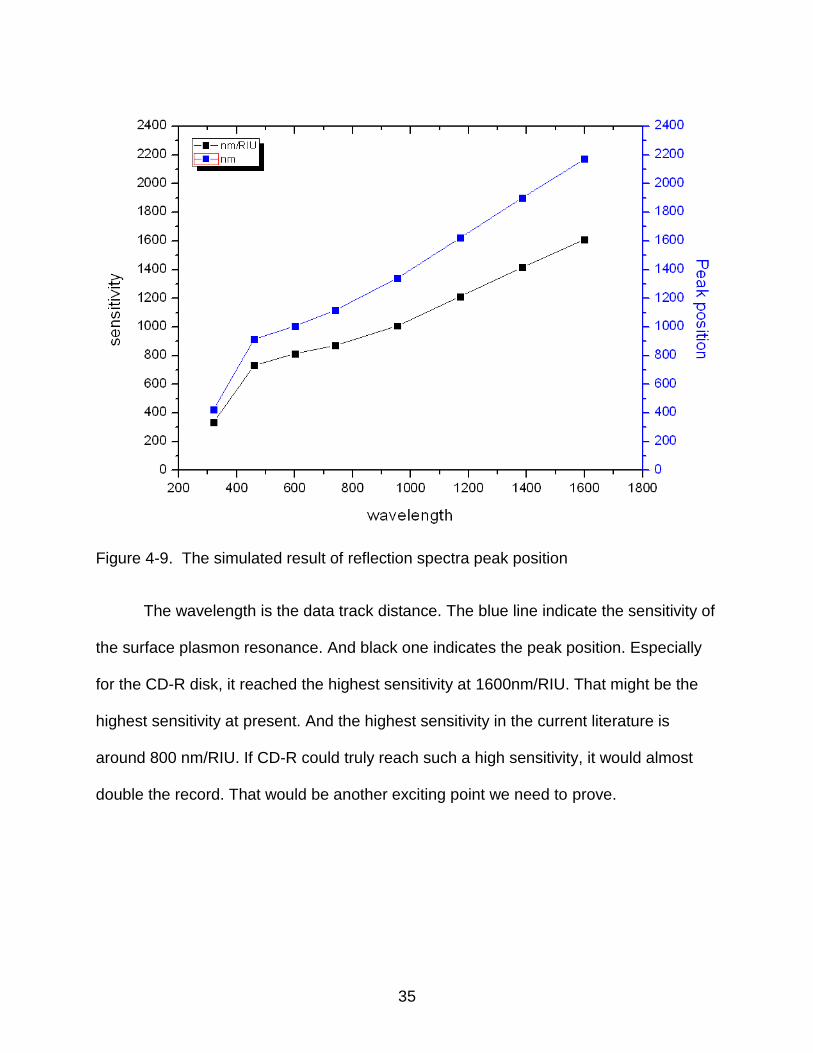
4-9 The simulated result of reflection spectra peak position ................................... 35
8
LIST OF ABBREVIATIONS
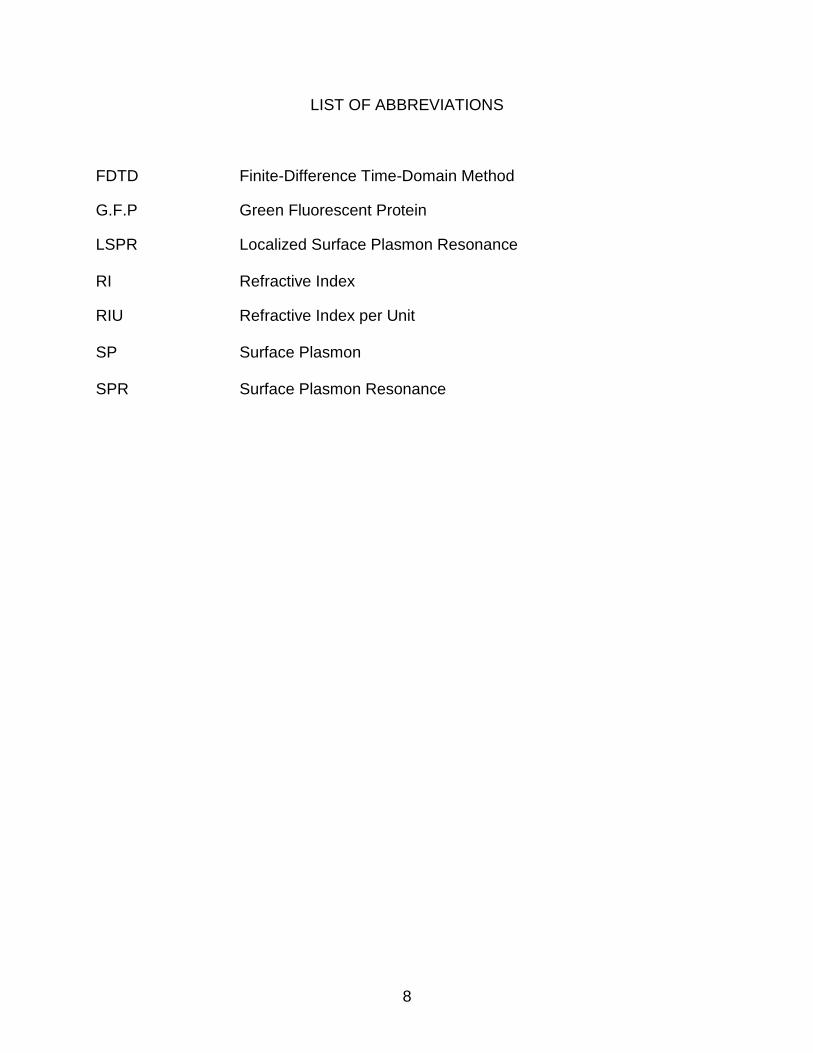
FDTD Finite-Difference Time-Domain Method
G.F.P Green Fluorescent Protein
LSPR Localized Surface Plasmon Resonance RI Refractive Index
RIU Refractive Index per Unit SP Surface Plasmon SPR Surface Plasmon Resonance
9
Abstract of Thesis Presented to the Graduate School of the University of Florida in Partial Fulfillment of the Requirements for the Degree of Master of Science
THE APPLICATIONS OF SURFACE PLASMON RESONANCE BASED ON
COMMERCIAL DIGITAL DISKS
By
Xuan Dou
May 2012
Chair: Peng Jiang Major: Chemical Engineering
Surface Plasmon Resonance (SPR), which is the basis of many standard tools to
detect the absorption of materials on metal surfaces, provides a powerful principle to
many biosensor applications and lab-on-a-chip technology. Here we present various
applications of SPR based on commercial digital disks. We could use DVD-R disks to
do different RI (Refractive Index) and bio-sensing tests. Moreover, anti-bacterial tests
could be fulfilled with the heat generated from the SPR of the DVD disks. With the help
of FDTD (Finite Difference Time Domain) simulation, we investigate the whole range of
disks including Blue-ray R, DVD-R and CD-R disks. The difference between these disks
is the different data track periods: BD-R to 320nm, DVD-R to 740nm and CD-R to
1600nm. The increasing track period has much higher sensitivity to the change of
refractive index at disk surface.
10
CHAPTER 1 INTRODUCTION
Surface Plasmon Resonance, also called “SPR,” which is a hot-spot in the
research area related with bio-sensors, wave guide materials, anti-bacterial tests and
etc. In this thesis, we mainly focus on the topics of bio-sensor and anti-bacterial tests.
Our group has already had several achievements in this area.
Surface Plasmon Resonance
Surface Plasmon resonance (SPR) can be described as the resonant, collective
oscillation of valence electrons in a solid stimulated by incident light. The
resonance condition is established when the frequency of light photons matches the
natural frequency of surface electrons oscillating against the restoring force of positive
nuclei.
Surface Plasmon (SP) is electromagnetic wave that propagates along a
metal/dielectric interface and can be pictured as a traveling charge density wave on the
surface of a metal.[1,2] The coupling of incident light with free electrons in metal forms
Surface Plasmon waves that are essentially confined at the metal-dielectric interface,
leading to a strong concentration of an electromagnetic field.[3,4] This localized field
enhancement has been widely utilized to achieve highly sensitive chemical and
biological sensing by Surface Plasmon Resonance.[3,5] Besides, the strong SPR
absorption of incident light could also result in high local temperature, which provides a
potential antibacterial application.
SPR Bio-Sensing
Surface Plasmon resonance (SPR) is the key surface-Plasmon (SP) technique
that could ultimately enable single-molecule level chemical and biological sensors.[6-14]
11
Due to tremendous recent advances in solution-based synthetic methodologies, a large
variety of plasmonic nanoparticles with complex shapes (e.g., spheres, rods, and prisms)
have been extensively explored for SPR and SERS sensing.[7,15] The Localized
Surface Plasmon Resonance (LSPR) around plasmonic nanoparticles enables very
high SPR sensitivity. For instance, surface-immobilized core-shell spherical silica-Au
nanoparticles [16] and rice-shaped hematite- Au nanoparticles [17] have been shown to
exhibit bulk SPR sensitivity of 555 nm per refractive index unit (nm/RIU) and 800
nm/RIU, respectively. To resolve the reproducibility issue of stochastically aggregated
plasmonic nanoparticles in SERS and SPR sensing, various periodic plasmonic
nanostructures, created by both top-down (e.g., electron-beam lithography)[13] and
bottom-up approaches (e.g., Nano-sphere lithography or NSL),[18,19] have been widely
exploited to achieve reproducible enhancing of electromagnetic (EM) fields.[7,13,20,21]
The SPR sensitivity of these nanofabricated periodic substrates is usually lower than
that of plasmonic nanoparticle aggregates. For example, NSL-enabled periodic Au or
Ag nanoparticles exhibit typical SPR sensitivity of 200 nm/RIU.[18,19]
Antibacterial Tests Based on SPR
The strong SPR absorption of incident light could also result in high local
temperature, which has been extensively exploited in hyper-thermal cancer treatment
and antimicrobial coatings.[22] For instance, wet-synthesized metal nanoparticles,[23-
25] colloid-template gold (or silver) Nano-shells[22-26] and periodic gold Nano-grail
arrays[27] have shown good antibacterial performance.
12
CHAPTER 2 BIO-SENSOR APPLICATION OF DVD/DVD-R’S SPR
Detection Principle
As introduced before, SPR is quite sensitive to the dielectric constant at the
surface, in other words, it is the refractive index near the surface which matters. We
could just use the change of the surface RI to achieve the sensing test.
Because of that, we have two ways to do the sensing, one is bio-sensing test,
which we use anti-gen and anti-body; the other is RI test, we use different solutions with
their own refractive index parameters.
We use the nanostructured substrate instead of the Prism-coupled SPR excitation
set up. The most obvious strengthen point is its smaller size which makes it more
portable. And the reason why we use DVD/DVD-R commercial disks is that DVD disk
has periodic grating structure and we could use that directly.
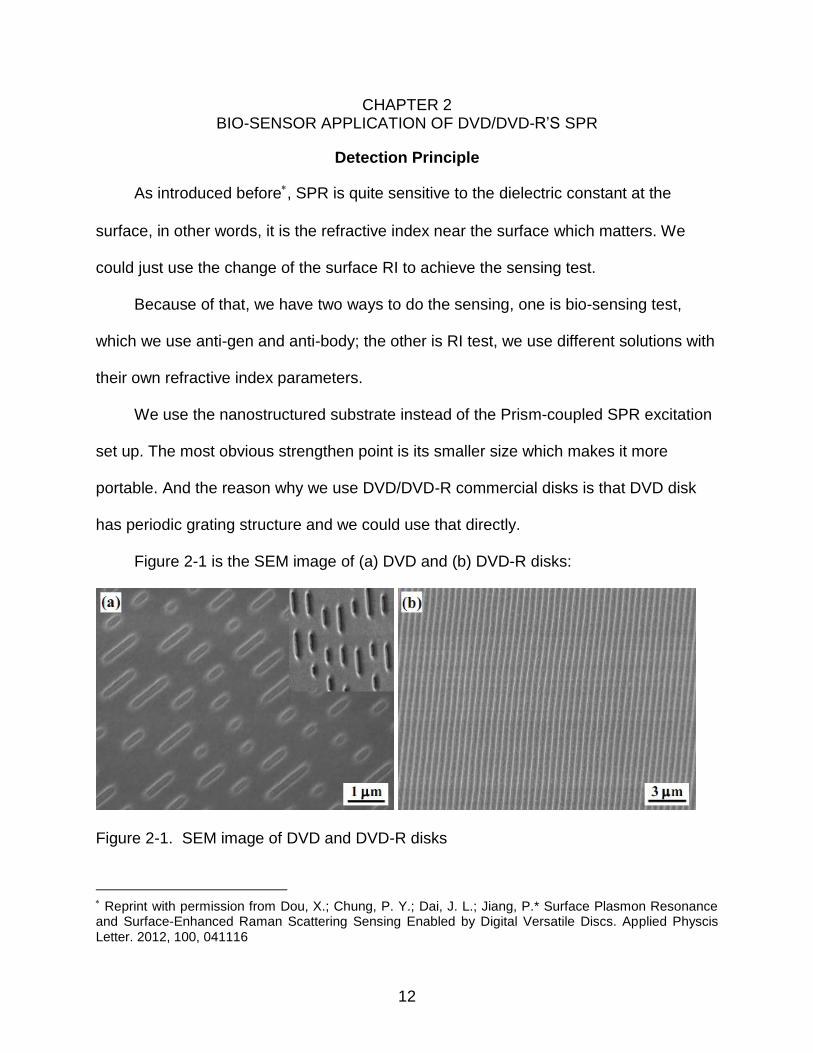
Figure 2-1 is the SEM image of (a) DVD and (b) DVD-R disks:
Figure 2-1. SEM image of DVD and DVD-R disks
Reprint with permission from Dou, X.; Chung, P. Y.; Dai, J. L.; Jiang, P.* Surface Plasmon Resonance and Surface-Enhanced Raman Scattering Sensing Enabled by Digital Versatile Discs. Applied Physcis Letter. 2012, 100, 041116
13
DVD-R consists many data tracks and each tracks has a periodic distance of
740nm. However, DVD disk contains the information but not a blank data disk as DVD-
R, DVD disk has some different pits along the track line.
Bio-Sensing
Bio-sensor is an analytical device for the detection of an analytics that combines a
biological component with a physicochemical detector component.
Bio-sensor has a history of its own since last century. In old days, those workers,
who work in the mines underground, use a specific bird called “Serinus canaria” which
is more sensitive to the gas leak than human beings. This kind of birds is utilized as a
sensor to detect the gas leak underground.
Generally speaking, bio-sensor is made by three important parts: 1) sensitive
biological element; 2) transducer or detector elements; 3) reader device. Although the
general principle is the same, there have already been many different kinds of bio-
sensors based on different principles: Photometric, Electrochemical, Ion Channel Switch,
and etc.
Moreover, there are a lot of commercialized bio-sensors which have been widely
applied on the market right now. The most common one should be the blood glucose
bio-sensor. Some big companies also have the experience in bio-sensor manufacture
for many years, such as OMRON and Beckman Coulter.
For our bio-sensor, we use Surface Plasmon Resonance to achieve the target,
which belongs to the photometric method. As mentioned before, SPR is quite sensitive
to the change of refractive index at the surface; we detect the signal change
corresponding to the RI change.
14
Combined with microfluidic device, our group could also achieve the real time bio-
sensing. And compared with other commercial product, the microfluidic SPR detector
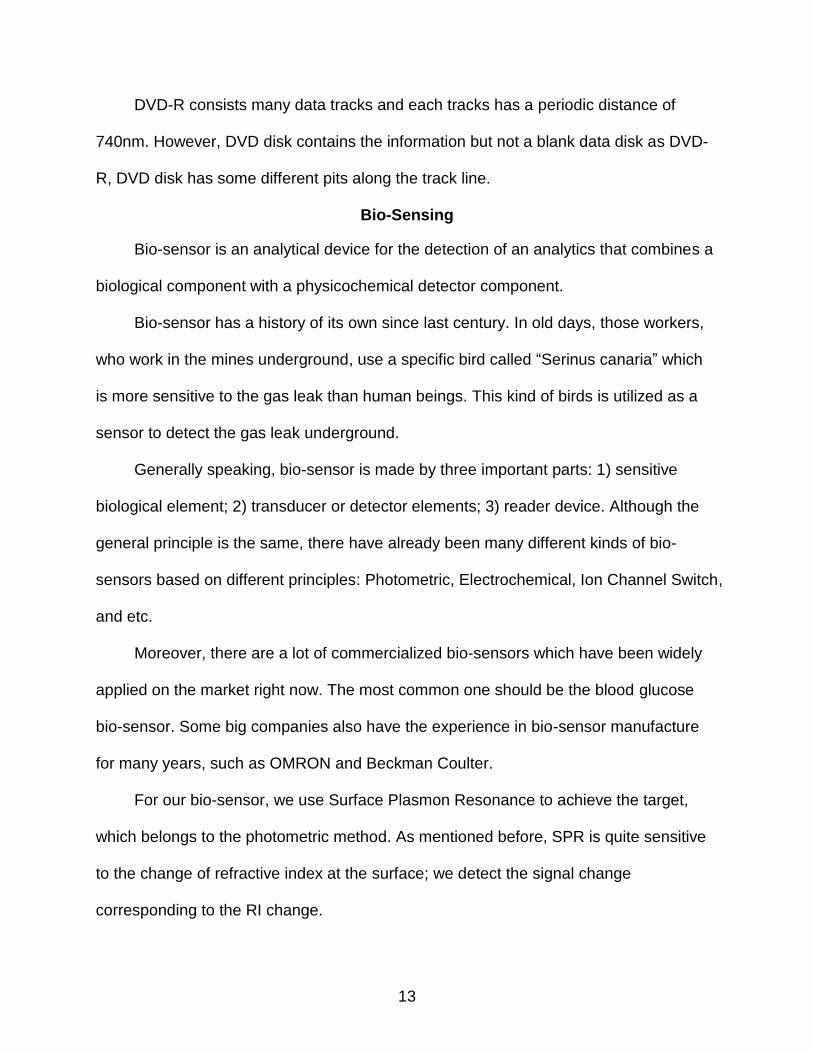
could make the experiment set up quite smaller and easier. Figure 2-2 is the illustrated
picture for the bio-sensing principle we used.
Figure 2-2. Concept graph to show the basic process of bio-sensing
The Figure 2-2 is our nanostructured-substrate with gold coated surface. The
reason why it is the gold is that gold surface could bind with the Anti-BSA, a protein; we
inject the solution of Anti-BSA through microfluidic channel in Figure 2-2; later on, we
continue to add BSA solution, BSA could also bind to Anti-BSA. In those following
processes, different bio-materials could change the refractive index continuously. Then,
we could detect the change of reflection or transmission spectra.
In order to further develop the ability of sensor, we combine the microfluidic device
and SPR configuration together, so that we could do the real-time bio-sensing.
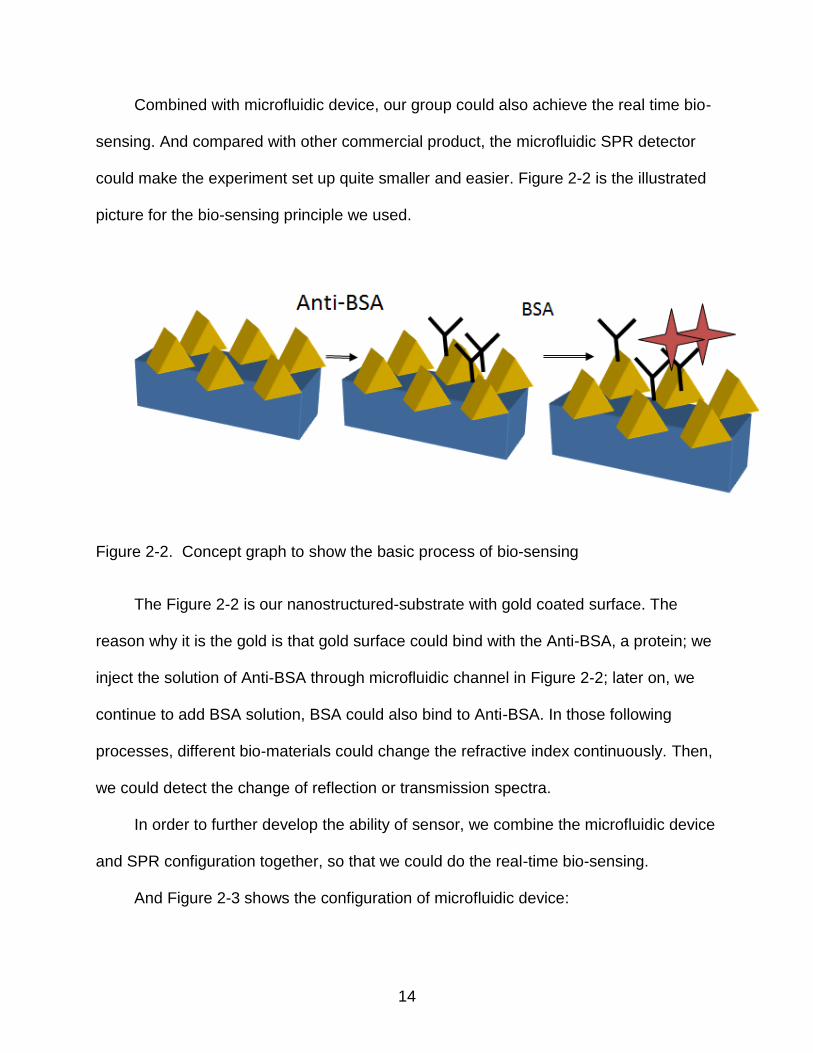
And Figure 2-3 shows the configuration of microfluidic device:
15
Figure 2-3. Microfludic device with biosensing function
Nanostructured substrate sticks onto the glass with glue and they will be covered
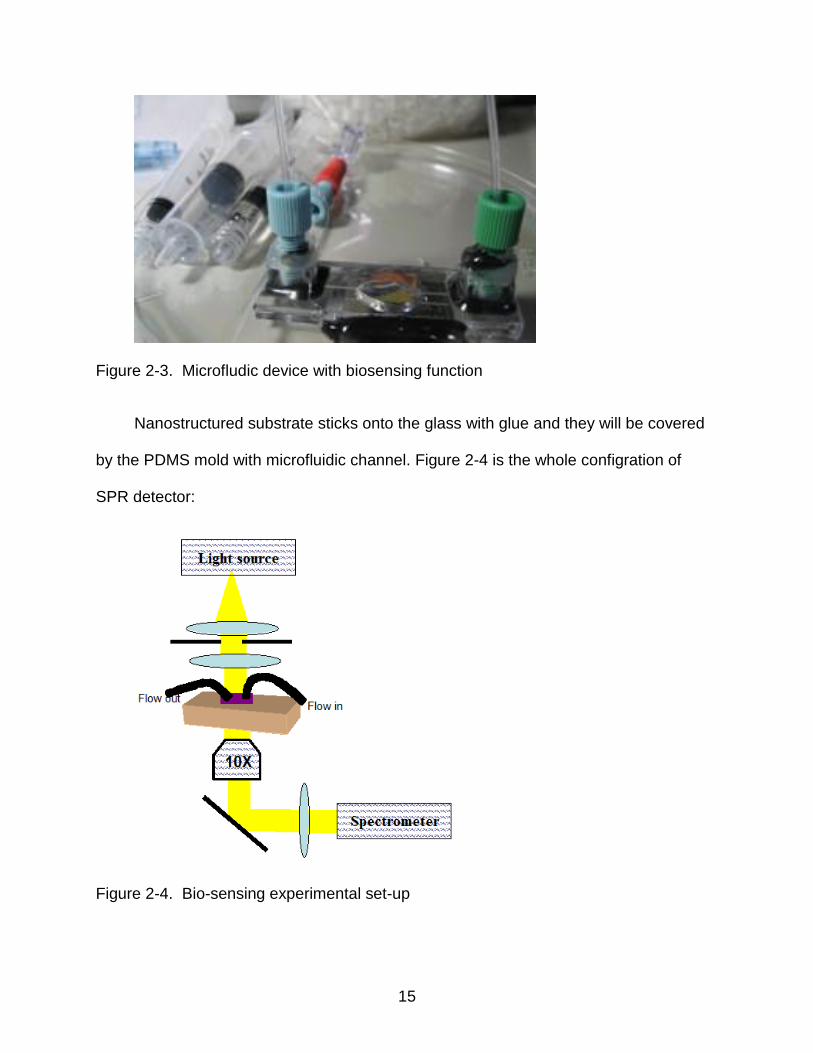
by the PDMS mold with microfluidic channel. Figure 2-4 is the whole configration of
SPR detector:
Figure 2-4. Bio-sensing experimental set-up
16
The light comes from top to bottom, the microfludic device is fixed on the objective
stage, and spectrometer collects information (transmission mode).
Refractive Index Sensing
Similar to the bio-sensing, RI tests also focus on the change of refractive index at
the surface. However, the difference to the bio-sensing is that RI tests use different
concentration solutions to make the change of RI instead of different bio-materials. The
objective of using RI test is to get more accurate sensitivity of the sensor, because bio-
material will bind on the surface, which would generate a non-uniform RI dispersion, so
it is necessary to use an uniform RI distribution solution to get standard sensitivity.
Besides, the information of those standard solutions makes it easier to simulate
sensor’s sensitivity.
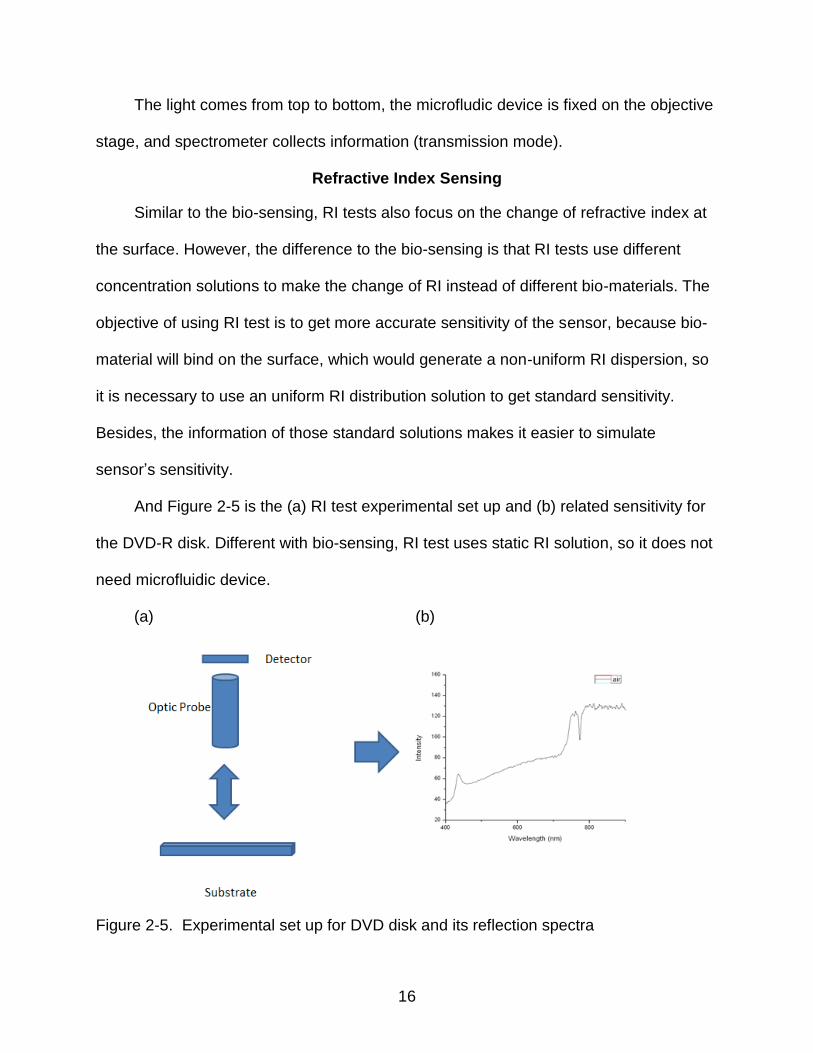
And Figure 2-5 is the (a) RI test experimental set up and (b) related sensitivity for
the DVD-R disk. Different with bio-sensing, RI test uses static RI solution, so it does not
need microfluidic device.
(a) (b)
Figure 2-5. Experimental set up for DVD disk and its reflection spectra

17
(a) (b)
Figure 2-6. Reflection spectra of RI test for DVD and DVD-R
(a) (b)
Figure 2-7. Sensitivity for SPR shift of DVD and DVD-R
From the Figure 2-7, we could see that the spectra will have a red shift due to the
increasing RI of solutions. And we get the peak shift to the change of RI, plot it and get
slope which is the sensitivity of DVD/DVD-R disks. The (a) DVD has a sensitivity of
645nm/RIU (RIU stands for refractive index per RIU), and (b) DVD-R disk has a

18
sensitivity of 848 nm/RIU. DVD/DVD-R reach a comparative high sensitivity to those
other nanostrucutred- substrates till now.

19
CHAPTER 3 STERILIZATION APPLICATION OF DVD’S SPR
Basic Concept of Sterilization
Here we demonstrate a creative method to kill the bacteria using Surface Plasmon
Resonance of DVD disk. If there is SPR generated on the surface, it could generate the
heat simultaneously. And we could use the high temperature generated from SPR to kill
bacterial on the disk surface.
For the experiment, we use 785nm laser as excitation source to generate SPR of
disk. Also, E.coli and Spores are picked up for the further killing tests. Other different
substrates are prepared to further prove the capability of sterilization efficiency of our
DVD disks.
Before we do the anti-bacterial test, we also make some preparations for the
experiment.
The reason why we use DVD disk instead of other substrates is because DVD disk
has an exact resonance peak at position of 785nm, that is to say: the disk will get the
strongest resonance when a 785nm laser shot on its surface.
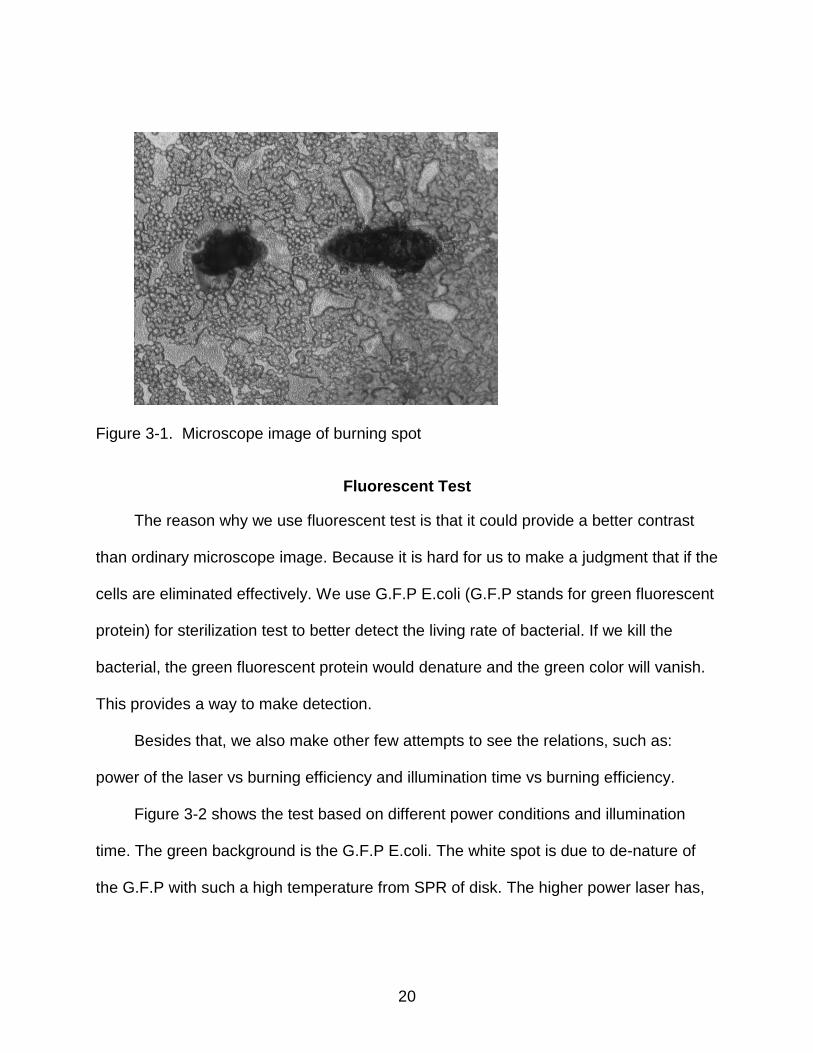
Figure 3-1 is a general burning image of 785nm laser with 100% power under 50X
objective lens.
From below image, we could clearly observe the black spot as a burning spot. And
disk is covered with yeast cells. However, we need another way to easily observe the
contrast between the dead cells and cells alive. And we do not want to damage the
substrate. That is why we turn to fluorescent test.
Reprint with permission from Dou, X.; Chung, P. Y.; Dai, J. L.*; Jiang, P.* Surface Plasmon Resonance-Enabled Antibacterial Digital Versatile Discs. Applied Physcis Letter. 2012, 100, 063702.
20
Figure 3-1. Microscope image of burning spot
Fluorescent Test
The reason why we use fluorescent test is that it could provide a better contrast
than ordinary microscope image. Because it is hard for us to make a judgment that if the
cells are eliminated effectively. We use G.F.P E.coli (G.F.P stands for green fluorescent
protein) for sterilization test to better detect the living rate of bacterial. If we kill the
bacterial, the green fluorescent protein would denature and the green color will vanish.
This provides a way to make detection.
Besides that, we also make other few attempts to see the relations, such as:
power of the laser vs burning efficiency and illumination time vs burning efficiency.
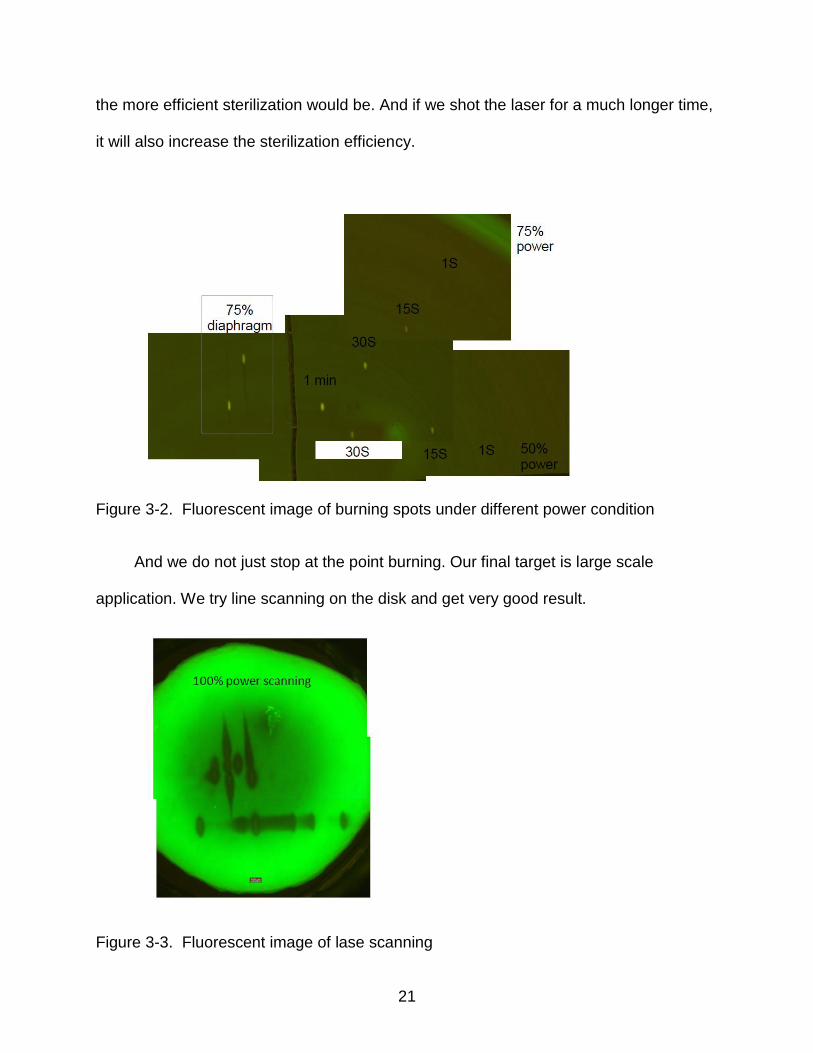
Figure 3-2 shows the test based on different power conditions and illumination
time. The green background is the G.F.P E.coli. The white spot is due to de-nature of
the G.F.P with such a high temperature from SPR of disk. The higher power laser has,
21
the more efficient sterilization would be. And if we shot the laser for a much longer time,
it will also increase the sterilization efficiency.
Figure 3-2. Fluorescent image of burning spots under different power condition
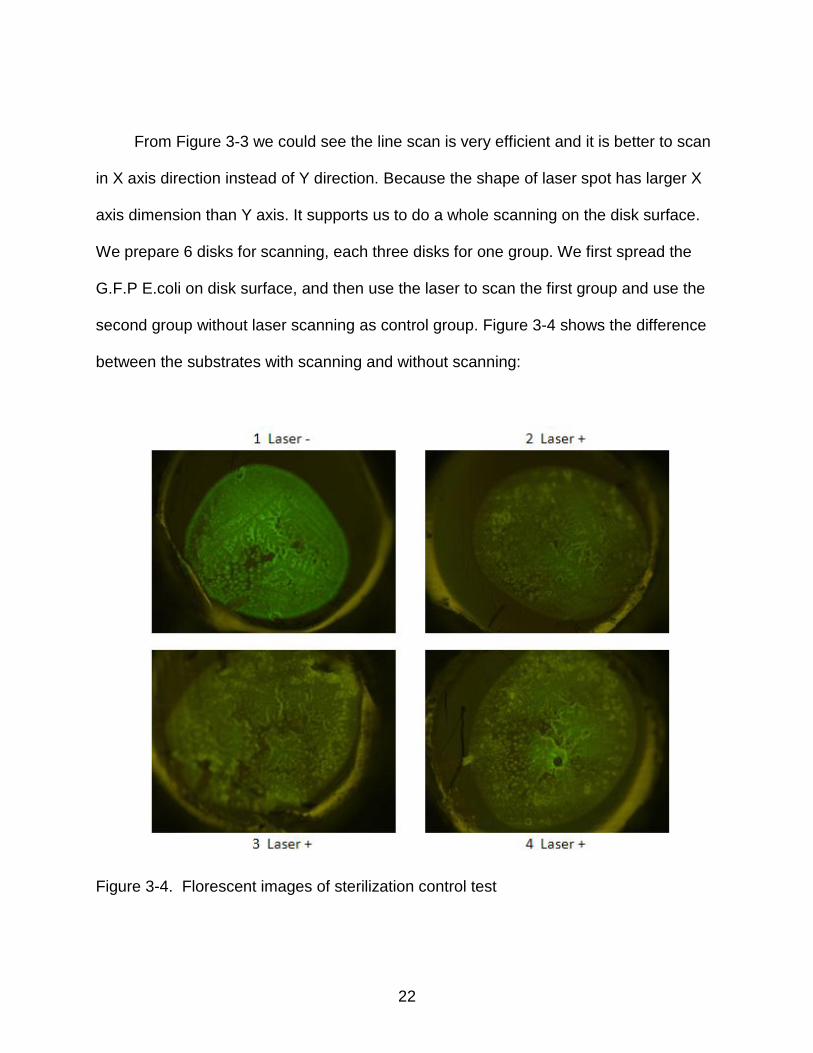
And we do not just stop at the point burning. Our final target is large scale
application. We try line scanning on the disk and get very good result.
Figure 3-3. Fluorescent image of lase scanning
22
From Figure 3-3 we could see the line scan is very efficient and it is better to scan
in X axis direction instead of Y direction. Because the shape of laser spot has larger X
axis dimension than Y axis. It supports us to do a whole scanning on the disk surface.
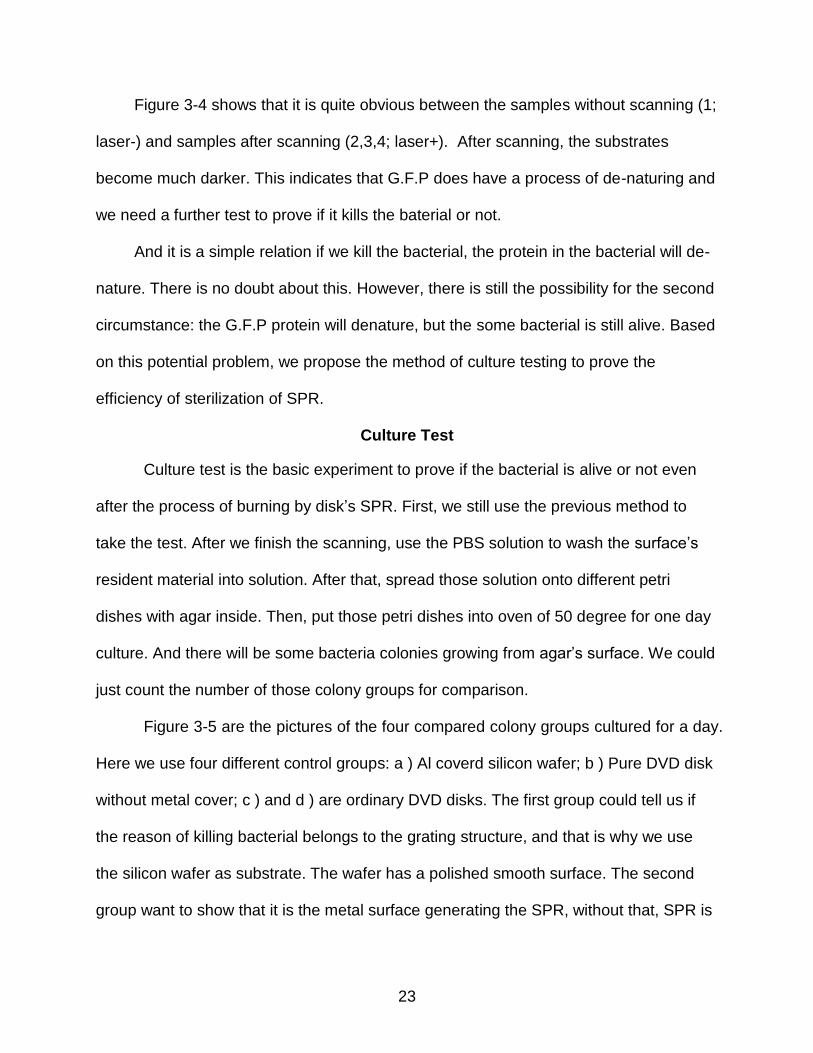
We prepare 6 disks for scanning, each three disks for one group. We first spread the
G.F.P E.coli on disk surface, and then use the laser to scan the first group and use the
second group without laser scanning as control group. Figure 3-4 shows the difference
between the substrates with scanning and without scanning:
Figure 3-4. Florescent images of sterilization control test
23
Figure 3-4 shows that it is quite obvious between the samples without scanning (1;
laser-) and samples after scanning (2,3,4; laser+). After scanning, the substrates
become much darker. This indicates that G.F.P does have a process of de-naturing and
we need a further test to prove if it kills the baterial or not.
And it is a simple relation if we kill the bacterial, the protein in the bacterial will de-
nature. There is no doubt about this. However, there is still the possibility for the second
circumstance: the G.F.P protein will denature, but the some bacterial is still alive. Based
on this potential problem, we propose the method of culture testing to prove the
efficiency of sterilization of SPR.
Culture Test
Culture test is the basic experiment to prove if the bacterial is alive or not even
after the process of burning by disk’s SPR. First, we still use the previous method to
take the test. After we finish the scanning, use the PBS solution to wash the surface’s
resident material into solution. After that, spread those solution onto different petri
dishes with agar inside. Then, put those petri dishes into oven of 50 degree for one day
culture. And there will be some bacteria colonies growing from agar’s surface. We could
just count the number of those colony groups for comparison.
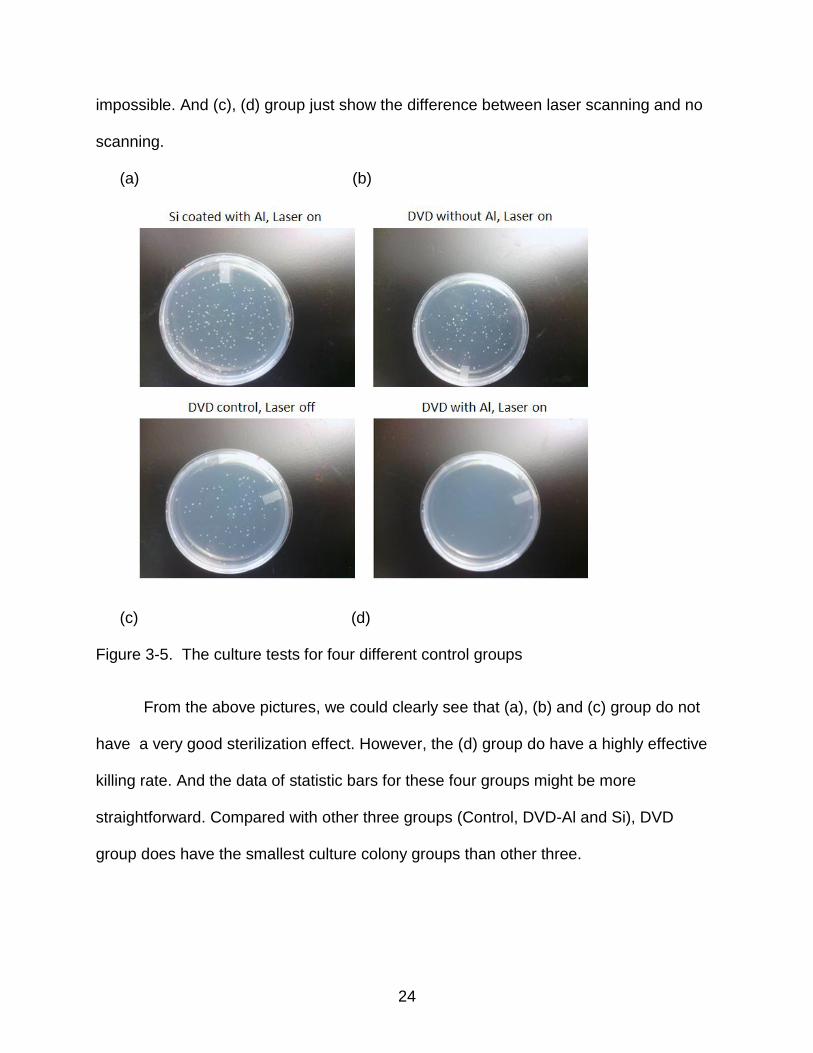
Figure 3-5 are the pictures of the four compared colony groups cultured for a day.
Here we use four different control groups: a ) Al coverd silicon wafer; b ) Pure DVD disk
without metal cover; c ) and d ) are ordinary DVD disks. The first group could tell us if
the reason of killing bacterial belongs to the grating structure, and that is why we use
the silicon wafer as substrate. The wafer has a polished smooth surface. The second
group want to show that it is the metal surface generating the SPR, without that, SPR is
24
impossible. And (c), (d) group just show the difference between laser scanning and no
scanning.
(a) (b)
(c) (d)
Figure 3-5. The culture tests for four different control groups
From the above pictures, we could clearly see that (a), (b) and (c) group do not
have a very good sterilization effect. However, the (d) group do have a highly effective
killing rate. And the data of statistic bars for these four groups might be more
straightforward. Compared with other three groups (Control, DVD-Al and Si), DVD
group does have the smallest culture colony groups than other three.
25
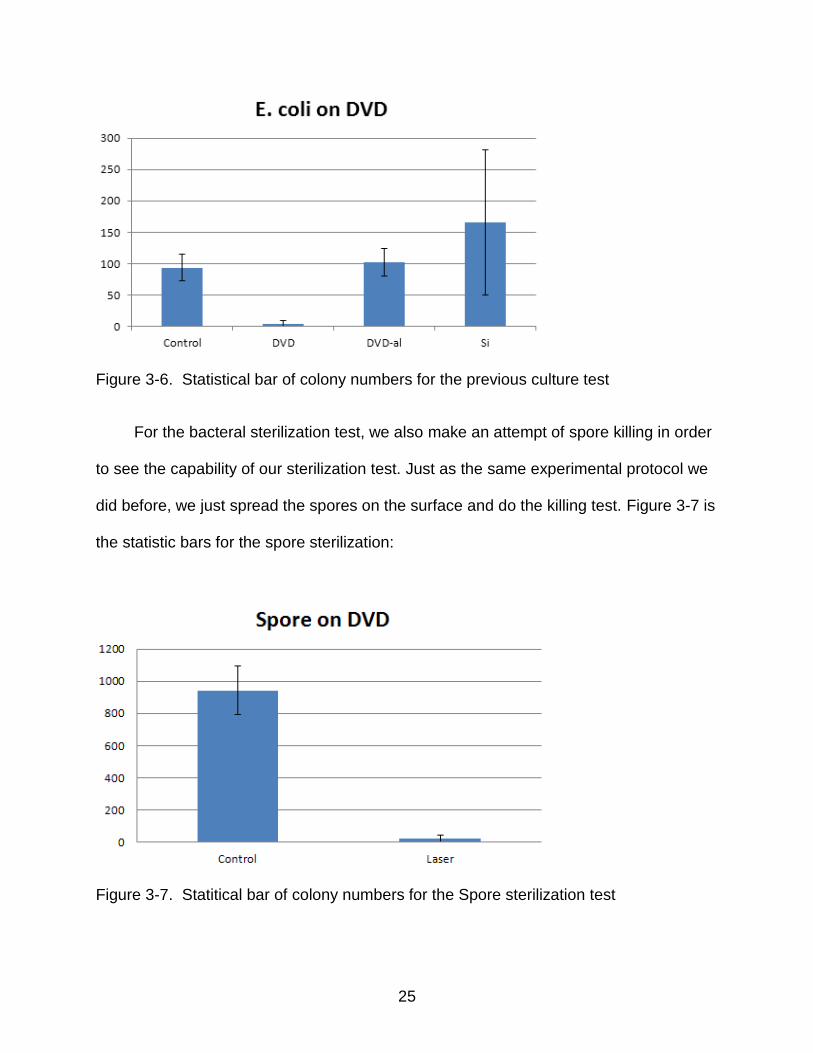
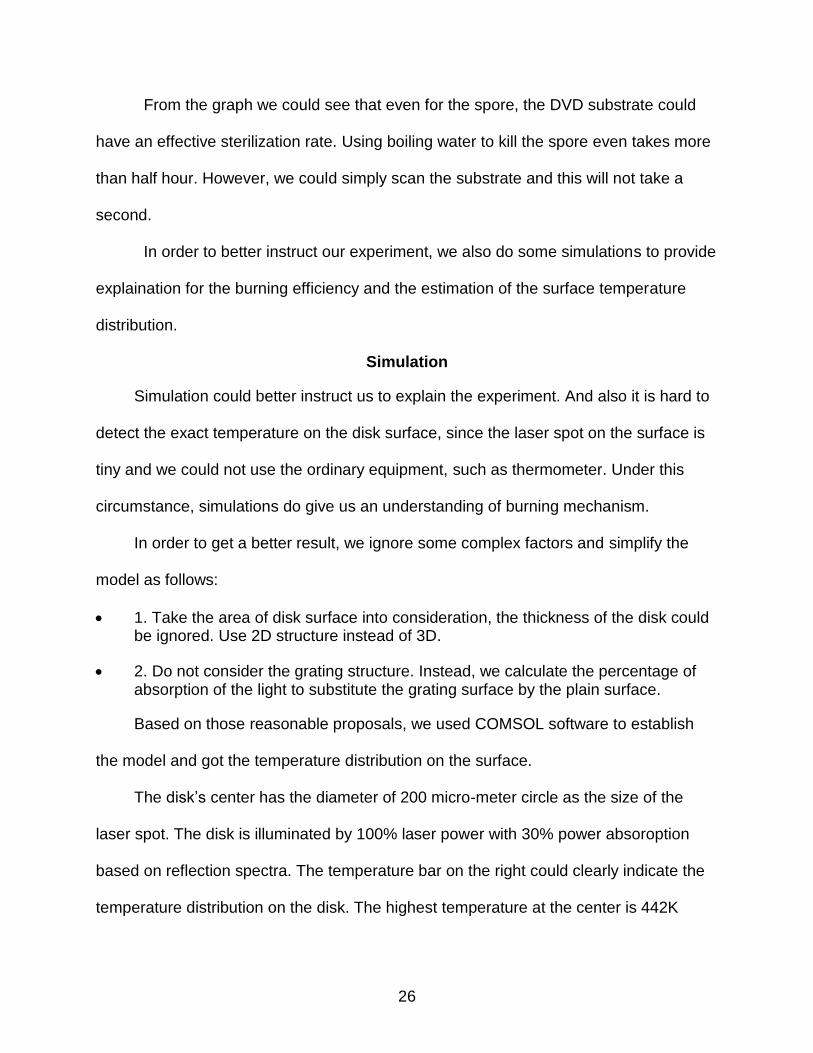
Figure 3-6. Statistical bar of colony numbers for the previous culture test
For the bacteral sterilization test, we also make an attempt of spore killing in order
to see the capability of our sterilization test. Just as the same experimental protocol we
did before, we just spread the spores on the surface and do the killing test. Figure 3-7 is
the statistic bars for the spore sterilization:
Figure 3-7. Statitical bar of colony numbers for the Spore sterilization test
26
From the graph we could see that even for the spore, the DVD substrate could
have an effective sterilization rate. Using boiling water to kill the spore even takes more
than half hour. However, we could simply scan the substrate and this will not take a
second.
In order to better instruct our experiment, we also do some simulations to provide
explaination for the burning efficiency and the estimation of the surface temperature
distribution.
Simulation
Simulation could better instruct us to explain the experiment. And also it is hard to
detect the exact temperature on the disk surface, since the laser spot on the surface is
tiny and we could not use the ordinary equipment, such as thermometer. Under this
circumstance, simulations do give us an understanding of burning mechanism.
In order to get a better result, we ignore some complex factors and simplify the
model as follows:
1. Take the area of disk surface into consideration, the thickness of the disk could be ignored. Use 2D structure instead of 3D.
2. Do not consider the grating structure. Instead, we calculate the percentage of absorption of the light to substitute the grating surface by the plain surface.
Based on those reasonable proposals, we used COMSOL software to establish
the model and got the temperature distribution on the surface.
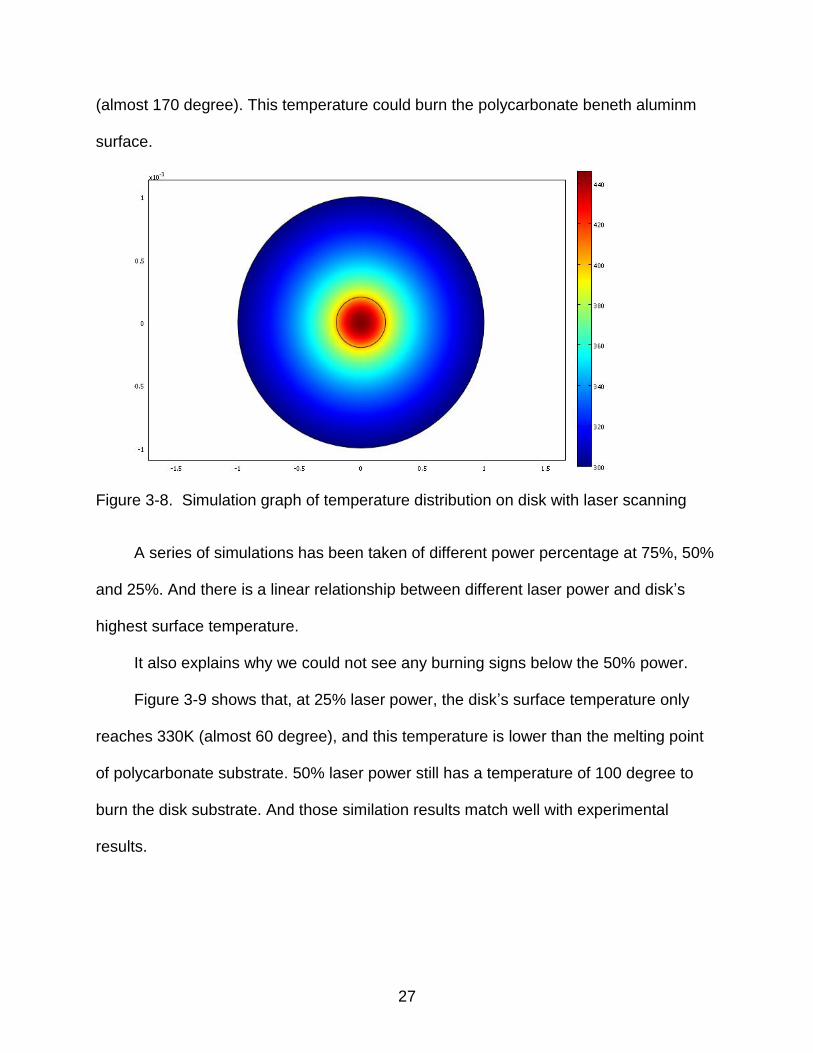
The disk’s center has the diameter of 200 micro-meter circle as the size of the
laser spot. The disk is illuminated by 100% laser power with 30% power absoroption
based on reflection spectra. The temperature bar on the right could clearly indicate the
temperature distribution on the disk. The highest temperature at the center is 442K
27
(almost 170 degree). This temperature could burn the polycarbonate beneth aluminm
surface.
Figure 3-8. Simulation graph of temperature distribution on disk with laser scanning
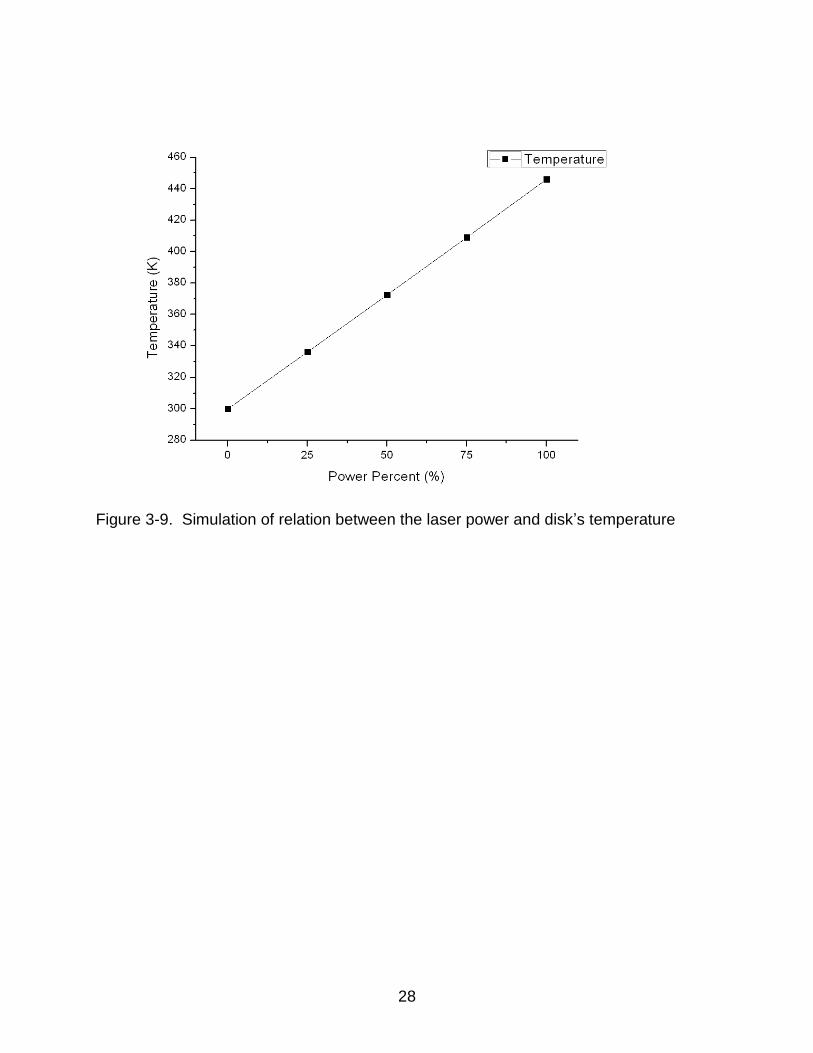
A series of simulations has been taken of different power percentage at 75%, 50%
and 25%. And there is a linear relationship between different laser power and disk’s
highest surface temperature.
It also explains why we could not see any burning signs below the 50% power.
Figure 3-9 shows that, at 25% laser power, the disk’s surface temperature only
reaches 330K (almost 60 degree), and this temperature is lower than the melting point
of polycarbonate substrate. 50% laser power still has a temperature of 100 degree to
burn the disk substrate. And those similation results match well with experimental
results.
28
Figure 3-9. Simulation of relation between the laser power and disk’s temperature
29
CHAPTER 4 FDTD SIMULATION OF GRATING STRUCTURES
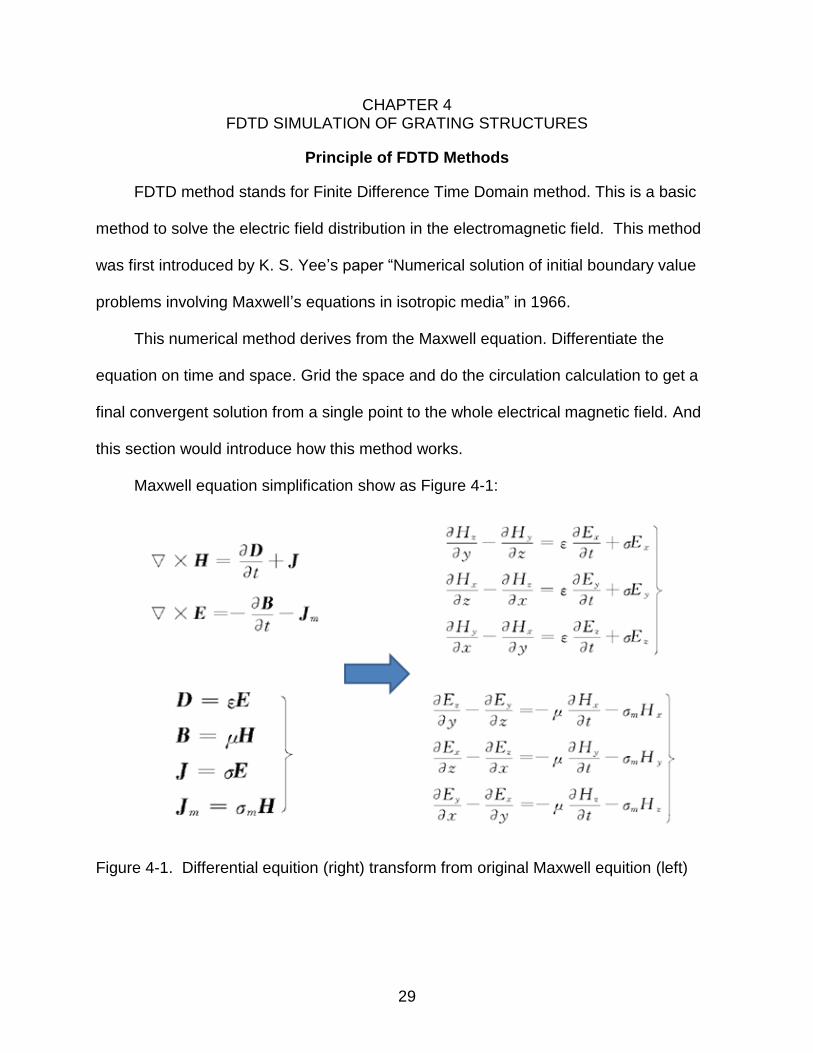
Principle of FDTD Methods
FDTD method stands for Finite Difference Time Domain method. This is a basic
method to solve the electric field distribution in the electromagnetic field. This method
was first introduced by K. S. Yee’s paper “Numerical solution of initial boundary value
problems involving Maxwell’s equations in isotropic media” in 1966.
This numerical method derives from the Maxwell equation. Differentiate the
equation on time and space. Grid the space and do the circulation calculation to get a
final convergent solution from a single point to the whole electrical magnetic field. And
this section would introduce how this method works.
Maxwell equation simplification show as Figure 4-1:
Figure 4-1. Differential equition (right) transform from original Maxwell equition (left)
30
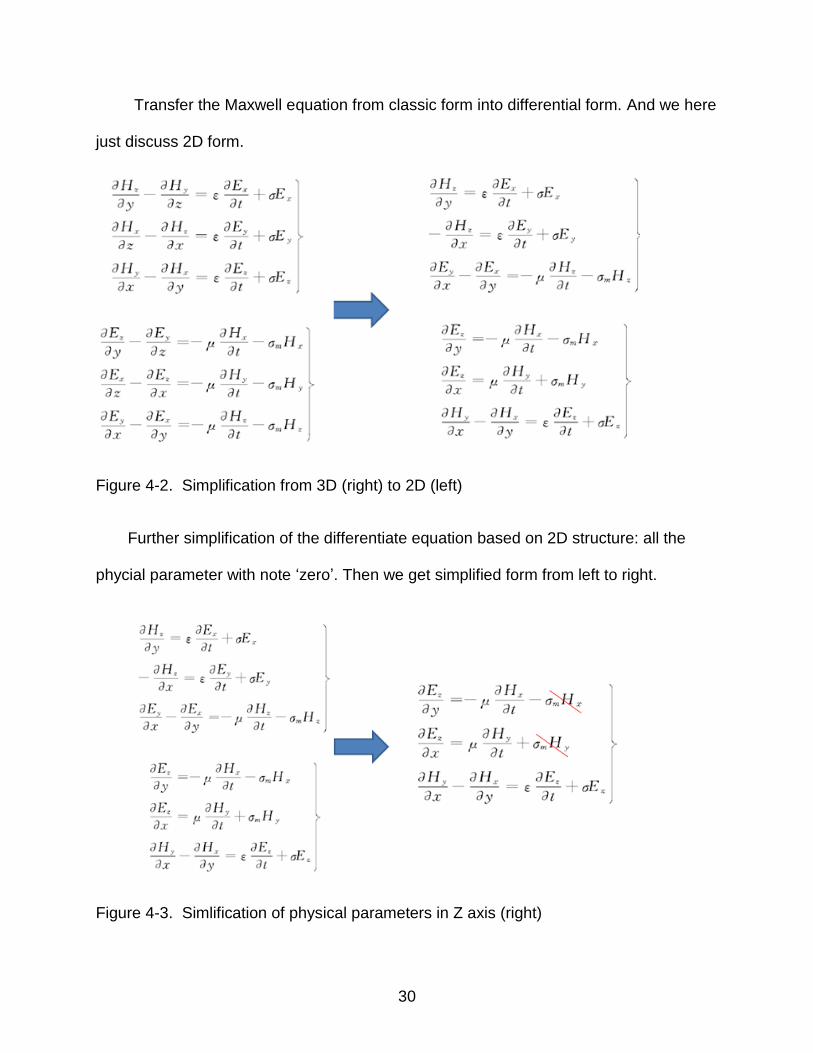
Transfer the Maxwell equation from classic form into differential form. And we here
just discuss 2D form.
Figure 4-2. Simplification from 3D (right) to 2D (left)
Further simplification of the differentiate equation based on 2D structure: all the
phycial parameter with note ‘zero’. Then we get simplified form from left to right.
Figure 4-3. Simlification of physical parameters in Z axis (right)
31
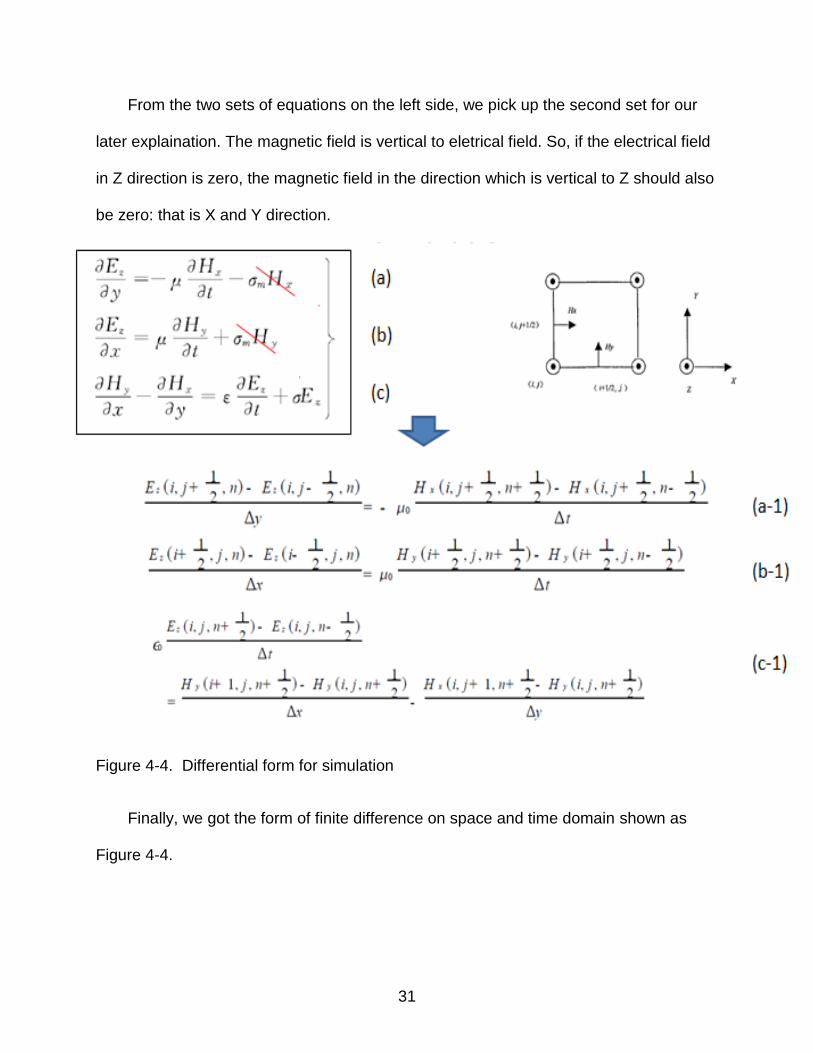
From the two sets of equations on the left side, we pick up the second set for our
later explaination. The magnetic field is vertical to eletrical field. So, if the electrical field
in Z direction is zero, the magnetic field in the direction which is vertical to Z should also
be zero: that is X and Y direction.
Figure 4-4. Differential form for simulation
Finally, we got the form of finite difference on space and time domain shown as
Figure 4-4.
32
Figure 4-5. Simulation loop
Figure 4-5 is the loop of the simulation. We propose the parameter at t=n and t=n-
1/2; we could get magnetic distribution of t=n+1/2 from a and b; following that, electric
distribution at t=n+1/2 is known. Then substitute value from second and third step into a
and b equation, we could get true value of t=n and t=n-1/2 time step. We continue this
round till we get convergent value at time step t=n and t=n-1/2.
Different Standards for Disks
Besides those experiments related with DVD disk, we also investigate the
relationship between those different commercial disks, including BD-R, DVD-R and CD-
R. The difference between those three disks is their data track periods. Figure 4-6 is a
basic illustrated structure of DVD disks:
Figure 4-6. The basic strcture of DVD disk
33
In the Figure 4-6 above, we could see that the 740nm is the track period. And
those dots contain the data information. That information is stored along those spiral
lines on the disk surface. There are some standards for DVD disks’ parameter, such as
its periodicity, its pits width, height and etc.
We pick up the BD-R, DVD-R and CD-R for the FDTD simulation and also choose
several midpoints of track periods among three standard disks as continuous research.
For example, we pick up two points between BD-R and DVD-R, and three points
between DVD-R and CD-R, as the Figure 4-7 shown
below.
Figure 4-7. The distribution of data track periodic for different disks
BD-R has a period of 320nm, DVD-R has a period of 740nm and CD-R has
1600nm.
Sensitivity of Disks
For the FDTD simulation, we mainly focus on its sensitivity of SPR peaks’ shift.
We mainly simulate the reflection spectra of those disks under different refractive index
environment and compare the results of BD-R, DVD-R and CD-R with their
experimental results to judge simulation accuracy.
34
Figure 4-8 is the reflection spetra of different disks in the RI environment of 1.33:
Figure 4-8. The simulated reflection peak of disks with different track periodicity
The bar in the graph indicates different disks with their own periodic track
distance. We could cearly observe the relationship between the peak position and track
distance: with the increasing track periodic distance, the peak position would have a red
shift to longer wavelength. And for the experiment, our lab do not have such a
spectrometer to detect such a long wavelegnth beyond the 1200nm. We have to find
another way. And for the sensitivity, we also have an interesting result:
The sensitivity increases with the the increasing periodic track distance. And
Figure 4-9 below clearly discribe that relation:
35
Figure 4-9. The simulated result of reflection spectra peak position
The wavelength is the data track distance. The blue line indicate the sensitivity of
the surface plasmon resonance. And black one indicates the peak position. Especially
for the CD-R disk, it reached the highest sensitivity at 1600nm/RIU. That might be the
highest sensitivity at present. And the highest sensitivity in the current literature is
around 800 nm/RIU. If CD-R could truly reach such a high sensitivity, it would almost
double the record. That would be another exciting point we need to prove.
36
CHAPTER 5 RELATED PUBLICATIONS
The work in the thesis paper has been published in the scientific journal (Applied
Physics Letter). Chapter 2 is published as “Surface Plasmon Resonance and Surface-
Enhanced Raman Scattering Sensing Enabled by Digital Versatile Discs”; and chapter 3
is published as “Surface Plasmon Resonance-Enabled Antibacterial Digital Versatile
Discs.” Besides, the project related with anti-bacterial test has been applied as patent
disclosure licensed by UF Office of Technology: “DVD disk enables bacterial
sterilization and sensitive bio-sensing”. All rights of the publications are belonging to the
Journal and original authors. And they are provided on the Applied Physics Letter. If you
have interests on our technology, please contact UF Office of Technology or original
authors.
37
LIST OF REFERENCES
1. E. Ozbay, Science 311, 189 (2006).
2. W. L. Barnes, A. Dereux, and T. W. Ebbesen, Nature 424, 824 (2003).
3. J. Homola, Chem. Rev. 108, 462 (2008).
4. H. Wang, D. W. Brandl, P. Nordlander, and N. J. Halas, Acc. Chem. Res. 40, 53 (2007).
5. M. E. Stewart, C. R. Anderton, L. B. Thompson, J. Maria, S. K. Gray, J.A. Rogers, and R. G. Nuzzo, Chem. Rev. 108, 494 (2008).
6. S. M. Nie and S. R. Emery, Science 275, 1102 (1997).
7. M. E. Stewart, C. R. Anderton, L. B. Thompson, J. Maria, S. K. Gray, J. A. Rogers, and R. G. Nuzzo, Chem. Rev. 108, 494 (2008).
8. J. Homola, Chem. Rev. 108, 462 (2008).
9. E. C. Le Ru and P. G. Etchegoin, Principles of Surface Enhanced Raman Spectroscopy and Related Plasmonic Effects (Elsevier, Amsterdam, 2009).
10. H. Wang, D. W. Brandl, P. Nordlander, and N. J. Halas, Acc. Chem. Res. 40, 53 (2007).
11. W. A. Murray and W. L. Barnes, Adv. Mater. 19, 3771 (2007).
12. W. L. Barnes, A. Dereux, and T. W. Ebbesen, Nature 424, 824 (2003).
13. C. Genet and T. W. Ebbesen, Nature 445, 39 (2007).
14. K. Kneipp, H. Kneipp, and J. Kneipp, Acc. Chem. Res. 39, 443 (2006).
15. C. Loo, A. Lin, L. Hirsch, M. H. Lee, J. Barton, N. J. Halas, J. West, and R. Drezek, Technol. Cancer Res. Treat. 3, 33 (2004).
16. F. Tam, C. Moran, and N. J. Halas, J. Phys. Chem. B 108, 17290 (2004).
17. J. A. Dieringer, A. D. McFarland, N. C. Shah, D. A. Stuart, A. V. Whitney, C. R. Yonzon, M. A. Young, X. Y. Zhang, and R. P. Van Duyne, Faraday Discuss. 132, 9 (2006).
18. C. L. Haynes and R. P. Van Duyne, J. Phys. Chem. B 105, 5599 (2001).
38
19. P. M. Tessier, O. D. Velev, A. T. Kalambur, J. F. Rabolt, A. M. Lenhoff, and E. W. Kaler, J. Am. Chem. Soc. 122, 9554 (2000).
20. S. G. Jang, D. G. Choi, C. J. Heo, S. Y. Lee, and S. M. Yang, Adv. Mater. 20, 4862 (2008).
21. M. M. Varma, H. D. Inerowicz, F. E. Regnier, and D. D. Nolte, Biosens.Bioelectron. 19, 1371 (2004).
22. M. M. Varma, D. D. Nolte, H. D. Inerowicz, and F. E. Regnier, Opt. Lett. 29, 950 (2004).
23. C. Loo, A. Lin, L. Hirsch, M. H. Lee, J. Barton, N. J. Halas, J. West, and R. Drezek, Technol. Cancer Res. Treat. 3, 33 (2004).
24. G. Fuertes, O. L. Sanchez-Munoz, E. Pedrueza, K. Abderrafi, J. Salgado, and E. Jimenez, Langmuir 27, 2826 (2011).
25. Kumar, P. K. Vemula, P. M. Ajayan, and G. John, Nature Mater. 7, 236 (2008).
26. Marambio-Jones and E. M. V. Hoek, J. Nanopart. Res. 12, 1531 (2010).
27. R. Bardhan, S. Lal, A. Joshi, and N. J. Halas, Acc. Chem. Res. 44, 936 (2011).
28. Dou, X.; Chung, P. Y.; Dai, J. L.; Jiang, P.* Surface Plasmon Resonance and Surface-Enhanced Raman Scattering Sensing Enabled by Digital Versatile Discs. Applied Physics Letter. 2012, 100, 041116.
29. Dou, X.; Chung, P. Y.; Dai, J. L.*; Jiang, P.* Surface Plasmon Resonance-Enabled Antibacterial Digital Versatile Discs. Applied Physics Letter. 2012, 100, 063702.
39
BIOGRAPHICAL SKETCH
Xuan Dou received his B.S. degree of mechanical engineering from University of
Science and Technology of China in 2010. He then joined the Department of Chemical
Engineering at University of Florida. He mainly focuses on the application of surface
plasmon resonance based on different Nano-structured substrates. He will get his
Master of Science degree in 2012 and continue his Ph.D. study in material sciences at
Northwestern University.