the application of pinch analysis for water and effluent management … hub documents/research...
TRANSCRIPT
THE APPLICATION OF PINCH ANALYSIS FORWATER AND EFFLUENT MANAGEMENT
Report to the
WATER RESEARCH COMMISSION
by
C.J. Brouckaert, P. Gianadda, J.P.Z. Schneider, G.M.Naylor and C.A.Buckley
Pollution Research GroupUniversity of Natal
Durban
on the Project
"The Further Application of Pinch Analysis for Water and EffluentManagement"
WRC Report No 1158/1/05
ISBN No 1-77005-342-5
September 2005

EXECUTIVE SUMMARY
This report is a sequel to WRC Report No. 851/1/03 entitled The Application of PinchAnalysis for the Rational Management of Water and Effluent in an Industrial Complex. Theearlier report set out the basis and methodology, together with some practical guidelines, forapplying water pinch analysis to an industrial system, and presented some case studies aspractical examples. This report is mostly concerned with further case studies which had notbeen completed at the time of the previous report. However these case studies do reflectsome development in theoretical understanding which occurred during the interveningperiod. Thus the two reports are complementary to one another, and should be consideredtogether. In particular, the literature survey and general theoretical background to water pinchanalysis are contained in the previous report, while this report starts to address some issueswhich were raised in the previous report.
1 Background and Motivation
Industrial processes usually require water with a range of qualities, and produce severaleffluents with a range of qualities, which allow the possibility of a hierarchical use of water.
Possible strategies for reducing the consumption of fresh water and the production ofwastewater include:
reuse: wastewater from one process can be directly reused in others, provided the level ofcontamination is sufficiently low to meet the requirements of the subsequent processes;regenerative reuse: wastewater can be treated to reduce the levels of contaminantsbefore being reused in other processes. In this option, the water is not recycled to theprocess from it came;regenerative recycling: after regeneration, water can be recycled to the process fromwhich it came. This is generally more difficult than reuse, because recycling tends tobuild up contaminants.
Pinch analysis is a process integration tool, which was first developed for the design of heatrecovery systems during the late 1970s. Using the analogies between heat and mass-transfer,a similar approach was developed for the design of mass-exchange systems. This workformed the basis for the design of water-using systems. It took the design objective to be tominimise water consumption by maximising the reuse of water, using a graphical techniquewhich was termed Water Pinch Analysis. However the technique was difficult (althoughpossible) to extend to accommodate the practical constraints and characteristics ofwater-using systems, such as multiple contaminants, flow rate constraints, piping costs, etc.The added desire to introduce cost optimisation required that the problem be formulatedusing mathematical programming techniques.
Water Pinch Analysis thus involves a set of systematic formal techniques to handle thecomplex problem of hierarchical water allocation to a system consisting of a number ofprocesses, and choosing the best combination of strategies. The theory that appears in theliterature is still developing. The practical application of this theory is not as well establishedin the open literature, and particularly not in a South African context.
i

2 Project Objectives
As originally stated, the project objectives were:
to promote the wide spread application of pinch analysis for the management of waterand effluents; to develop the technique for the specific problems associated with South Africanindustry; to promote better water management by undertaking pinch analysis studies at selectedsites; to enhance the capacity within South Africa to undertake pinch analysis studies and topromote the wider understanding of the technique within educational institutions,industry and government by training people in the technique.
These objectives were pursued chiefly through undertaking case studies at a number offactories. Some of these were carried out by full time students at the University of Natal,whereas a number involved part-time students who were also working as engineers at thefactories which were the subjects of study. Chapter 4 concerning the Mondi Merebank PaperMill is based on one of these part-time student projects.
3 Overall course of the project
The history of this project is inextricably interwoven with that of WRC project that precededit: K5/851 The Application of Pinch Analysis for the Rational Management of Water andEffluent in an Industrial Complex, so a single account of both is given.
The original project was envisaged as concerning only factories in the Umbogintwiniindustrial complex, located south of Durban. At the start in 1997, a preliminary surveyidentified AECI Bioproducts (lysine), SA Tioxide (titanium dioxide pigment) and SasolPolymers (chlor-alkali) as the three largest water users in the complex, and these wereselected for the initial investigations.
At the same time, the Canelands factory of Sanachem, a subsidiary of Sentrachem,producing agrochemical (principally herbicides and pesticides) requested to join the project.One of their chemical engineers, Thokozani Majozi, was assigned to undertaking the pinchanalysis of processes at their site. This work was undertaken as a MScEng project, for whichhe was allowed to devote 50 % of his time.
A collaborative relationship was also established with Linnhoff-March, the UK consultingfirm developing and marketing the WaterTargetTM suite of software for water pinch analysis.
Later in the project, other case studies were initiated as a result of interest from industry. Thefirst of these was a study of the Eskom Lethabo Power Station near Vereeniging, in which theobjective was to use pinch analysis to determine the best way to use a reverse osmosis plantwithin the power station water system. Three studies were started at paper mills: the MondiMerebank paper mill with Gladys Naylor (née Crampton), the Sappi Ngodwana mill withEric Slabbert and the Sappi Tugela mill with Maryna Mansfield. All three investigators wereprocess engineers associated with the mills, who registering as part-time MScEng students. Asimilar arrangement was made with Annelie Lourens, a Sasol process engineer who workedon the water systems at the Natref refinery and the Secunda oil-from-coal complex. Finally,a study was commissioned by the South African branch of ILSI, the International LifeSciences Institute, to produce a monograph on the application of water pinch analysis in thefood industry, after undertaking a pilot study at the Ceres Fruit Juice factory in Ceres. This
ii
was carried out by Janos Schneider after completing his thesis on the AECI Bioproductsplant.
Not all of these investigations reached successful conclusions during the course of theproject. The initial studies at SA Tioxide and AECI Bioproducts stopped as a result of theresignation of key personnel; however the AECI Bioproducts study was subsequentlyrestarted and completed successfully by a different student, Janos Schneider. The Sasolstudy halted when Mrs. Lourens resigned from Sasol to emigrate. The Sappi Ngodwana andSappi Tugela studies were not completed by the end of the project, largely because of thepressure of other work commitments on the part-time students involved. This report andWRC Report 851/1/03, between them present those case studies which reached a sufficientdegree of closure. These were:
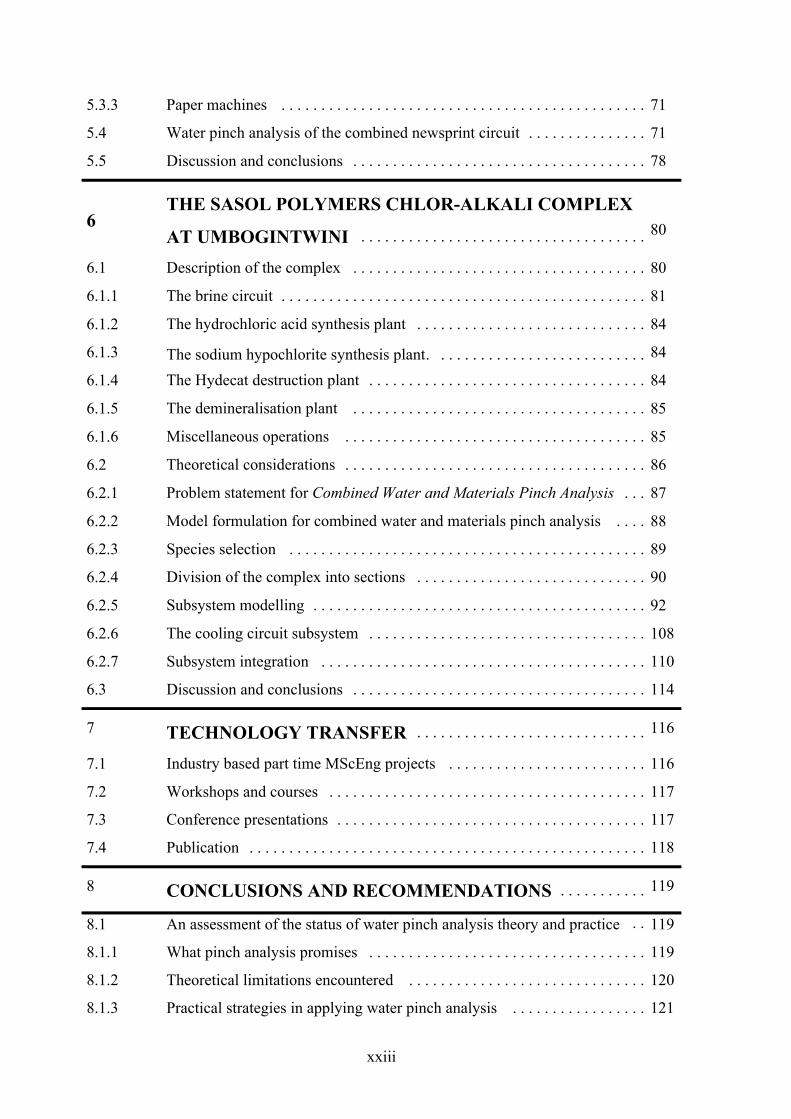
i) The Sasol Polymers Chlor-alkali plant. This in fact provided two case studies, the firstcarried out by Grant Gardner during the earlier project, and reported in WRC Report851/1/03. In the follow-up project the plant was revisited by Paolo Gianadda in thelight of the advances in pinch analysis theory which had occurred, as well as changeswhich had taken place in the factory. The later case study appears in the present report(chapter 6)
ii) The Sanachem agrochemical plant (WRC Report 851/1/03).iii) The Lethabo Power Station (WRC Report 851/1/03).iv) The Ceres Fruit Juice factory (chapter 3 of this report).v) The AECI Bioproducts Lysine plant (chapter 4 of this report).vi) The Mondi Merebank paper mill (chapter 5 of this report).
Although the other case studies do not appear explicitly in the reports, they are representedimplicitly in that they provided valuable experience which contributed greatly to the generalunderstanding of pinch analysis, which in turn influenced the more successful projects.
4 Structure of the report
The principal matter of this report is contained in the four case studies, which present pinchanalyses applied to different factories, involving widely varying circumstances. The factoriesinvolved were Ceres Fruit Juices, (chapter 3), the AECI Bioproducts lysine plant (chapter 4),the Mondi Merebank paper mill (chapter 5) and the Sasol Polymers chlor-alkali plant(chapter 6). Each of these case studies has its own discussion and conclusions related toissues specific to the system involved. These are preceded by chapter 2 devoted to thoseaspects of the methodology which were common to the investigations. In particular, itdescribes the Linnhoff-March WaterTarget software which was the principal tool used for thelysine plant and the paper mill, and which was also used in a subsidiary role for thechlor-alkali plant. Chapter 7 presents activities which aimed to promote water pinch analysisto industry during the course of the project. The conclusions and recommendations ofchapter 8 concern issues which emerge from considering the various case studies together,and the overall experience of applying water pinch analysis to South African industries.
5 Methodology
The chief modus operandi of this project was to promote the water pinch concept toindustries, and wherever possible to recruit engineering personnel from the companiesinvolved to enrol for part-time MScEng degrees, undertaking water pinch analysis studies intheir factories. Two conventional academic projects involving full-time students served to
iii

generate theoretical support for situations where the current techniques are not completelyadequate.
During the project a relationship was established with the British company Linnhoff-March,which has been associated with the development of both thermal and water pinch analysis.The WaterTarget® suite of software from Linnhoff-March was used for several of the studies. The Linnhoff-March software is aimed at the analysis of systems in which water is used onlyas a utility to a process, and is not an intrinsic part of the core process technology. Thecombined water and materials pinch analysis which was developed during the study of theSasol Polymers chlor-alkali process required a different framework.
The distinction made between process streams and water streams in the pinch analysisformulation is more precisely a distinction between process streams and utility-water streams.It often happens that some of the process streams are also water streams. Making thedistinction between process streams and water streams in the usual manner therefore resultsin some of the streams involving water being excluded from the analysis. In addition, someof the dissolved species present in the process-water streams may not be undesirablecontaminants, but instead necessary elements of the process technology.
To properly optimise the use of water in such systems requires an approach which considersboth the process-water streams and the utility-water streams. Given that the presenttechniques and tools only consider the utility-side of the problem, we coined the termsutility-water pinch analysis for the situation where only utility streams are considered, andprocess-water pinch analysis where process-water streams are also included. Process-waterpinch analysis is a superset of utility-water pinch analysis since utility-water streams are alsoincluded in the analysis.
6 Results of the case studies
6.1 Ceres Fruit Juices
The South African branch of the International Life Sciences Institute (ILSI) commissionedthe preparation a monograph on the application of water pinch analysis in the food industry.ILSI is a non-profit, world-wide foundation established in 1978 to advance the understandingof scientific issues relating to nutrition, food safety, toxicology, and the environment. It waspart of the terms of reference of the commission that the studies should presentstraightforward applications of pinch analysis, using the simplest and most easily understoodversion of the technique. The Ceres Fruit Juices (CFJ) study is included in this report torepresent this relatively simple end of the pinch analysis spectrum.
CFJ is located in the town of Ceres, approximately 200 km east of Cape Town. CFJmanufacture fruit juice for both the local and export market. Fruit juice from blending is heatsterilised to form the final product for packaging. Blending requires ultra pure water from thewater treatment plant. Chlorinated water from the treatment plant is used for the sterilisationprocess and for cooling. Finally, effluent is treated in the effluent treatment plant to complywith municipal standards.
The study largely followed the general methodology for applying pinch analysis to anexisting process set out in chapter 3 of the previous WRC Report No. 851/1/03. The steps inthe process were:
1) selection of the system boundaries;2) identification of water sources and sinks;3) pre-screening;
iv
4) data gathering;5) pinch problem formulation
modeling of unit operationsoptimisation,identification of bottlenecks - relax constraints or regenerate,integrated network design;
The final step 6), implementing the suggested design changes, was not achieved during theproject period.
The pinch analysis was based on a single contaminant, total solids (TS) which includeddissolved and suspended solids. A straightforward application of the pinch analysis methodidentified the minimum fresh water supply rate as 3 t/h, compared with the current figure of9.5 t/h. However, this did not take into account a number of restrictions on where water couldbe recycled which were related to the requirements of food processing. After eliminatingreuse options which were considered to involve unacceptable contamination risks, the freshwater requirement was determined to be 4.7 t/h, which still represented a reduction of almost50 % on the current usage. The study ended at this point, so it was not possible to confirmwhether this could be implemented in practice. This would require a detail assessment ofeach reuse option to check that it was in fact appropriate: for instance it might happen thatsome contaminant that was not fully represented by the TS could prevent reuse of water fromone particular part of the process to another.
6.2 The AECI Bioproducts Lysine Plant
AECI Bioproducts (Bioproducts) is part of an industrial complex located at Umbogintwini,approximately 26 km south of Durban, Kwazulu-Natal. This system was selected forinvestigation as it is one of the major users of freshwater on the complex and hencedischarges a related quantity of wastewater, amounting to approximately 400 ML per annum.Bioproducts is a manufacturer of l-lysine, which is an animal feed additive.
Commissioned in 1995, AECI Bioproducts is a modern facility and has sophisticated qualityand environmental standards. Freshwater is withdrawn from the Umbogintwini River and ispre-treated before use. The l-lysine is produced by batch fermentation and is extracted fromthe fermentation broth by ion exchange. Two effluent sources arise from the manufacturingprocess: a concentrated broth effluent and general process effluent, which are handledseparately. Process effluent arises mainly from the following sources:
the utility system;tank and unit operation cleaning;pump seals; storm water runoff andcontaminated process condensate.
Process effluent is discharged via a sea pipeline and environmental regulations limit theconcentration of pollutants expelled in this manner. What remained after lysine extractionwas broth effluent, which was removed from the site and handled by the local sewage works.In accordance with an agreement with the DWAF, neither broth effluent nor failedfermentation batches were to be discharged via the sea pipeline.
The aims of this project were to:
i) apply water pinch analysis at Bioproducts, which consisted of determining:
v

the set of contaminants that effectively limit water reuse within the system;operating and fixed costs associated with operating the water-using network andnecessary retrofit strategies;a network configuration that satisfies the external constraints imposed upon the systemat minimum cost;operational improvements to the system in terms of retrofitting of treatment and regen-eration operations, and additional piping requirements.
ii) determine the elements of the water-using network that were the greatest barriers tofurther saving and improvement, and in so doing, suggest possible improvements thatwould aid in the implementation of similar projects in the future.
The results of this case study had the following notable features:
1) The analysis was carried out using the Linnhoff-March WaterTarget software and themathematical programming approach to water pinch analysis. It was limited to utilitywater streams, considered multiple contaminants, and optimised an economic objectivefunction, i.e. it sought to minimise costs associated with the water system rather than thevolumetric use of water.
2) Although it was not able to identify significant water savings, it did identify significantcost savings, which was in strong contrast to the classical pinch analysis methodology.
3) The nature of these cost savings raised some interesting issues. The pinch analysisdemonstrated that savings were prevented by the external limit on the concentration ofsuspended solids (SS) constraint at the sea pipeline. Saving could be achieved byrelaxing this constraint and allowing for discharge of broth effluent to the sea. At R16 /t,the hourly cost of disposing the broth effluent at the local wastewater treatment worksamounted to R400 /h, approximately 72% of the total water-using network operating costof R 556 /h. Thus, the DWAF effluent discharge permit concerning the broth effluent,with its SS constraint of 400 mg/L at the sea outfall, was established as the major barrierto further savings. Subsequently to the study, the factory applied to DWAF to allow thedischarge of broth effluent to sea, and to increase the 400 mg/L SS limit. The reason forsetting this limit had been purely to avoid an unsightly stain of the sea surface, and thescientific basis for the value of 400 mg/L was far from certain. However, DWAF wouldnot consider environmental arguments for relaxing it until the factory had demonstratedthat it had reached the limit of what could be achieved by improving its operation. Thepinch analysis was accepted as evidence that this was the case, so it was agreed to relaxthe limits, subject to monitoring the resulting condition of the sea. To date no adverseeffects resulting from the discharge have been detected.
4) This outcome suggests a useful role for pinch analysis in the interaction betweenindustries and regulatory authorities in establishing the parameters of water use permits.It offers systematic and transparent analysis of the industry’s water needs which couldprovide the basis for trust between the parties. However, it does require a capacity inboth parties to understand and question the basis of the analysis.
7 The Mondi paper mill at Merebank, Durban
The Mondi Paper mill at Merebank in south Durban is an integrated pulp and paper mill,producing three types of pulp, supercalendered magazine paper, uncoated woodfree paper,newsprint, telephone directory and carbonless coated paper. The three types of pulpproduced at Mondi Paper are:
Thermomechanical pulp
vi

Groundwood pulpRecycled fibre pulp
The groundwood and thermomechanical pulps are produced by mechanically separating thefibres from other wood constituents, by means of log grinding in the groundwood process andchip refining in the thermomechanical process.
The fibre sources used in the production of the pulp and paper are:
Logs and chips - PineRecycled paper - newspapers and magazinesChemical pulp - hardwood pulp produced from Eucalyptus wood and softwood pulpproduced from Pine
There are five paper machines at Mondi Paper producing the following paper grades:
Paper Machine 1 Supercalendered magazine paper
Paper Machines 2 and 3 Uncoated woodfree paper
Paper Machines 4 and 5 Newsprint and telephone directory
Some of the uncoated woodfree paper produced at the mill is coated with microcapsules, on aseparate coating machine, to produce carbonless coated paper.
The steam requirements of the mill are supplied by the power plant which comprises two coalfired boilers, two standby oil boilers and two standby gas boilers. The coal boilers supply thesteam required to produce the pulp and dry the paper.
Water has many vital functions in all the sections of the mill, and is indeed integral to theprocess. However, the water in the main process streams was excluded from the analysis,except where it left the process as an effluent. As with the lysine plant case study, theLinnhoff-March WaterTarget software was used for the analysis.
In order to perform a Water Pinch analysis on a site which is as complicated as the Merebankmill, the operation was divided into manageable sections. The sections chosen were theRecycled Fibre Plant, the Thermo-mechanical Pulp Plant and the Paper Machines. A flowsheet model of each sections was then developed, and a water and contaminant balance wasestablished. Once a sufficiently accurate water and contaminant balance was achieved, thestreams which were not variable, and therefore did not form part of the water pinch analysis(e.g. product streams), were not considered further. Once the streams which did not formpart of the water pinch analysis had been removed and the water pinch model of the plant hadbeen developed, this model was tested by forcing the stream flows to correspond to the actualplant situation as closely as possible by introducing flow constraints. This constrained modelformed the baseline to compare subsequent results against. The next step involved removingthose constraints which appeared not to be absolutely required in terms of processconsiderations, and allowing the model to re-route streams in order to achieve a minimumfresh water consumption.
The results of the optimisation of the individual plants were disappointing: no significantsaving in water usage was identified at all. In retrospect this was understandable in that eachindividual plant was set up essential as a countercurrent process treating a pulp stream, whichis well known to be the most efficient configuration. The only possibility for discoveringfurther efficiencies lay in considering the different sections as an integrated system, andexploiting inter-section transfers of water.
vii
The results of the of analysis of the integrated process were to reduce the total fresh waterconsumption from 636.3 t/h to 584.5 t/h, and the total effluent generated from 954.4 t/h to902.9 t/h ( 8.1 % reduction in fresh water consumption and 5.4 % in effluent generation).
From this investigation of the application of water pinch analysis in an integrated pulp andpaper mill, the following can be concluded:
i) Scope for optimisation and water savings within individual sections of the mill wasinsignificant. There were a number of reasons for this namely:Only utility water was considered in this analysisThere has been a considerable amount of effort already put into reducing waterconsumption at the mill over a number of years.Water is already recycled and reused within the process to some extent
ii) By application of single contaminant analysis to a larger section of the mill it waspossible to reduce the fresh water requirement by 51.54 t/h (8.1%) and effluentgenerated by the same amount (5.4%).
iii) These reductions translated into a saving of R1 548 593 /annum. The savings wascalculated by the objective function which included fresh water costs and effluentcosts, but did not include engineering costs or piping costs. In addition, the objectivefunction did not take geographical costs into account, the distance between the sectionsin the plant was not included in the analysis.
iv) There are operability constraints which could prevent these savings from beingachieved, since they involve the transfer of water from processes which are not alwaysoperated on the same schedule.
v) Thirty two new connections were generated in the optimised model, however the samesavings could be achieved with just three. These three streams were identified using anovel approach to implementing water pinch analysis which involved the evaluation ofsensitivity coefficients of the flow constraints in combination with the magnitude of thestreams involved. The top three new connections identified in this mannercorresponded to the three streams which were responsible for the fresh water savings inthe optimised model generated by the water pinch analysis.
This study did not consider the use of treatment options to reduce the fibre content in theexisting streams and thereby reduce the fresh water consumption further. Removal of fibrefrom streams will allow further reuse and recycling within the process and thus a furtherreduction in the amount of fresh water required.
During the course of the study, the water supply situation for the mill was changedsubstantially with the commissioning of the Durban Water Recycling Plant. This treatsrecovered domestic and industrial wastewater to a standard which makes it suitable forindustrial use. Mondi is the scheme’s main customer, and is supplied recycled water in termsof a "take or pay" agreement. The mill uses the recycled water for all the processrequirements and in terms of the agreement with the Recycling Plant the mill pays for aminimum amount of water per day, whether this amount of water is used or not. Currentlythe mill consumption of water is slightly below the "take or pay" minimum specification, sothe commercial incentive to implement water saving measures has disappeared.
8 The Sasol Polymers chlor-alkali process at Umbogintwini
The application of Pinch Analysis to water and wastewater management at the SasolPolymers chlor-alkali complex was first addressed as part of WRC Project K5/851. As partof that project, a Water Pinch Analysis study at the chlor-alkali complex was conducted by
viii

Gardner, starting in 1997 . Motivated by the results from this study and with a number ofprocess changes that had been made to the chlor-alkali complex, the follow-up study reportedhere was undertaken by Paolo Gianadda and began in 1999.
The Sasol Polymers chlor-alkali complex, formerly operated by Polifin Limited andpreviously by AECI Chlor-Alkali and Plastics Limited, was located within the UmbogintwiniIndustrial Site some 25 km south of Durban, South Africa. During its period of operation,from 1955 to 2001, the complex produced chlorine and caustic soda, together with a range ofother derived products. It was also in this period that the complex underwent a number ofchanges as processes were upgraded and decommissioned. As it stood at the time of itsclosure, the complex produced caustic soda, chlorine, hydrogen, hydrochloric acid andsodium hypochlorite. Otherwise indicated, references to the plant refer to its configuration asit stood when it was closed in 2001.
Central to the activities of the complex was the brine circuit which converts raw salt tocaustic soda, chlorine and hydrogen. Part of the chlorine and hydrogen generated from thecircuit was used for the production of hydrochloric acid in the hydrochloric acid synthesisplant. Chlorine was further used, along with caustic soda, in the manufacture of sodiumhypochlorite in the sodium hypochlorite synthesis plant. Two other plants located within thecomplex were the demineralisation plant, which produced a high quality water for use withinthe complex, and the Hydecat destruction plant which destroyed surplus orbelow-specification sodium hypochlorite along with other chlorine-containing effluents.
Results from Gardner’s study (presented in WRC report 851/1/03) showed that there wassignificant potential for savings to be effected on the chlor-alkali complex through the reuseand recovery of both water and reagents. However, the approach adopted at the timeresulted in the problem being considered from a single contaminant perspective; as such theoptimality and even the feasibility of the proposed network configurations could not beguaranteed from the multiple contaminant perspective. The chlor-alkali complex also did notcorrespond to the typical situation associated with the application of Water Pinch Analysis.Existing Water Pinch Analysis tools, and the theory from which they developed, rely on theassumption that a clear distinction can be made between so-called water streams and processstreams. With this distinction in place, only the water-side of the problem is considered inthe Pinch Analysis: the process-side is not represented explicitly. However, it was notpossible to distinguish between process streams and water streams in the chlor-alkalicomplex.
There were three key aspects to the problem presented by the chlor-alkali complex whichmade the application of current water pinch analysis theory to the situation unsatisfactory.These were:
The lack of distinction between process streams and water streams;The presence of multiple resources, in this case reagents and raw materials, in addition towater. These resources carried species which had an economic value to the system, andcould not be treated in the same way as contaminants; andThe chemical reactions taking place between the various species in the system.
An extension of the theory was needed to address these issues, and the term Combined Waterand Materials Pinch Analysis was coined to describe the new methodology.
ix

Species considered in the combined water and materials pinch analysis
Of significance in the cooling towersUndesirableTDS
Fouling of equipmentUndesirableInsolubles
Product of chemical reactions-O2
Diffuses through electrolyser membranes with some precipitationtaking placeUndesirableNa2SO4
Product produced and reagent/raw material used by the complexContaminant where hydrochloric acid is required
DesirableUndesirableNaOH
Product produced by the complexCl2 releasing species - problematic in brine circuit and effluent
DesirableUndesirableNaOCl
Destroys Cl2 in brine streamConverts to sulphate which is undesirable
DesirableUndesirableNaHSO3
Used as a reagent to precipitate calcium in brine circuitAffects electrolyser membranes at high concentrations
DesirableUndesirableNa2CO3
Damages cation-exchange resin in brine circuitUndesirableNaClO3
Raw material used in the complexContaminant in demineralised water production
DesirableUndesirableNaCl
A precipitate which can foul electrolyser membranesUndesirableMg(OH)2
Precipitates as hydroxide in electrolyser membranesUndesirableMg2+
Involved in chemical reactions-H2O
Product produced and reagent/raw material used by the complexContaminant where caustic soda is required
DesirableUndesirableHCl
Product produced and raw material used by the complexDesirableH2
Product produced and raw material used by the complexDestroys cation-exchange resin in brine circuit
DesirableUndesirableCl2
A precipitate which can foul electrolyser membranesUndesirableCaCO3
Precipitates as hydroxide in electrolyser membranesUndesirableCa2+
Justification for SelectionStatusSpecies
The analysis followed the mathematical programming approach, along roughly similar linesto the Linnhoff-March WaterTarget software, but new software had to be developed to takeall the additional considerations into account. This was implemented using the GAMS(General Algebraic Modelling System) modelling framework.
This study represented the most comprehensive attempt to provide a thorough theoretical andpractical treatment of the process water pinch analysis problem. The issue of utility waterpinch analysis vs. process water pinch analysis was one which was encountered in some formin all the case studies undertaken during this project and WRC Project K5/851 that precededit. It seems that, at least in the context of a water-poor country like South Africa, that thelimitation to considering only utility water is a significant restriction. Clearly the extendedtheory is more complex and requires much more effort to apply. The individual processmodules have to be individually crafted, and require much more insight and modelling skillthan those which have been found adequate for utility water pinch analysis. The risks ofmaking changes which will adversely affect the process involved are also greater.
x

Some perspective on these issues can be obtained from a utility water pinch analysis of thesame chlor-alkali system carried out using the Linnhoff-March WaterPinch software, basedon the same input data. A comparison between the results of the (utility) water pinchanalysis results and the combined water and materials pinch analysis are shown in the tablebelow
The Water Pinch Analysis study was able to realise 57% of the total saving achieved byCombined Water and Materials Pinch Analysis. In terms of water abstraction and effluentgeneration, relatively small changes are observed between these two studies with theCombined Water and Materials Pinch Analysis achieving a further 3 % reduction in the totalamount of water used and an additional 10 % reduction in terms of the amount of effluentgenerated. It is however in the area of chemical recovery and reuse where Combined Waterand Materials Pinch Analysis outperforms Water Pinch Analysis and much of the additionalcost saving is attributable to this.
Comparison of potential savings achieved by Utility Water Pinch Analysis andCombined Water and Materials Pinch Analysis
945 727542 881Annual Saving [R/y]
5.60Solid Waste
4232Effluent
6.60Alpha-Cellulose
-3.30Flocculant
-1.20Steam
00Hydrogen
0.050Chlorine
1.60Sodium Bisulphite
-0.530Sodium Carbonate
0.170Raw Salt
8.31.9Hydrochloric Acid (31% m/m HCl)
1.60.2Caustic Soda (32% m/m NaOH)
3434Demineralised Water
1411Total Water
10042Umgeni Water
0.97Umbogintwini River Water
Combined Water and MaterialsPinch Analysis
[%]
Water PinchAnalysis
[%]
9 Conclusions and recommendations
In addition to the individual conclusions pertaining to each case study, which appear in therelevant chapters, the range and scope of the case studies undertaken during the projectallows some broad conclusions to be drawn about water pinch analysis as a technique.
9.1 An assessment of the status of water pinch analysis theory and practice
Pinch analysis, whether applied to energy or water, is a special case of the more generaltechnique of process optimisation. In most cases the problem of fully optimising all aspects
xi
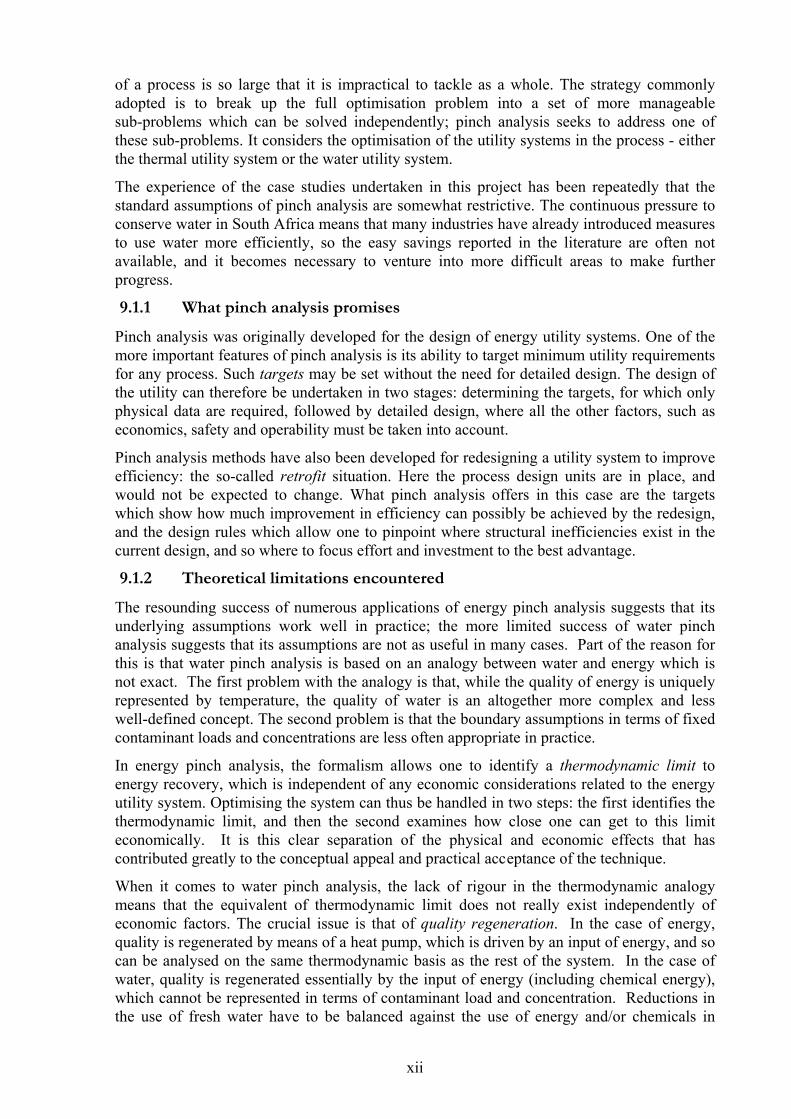
of a process is so large that it is impractical to tackle as a whole. The strategy commonlyadopted is to break up the full optimisation problem into a set of more manageablesub-problems which can be solved independently; pinch analysis seeks to address one ofthese sub-problems. It considers the optimisation of the utility systems in the process - eitherthe thermal utility system or the water utility system.
The experience of the case studies undertaken in this project has been repeatedly that thestandard assumptions of pinch analysis are somewhat restrictive. The continuous pressure toconserve water in South Africa means that many industries have already introduced measuresto use water more efficiently, so the easy savings reported in the literature are often notavailable, and it becomes necessary to venture into more difficult areas to make furtherprogress.
9.1.1 What pinch analysis promises
Pinch analysis was originally developed for the design of energy utility systems. One of themore important features of pinch analysis is its ability to target minimum utility requirementsfor any process. Such targets may be set without the need for detailed design. The design ofthe utility can therefore be undertaken in two stages: determining the targets, for which onlyphysical data are required, followed by detailed design, where all the other factors, such aseconomics, safety and operability must be taken into account.
Pinch analysis methods have also been developed for redesigning a utility system to improveefficiency: the so-called retrofit situation. Here the process design units are in place, andwould not be expected to change. What pinch analysis offers in this case are the targetswhich show how much improvement in efficiency can possibly be achieved by the redesign,and the design rules which allow one to pinpoint where structural inefficiencies exist in thecurrent design, and so where to focus effort and investment to the best advantage.
9.1.2 Theoretical limitations encountered
The resounding success of numerous applications of energy pinch analysis suggests that itsunderlying assumptions work well in practice; the more limited success of water pinchanalysis suggests that its assumptions are not as useful in many cases. Part of the reason forthis is that water pinch analysis is based on an analogy between water and energy which isnot exact. The first problem with the analogy is that, while the quality of energy is uniquelyrepresented by temperature, the quality of water is an altogether more complex and lesswell-defined concept. The second problem is that the boundary assumptions in terms of fixedcontaminant loads and concentrations are less often appropriate in practice.
In energy pinch analysis, the formalism allows one to identify a thermodynamic limit toenergy recovery, which is independent of any economic considerations related to the energyutility system. Optimising the system can thus be handled in two steps: the first identifies thethermodynamic limit, and then the second examines how close one can get to this limiteconomically. It is this clear separation of the physical and economic effects that hascontributed greatly to the conceptual appeal and practical acceptance of the technique.
When it comes to water pinch analysis, the lack of rigour in the thermodynamic analogymeans that the equivalent of thermodynamic limit does not really exist independently ofeconomic factors. The crucial issue is that of quality regeneration. In the case of energy,quality is regenerated by means of a heat pump, which is driven by an input of energy, and socan be analysed on the same thermodynamic basis as the rest of the system. In the case ofwater, quality is regenerated essentially by the input of energy (including chemical energy),which cannot be represented in terms of contaminant load and concentration. Reductions inthe use of fresh water have to be balanced against the use of energy and/or chemicals in
xii
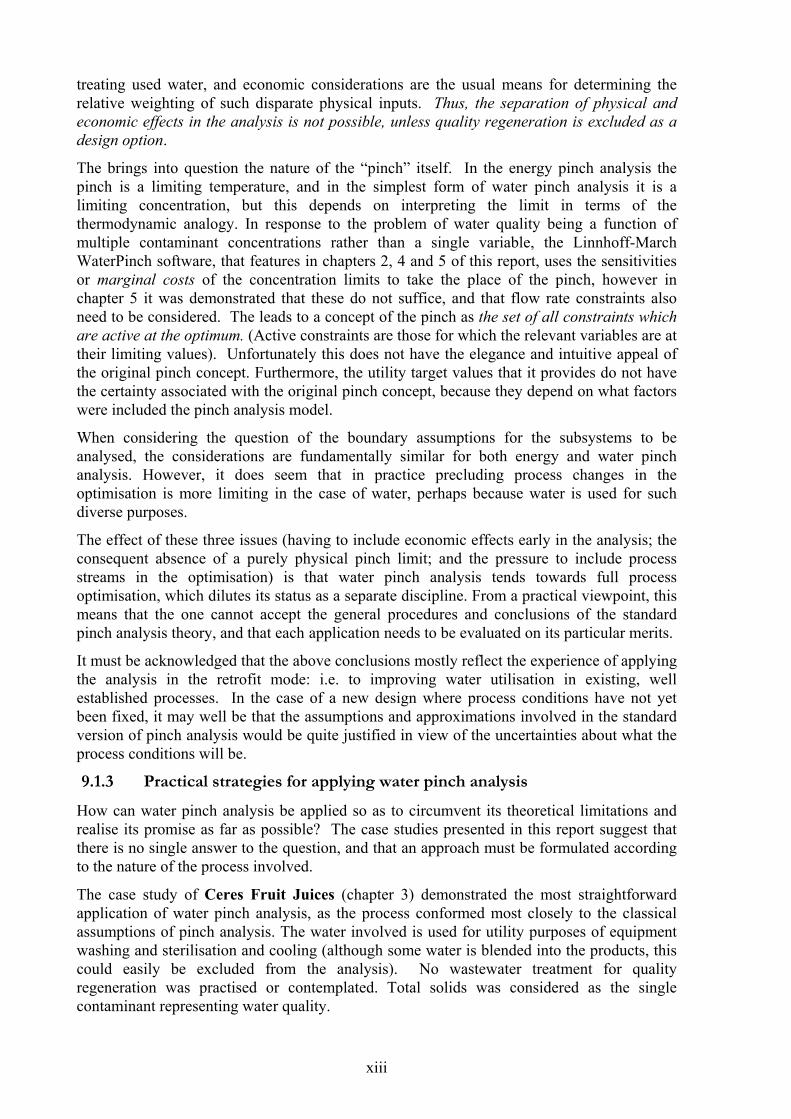
treating used water, and economic considerations are the usual means for determining therelative weighting of such disparate physical inputs. Thus, the separation of physical andeconomic effects in the analysis is not possible, unless quality regeneration is excluded as adesign option.
The brings into question the nature of the “pinch” itself. In the energy pinch analysis thepinch is a limiting temperature, and in the simplest form of water pinch analysis it is alimiting concentration, but this depends on interpreting the limit in terms of thethermodynamic analogy. In response to the problem of water quality being a function ofmultiple contaminant concentrations rather than a single variable, the Linnhoff-MarchWaterPinch software, that features in chapters 2, 4 and 5 of this report, uses the sensitivitiesor marginal costs of the concentration limits to take the place of the pinch, however inchapter 5 it was demonstrated that these do not suffice, and that flow rate constraints alsoneed to be considered. The leads to a concept of the pinch as the set of all constraints whichare active at the optimum. (Active constraints are those for which the relevant variables are attheir limiting values). Unfortunately this does not have the elegance and intuitive appeal ofthe original pinch concept. Furthermore, the utility target values that it provides do not havethe certainty associated with the original pinch concept, because they depend on what factorswere included the pinch analysis model.
When considering the question of the boundary assumptions for the subsystems to beanalysed, the considerations are fundamentally similar for both energy and water pinchanalysis. However, it does seem that in practice precluding process changes in theoptimisation is more limiting in the case of water, perhaps because water is used for suchdiverse purposes.
The effect of these three issues (having to include economic effects early in the analysis; theconsequent absence of a purely physical pinch limit; and the pressure to include processstreams in the optimisation) is that water pinch analysis tends towards full processoptimisation, which dilutes its status as a separate discipline. From a practical viewpoint, thismeans that the one cannot accept the general procedures and conclusions of the standardpinch analysis theory, and that each application needs to be evaluated on its particular merits.
It must be acknowledged that the above conclusions mostly reflect the experience of applyingthe analysis in the retrofit mode: i.e. to improving water utilisation in existing, wellestablished processes. In the case of a new design where process conditions have not yetbeen fixed, it may well be that the assumptions and approximations involved in the standardversion of pinch analysis would be quite justified in view of the uncertainties about what theprocess conditions will be.
9.1.3 Practical strategies for applying water pinch analysis
How can water pinch analysis be applied so as to circumvent its theoretical limitations andrealise its promise as far as possible? The case studies presented in this report suggest thatthere is no single answer to the question, and that an approach must be formulated accordingto the nature of the process involved.
The case study of Ceres Fruit Juices (chapter 3) demonstrated the most straightforwardapplication of water pinch analysis, as the process conformed most closely to the classicalassumptions of pinch analysis. The water involved is used for utility purposes of equipmentwashing and sterilisation and cooling (although some water is blended into the products, thiscould easily be excluded from the analysis). No wastewater treatment for qualityregeneration was practised or contemplated. Total solids was considered as the singlecontaminant representing water quality.
xiii

From this example the first strategy for applying water pinch analysis can be formulated as:
i) include only utility water streams in the analysis;ii) use a single, non-reactive contaminant to represent water quality.iii) exclude water treatment for the purpose of making it fit for reuse (treating the water to
meet discharge standards may be considered);This strategy avoids all the theoretical difficulties noted above, and allows one to use theclassical pinch analysis methodology. This comes at the potential expense of the accuracy inlocating the true optimum for the system design. Each option may be evaluated for itspossible effect:
i) Since this is a food process, risk factors would tend to preclude water reuse in anystreams which come into direct contact with the product, so excluding process streamsfrom the analysis is advisable in any case.
ii) The use of a single contaminant could make the predicted water savingsover-optimistic, in that specific contaminants might prevent the reuse of water forspecific purposes. This issue was noted in the case study, with the caution that theresults should be seen as a first assessment, with such issues requiring furtherinvestigation. The justification for using a single contaminant is not really theoretical,as the methods for using multiple contaminants are readily available, it is more aboutthe effort and expense of gathering the necessary data.
The case studies of the AECI Bioproducts Lysine Plant and the Mondi Merebank PaperMill (chapters 4 and 5) illustrate a second possible strategy. These also considered onlyutility water, excluding process from the analysis, however they deviated from the simplestrategy in several respects, thereby requiring the use of mathematical programmingsoftware. These deviations were:
i) Excluding certain connections between specific sources and specific sinks. This is notthe same as excluding a source or a sink: the source and sink involved remain in theanalysis, and a constraint is added to the optimisation problem which is of a differentkind to the concentration constraints in the standard pinch analysis.
ii) The objective function was not simply the amount of fresh water supplied, but includedcosts of water supply and effluent discharge. Although neither of these case studieshappened to involve regeneration for reuse, these factors had the same effect of movingaway from considering the thermodynamic minimum for water use.
iii) In the case of the lysine plant, multiple contaminants were considered.These examples can be taken as representing the second strategy for approaching a waterpinch analysis, in which mathematical programming is used to address all the restrictionsexcept the exclusion of process streams and chemically reactive species. These exclusionsallow the system to be modelled in terms of simple standardised elements, which makes itpossible to use a generalised software package, such as WaterTarget used in these twostudies.
The final case study of the Sasol Polymers Chlor-alkali Plant (chapter 6) accepted none ofthe restrictions noted above. While this resulted in the most rigorous approach to theproblem, it was also the most complex and time consuming. In particular for process watercontaining reacting species, individual models of each process unit had to be developedwhich adequately represented process constraints and economics, which means that thedevelopment of a generalised software solution is much more difficult. It could be arguedthat this approach is no longer really pinch analysis, but borders on full process optimisation.
xiv

Although the three approaches were applied to different case studies in this project, the aboveargument suggests that they could be used sequentially as a progressive overall approach in asingle project, in which one only moves to the next level of complexity if the results of thesimpler analysis indicate that it is justified.
9.1.4 Other considerations
There are some observations concerning the application of water pinch analysis that are notrelated to its theoretical structure:
1) The direct economic drivers for water conservation are not as great as those for energyconservation, so industries are not as easily motivated to undertake water pinch analysisas energy pinch analysis.
2) In water-scarce situations, not uncommon in South Africa, there are indirect driversrelated to the value chain of water, i.e. the economic value derived from activities whichcould not take place without a sufficient supply of water of adequate quality.
3) In such situations regulators have the responsibility of balancing the water requirementsof different users in an equitable way. The systematic and transparent methodology ofwater pinch analysis could be useful for establishing the water requirements of industrialsystems for regulatory purposes. It must be emphasised that, in its present form, it isunlikely to be useful for non-industrial systems.
9.2 Recommendations
Recommendations that can be made fall into two categories: those that concern theapplication of water pinch analysis according to the current state of the art, and those thatconcern in what directions further development of water pinch is needed .9.2.1 The application of water pinch analysis
1) A water pinch analysis of a system needs to be approached with a very clearunderstanding of the conceptual basis of the technique, its underlying assumptions, itsrange of applicability and its limitations.
2) Water pinch analysis is essential a design tool; it is useful for deciding how a water usingsystem should be configured, or perhaps reconfigured. It does not have a useful role inmanaging the operation of a water using system.
3) As the case studies of this report demonstrate, pinch analysis encompasses a range ofvariants of the technique, each with a different set of modelling assumptions, and adifferent set of strengths and weaknesses. Care should be taken to select the mostappropriate variant for a particular system, and a particular purpose. All the variantshave been developed for application to industrial systems, and are intended to optimisethe use of water in an industrial context. Any attempt to use it in a different context (forinstance, in an environmental context) should be approached with great care to evaluatethe appropriateness of its underlying assumptions.
4) A pinch analysis of a system is usually an iterative process with much uncertainty in theearly iterations. It seems logical to start with the simplest form of the analysis, in spiteof the sweeping assumptions involved; and bring in more sophisticated considerations asthey are shown to be required.
9.2.2 The further development of water pinch analysis
1) Further efforts are required to encourage wider acceptance of water pinch analysis bySouth African industry. This should be undertaken in conjunction with industry on a casestudy basis.
xv

2) Further work is needed to extend the water pinch analysis methodology to account forchemically reacting solutes and aqueous reagents.
3) Techniques for the early identification of the applicability of water pinch need to befurther developed.
4) Techniques need to be developed to reduce the time and effort required to gather the dataneeded for a water pinch analysis.
5) The use of water pinch analysis as a tool for co-regulation should be explored. This willrequire studies in which regulatory authorities are involved as partners, and thedevelopment of a a protocol for reporting the modelling assumptions and process limitsused in an analysis in a transparent and auditable way, so that it can be used withconfidence in negotiations between industrial and regulatory parties.
6) Local consultants should be encouraged to set up a water pinch analysis service toindustry.
7) The energy efficiency of a process has a significant impact on its water use for coolingand the concomitant generation of saline effluents. The simultaneous optimisation ofwater and energy use is therefore an important direction for further investigation.
10 Technology transfer
The main thrusts of this project were technology evaluation and technology transfer. Waterpinch analysis appeared in the literature as a technique that held much promise in the SouthAfrican context, and the project sought to test it on South African processes, and promote itsuse by South African industries. Any theoretical aspects arose purely in response toproblems encountered along the way. The chief modus operandi was to promote the waterpinch concept to industries, and wherever possible to recruit engineering personnel from thecompanies involved to enrol for part-time MScEng degrees, undertaking water pinch analysisstudies in their factories. Some more conventional academic projects involving full-timeMScEng students and one PhD have served to generate theoretical support for situationswhere the current techniques were not completely adequate. In all cases the projects werecentred on industrial case studies.
10.1 Industry based part time MScEng projects
The success of Thokozani Majozi’s project at Sanachem, which was undertaken during thepreceding water pinch project and presented in WRC report 851/01/03, prompted us to adoptthe idea of enrolling process engineers who wanted to further their technical studies as parttime postgraduate students on studies based at their own factories. The concept was that theproject should be related to their normal work, and should be of interest to the company, tominimise conflicting priorities between work and study time. Four projects of this kind werestarted : Gladys Naylor (née Crampton) at Mondi Merebank, Maryna Mansfield at SappiTugela, Eric Slabbert at Sappi Ngodwana and Annelie Lourens at Sasol Secunda.
The concept appeared to work well at first, with good support from the companies involved.However, it seems that the 2 to 3 year time scale for a part time MScEng is significantlylonger than the interest span of many companies. In most cases the priorities of thecompanies changed with time, and when the projects did not yield quick results, thestudents/engineers came under pressure to devote their attention to different areas which wereconsidered to be more urgent or important than improving water efficiency. At the time ofcompiling this report, only Gladys Naylor had completed, and she did so in spite of the factthat company had by then completely lost interest in water efficiency, because of the way itssupply contract with the Durban Water Recycling Scheme had been structured.
xvi

Clearly this is not a satisfactory state of affairs, and the concept needs to be rethought for thefuture. However it was successful in making the companies aware of water pinch analysisand exposing them to some of its practicalities.
A significant later outcome was that, after completing his PhD, Paolo Gianadda wasemployed by Sappi in an R&D position dealing with optimisation of their operations, whichincludes the application of pinch analysis.
10.2 Workshops and courses
A pre-conference workshop for WISA delegates was also held at the University of Natal onthe 19th of May, entitled Water Pinch Analysis: A tool for the rational management of waterand effluent in an industrial complex. It was attended by 14 persons. A similar workshopwas held at the University of Cape Town as part of WISA 2004. This was presented by ChrisBrouckaert and Duncan Fraser, and attended by 10 persons.
At WISA 2002 there was a WRC sponsored workshop on Tools for Cleaner Production, inwhich a presentation was made on Water Pinch Analysis as a Transparent Tool for theCo-regulation of Industrial Processes (BROUCKAERT, C.J., SCHNEIDER, J.,MANSFIELD, M. and BUCKLEY, C.A). This forum gave the project and the technique veryimportant exposure.
10.3 Conference presentations
The following paper was presented at The International Water Association Conference onWater and Wastewater Management for Developing Countries, Putra World Trade Centre,Kuala Lumpur, Malaysia, 29-31 October 2001, and subsequently accepted for publication inWater Science and Technology.
GIANADDA, P., BROUCKAERT, C.J., SAYER, R and BUCKLEY, C.A., The Applicationof Pinch Analysis to Water, Regent and Effluent Management in a Chlor-Alkali Facility
.t the Water Institute of Southern Africa Biennial WISA Conference and Exhibition, Durban,19-23 May 2002, the following posters and presentations were made:
LOURENS, A., The Application of Water Pinch at a Petrochemical Industry (Paper)
GIANADDA, P., BROUCKAERT, C.J., SAYER, R. and BUCKLEY, C.A., Process WaterPinch Analysis Guides Water, Reagent and Effluent Management in the Chlor-alkali Industry(Paper).
BROUCKAERT, C.J., SCHNEIDER, J., MANSFIELD, M. and BUCKLEY, C.A., WaterPinch Analysis as a Transparent Tool for the Co-regulation of Industrial Processes (Poster).
The last topic was also used as a presentation as part of a WRC sponsored workshop onTools for Cleaner Production. This forum gave the project and the technique very importantexposure.
At the International Seminar on Advanced Achievements in Pinch Technology and IndustrialResource Management for Energy Savings, Pollution Reduction and SustainableDevelopment in Africa, University of Durban-Westville, Durban, 18 - 20 November 2002 thefollowing presentations were made:
BUCKLEY, C.A., BROUCKAERT, C.J., MANSFIELD, M. And GIANADDA, P. ,Applying Water Pinch Analysis in the South African Context
GIANADDA, P., BROUCKAERT, C.J. And BUCKLEY, CA., Conceptual Developments inthe Field of Water Pinch Analysis - Selected Case Studies from the Chlor-Alkali
xvii

MANSFIELD, M., BROUCKAERT, C.J. And BUCKLEY, C.A., Water Pinch Analysis atthe Sappi Tugela Paper Mill.
BROUCKAERT, C.J., BUCKLEY, C.A., HANEKOM, D.* and WOODHOUSE, C.*,Optimal Location of a Membrane Treatment Plant in a Power Station
At the South African Chemical Engineering Congress, Chemical Engineers Competing in theGlobal Economy, Sun City, South Africa, 3-5 September 2003
GIANADDA, P., BROUCKAERT, C.J. AND BUCKLEY, C.A., The Application ofCombined Water and Materials Pinch Analysis to a Chlor-alkali Plant, (Paper)
GIANADDA, P., BROUCKAERT, C.J. And BUCKLEY, C.A., The Optimisation of anIon-exchange Demineralisation Plant Using Combined Water and Materials and PinchAnalysis (Poster)
At the Waste Management Emissions & Recycling in the Metallurgical and ChemicalProcess Industries Conference, Mintek Conference Centre, Randburg, Gauteng, SouthAfrica, 18-19 March 2004 :
BROUCKAERT, C.J., GIANADDA, P. and BUCKLEY, C.A., Process Integration for Waterand Energy Management (Paper)
10.4 Publication
GIANADDA, P., BROUCKAERT, C.J., SAYER, R. and BUCKLEY, C.A., The Applicationof Pinch Analysis to Water, Regent and Effluent Management in a Chlor-Alkali Facility,Water Science & Technology, 46 (9), pp. 21-28, October 2002, ISBN 1843394286.
xviii

ACKNOWLEDGEMENTS
The research in this report emanated from a project funded by the Water ResearchCommission and entitled :
THE FURTHER APPLICATION OF PINCH ANALYSIS FOR WATER AND EFFLUENTMANAGEMENT
The authors thank the of the Steering Committee responsible for this project for it guidance.Its membership varied during its course; the following persons were members at varioustimes:
Mr GN Steenveld Water Research Commission (Chairman)Dr G Offringa Water Research CommissionMs S Chetty Water Research Commission (Secretary)
Mr L Gravelet-Blondin Department of Water Affairs and ForestryProf D Fraser University of Cape TownProf T Zhelev University of Durban-WestvilleProf M Mulholland University of NatalProf BK Loveday University of NatalMr PJ du Toit Roux Sasol TechnologyMr T Holden UOFS, AECI/CAER CommitteeMr S Ramsuroop ML Sultan TechnikonMr R Philip Department of Water Affairs and Forestry,Mr H Touche Umbogintwini Operations Services (Pty) Ltd
The financing of the project by the Water Research Commission and the contribution of themembers of the Steering Committee is acknowledged gratefully.
This project was only possible with the co-operation of many individuals and institutions.The authors therefore wish to record their sincere thanks to the following :
Mr R Sayer Sasol Polymers, UmbogintwiniMr A Eastwood Linnhoff-MarchMr L Govender AECI Bioproducts
xix

18Contaminants3.4.2 . . . . . . . . . . . . . . . . . . . . . . . . . . . . . . . . . . . . . . . . . . . . . . . .
18Water flow rates3.4.1 . . . . . . . . . . . . . . . . . . . . . . . . . . . . . . . . . . . . . . . . . . . . . .
17Data gathering3.4 . . . . . . . . . . . . . . . . . . . . . . . . . . . . . . . . . . . . . . . . . . . . . . .
17Pre-screening at Ceres Fruit Juices3.3.3 . . . . . . . . . . . . . . . . . . . . . . . . . . . . . . .
17Pre-screening considerations for food and beverage operations3.3.2 . . . . . . . . .
16General pre-screening considerations3.3.1 . . . . . . . . . . . . . . . . . . . . . . . . . . . . .
15Pre-screening 3.3 . . . . . . . . . . . . . . . . . . . . . . . . . . . . . . . . . . . . . . . . . . . . . . .
15Methodology3.2 . . . . . . . . . . . . . . . . . . . . . . . . . . . . . . . . . . . . . . . . . . . . . . . .
15CIP3.1.7 . . . . . . . . . . . . . . . . . . . . . . . . . . . . . . . . . . . . . . . . . . . . . . . . . . . . . . . .
15Effluent treatment3.1.6 . . . . . . . . . . . . . . . . . . . . . . . . . . . . . . . . . . . . . . . . . . . .
14Filling3.1.5 . . . . . . . . . . . . . . . . . . . . . . . . . . . . . . . . . . . . . . . . . . . . . . . . . . . . . .
14Sterilisation and cleaning3.1.4 . . . . . . . . . . . . . . . . . . . . . . . . . . . . . . . . . . . . . . .
14Blending3.1.3 . . . . . . . . . . . . . . . . . . . . . . . . . . . . . . . . . . . . . . . . . . . . . . . . . . . .
14Municipal water users3.1.2 . . . . . . . . . . . . . . . . . . . . . . . . . . . . . . . . . . . . . . . . .
14Water treatment3.1.1 . . . . . . . . . . . . . . . . . . . . . . . . . . . . . . . . . . . . . . . . . . . . . .
13Process Description3.1 . . . . . . . . . . . . . . . . . . . . . . . . . . . . . . . . . . . . . . . . . . .
13CERES FRUIT JUICES 3 . . . . . . . . . . . . . . . . . . . . . . . . . . . . . . . . . .
10The WaterPinch program2.3.3 . . . . . . . . . . . . . . . . . . . . . . . . . . . . . . . . . . . . . .
8The WaterTracker program2.3.2 . . . . . . . . . . . . . . . . . . . . . . . . . . . . . . . . . . . . .
7The WaterTarget modelling framework2.3.1 . . . . . . . . . . . . . . . . . . . . . . . . . . .
6The Linnhoff-March WaterTarget software2.3 . . . . . . . . . . . . . . . . . . . . . . . .
5Utility Water Pinch Analysis and Process Water Pinch Analysis2.2 . . . . . . . .
5Outline of a Water Pinch Analysis investigation2.1 . . . . . . . . . . . . . . . . . . . . .
5METHODOLOGY 2 . . . . . . . . . . . . . . . . . . . . . . . . . . . . . . . . . . . . . . .
4Structure of the report1.4 . . . . . . . . . . . . . . . . . . . . . . . . . . . . . . . . . . . . . . . . .
3Overall course of the project1.3 . . . . . . . . . . . . . . . . . . . . . . . . . . . . . . . . . . . .
2Project Objectives1.2 . . . . . . . . . . . . . . . . . . . . . . . . . . . . . . . . . . . . . . . . . . . .
1The nature and scope of water pinch analysis1.1 . . . . . . . . . . . . . . . . . . . . . . .
1INTRODUCTION1 . . . . . . . . . . . . . . . . . . . . . . . . . . . . . . . . . . . . . . . .
TABLE OF CONTENTS
xx

32Key contaminants4.5.1 . . . . . . . . . . . . . . . . . . . . . . . . . . . . . . . . . . . . . . . . . . . .
32Water pinch model of the water-using system4.5 . . . . . . . . . . . . . . . . . . . . . .
31Cooling tower4.4.7 . . . . . . . . . . . . . . . . . . . . . . . . . . . . . . . . . . . . . . . . . . . . . . .
31Clean-in-place system4.4.6 . . . . . . . . . . . . . . . . . . . . . . . . . . . . . . . . . . . . . . . . .
31Pump seals4.4.5 . . . . . . . . . . . . . . . . . . . . . . . . . . . . . . . . . . . . . . . . . . . . . . . . . .
31PIX: adsorption and strip phase4.4.4 . . . . . . . . . . . . . . . . . . . . . . . . . . . . . . . . . .
31Condensate4.4.3 . . . . . . . . . . . . . . . . . . . . . . . . . . . . . . . . . . . . . . . . . . . . . . . . . .
31PIX: backwash effluent4.4.2 . . . . . . . . . . . . . . . . . . . . . . . . . . . . . . . . . . . . . . . .
30PIX: broth effluent4.4.1 . . . . . . . . . . . . . . . . . . . . . . . . . . . . . . . . . . . . . . . . . . . .
30Water reuse and recycle opportunities4.4 . . . . . . . . . . . . . . . . . . . . . . . . . . . . .
30Cleaning and cooling utilities and pump-seal water4.3.12 . . . . . . . . . . . . . . . . . .
30Granulation and bagging4.3.11 . . . . . . . . . . . . . . . . . . . . . . . . . . . . . . . . . . . . . . .
30Steam condensate4.3.10 . . . . . . . . . . . . . . . . . . . . . . . . . . . . . . . . . . . . . . . . . . . . .
29Ammonium sulphate evaporator4.3.9 . . . . . . . . . . . . . . . . . . . . . . . . . . . . . . . . .
29Secondary ion exchange4.3.8 . . . . . . . . . . . . . . . . . . . . . . . . . . . . . . . . . . . . . . .
29Ammonia stripper and lysine evaporator train4.3.7 . . . . . . . . . . . . . . . . . . . . . .
28Primary ion exchange4.3.6 . . . . . . . . . . . . . . . . . . . . . . . . . . . . . . . . . . . . . . . . .
27Sterilisation4.3.5 . . . . . . . . . . . . . . . . . . . . . . . . . . . . . . . . . . . . . . . . . . . . . . . . .
27Fermentation4.3.4 . . . . . . . . . . . . . . . . . . . . . . . . . . . . . . . . . . . . . . . . . . . . . . . .
27Raw materials4.3.3 . . . . . . . . . . . . . . . . . . . . . . . . . . . . . . . . . . . . . . . . . . . . . . .
27Effluent dilution from UOS4.3.2 . . . . . . . . . . . . . . . . . . . . . . . . . . . . . . . . . . . . .
27Process water4.3.1 . . . . . . . . . . . . . . . . . . . . . . . . . . . . . . . . . . . . . . . . . . . . . . . .
26Process overview4.3 . . . . . . . . . . . . . . . . . . . . . . . . . . . . . . . . . . . . . . . . . . . . .
26Aims of the investigation4.2 . . . . . . . . . . . . . . . . . . . . . . . . . . . . . . . . . . . . . . .
25Introduction4.1 . . . . . . . . . . . . . . . . . . . . . . . . . . . . . . . . . . . . . . . . . . . . . . . . .
25THE AECI BIOPRODUCTS LYSINE PLANT AT
UMBOGINTWINI4
. . . . . . . . . . . . . . . . . . . . . . . . . . . . . . . . . . . . . . . .
24Discussion and conclusions3.6 . . . . . . . . . . . . . . . . . . . . . . . . . . . . . . . . . . . . .
22Source-sink matching3.5.3 . . . . . . . . . . . . . . . . . . . . . . . . . . . . . . . . . . . . . . . . .
21Re-use restrictions 3.5.2 . . . . . . . . . . . . . . . . . . . . . . . . . . . . . . . . . . . . . . . . . . .
20Composite curve.3.5.1 . . . . . . . . . . . . . . . . . . . . . . . . . . . . . . . . . . . . . . . . . . . . .
20 Pinch analysis3.5 . . . . . . . . . . . . . . . . . . . . . . . . . . . . . . . . . . . . . . . . . . . . . . .
xxi

68Thermo-mechanical pulp mill5.3.2 . . . . . . . . . . . . . . . . . . . . . . . . . . . . . . . . . . .
66Recycled fibre plant5.3.1 . . . . . . . . . . . . . . . . . . . . . . . . . . . . . . . . . . . . . . . . . . .
66Water pinch models of the individual sections of the plant5.3 . . . . . . . . . . . .
65Water balances5.2.4 . . . . . . . . . . . . . . . . . . . . . . . . . . . . . . . . . . . . . . . . . . . . . . .
64Data gathering5.2.3 . . . . . . . . . . . . . . . . . . . . . . . . . . . . . . . . . . . . . . . . . . . . . . .
63Choice of key contaminant5.2.2 . . . . . . . . . . . . . . . . . . . . . . . . . . . . . . . . . . . . .
63Division of the mill into sections5.2.1 . . . . . . . . . . . . . . . . . . . . . . . . . . . . . . . . .
62Development of a of water pinch model for Mondi Paper5.2 . . . . . . . . . . . . .
61Paper machines5.1.3 . . . . . . . . . . . . . . . . . . . . . . . . . . . . . . . . . . . . . . . . . . . . . .
60Paper mill5.1.2 . . . . . . . . . . . . . . . . . . . . . . . . . . . . . . . . . . . . . . . . . . . . . . . . . . .
58Pulp mill5.1.1 . . . . . . . . . . . . . . . . . . . . . . . . . . . . . . . . . . . . . . . . . . . . . . . . . . . .
57Process description5.1 . . . . . . . . . . . . . . . . . . . . . . . . . . . . . . . . . . . . . . . . . . .
57THE MONDI PAPER MILL AT MEREBANK, DURBAN5 .
56Discussion and conclusions4.9 . . . . . . . . . . . . . . . . . . . . . . . . . . . . . . . . . . . . .
56Summary of results4.8.8 . . . . . . . . . . . . . . . . . . . . . . . . . . . . . . . . . . . . . . . . . . .
55Barriers to saving4.8.7 . . . . . . . . . . . . . . . . . . . . . . . . . . . . . . . . . . . . . . . . . . . . .
54Overall saving4.8.6 . . . . . . . . . . . . . . . . . . . . . . . . . . . . . . . . . . . . . . . . . . . . . . .
53Sea pipeline constraints4.8.5 . . . . . . . . . . . . . . . . . . . . . . . . . . . . . . . . . . . . . . . .
52AS evaporator condensate reuse4.8.4 . . . . . . . . . . . . . . . . . . . . . . . . . . . . . . . . .
52Scenario C4.8.3 . . . . . . . . . . . . . . . . . . . . . . . . . . . . . . . . . . . . . . . . . . . . . . . . . .
52Scenario B4.8.2 . . . . . . . . . . . . . . . . . . . . . . . . . . . . . . . . . . . . . . . . . . . . . . . . . .
51Scenario A4.8.1 . . . . . . . . . . . . . . . . . . . . . . . . . . . . . . . . . . . . . . . . . . . . . . . . . .
51Evaluation of the results4.8 . . . . . . . . . . . . . . . . . . . . . . . . . . . . . . . . . . . . . . .
45Inlet constraints4.7.2 . . . . . . . . . . . . . . . . . . . . . . . . . . . . . . . . . . . . . . . . . . . . . .
45Fresh water4.7.1 . . . . . . . . . . . . . . . . . . . . . . . . . . . . . . . . . . . . . . . . . . . . . . . . .
45Model sensitivity analysis4.7 . . . . . . . . . . . . . . . . . . . . . . . . . . . . . . . . . . . . . .
44Scenario C4.6.3 . . . . . . . . . . . . . . . . . . . . . . . . . . . . . . . . . . . . . . . . . . . . . . . . . .
42Scenario B4.6.2 . . . . . . . . . . . . . . . . . . . . . . . . . . . . . . . . . . . . . . . . . . . . . . . . . .
38Scenario A4.6.1 . . . . . . . . . . . . . . . . . . . . . . . . . . . . . . . . . . . . . . . . . . . . . . . . . .
38Water-using system model analysis4.6 . . . . . . . . . . . . . . . . . . . . . . . . . . . . . . .
35Water users4.5.3 . . . . . . . . . . . . . . . . . . . . . . . . . . . . . . . . . . . . . . . . . . . . . . . . .
33Elements of the water-using system and model assumptions4.5.2 . . . . . . . . . . .
xxii
121Practical strategies in applying water pinch analysis8.1.3 . . . . . . . . . . . . . . . . .
120Theoretical limitations encountered8.1.2 . . . . . . . . . . . . . . . . . . . . . . . . . . . . . .
119What pinch analysis promises8.1.1 . . . . . . . . . . . . . . . . . . . . . . . . . . . . . . . . . . .
119An assessment of the status of water pinch analysis theory and practice8.1 . .
119CONCLUSIONS AND RECOMMENDATIONS8 . . . . . . . . . . .
118Publication7.4 . . . . . . . . . . . . . . . . . . . . . . . . . . . . . . . . . . . . . . . . . . . . . . . . . .
117Conference presentations7.3 . . . . . . . . . . . . . . . . . . . . . . . . . . . . . . . . . . . . . . .
117Workshops and courses7.2 . . . . . . . . . . . . . . . . . . . . . . . . . . . . . . . . . . . . . . . .
116Industry based part time MScEng projects7.1 . . . . . . . . . . . . . . . . . . . . . . . . .
116TECHNOLOGY TRANSFER7 . . . . . . . . . . . . . . . . . . . . . . . . . . . . .
114Discussion and conclusions6.3 . . . . . . . . . . . . . . . . . . . . . . . . . . . . . . . . . . . . .
110Subsystem integration6.2.7 . . . . . . . . . . . . . . . . . . . . . . . . . . . . . . . . . . . . . . . . .
108The cooling circuit subsystem6.2.6 . . . . . . . . . . . . . . . . . . . . . . . . . . . . . . . . . . .
92Subsystem modelling6.2.5 . . . . . . . . . . . . . . . . . . . . . . . . . . . . . . . . . . . . . . . . . .
90Division of the complex into sections6.2.4 . . . . . . . . . . . . . . . . . . . . . . . . . . . . .
89Species selection6.2.3 . . . . . . . . . . . . . . . . . . . . . . . . . . . . . . . . . . . . . . . . . . . . .
88Model formulation for combined water and materials pinch analysis6.2.2 . . . .
87Problem statement for Combined Water and Materials Pinch Analysis6.2.1 . . .
86Theoretical considerations6.2 . . . . . . . . . . . . . . . . . . . . . . . . . . . . . . . . . . . . . .
85Miscellaneous operations6.1.6 . . . . . . . . . . . . . . . . . . . . . . . . . . . . . . . . . . . . . .
85The demineralisation plant6.1.5 . . . . . . . . . . . . . . . . . . . . . . . . . . . . . . . . . . . . .
84The Hydecat destruction plant6.1.4 . . . . . . . . . . . . . . . . . . . . . . . . . . . . . . . . . . .
84The sodium hypochlorite synthesis plant.6.1.3 . . . . . . . . . . . . . . . . . . . . . . . . . .
84The hydrochloric acid synthesis plant6.1.2 . . . . . . . . . . . . . . . . . . . . . . . . . . . . .
81The brine circuit6.1.1 . . . . . . . . . . . . . . . . . . . . . . . . . . . . . . . . . . . . . . . . . . . . . .
80Description of the complex6.1 . . . . . . . . . . . . . . . . . . . . . . . . . . . . . . . . . . . . .
80THE SASOL POLYMERS CHLOR-ALKALI COMPLEX
AT UMBOGINTWINI6
. . . . . . . . . . . . . . . . . . . . . . . . . . . . . . . . . . . .
78Discussion and conclusions5.5 . . . . . . . . . . . . . . . . . . . . . . . . . . . . . . . . . . . . .
71Water pinch analysis of the combined newsprint circuit5.4 . . . . . . . . . . . . . . .
71Paper machines5.3.3 . . . . . . . . . . . . . . . . . . . . . . . . . . . . . . . . . . . . . . . . . . . . . .
xxiii

125REFERENCES9 . . . . . . . . . . . . . . . . . . . . . . . . . . . . . . . . . . . . . . . . . . .
123Further development of pinch analysis8.2.2 . . . . . . . . . . . . . . . . . . . . . . . . . . . .
123The application of water pinch analysis8.2.1 . . . . . . . . . . . . . . . . . . . . . . . . . . .
123Recommendations8.2 . . . . . . . . . . . . . . . . . . . . . . . . . . . . . . . . . . . . . . . . . . . .
122Other considerations8.1.4 . . . . . . . . . . . . . . . . . . . . . . . . . . . . . . . . . . . . . . . . . .
xxiv

43Inlet (a) and outlet (b) sensitivity values for Scenario B.4.7 . . . . . . . . . . . . .
43Configuration of the water-using system with pure AS evaporatorcondensate (Scenario B)4.6 . . . . . . . . . . . . . . . . . . . . . . . . . . . . . . . . . . . . . .
42Inlet (a) and outlet (b) sensitivity values for Scenario A.4.5 . . . . . . . . . . . . .
41Configuration of the optimised water-using network for Scenario A.4.4 . . .
35Base-case model configuration for the AECI Bioproducts system.4.3 . . . . .
34The set of water-using operations used for the water pinch model4.2 . . . . . .
26Flow sheet outlining water and raw material distribution, and processstreams in the manufacture of l-lysine at AECI Bioproducts4.1 . . . . . . . . . .
25THE AECI BIOPRODUCTS LYSINE PLANT AT
UMBOGINTWINI4
. . . . . . . . . . . . . . . . . . . . . . . . . . . . . . . . . . . . . . .
23
Comparison of the existing water allocation configuration (a) at CeresFruit Juices with the integrated configuration resulting from the pinchanalysis (b).
3.6. . . . . . . . . . . . . . . . . . . . . . . . . . . . . . . . . . . . . . . . . . . . . . . .
23Source-sink map for Ceres Fruit Juices.3.5 . . . . . . . . . . . . . . . . . . . . . . . . . .
22Connectivity matrix showing allowed and disallowed reuse options3.4 . . . .
21The composite curves for Ceres Fruit Juices3.3 . . . . . . . . . . . . . . . . . . . . . . .
16Connectivity matrix for a general water using process 3.2 . . . . . . . . . . . . . .
13The water distribution network at Ceres Fruit Juices3.1 . . . . . . . . . . . . . . . .
13CERES FRUIT JUICES 3 . . . . . . . . . . . . . . . . . . . . . . . . . . . . . . . . .
10Process (a) and utility (b) unit operation models.2.4 . . . . . . . . . . . . . . . . . . .
9Illustration of feasible (a) and infeasible (b) related measuredinformation.2.3 . . . . . . . . . . . . . . . . . . . . . . . . . . . . . . . . . . . . . . . . . . . . . . . .
8A conceptual view of an industrial water-using system (a). Processes (b)and treatment / regeneration (c) unit operations. The dashed inlet andoutlet line in (b) denotes the process stream.
2.2. . . . . . . . . . . . . . . . . . . . . . .
7Outline of a water pinch investigation carried out using WaterTarget2.1 . . .
5METHODOLOGY 2 . . . . . . . . . . . . . . . . . . . . . . . . . . . . . . . . . . . . . .
2Water minimisation through (a) reuse, (b) regeneration reuse, and (c)regeneration recycling (Smith, 1995)1.1 . . . . . . . . . . . . . . . . . . . . . . . . . . . .
1INTRODUCTION1 . . . . . . . . . . . . . . . . . . . . . . . . . . . . . . . . . . . . . . .
TABLE OF FIGURES
xxv

72Newsprint circuit5.10 . . . . . . . . . . . . . . . . . . . . . . . . . . . . . . . . . . . . . . . . . . . .
71Representation of a paper machine for the water pinch analysis5.9 . . . . . . .
69Representation of the TMP mill for the water pinch analysis5.8 . . . . . . . . . .
69Grouping of equipment in the TMP mill.5.7 . . . . . . . . . . . . . . . . . . . . . . . . .
67Representation of the Recycled Fibre Plant for the water pinch analysis5.6 .
65Recycled fibre plant functional units. The bold arrows represent processstreams which were excluded from the pinch analysis.
5.5. . . . . . . . . . . . . . .
63Division of the mill into sections5.4 . . . . . . . . . . . . . . . . . . . . . . . . . . . . . . . .
62Block diagram of a paper machine5.3 . . . . . . . . . . . . . . . . . . . . . . . . . . . . . .
60Slushing of baled pulp5.2 . . . . . . . . . . . . . . . . . . . . . . . . . . . . . . . . . . . . . . . .
58Principle of refining5.1 . . . . . . . . . . . . . . . . . . . . . . . . . . . . . . . . . . . . . . . . . .
57THE MONDI PAPER MILL AT MEREBANK, DURBAN5
54Comparison of the optimal design cost with the current water-usingnetwork operating cost.4.21 . . . . . . . . . . . . . . . . . . . . . . . . . . . . . . . . . . . . . . .
53AS evaporator condensate reuse flowrate as a function of outletconcentration of SS.4.20 . . . . . . . . . . . . . . . . . . . . . . . . . . . . . . . . . . . . . . . . . .
51Sensitivity of reuse flowrate to AS evaporator condensate SSconcentration.4.19 . . . . . . . . . . . . . . . . . . . . . . . . . . . . . . . . . . . . . . . . . . . . . .
50Sensitivity of the objective cost to AS evaporator condensate SSconcentration.4.18 . . . . . . . . . . . . . . . . . . . . . . . . . . . . . . . . . . . . . . . . . . . . . .
49
Configuration of the water-using system with the FSA concentrationconstraint in the sea pipeline relaxed to 5000ppm and SSunconstrained.(Scenario A).
4.17. . . . . . . . . . . . . . . . . . . . . . . . . . . . . . . . . . .
49Sensitivity of the design to FSA concentration in the sea pipeline (interms of freshwater and effluent flowrate).4.16 . . . . . . . . . . . . . . . . . . . . . . . .
48SS mass-flowrate as a function of the FSA constraint in the sea pipeline.4.15
48Objective cost sensitivity to FSA concentration in the sea pipeline.4.14 . . . .
47FSA concentration in the sea pipeline as a function SS mass-flowrate.4.13 . .
47Objective cost sensitivity to SS concentration in the sea pipeline.4.12 . . . . . .
46Overall freshwater flowrate as a function of SS inlet concentrationconstraint to the PIX backwash.4.11 . . . . . . . . . . . . . . . . . . . . . . . . . . . . . . . .
46Sensitivity of the objective cost to relaxation of the inlet SS constraint tothe PIX backwash.4.10 . . . . . . . . . . . . . . . . . . . . . . . . . . . . . . . . . . . . . . . . . . .
45Sensitivity of the optimum objective function to freshwater costs.4.9 . . . . .
44Configuration of the water-using system with the AS evaporatorcondensate reuse prohibited (Scenario C).4.8 . . . . . . . . . . . . . . . . . . . . . . . .
xxvi

114Schematic diagram showing the distribution of water and collection ofeffluent from the subsystems of the chlor-alkali complex in its proposedoptimal configuration
6.12. . . . . . . . . . . . . . . . . . . . . . . . . . . . . . . . . . . . . . . .
109The optimised network configuration for the cooling circuit subsystem6.11 .
103The brine circuit model process modules6.10 . . . . . . . . . . . . . . . . . . . . . . . . .
102The chemical production subsystem and its existing interactions with thedemineralisation plant subsystem.6.9 . . . . . . . . . . . . . . . . . . . . . . . . . . . . . . .
100Diagram showing the optimal network configuration for thedemineralisation plant subsystem6.8 . . . . . . . . . . . . . . . . . . . . . . . . . . . . . . .
99Diagram showing the integration of the demineralisation plant processmodule with the external sources and terminal sinks present in thesuperstructure
6.7. . . . . . . . . . . . . . . . . . . . . . . . . . . . . . . . . . . . . . . . . . . . . . .
97The model for the demineralisation plant module6.6 . . . . . . . . . . . . . . . . . . .
93The various stages of operation of the demineralisation plant6.5 . . . . . . . . .
92The interactions between the three subsystems of the complex.6.4 . . . . . . . .
89An example of a superstructure for a simple process with three units6.3 . . .
81Schematic diagram of the brine circuit6.2 . . . . . . . . . . . . . . . . . . . . . . . . . . .
80Schematic diagram of the Sasol Polymers chlor-alkali complex6.1 . . . . . . .
80THE SASOL POLYMERS CHLOR-ALKALI COMPLEX
AT UMBOGINTWINI6
. . . . . . . . . . . . . . . . . . . . . . . . . . . . . . . . . . .
77Flow of water streams between sections of the newsprint circuit in theoptimised model5.13 . . . . . . . . . . . . . . . . . . . . . . . . . . . . . . . . . . . . . . . . . . . . .
77Flow of water streams between sections of the newsprint circuit in thecurrent plant configuration5.12 . . . . . . . . . . . . . . . . . . . . . . . . . . . . . . . . . . . .
73The newsprint circuit as represented in the water pinch analysis5.11 . . . . . . .
xxvii

75Constraints for process sinks5.6 . . . . . . . . . . . . . . . . . . . . . . . . . . . . . . . . . . .
70Flow and fibre constraints for process sinks in the TMP plant5.5 . . . . . . . . .
70Process source flowrates and fibre content in the TMP mill5.4 . . . . . . . . . . .
68Flow and fibre constraints for process sinks in the Recycled Fibre Plant5.3 .
67Utility source flowrates and fibre content in the Recycled Fibre Plant5.2 . . .
66Function of each process unit in the recycled fibre plant5.1 . . . . . . . . . . . . .
57THE MONDI PAPER MILL AT MEREBANK, DURBAN5
56Summary of economic and freshwater savings at AECI Bioproducts4.12 . . .
42Conditions for the AS evaporator (Scenario B)4.11 . . . . . . . . . . . . . . . . . . . . .41
Matrix of inter-operation flows for the configuration of the Scenario Awater system4.10 . . . . . . . . . . . . . . . . . . . . . . . . . . . . . . . . . . . . . . . . . . . . . . .
40
Inlet and outlet flowrate and maximum inlet and outlet concentrationconstraints (Scenario A)4.9 . . . . . . . . . . . . . . . . . . . . . . . . . . . . . . . . . . . . . .
39Sea pipeline discharge constraints (Scenario A)4.8 . . . . . . . . . . . . . . . . . . . .
39Conditions for the AS evaporator (Scenario A)4.7 . . . . . . . . . . . . . . . . . . . .
38Matrix of existing capacities, and allowed and prohibited flows forScenario A4.6 . . . . . . . . . . . . . . . . . . . . . . . . . . . . . . . . . . . . . . . . . . . . . . . . .
37Cost parameters used in the analysis4.5 . . . . . . . . . . . . . . . . . . . . . . . . . . . . .
37Approximate positions of the operations at AECI Bioproducts4.4 . . . . . . . .
37Flow rates and concentrations of water sources4.3 . . . . . . . . . . . . . . . . . . . .
36Mass loading relationships and flowrates for the water-using operations4.2
36Inter-operation flowrates for base-case configuration4.1 . . . . . . . . . . . . . . . .
25
THE AECI BIOPRODUCTS LYSINE PLANT AT
UMBOGINTWINI4
. . . . . . . . . . . . . . . . . . . . . . . . . . . . . . . . . . . . . . .
20 Total solids data for Ceres Fruit Juices3.2 . . . . . . . . . . . . . . . . . . . . . . . . . .
18Flowrate data for Ceres Fruit Juices3.1 . . . . . . . . . . . . . . . . . . . . . . . . . . . . .
13CERES FRUIT JUICES 3 . . . . . . . . . . . . . . . . . . . . . . . . . . . . . . . . .
TABLE OF TABLES
xxviii

115Comparison of potential savings achieved by Utility Water PinchAnalysis and Combined Water and Materials Pinch Analysis6.10 . . . . . . . . .
113Comparison between the total consumption of materials and wastegenerated across all subsystems of the chlor-alkali complex in its existingnetwork configuration and the optimal network configuration
6.9. . . . . . . . .
112Comparison of materials used and waste generated by the chlor-alkalicomplex in its existing network configuration and the optimal networkconfiguration
6.8. . . . . . . . . . . . . . . . . . . . . . . . . . . . . . . . . . . . . . . . . . . . . . .
109Comparison of the water requirement and effluent production associatedwith the existing network configuration and the optimal networkconfiguration for the cooling circuit subsystem
6.7. . . . . . . . . . . . . . . . . . . .
107Comparison of the water and material requirements and effluentproduction associated with the existing network configuration and theoptimal network configuration for the chemical production subsystem
6.6. .
100Comparison of water and material requirements and effluent productionassociated with the existing network configuration and the optimisednetwork configuration
6.5. . . . . . . . . . . . . . . . . . . . . . . . . . . . . . . . . . . . . . . .
98The building blocks of the demineralisation plant module.6.4 . . . . . . . . . . .
96The connectivity matrix between external sources and sinks for thedemineralisation plant subsystem6.3 . . . . . . . . . . . . . . . . . . . . . . . . . . . . . . .
95The connectivity matrix between process sources and sinks for thedemineralisation plant subsystem6.2 . . . . . . . . . . . . . . . . . . . . . . . . . . . . . . .
90Species considered in the combined water and materials pinch analysis6.1 .
80THE SASOL POLYMERS CHLOR-ALKALI COMPLEX
AT UMBOGINTWINI6
. . . . . . . . . . . . . . . . . . . . . . . . . . . . . . . . . . .
xxix

Umbogintwini Operating ServicesUOS
Southern Wastewater Treatment Plant (in Durban)SWW
Suspended solidsSS
Secondary ion exchangeSIX
Recycled fibre plantRFP
Recycled fibreRF
Parts per millionppm
Paper machinePM
Primary ion exchangePIX
High densityHD
Free and saline ammoniaFSA
Department of Water Affairs and ForestryDWAF
Chemical oxygen demandCOD
Ceres Fruit JuicesCFJ
Clean-in-placeCIP
Ammonium sulphateAS
ABBREVIATIONS
xxx

1 INTRODUCTION
This report is a sequel to WRC Report No. 851/1/03 entitled The Application of PinchAnalysis for the Rational Management of Water and Effluent in an Industrial Complex. Theearlier report set out the basis and methodology, together with some practical guidelines, forapplying water pinch analysis to an industrial system, and presented some case studies aspractical examples. This report is mostly concerned with further case studies which had notbeen completed at the time of the previous report. However these case studies do reflectsome development in theoretical understanding which occurred during the interveningperiod. Thus the two reports are complementary to one another, and should be consideredtogether. In particular, the literature survey and general theoretical background to water pinchanalysis are contained in the previous report, while this report starts to address some issueswhich were raised in the previous report.
While the reader is referred to the earlier report for a fuller discussion, a brief introduction tothe nature and scope of water pinch analysis is repeated here.
1.1 The nature and scope of water pinch analysis
Industrial processes usually require water with a range of qualities, and produce severaleffluents with a range of qualities, which allow the possibility of a hierarchical use of water.
Possible strategies for reducing the consumption of fresh water and the production ofwastewater include:
reuse: wastewater from one process can be directly reused in others,provided the level of contamination is sufficiently low to meet therequirements of the subsequent processes;regenerative reuse: wastewater can be treated to reduce the levels of
contaminants before being reused in other processes. In this option, the wateris not recycled to the process from it came;regenerative recycling: after regeneration, water can be recycled to the
process from which it came. This is generally more difficult than reuse,because recycling tends to build up contaminants.
Pinch analysis is a process integration tool, which was first developed for the design of heatrecovery systems during the late 1970s. Using the analogies between heat and mass-transfer,a similar approach was developed for the design of mass-exchange systems (El-Halwagi,1995). This work formed the basis for the design of water-using systems that conform to theusage patterns envisaged by Smith (1995) and illustrated in Figure 1.1. It took the designobjective to be to minimise water consumption by maximising the reuse of water, using agraphical technique (Wang and Smith, 1994) which was termed Water Pinch Analysis(Buehner and Rossiter, 1996). However the technique was difficult (although possible) toextend to accommodate the practical constraints and characteristics of water-using systems,such as multiple contaminants, flow rate constraints, piping costs, etc. The added desire tointroduce cost optimisation required that the problem be formulated using mathematicalprogramming techniques (Doyle and Smith, 1997).
Water Pinch Analysis thus involves a set of systematic formal techniques to handle thecomplex problem of hierarchical water allocation to a system consisting of a number ofprocesses, and choosing the best combination of strategies. The theory that appears in the
1

literature is still developing. The practical application of this theory is not as well establishedin the open literature, and particularly not in a South African context.
PROCESS 1
PROCESS 2
PROCESS 3
FRES HWATER
WASTEWATER
PROCESS 1
PROCESS 2
PROCESS 3
FRES HWATER
WASTEWATERREGENERATE
PROCESS 1
PROCESS 2
PROCESS 3
FRES HWATER
WASTEWATERREGENERATE
(a)
(b)
(c)
Figure 1.1: Water minimisation through (a) reuse, (b) regeneration reuse, and (c) regeneration recycling (Smith, 1995)
1.2 Project Objectives
As originally stated, the project objectives were:
to promote the wide spread application of pinch analysis for the managementof water and effluents; to develop the technique for the specific problems associated with South
African industry; to promote better water management by undertaking pinch analysis studies
at selected sites; to enhance the capacity within South Africa to undertake pinch analysis
studies and to promote the wider understanding of the technique withineducational institutions, industry and government by training people in thetechnique.
These objectives were pursued chiefly through undertaking case studies at a number offactories. Some of these were carried out by full time students at the University of Natal,whereas a number involved part-time students who were also working as engineers at thefactories which were the subjects of study. Chapter 4 concerning the Mondi Merebank PaperMill is based on one of these part-time student projects.
2
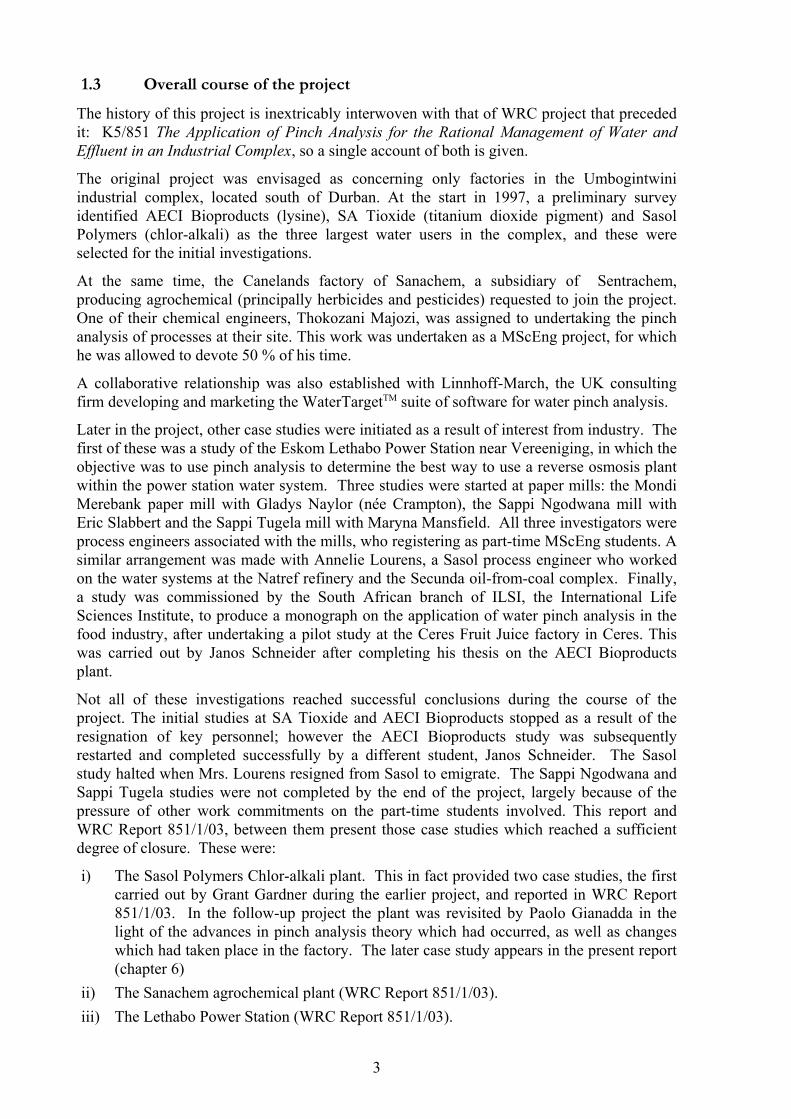
1.3 Overall course of the project
The history of this project is inextricably interwoven with that of WRC project that precededit: K5/851 The Application of Pinch Analysis for the Rational Management of Water andEffluent in an Industrial Complex, so a single account of both is given.
The original project was envisaged as concerning only factories in the Umbogintwiniindustrial complex, located south of Durban. At the start in 1997, a preliminary surveyidentified AECI Bioproducts (lysine), SA Tioxide (titanium dioxide pigment) and SasolPolymers (chlor-alkali) as the three largest water users in the complex, and these wereselected for the initial investigations.
At the same time, the Canelands factory of Sanachem, a subsidiary of Sentrachem,producing agrochemical (principally herbicides and pesticides) requested to join the project.One of their chemical engineers, Thokozani Majozi, was assigned to undertaking the pinchanalysis of processes at their site. This work was undertaken as a MScEng project, for whichhe was allowed to devote 50 % of his time.
A collaborative relationship was also established with Linnhoff-March, the UK consultingfirm developing and marketing the WaterTargetTM suite of software for water pinch analysis.
Later in the project, other case studies were initiated as a result of interest from industry. Thefirst of these was a study of the Eskom Lethabo Power Station near Vereeniging, in which theobjective was to use pinch analysis to determine the best way to use a reverse osmosis plantwithin the power station water system. Three studies were started at paper mills: the MondiMerebank paper mill with Gladys Naylor (née Crampton), the Sappi Ngodwana mill withEric Slabbert and the Sappi Tugela mill with Maryna Mansfield. All three investigators wereprocess engineers associated with the mills, who registering as part-time MScEng students. Asimilar arrangement was made with Annelie Lourens, a Sasol process engineer who workedon the water systems at the Natref refinery and the Secunda oil-from-coal complex. Finally,a study was commissioned by the South African branch of ILSI, the International LifeSciences Institute, to produce a monograph on the application of water pinch analysis in thefood industry, after undertaking a pilot study at the Ceres Fruit Juice factory in Ceres. Thiswas carried out by Janos Schneider after completing his thesis on the AECI Bioproductsplant.
Not all of these investigations reached successful conclusions during the course of theproject. The initial studies at SA Tioxide and AECI Bioproducts stopped as a result of theresignation of key personnel; however the AECI Bioproducts study was subsequentlyrestarted and completed successfully by a different student, Janos Schneider. The Sasolstudy halted when Mrs. Lourens resigned from Sasol to emigrate. The Sappi Ngodwana andSappi Tugela studies were not completed by the end of the project, largely because of thepressure of other work commitments on the part-time students involved. This report andWRC Report 851/1/03, between them present those case studies which reached a sufficientdegree of closure. These were:
i) The Sasol Polymers Chlor-alkali plant. This in fact provided two case studies, the firstcarried out by Grant Gardner during the earlier project, and reported in WRC Report851/1/03. In the follow-up project the plant was revisited by Paolo Gianadda in thelight of the advances in pinch analysis theory which had occurred, as well as changeswhich had taken place in the factory. The later case study appears in the present report(chapter 6)
ii) The Sanachem agrochemical plant (WRC Report 851/1/03).iii) The Lethabo Power Station (WRC Report 851/1/03).
3

iv) The Ceres Fruit Juice factory (chapter 3 of this report).v) The AECI Bioproducts Lysine plant (chapter 4 of this report).vi) The Mondi Merebank paper mill (chapter 5 of this report).
Although the other case studies do not appear explicitly in the reports, they are representedimplicitly in that they provided valuable experience which contributed greatly to the generalunderstanding of pinch analysis, which in turn influenced the more successful projects.
1.4 Structure of the report
The principal matter of this report is contained in the four case studies, which present pinchanalyses applied to different factories, involving widely varying circumstances. The factorieswere Ceres Fruit Juices, (chapter 3), the AECI Bioproducts lysine plant (chapter 4), theMondi Merebank paper mill (chapter 5) and the Sasol Polymers chlor-alkali plant (chapter 6).Each of these case studies has its own discussion and conclusions related to issues specific tothe system involved. These are preceded by chapter 2 devoted to those aspects of themethodology which were common to the investigations. In particular, it describes theLinnhoff-March WaterTarget software which was the principal tool used for the lysine plantand the paper mill, and which was also used in a subsidiary role for the chlor-alkali plant.Chapter 7 presents activities which aimed to promote water pinch analysis to industry duringthe course of the project. The conclusions and recommendations of chapter 8 concern issueswhich emerge from considering the various case studies together, and the overall experienceof applying water pinch analysis to South African industries.
4

2 METHODOLOGY
The chief modus operandi of this project was to promote the water pinch concept toindustries, and wherever possible to recruit engineering personnel from the companiesinvolved to enrol for part-time MScEng degrees, undertaking water pinch analysis studies intheir factories. Two conventional academic projects involving full-time students served togenerate theoretical support for situations where the current techniques are not completelyadequate. In all cases the projects centred around industrial case studies. Chapters 3, 4, 5 and6 present the four major case studies which were completed during the project.
During the project a relationship was established with the British company Linnhoff-March,which has been associated with the development of both thermal and water pinch analysis.The WaterTarget® suite of software from Linnhoff-March was used for several of the studies,(in particular those of chapter 4 and 5) and this chapter is largely devoted to explaining themodelling framework which the software provides. The Linnhoff-March software is aimed atthe analysis of systems in which water is used only as a utility to a process, and is not anintrinsic part of the core process technology. The combined water and materials pinchanalysis of chapter 6 requires a different framework, which is developed and explained inchapter 6.
2.1 Outline of a Water Pinch Analysis investigation
As outlined in WRC Report No. 851/1/03, a water pinch investigation consists of severalsteps that are required to create a satisfactory design, as follows:
i) Determine the water-using network.ii) Undertake a pre-screening or rapid-scoping exercise to identify the parts of the
network which should be included in the analysis. iii) Establish flowrate and concentration data (measured data) and mass balance data
(model data) for sources, water-using operations and discharge points.iv) Reconcile the data to establish a consistent mass balance for the water-using system so
that inlet and outlet conditions for water-using operations are known.v) Simplify the network to exclude process streams that do not offer any scope for
integration.vi) Determine the optimal design assuming current operating conditions are limiting.vii) Establish sensitive operations close to the pinch that offer further scope for saving by
relaxation of constraints or by regeneration of streams.viii) Return to step v) to determine the new design with the changed constraints and outlet
conditions. Continue with step vi) if any capacity remains for relaxation orregeneration.
ix) Check suitability of design e.g. by simulation.x) Implement design if economically feasible.
The Linnhoff-March WaterTarget® suite provides software tools to assist in these tasks.
2.2 Utility Water Pinch Analysis and Process Water Pinch Analysis
Up to now, the literature on water pinch analysis has focused on problems where mass loadsof contaminants are removed from process streams by water streams (Wang and Smith,1994;Doyle and Smith 1997). Accordingly, the factor which limits the reuse of this water is the
5

presence of these contaminants in the water. Inherent in this approach, a number ofassumptions are apparent - these are that:
a clear distinction can be made between water streams and process streams;water behaves as a utility in the process system; and contaminants are exclusively undesirable
With the distinction being made between the process streams and water streams, only thewater side of the problem is considered in the pinch analysis. The process-side of theproblem is represented simply as contaminant mass loads with contaminant concentrationlimits applied to the water streams (to take the place of the equilibrium and kineticrelationships that govern the mass-exchange between these process streams and the waterstreams).
The distinction made between process streams and water streams in the pinch analysisformulation is more precisely a distinction between process streams and utility-water streams.It often happens that some of the process streams are also water streams. Making thedistinction between process streams and water streams in the usual manner therefore resultsin some of the streams involving water being excluded from the analysis. In addition, someof the dissolved species present in the process-water streams may not be undesirablecontaminants, but instead necessary elements of the process technology.
To properly optimise the use of water in such systems requires an approach which considersboth the process-water streams and the utility-water streams. Given that the presenttechniques and tools only consider the utility-side of the problem, we coined the termsutility-water pinch analysis for the situation where only utility streams are considered, andprocess-water pinch analysis where process-water streams are also included. Process-waterpinch analysis is a superset of utility-water pinch analysis since utility-water streams are alsoincluded in the analysis.
The practical problem facing an investigator is that process-water pinch analysis is a largelyundeveloped field, whereas proven techniques are available for utility-water pinch analysis.In many cases the pragmatic approach is to limit the analysis to utility-water, and accept thatthe result will not be a fully optimal solution. On the other hand, there are industrialprocesses where this limitation severely restricts what can be achieved.
The following section describes the commercial software package that was used in several ofthe case studies of this report for utility-water pinch analysis.
2.3 The Linnhoff-March WaterTarget software
The Linnhoff-March WaterTarget software consists of two programs, WaterTracker, for datagathering and reconciliation, and WaterPinch for determining optimal water network designsand analysis of sensitive operations. Figure 2.1 is a flowchart illustrating how a water pinchanalysis might be undertaken using this software.
6

Connectivity data
Select parameter:Flowrate / concentration
Metering analysis
Data plan
Reconcile and balance
Uncertainty > 0
Export to WaterPinch
NO
YES
Input data
Import from WaterTracker
Set costs
Source / sink elimination
Set mass-loading propertiesfor unit operations
Set geographical positions
Feasibleconnectivity
Set connectivity bounds
NO
YES
Set environmental constraints
Optimise
Sensitivity Analysis
Implement strategyif feasible
Relaxconstraints
NO
YES
Set new limits /change concentrations
Dat
a tra
nsfe
r fro
mW
ater
Trac
ker t
o W
ater
Pin
ch
Figure 2.1: Outline of a water pinch investigation carried out using WaterTarget
2.3.1 The WaterTarget modelling framework
The water-using system (figure 2.2 (a)) consists of various nodes, which may be classified asfollows:
Sources: inlets to the water-using system.Sinks: outlets from the water-using system.Operations: Unit operations that use water and affect the mass-flow of
contaminant within the overall system. The water-using operations may besubdivided into two groups:
7

Water-using subsystem: typically operations that have fixed water demands andsupplies. Operations within the water-using subsystem typically add contaminant massto the system via mass-transfer from a process stream (figure 2.2 (b)).Wastewater treating system: typically operations that treat or regenerate effluentarising from the water-using subsystem. Operations within the wastewater treatingsystem typically remove contaminant mass from the overall system (figure 2.2 (c)).
Streams: Connections between nodes that represent material flow from onenode to another.
WATER
USING
SUBSYSTEM
WASTEWATER
TREATING
SUBSYSTEM
DISCHARGEFRESH WATER
NON-TREATED WATER
TREATED WATER
(b) Element of water-using subsystem (c) Element of w ater treating subsystem
(a) Water-using system
Process Stream
FTi
Water Stream
Mass TransferWastewater
Stream
Regen. / Treated Stream
Mass removal,Coutic,Coutic
CecCec
,Cinic ,Cinic
CinprocessCinprocess
F iniF iniFout
iFouti
CoutprocessCoutprocess
FoutiFouti
,Cinic ,Cinic FT
,Coutic,Coutic
Figure 2.2 : A conceptual view of an industrial water-using system (a). Processes (b)and treatment / regeneration (c) unit operations. The dashed inlet and outlet line in (b)denotes the process stream.
Sources and sinks form the boundary of the water-using system, i.e.. other water-usingoperations may exist outside of this boundary, but are not considered as part of the analysis.
2.3.2 The WaterTracker program
WaterTracker assists with the tasks involved in gathering a consistent, mass-balanced data setfrom a water using plant
2.3.2.1 Types of Data
A set of measured flowrate and contaminant concentration data is termed measurementinformation. Besides measurement information, numerical model information may be used.The following information is designated as model information:
split fractions,flowrate and concentration mass balance relationships,specification of contaminant gains and losses andhardware constraints, such as physical limits on flowrates, maximum allowed
inlet concentrations, etc.
8

2.3.2.2 Metering Analysis
In WaterTracker, all numerical data is optional. One of the main functions of the software isto assist with choosing which data items to enter. Initially, a valid network structure may beanalysed without any numerical data. The software guides the user towards a reliable waterbalance by suggesting where in structure the most strategic measurement information (streamflowrates and concentrations) required.
The software will not suggest entry of model information during metering analysis. It will,however, take all the model information into account when selecting the most strategic nextpiece of measurement information.
2.3.2.3 Data Entry and Reconciliation
For each stream, measurement information is entered and a range of uncertainty is specifiedin terms of a minimum and maximum value. When the range is not explicitly known, adefault range of 2, 5 or 25 % may be specified, depending on the users' confidence as to theaccuracy of the measurement information.
Before data reconciliation, the software checks the data for conflicts. Data conflicts ariselargely due to the following two reasons:
Measurement information contradicts model information. For example, amass balance relationship linking an operation outlet parameter to an inletparameter should not be simultaneously specified with a measured inlet andoutlet parameter for the same operation.A discontinuity exists between two determinations of a parameter (such as
the directly measured value and a value determined by material balance fromother measurements in the network), i.e.. a region of agreement cannot beidentified within the ranges of related determinations. This type ofdiscrepancy is illustrated in figure 2.3, below. Figure 2.3 (a) illustrates thecase where the ranges of possible values according to the two determinationsoverlap. However, a discrepancy is reported when there is a gap between theranges (figure 2.3 (b)).
(a) (b)
Flow (t/h)
1 2
Min,1
Mean,1Min, 2Max,1 Mean,2
Max, 2
Flow (t/h)
Feasible range
Max, 2
Max,1
Min, 2
Min,1
Mean,1
Mean,2
1 2
Discontinuity
Determination Determination
Figure 2.3 : Illustration of feasible (a) and infeasible (b) related measuredinformation.
Data reconciliation determines a set of ‘corrected measurements’ that the best fits themeasurement information within the ranges between the specified minimum and maximum
9
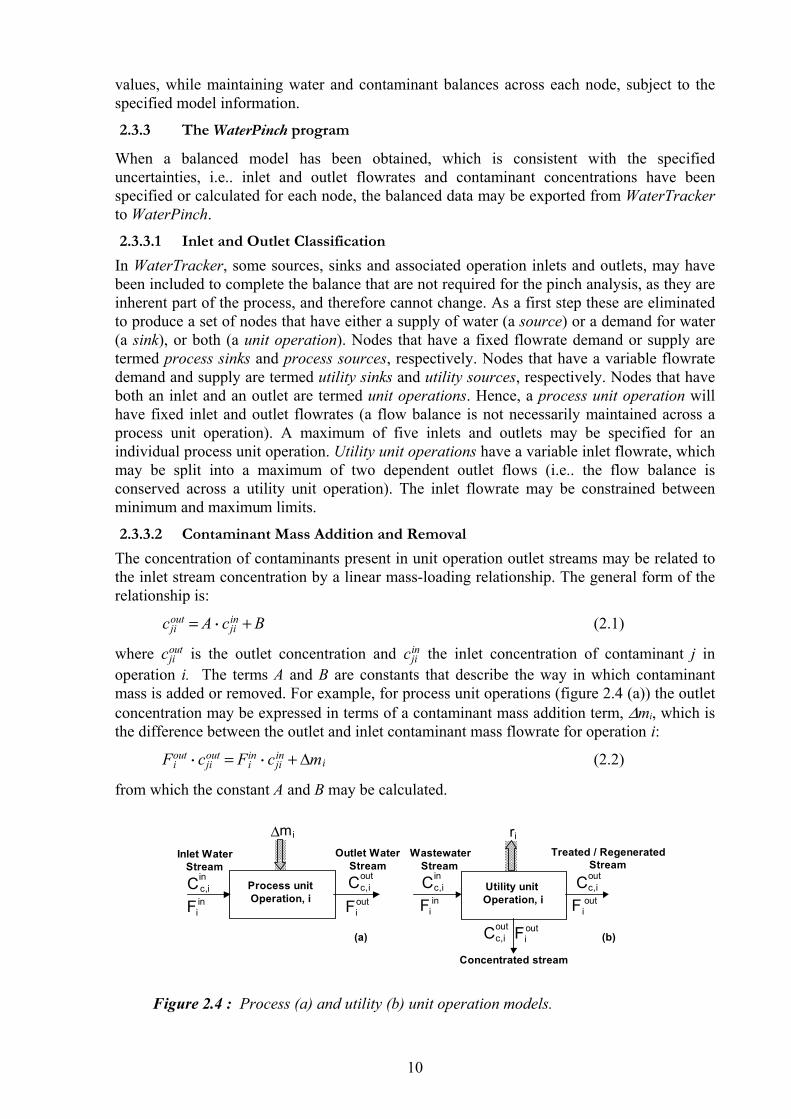
values, while maintaining water and contaminant balances across each node, subject to thespecified model information.
2.3.3 The WaterPinch program
When a balanced model has been obtained, which is consistent with the specifieduncertainties, i.e.. inlet and outlet flowrates and contaminant concentrations have beenspecified or calculated for each node, the balanced data may be exported from WaterTrackerto WaterPinch.
2.3.3.1 Inlet and Outlet Classification
In WaterTracker, some sources, sinks and associated operation inlets and outlets, may havebeen included to complete the balance that are not required for the pinch analysis, as they areinherent part of the process, and therefore cannot change. As a first step these are eliminatedto produce a set of nodes that have either a supply of water (a source) or a demand for water(a sink), or both (a unit operation). Nodes that have a fixed flowrate demand or supply aretermed process sinks and process sources, respectively. Nodes that have a variable flowratedemand and supply are termed utility sinks and utility sources, respectively. Nodes that haveboth an inlet and an outlet are termed unit operations. Hence, a process unit operation willhave fixed inlet and outlet flowrates (a flow balance is not necessarily maintained across aprocess unit operation). A maximum of five inlets and outlets may be specified for anindividual process unit operation. Utility unit operations have a variable inlet flowrate, whichmay be split into a maximum of two dependent outlet flows (i.e.. the flow balance isconserved across a utility unit operation). The inlet flowrate may be constrained betweenminimum and maximum limits.
2.3.3.2 Contaminant Mass Addition and Removal
The concentration of contaminants present in unit operation outlet streams may be related tothe inlet stream concentration by a linear mass-loading relationship. The general form of therelationship is:
(2.1)cjiout = A $ cji
in + B
where is the outlet concentration and the inlet concentration of contaminant j incjiout cji
in
operation i. The terms A and B are constants that describe the way in which contaminantmass is added or removed. For example, for process unit operations (figure 2.4 (a)) the outletconcentration may be expressed in terms of a contaminant mass addition term, ∆mi, which isthe difference between the outlet and inlet contaminant mass flowrate for operation i:
(2.2)Fiout $ cji
out = Fiin $ cji
in + mi
from which the constant A and B may be calculated.
ri
Utility unit Operation, i
∆ mi Inlet Water
Stream Outlet Water
Stream
Process unit Operation, i
Wastewater Stream
Treated / Regenerated Stream
(a) (b)
outic,C in
i c, C in i F out
iF
inc,iC in
iF out i F
out c,i C
outiFout
c,iC
Concentrated stream
Figure 2.4 : Process (a) and utility (b) unit operation models.
10

Utility unit operations typically remove contaminant mass (figure 2.4 (b)). Outletconcentrations for utility unit operation i, may be related to the inlet concentration using acontaminant fractional removal term, ri ( 0 < ri < 1 ):
(2.3)cjiout = cji
in $ (1 − ri)
A utility unit operation may have a maximum of 2 outlets. The outlet flowrate may beexpressed as a fraction of the inlet flow:
(2.4)Fiout = si $Fi
in
where si is the split fraction to outlet 1 ( 0 < si < 1 ).
If no concentration link is specified for process unit operations, the outlet concentrations areassumed to be constant and equal to the balanced value from WaterTracker. For utility unitoperations, the default setting for the outlet(s) concentration is zero (inlets may be limited toconditions determined by the balance, or are unlimited).
2.3.3.3 Environmental and Discharge Constraints
The user enters environmental and discharge constraints, which apply to utility sinks. Theyare of the following form:
Flowrate: constrained between a minimum and maximum or unconstrained.Concentration: limited to a maximum value or unconstrained.Contaminant mass flowrate: or Flowrate×Concentration, which is limited
to a maximum value or is unconstrained.Typically, environmental constraints are limited in terms of concentration. A contaminantmass flowrate restriction may be preferred if effluent dilution is a problem (concentrationmay be reduced by dilution, whereas contaminant mass flowrate cannot be reduced bydilution).
2.3.3.4 Costs
Two basic cost types may be specified: fixed hourly costs, or variable operating costs (orboth in some cases). Fixed costs are one-off costs that are incurred when a decision is madethat has a related fixed cost (e.g. the installation cost of connecting two operations). Fixedcosts are converted to a time-dependent basis by means of a predetermined annualisationfactor. Piping costs are a special type of fixed cost, which are activated whenever a newconnection is required between two operations (existing connections may be used up to themaximum flowrate). Piping costs per unit pipe length may be specified by the followingequation:
(2.5)cpipe = Ki $Din
The coefficient, Ki, is the purchase cost of a new pipe per unit length, for a given pipediameter, and Di is the inside diameter of the pipe. The exponent, n, accounts for the materialof construction of the pipe (e.g. n = 0.6 for carbon steel and n = 0.9 for stainless steel). Inorder to incorporate piping costs, the geographical positions of the water-using operationsmust be known, in order to calculate the length of pipe required to make a new connection. Ingeneral, fixed costs are associated with integer variables and can slow the optimisationprocess significantly.
Variable costs are dependent on water or contaminant mass flowrate (i.e.. cost per unit flow).Typically freshwater sources, effluent sinks and utility unit operations have variable costsassociated with the amount of water extracted, discharged and treated.
11

2.3.3.5 Bounds
Structural constraints and cost parameters, which are loosely termed bounds in the software,act on the optimisation algorithm to restrict, prevent or encourage connections betweennodes. Strictly speaking, a bound is a constraint or an economic parameter that acts on, or isactivated by, a single possible connection between a source and a sink. In this way, theconfiguration of the optimised network may be controlled to an extent. Seven types of boundsare available in the software and are summarised as follows:
i) Flow =. Forces the total flow through the connection to be the specified value.ii) Flow max. Specifies an upper limit on the total flow through the connection.iii) Flow min. Specifies a lower limit on the total flow through the connection.iv) Existing flow. Indicates that there is an existing connection with an existing maximum
flow of the specified value. In this case, the existing connection can be freely used upto its stated capacity. Any additional flow between the source and sink has to flowthrough a new connection, which will incur fixed piping costs.
v) Ztol. The minimum flow required to justify a new connection. No new connection willbe made unless the flow on the new connection is greater than the specified value.
vi) Variable Cost. The flow-dependent cost of using a new connectionvii) Fixed Cost. The fixed (capital) cost incurred for making a new a new connection.
Bounds set for Variable cost, Fixed cost, and Ztol, apply only to the flow through newconnections. Bounds are specified in matrix format with the constraints or parametersrelating source j to sink i, are entered in column j, row i.
2.3.3.6 Optimisation
Optimisation determines the design of the network that satisfies the specified constraints atthe minimum overall cost. This minimum design cost, called the objective cost, is thetime-dependent cost of operating the network. All fixed costs that are incurred, directlycontribute to the objective cost. The product of variable costs and the flowrate to theassociated node, results in a time-dependent operating cost, which contributes to theobjective cost. All flowrates to nodes that contribute to the objective cost either as a fixedcost, variable cost, or both are summarised in the results summary.
2.3.3.7 Sensitivity Analysis
The WaterPinch Sensitivity Analysis feature identifies the sources and sinks where changesto the water-using system yield the largest savings; these are the areas where futureengineering effort should be concentrated. The sensitivity values report the change inoperating cost for a small change in concentration, in a graphical format. The values arereported for both the inlet concentration constraints (inlet sensitivity) and the outletconcentration values (outlet sensitivity).
Inlet sensitivity indicates the amount that the objective cost is decreased when an inletconcentration constraint to a node is relaxed. Outlet sensitivity values report the amount ofdecreased cost when an outlet concentration is reduced. Outlet sensitivity values indicatestreams that are appropriate for treatment, whereas inlet sensitivities indicate scope forfurther integration.
12
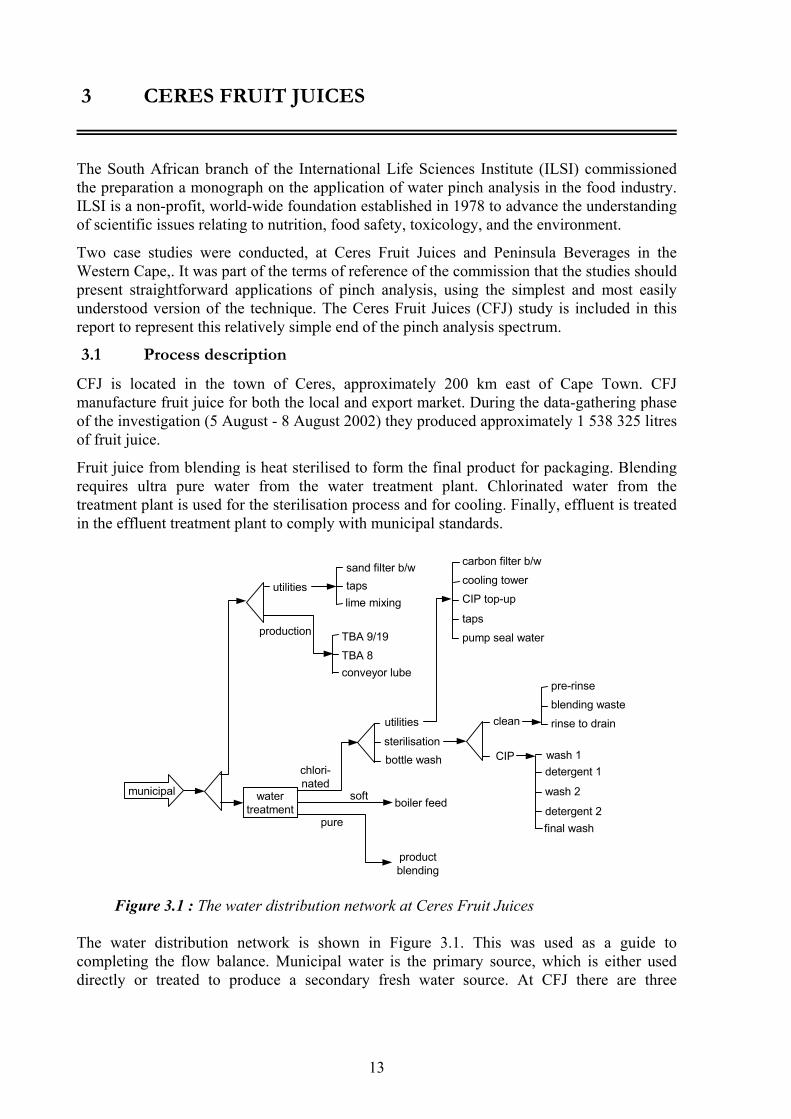
3 CERES FRUIT JUICES
The South African branch of the International Life Sciences Institute (ILSI) commissionedthe preparation a monograph on the application of water pinch analysis in the food industry.ILSI is a non-profit, world-wide foundation established in 1978 to advance the understandingof scientific issues relating to nutrition, food safety, toxicology, and the environment.
Two case studies were conducted, at Ceres Fruit Juices and Peninsula Beverages in theWestern Cape,. It was part of the terms of reference of the commission that the studies shouldpresent straightforward applications of pinch analysis, using the simplest and most easilyunderstood version of the technique. The Ceres Fruit Juices (CFJ) study is included in thisreport to represent this relatively simple end of the pinch analysis spectrum.
3.1 Process description
CFJ is located in the town of Ceres, approximately 200 km east of Cape Town. CFJmanufacture fruit juice for both the local and export market. During the data-gathering phaseof the investigation (5 August - 8 August 2002) they produced approximately 1 538 325 litresof fruit juice.
Fruit juice from blending is heat sterilised to form the final product for packaging. Blendingrequires ultra pure water from the water treatment plant. Chlorinated water from thetreatment plant is used for the sterilisation process and for cooling. Finally, effluent is treatedin the effluent treatment plant to comply with municipal standards.
municipal water treatment boiler feed
chlori-nated
pure
sand filter b/w
product blending
utilities
sterilisation
carbon filter b/w
cooling tower
CIP top-up
taps
pump seal waterTBA 9/19TBA 8conveyor lube
tapslime mixing
bottle wash
clean
CIP wash 1detergent 1
wash 2
detergent 2final wash
pre-rinseblending waste
rinse to drain
utilities
production
soft
Figure 3.1 : The water distribution network at Ceres Fruit Juices
The water distribution network is shown in Figure 3.1. This was used as a guide tocompleting the flow balance. Municipal water is the primary source, which is either useddirectly or treated to produce a secondary fresh water source. At CFJ there are three
13
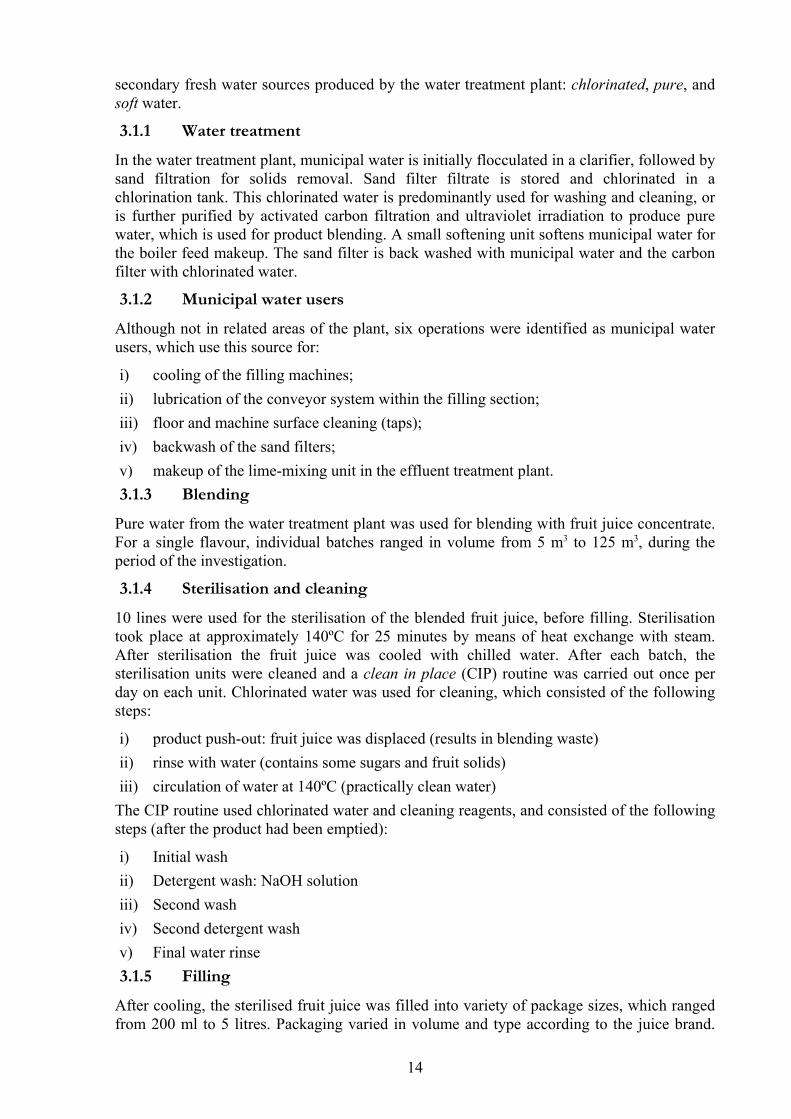
secondary fresh water sources produced by the water treatment plant: chlorinated, pure, andsoft water.
3.1.1 Water treatment
In the water treatment plant, municipal water is initially flocculated in a clarifier, followed bysand filtration for solids removal. Sand filter filtrate is stored and chlorinated in achlorination tank. This chlorinated water is predominantly used for washing and cleaning, oris further purified by activated carbon filtration and ultraviolet irradiation to produce purewater, which is used for product blending. A small softening unit softens municipal water forthe boiler feed makeup. The sand filter is back washed with municipal water and the carbonfilter with chlorinated water.
3.1.2 Municipal water users
Although not in related areas of the plant, six operations were identified as municipal waterusers, which use this source for:
i) cooling of the filling machines;ii) lubrication of the conveyor system within the filling section;iii) floor and machine surface cleaning (taps);iv) backwash of the sand filters;v) makeup of the lime-mixing unit in the effluent treatment plant.3.1.3 Blending
Pure water from the water treatment plant was used for blending with fruit juice concentrate.For a single flavour, individual batches ranged in volume from 5 m3 to 125 m3, during theperiod of the investigation.
3.1.4 Sterilisation and cleaning
10 lines were used for the sterilisation of the blended fruit juice, before filling. Sterilisationtook place at approximately 140ºC for 25 minutes by means of heat exchange with steam.After sterilisation the fruit juice was cooled with chilled water. After each batch, thesterilisation units were cleaned and a clean in place (CIP) routine was carried out once perday on each unit. Chlorinated water was used for cleaning, which consisted of the followingsteps:
i) product push-out: fruit juice was displaced (results in blending waste)ii) rinse with water (contains some sugars and fruit solids)iii) circulation of water at 140ºC (practically clean water)
The CIP routine used chlorinated water and cleaning reagents, and consisted of the followingsteps (after the product had been emptied):
i) Initial washii) Detergent wash: NaOH solutioniii) Second washiv) Second detergent washv) Final water rinse3.1.5 Filling
After cooling, the sterilised fruit juice was filled into variety of package sizes, which rangedfrom 200 ml to 5 litres. Packaging varied in volume and type according to the juice brand.
14

Glass bottles (350 ml) required cleaning before filling, for which chlorinated water was used.As mentioned above, the filling machines required municipal water for cooling, which wasused on a once-through basis.
Two boilers provided on-site steam, which was used for the most part for sterilisation. Softwater was used to make up evaporative and blowdown losses.
A cooling water system was in place for the cooling of juice after sterilisation. This waterwas circulated to cooling towers for heat removal. Chlorinated water was used to make upevaporative and blowdown losses.
3.1.6 Effluent treatment
An anaerobic digester was used for the reduction of COD in the final effluent. Lime wasrequired for the neutralisation of the final effluent, which was slightly acidic. For thispurpose, municipal water was used to makeup the lime slurry.
3.1.7 Automatic CIP
An automatic CIP system (distinct from the CIP described for the sterilisation stage) wasused for cleaning of the blending tanks, lines, fillers and juice pipelines. This CIP systemused an internal reuse strategy, based on a countercurrent regime. After the cleaning agentshad undergone several cycles of reuse, they were discharged. Chlorinated water was used tomake up this water loss (together with the cleaning reagents).
3.2 Methodology
The study largely followed the general methodology for applying pinch analysis to anexisting process set out in chapter 3 of the previous WRC Report No. 851/1/03 (Brouckaertand Buckley, 2003). The steps in the process were:
1) selection of the system boundaries;2) identification of water sources and sinks;3) pre-screening;4) data gathering;5) pinch problem formulation
modelling of unit operationsoptimisation,identification of bottlenecks - relax constraints or regenerate,integrated network design;
6) implementation.Points 1) and 2) have been covered in the process description (section 3.1). Thepre-screening step 3) was identified as a need in the previous report, the approach taken inthis study provides a possible way of dealing with it. The final step 6), implementing thesuggested design changes, was not achieved during the project period.
3.3 Pre-screening
For relatively large water-using systems the data required for a pinch investigation (step 4)can be copious. Although some of the necessary information may be readily available, muchof it may be difficult or costly to ascertain. For this reason, it is useful to obtain a quickindication of whether there is scope to realise significant benefits from the analysis before thedetailed data-gathering stage.
15

The complete set of possible connections between all individual sources and sinks of watercan be represented by arranging the sources and sinks in a matrix form, as shown inFigure 3.2.
1 2 j n d
Sin
k 1
Sin
k 2 .
Sin
k j . .
Sin
k n
Sin
k d
1 Source 1 0 0
2 Source 2 1 0
. 0
i Source i 0
. 0
. 0
m Source m 0
k Source k
S I N K S
S O
U R
C E
S
Figure 3.2 : Connectivity matrix for a general water using process. Connectivitybetween the sources i, and the sinks j, are represented by a '1' or a '0'
Sources, i = 1,2,...m are arranged in the rows. The final rows are used to represent thefreshwater sources, k. The sinks j = 1,2,...n are arranged in the columns, with the finalcolumns reserved for the available discharge points, d. The matrix entry in a given row andcolumn is used to identify whether the connection between the correspond source and sink ispossible (1) or not possible (0).
The pre-screening then is carried out by using a person experienced in the operation of theprocess to assess each potential connection (matrix entry) and judge whether it is likely to bepossible in terms of the process requirements.
For example, if it is known that no portion of Source 1 may be used as feed for Source 2,row 1, column 1 is marked with a '0'. If it is possible that some portion of Source 2 may beused in Sink 1, row 2, column 1 is marked with a '1'.
Furthermore, the situation may arise where only freshwater may be used for a particular sink(e.g. Sink 2 in Figure 4). For such a case, it is possible to exclude this sink entirely from thepinch analysis. Similarly, a source may be excluded if it cannot be used anywhere. In theextreme case, it is conceivable that many operations may be excluded in such a way, or thematrix becomes so sparse (i.e.. full of zeros) that the identification of the remaining optionsfor reuse becomes trivial. In this case it may be assumed that a rigorous analysis isunnecessary, and the pinch investigation may be terminated at this point.
3.3.1 General pre-screening considerations
In general the following considerations should be taken into account during pre-screening:
Water quality requirements - some operations require freshwater in order tofunction properly, particularly boilers and cooling systems. These sinks maybe excluded from the analysis.Highly variable sources - these are sources that pose a significant risk due to
their unpredictable concentration fluctuations and therefore may not be not bedeemed suitable for reuse.
16

Internal optimisation - some processes are internally optimised, such asautomatic CIP systems for example. Such systems often require freshwaterand discharge water of an unsuitable quality for use elsewhere.
3.3.2 Pre-screening considerations for food and beverage operations
The following aspects should be taken into account during the pre-screening stage, whichwould influence the viability of reuse specifically for food and beverages:
Product contamination - any activity that may result in product contaminationshould be avoided. For the case of multi-stage machine cleaning procedures,for machines directly involved with production, freshwater must be used in thefinal rinse stage.Biological considerations - any streams containing organic material such as
sugars and foodstuffs, are susceptible to fermentation. Reuse options thatimply significant retention times (e.g. greater than 1 day) may therefore needto be avoided. Product blending requirements - any water streams entering the product
should be excluded from the analysis as final product quality will be affected.It is important that each the pre-screening exclusions is very carefully considered, as this willpreclude any further integration of the stream involved. Unsuitable connections will bere-examined at a later stage after the initial optimisation (see 3.5 ).
3.3.3 Pre-screening at Ceres Fruit Juices
The very large size of the pre-sceening connectivity matrix for CFJ made it impractical topresent in this report: the main outcomes are stated below. A smaller connectivity matrixresulted from the consideration of network restrictions (see Figure 3.4 in section 3.5.2); itconveys the same king of information, but fits onto the page because of the smaller numberof sources and sinks involved.
The following options were eliminated from the model during pre-screening:
Automatic CIP: the CIP system was regarded as internally optimised, interms of water usage. It was assumed that the system required freshwater andthat the effluent was unsuitable for reuse elsewhere. Boiler makeup and blowdown: the makeup stream concentration
requirements were fixed hence it was assumed that this could not besubstituted. The blowdown was assumed to be of unsuitable quality for useelsewhere. Machine cooling and conveyor lubrication: these operations use small
amounts freshwater and do not add any contamination hence internal recycleis most feasible here.Product blending: This requires ultra pure water only.Taps: used for surface cleaning (machine and floor) require freshwater and
discharge a waste of highly variable and unpredictable quality, which wasdeemed unsuitable for reuse.
It was concluded that the remainder of the process provided sufficient potential for watersaving to make it worth proceeding with the pinch analysis.
3.4 Data Gathering
There were two main objectives of the data gathering stage of the investigation. The primaryobjective was to obtain the parameters that adequately represent the requirements of the
17
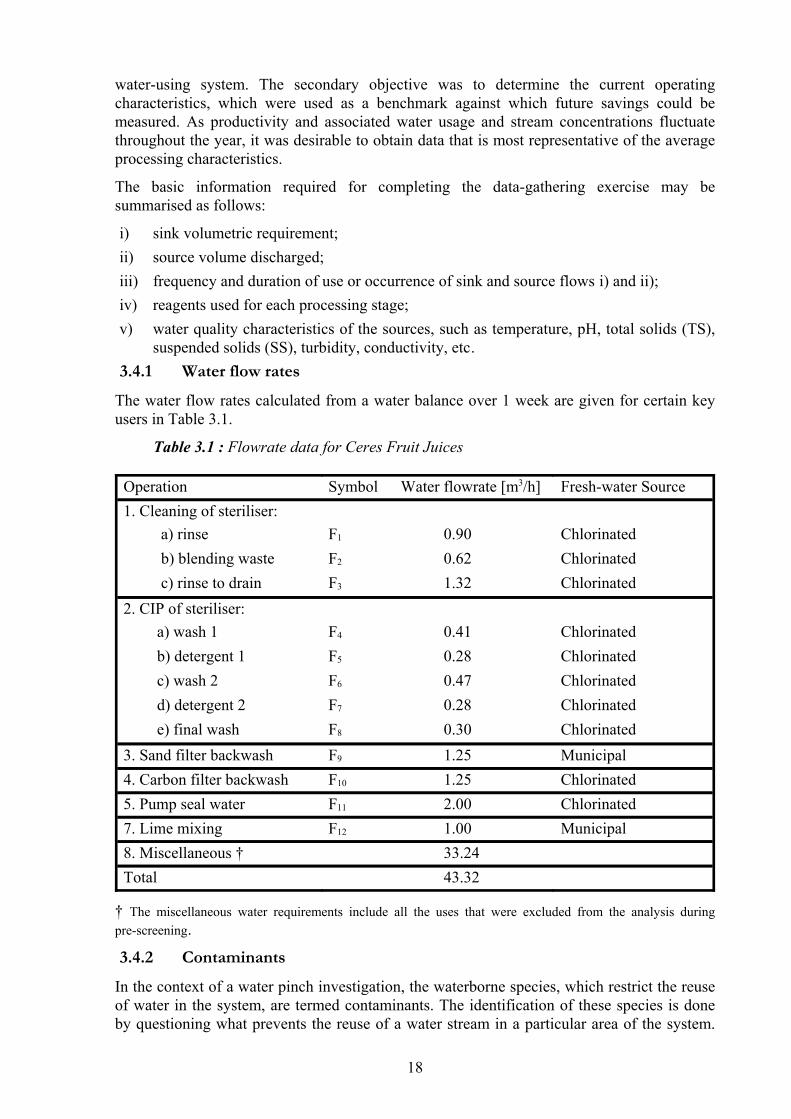
water-using system. The secondary objective was to determine the current operatingcharacteristics, which were used as a benchmark against which future savings could bemeasured. As productivity and associated water usage and stream concentrations fluctuatethroughout the year, it was desirable to obtain data that is most representative of the averageprocessing characteristics.
The basic information required for completing the data-gathering exercise may besummarised as follows:
i) sink volumetric requirement;ii) source volume discharged;iii) frequency and duration of use or occurrence of sink and source flows i) and ii);iv) reagents used for each processing stage; v) water quality characteristics of the sources, such as temperature, pH, total solids (TS),
suspended solids (SS), turbidity, conductivity, etc.3.4.1 Water flow rates
The water flow rates calculated from a water balance over 1 week are given for certain keyusers in Table 3.1.
Table 3.1 : Flowrate data for Ceres Fruit Juices
43.32Total33.248. Miscellaneous †
Municipal1.00F127. Lime mixingChlorinated2.00F115. Pump seal waterChlorinated1.25F104. Carbon filter backwashMunicipal1.25F93. Sand filter backwashChlorinated0.30F8e) final washChlorinated0.28F7d) detergent 2Chlorinated0.47F6c) wash 2Chlorinated0.28F5b) detergent 1Chlorinated0.41F4a) wash 1
2. CIP of steriliser:Chlorinated1.32F3 c) rinse to drainChlorinated0.62F2 b) blending wasteChlorinated0.90F1 a) rinse
1. Cleaning of steriliser:Fresh-water SourceWater flowrate [m3/h]SymbolOperation
† The miscellaneous water requirements include all the uses that were excluded from the analysis duringpre-screening.
3.4.2 Contaminants
In the context of a water pinch investigation, the waterborne species, which restrict the reuseof water in the system, are termed contaminants. The identification of these species is doneby questioning what prevents the reuse of a water stream in a particular area of the system.
18

Contaminants may be single entities such as ions or molecules (e.g. Ca2+ ions) or aggregatedgroups e.g. total dissolved solids (TDS).
In some cases it becomes necessary to distinguish between contaminants and reagents thatare introduced deliberately. Some like sodium hydroxide for example, may be a reagent inone part of a process, and a contaminant in another.
The contaminants that were considered as restricting the extent of water reuse at CFJ wereclassified as follows:
Dissolved / suspended fruit solids: sugars, pith, etc. These arise duringsteriliser cleaning and CIP.Cleaning reagents: NaOH, peroxil. These are introduced into the system
during automatic CIP.Suspended solids: arise from the raw municipal water feed (suspended solids
were flocculated in the clarifier, removed by sand filtration, and finallydischarged during backwash of the sand filters).Chlorine / water flavours: dissolved chlorine arises from the chlorination of
filtered municipal water in the chlorination tank (flavours are adsorbed in thecarbon filters and discharged during backwash).Conductivity: dissolved ionic solids, such as chloride ions that promote
corrosion. These are seen to be problematic in cooling towers, where theyaccumulate by evaporation concentration.
It is conceivable that numerous other contaminants, not listed above, affected the way inwhich water was used. However, the above discussion does serve to illustrate that somecontaminants:
i) affect water usage in localised areas only, e.g. suspended solids in water treatment.ii) may be viewed as regents in some areas and contaminants in others. This is clear when
considering the chlorine in water treatment and cleaning reagents for CIP.iii) may be grouped according to their nature and / or the way in which they affect water
usage. For example, considering total solids (TS) as a contaminant, allows forsuspended solids, dissolved ionic solids, caustic soda (for cleaning), and sugars to begrouped under this classification. This has the benefit of reducing the costs associatedwith the analysis of water and effluent streams. In addition, by considering only onecontaminant, single contaminant optimisation techniques may be used, which simplifiesthe analysis of the model considerably. Lastly, it was decided to restrict the analysis toa single contaminant for clarity of presentation in the monograph, even though thismight be an over-simplification of the situation.
Total solids (TS) was used as an indicator for contamination, hence the non-volatile solids:suspended solids, caustic soda, and sugars were grouped together as total solids.
The outlet concentration (cout* ) was measured in samples taken from of effluent and water
streams. The maximum inlet concentration ( cinmax ) was estimated by assuming that 20% of
the measured outlet concentration was allowed at the inlet. The maximum outletconcentration ( cout
max ) was calculated by assuming that a linear relationship between inletand outlet existed. The existing concentration of TS at the inlet (cin ) was assumed to be thatof fresh water, which was measured at 60 ppm.
19
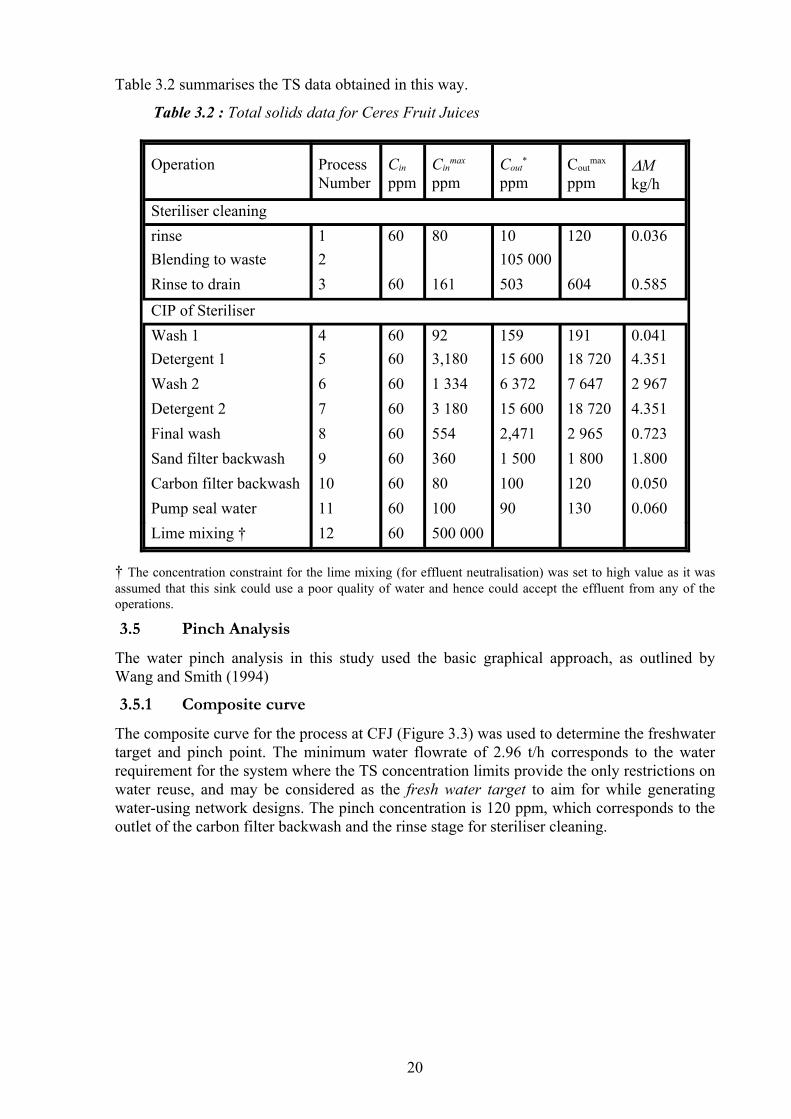
Table 3.2 summarises the TS data obtained in this way.
Table 3.2 : Total solids data for Ceres Fruit Juices
500 0006012Lime mixing †0.060130901006011Pump seal water0.050120100806010Carbon filter backwash1.8001 8001 500360609Sand filter backwash0.7232 9652,471554608Final wash4.35118 72015 6003 180607Detergent 22 9677 6476 3721 334606Wash 24.35118 72015 6003,180605Detergent 10.04119115992604Wash 1
CIP of Steriliser
0.585604503161603Rinse to drain105 0002Blending to waste
0.0361201080601rinseSteriliser cleaning
∆Mkg/h
Coutmax
ppmCout
*
ppmCin
max
ppmCin
ppmProcessNumber
Operation
† The concentration constraint for the lime mixing (for effluent neutralisation) was set to high value as it wasassumed that this sink could use a poor quality of water and hence could accept the effluent from any of theoperations.
3.5 Pinch Analysis
The water pinch analysis in this study used the basic graphical approach, as outlined byWang and Smith (1994)
3.5.1 Composite curve
The composite curve for the process at CFJ (Figure 3.3) was used to determine the freshwatertarget and pinch point. The minimum water flowrate of 2.96 t/h corresponds to the waterrequirement for the system where the TS concentration limits provide the only restrictions onwater reuse, and may be considered as the fresh water target to aim for while generatingwater-using network designs. The pinch concentration is 120 ppm, which corresponds to theoutlet of the carbon filter backwash and the rinse stage for steriliser cleaning.
20

0.0 0.5 1.0 1.5 2.0 2.5 3.00.0
500
1000
1500
2000
2500
3000
3500
Con
cent
ratio
n[p
pm]
Mass load [kg/h]
3.32
Cfw: 60
Pinch point:
Water flow: 2.96 t/h
Pinch conc: 120 ppm
Pinch ∆m: 0.1776 kg/h
0.0 0.5 1.0 1.5 2.0 2.5 3.00.0
500
1000
1500
2000
2500
3000
3500
Con
cent
ratio
n[p
pm]
Mass load [kg/h]
3.32
Cfw: 60
Pinch point:
Water flow: 2.96 t/h
Pinch conc: 120 ppm
Pinch ∆m: 0.1776 kg/h
Figure 3.3 : The composite curves for Ceres Fruit Juices
3.5.2 Reuse restrictions
The pinch point indicated in Figure 3.3 was determined on the assumption that the onlyfactors limiting reuse were the total solids limits of Table 3.2. Several further restrictions hadto be added the CFJ model to avoid any risk associated with product contamination orequipment damage:
i) The initial rinse before sterilisation had to use fresh water, in order to reduce the risk ofproduct contamination.
ii) The final wash after CIP had to use freshwater for the same reason as (i).iii) An individual CIP stage (wash 1, detergent, etc.) could use only water from itself or
from subsequent stages.iv) Utilities (filters and pump seals) could not use any water associated with machine
cleaning.v) Sand filter backwash effluent could not be used in the pump seals or the carbon filters.
These restrictions are shown as a connectivity matrix in Figure 3.3. The rows represent thesources, and the columns represent the sinks (this matrix may be viewed as the reduced formof the pre-screening matrix mentioned in section 3.3.2)
21

1 3 4 5 6 7 8 9 10 11 12
Rin
se
Rin
se to
dra
in
Was
h 1
Det
erge
nt 1
Was
h 1
Det
erge
nt 2
Fina
l was
h
San
d fil
ter b
ackw
ash
Car
bon
filte
r bac
kwas
h
Pum
p se
als
Lim
e m
akeu
p
Effl
uent
1 Rinse2 Blending waste3 Rinse to drain4 Wash 15 Detergent 16 Wash 27 Detergent 28 Final wash9 Sand filter backwash10 Carbon filter backwash11 Pump seals
Freshwater
Reuse not allowed Reuse allowed
S O
U R
C E
S
S I N K S
Figure 3.4 : Connectivity matrix showing allowed and disallowed reuse options
3.5.3 Source-sink matching
The network configuration that satisfies the fresh water target is usually not unique. There area number of different techniques which allow one to establish a set of connections betweenthe available sources and sinks. The method chosen for this study uses a source-sink massmapping diagram (El-Halwagi, 1997). The source and sink streams are assumed to be at theirmaximum inlet and outlet concentrations. The streams are plotted as single points on asource-sink mass mapping diagram as indicated in Figure 3.4.
The steps for using the mapping diagram to identify the water-recycling network aresummarised below:
i) Start with sinks requiring fresh water.ii) Redraw the mass mapping diagram as matches occur (if necessary).iii) Satisfy the sinks with the strictest water concentration requirements (cleanest water
needed) first, in sequential order using sources with the lowest compositions, tominimise wastewater discharge and freshwater flows.
iv) Try to recycle the source back to the sink of that unit, if possible (this always requiresdilution with freshwater or another source stream.
v) In applying these steps, only the allowed connections shown in Figure 3.3 could beselected. These restrictions meant that the minimum target of 2.96 t/h could not berealised.
The results of applying this procedure to the Ceres Fruit Juices system are shown inFigure 3.5 (b) with the existing configuration in Figure 3.5 (a) for comparison.
22

Total solids [ppm]
Wat
er fl
ow ra
te [t
/h]
0 100 200 30050 150 250 350 400 450 500 550 600 650
10
1
11
3
4
1
8
3
4
910
11
SourcesSinks
0
0.20
0.40
0.60
0.80
1.00
1.20
1.40
1.60
1.80
2.00
2.50
3.00
3.50
fw
Figure 3.5 : Source-sink map for Ceres Fruit Juices. The numbers in the blocks refer tothe process numbers Table 3.2. Processes 2, 5, 6, 7, and 12 fall off the scale of thediagram, however they were included in the analysis.
1
4
5
12
3
2
6
7
8
9
10
11
1
4
5
12
3
2
6
7
8
9
10
11
CW: 0.90
CW: 1.32
CW: 0.082
CW: 0.30
CW: 1.25
CW: 0.86
0.28
0.328
0.27
0.14
1.25
1.14
WW: 0.62
WW: 1.32
WW: 0.28
WW: 0.47
WW: 0.28
WW: 0.86
WW: 0.25
0.20
0.10
CW: 0.04
1.00
WW: 0.292WW: 0.90
WW: 0.62
WW: 1.32
WW: 0.41
WW: 0.28
WW: 0.47
WW: 0.28
WW: 0.30
WW: 1.25
WW: 1.25
WW: 2.00
CW: 0.90
CW: 1.32
CW: 0.41
CW: 0.28
CW: 0.47
CW: 0.28
CW: 0.30
CW: 1.25
CW: 2.00
CW: 1.25MW
: 1.0
0
CW: 7.21
MW: 2.25
CW: 4.752
a) Existing configuration
Fresh water flowrate: 9.46 t/h
b) Integrated configuration
Fresh water flowrate:4.75 t/h
Figure 3.6 : Comparison of the existing water allocation configuration (a) at CeresFruit Juices with the integrated configuration resulting from the pinch analysis (b).
23
3.6 Discussion and conclusions
The pinch analysis identified a potential reduction of 4.7 t/h of fresh water, a saving of verynearly 50 %. The study ended at this point, so it was not possible to confirm whether thiscould be implemented in practice.
From the composite curve (Figure 3.2) it can be seen that the pinch occurs at a concentrationof 120 ppm, which corresponds to the outlet of the carbon filter backwash and the initial rinsestage of the steriliser cleaning. Because the analysis depends so critically on this point, it alsocorresponds to where future engineering effort should be focused.
The first step would be to verify the data: check the flow rate and concentration parametersfor these two critical operations. If they were significantly different than the initial estimates,the optimisation procedure would have to be repeated to establish a new pinch point. Whensatisfied with the data, the possible users of the water (sinks) need to be examined moreclosely; bearing in mind the stream characteristics that were not included in the singlecontaminant analysis. For example, the steriliser rinse takes place at 140 °C - what are thelimitations or benefits of having a source at this temperature? It is useful at this stage toreturn to the source / sink matrix that was used to represent the structural restrictions(Figure 3.3). The integrated network solution (Figure 3.5 b)) splits the rinse effluent(Source 1) between Sink 4 and 5 with freshwater dilution, which makes the system morecomplex to operate, but is necessary in order to satisfy the imposed concentration constraint.It is possible that the entire source may be reused in only one of the CIP stages. Note that theconcentration constraints derived for the system were not absolute limits, but were estimatesbased on measured outlet concentrations (section 3.4.2). Therefore, it is quite possible thatthe inlet concentration constraints might be relaxed for one or more of the operationsconsidered as potential sinks.
For the carbon filter backwash effluent (Source 10), the solution identified in the integratednetwork used this entirely as feed to the sand filter backwash (Sink 9), effectively replacingthe municipal water feed. The sand filter backwash effluent (Source 9) was in turn used forlime mixing at the effluent treatment plant (Sink 12).
Other opportunities identified include use of the final CIP rinse (Source 8) in the precedingrinse stages (with freshwater makeup).
From the above discussion it can be seen that the simple form of water pinch analysis doeshave a number of theoretical limitations. On the other hand, in a relatively uncomplicatedsystem such as the one considered here, they can often be addressed by carefully consideringtheir implications for the particular process in question. The resulting design might notstrictly optimal, but should be close enough for practical purposes.
24

4 THE AECI BIOPRODUCTS LYSINE PLANT AT
UMBOGINTWINI
This chapter is based on the University of Natal MScEng thesis by Janos Schneider entitledThe Application of Water Pinch Analysis at AECI Bioproducts, submitted in 2002.
4.1 Introduction
AECI Bioproducts (Bioproducts) is part of an industrial complex located at Umbogintwini,approximately 26 km south of Durban, Kwazulu-Natal. This system was selected forinvestigation as it is one of the major users of freshwater on the complex and hencedischarges a related quantity of wastewater, amounting to approximately 400 ML per annum.Bioproducts is a manufacturer of l-lysine, which is an animal feed additive.
Commissioned in 1995, AECI Bioproducts is a modern facility and has sophisticated qualityand environmental standards. Freshwater is withdrawn from the Umbogintwini River and ispre-treated before use. The l-lysine is produced by batch fermentation and is extracted fromthe fermentation broth by ion exchange. Two effluent sources arise from the manufacturingprocess: a concentrated broth effluent and general process effluent, which are handledseparately. Process effluent arises mainly from the following sources:
the utility system;tank and unit operation cleaning;pump seals; storm water runoff andcontaminated process condensate.
Process effluent is discharged via a sea pipeline and environmental regulations limit theconcentration of pollutants discharged to the sea. What remained after lysine extraction wasbroth effluent, which was removed from the site and handled by the local sewage works. Inaccordance with an agreement with the DWAF, neither broth effluent nor failed fermentationbatches were to be discharged via the sea pipeline.
Umbogintwini Operating Services (UOS) is an effluent and water treatment facility thatoperates at the industrial complex. Umbogintwini river water is treated by UOS for use in theplants at the complex. Some industries use the UOS effluent treatment facilities, however theBioproducts process effluent is of a suitable quality for direct discharge via the sea pipeline;no additional treatment is required. Barring pH correction of the broth effluent, no on-siteeffluent treatment takes place. The degree of integration in the system is high; clean processcondensate is reused in several operations. However, systematic methods for water usereduction had not been implemented at any stage during the design or subsequent processmodifications.
Although the plant uses approximately 400 ML of water per annum - relatively low for anindustrial system - the system represents one of the major water users and associated effluentproducers at the Umbogintwini industrial complex. For this reason, AECI Bioproducts wasselected as a suitable candidate for a water pinch investigation.
25

4.2 Aims of the investigation
The aims of this project were to:
i) apply water pinch analysis at Bioproducts, which consisted of determining:the set of contaminants that effectively limit water reuse within the system;operating and fixed costs associated with operating the water-using network andnecessary retrofit strategies;a network configuration that satisfies the external constraints imposed upon the systemat minimum cost;operational improvements to the system in terms of retrofitting of treatment andregeneration operations, and additional piping requirements.
ii) determine the elements of the water-using network that were the greatest barriers tofurther saving and improvement, and in so doing, suggest possible improvements thatwould aid in the implementation of similar projects in the future.
4.3 Process overview
1.
2.12.1
2.2
2.3
4.4.
5.5.
6.6.
9.9.
8.8.
7.7.
FERM.
PIX
PIX
PIX
STRIP / EVAP
SIX
STEAM COND.
10.10.
AS EVAP.
DRY
COOL TOWER
CIP
PUMP SEALS
Steam
Steam
NH3
H2SO4
H2SO4
HCl
Broth Eff luent
Process Eff luent
Granular Product
River Water
Steam
(a)
(b)
(c)
UOS Effluent
CFS
Raw Materials
Resin Flow Direction
3.3.
Clean condensate
Dirty condensate
Figure 4.1 : Flow sheet outlining water and raw material distribution, and processstreams in the manufacture of l-lysine at AECI Bioproducts.
26

The manufacture of l-lysine is a semi-batch process: fermentation is a batch process, whereasthe extraction, purification and granulation of the lysine product are carried out continuously.Figure 4.1 presents a simplified view of the manufacturing process. Aqueous and processstreams are emphasised as solid black lines. The dashed lines represent raw material feedsand resin flow for the primary ion exchange process. Minor streams and processing detailshave been omitted from this diagram for clarity.
4.3.1 Process water
UOS provides treated water, which is drawn from the Umbogintwini River. The UOS wateris stored in the Process Water Tank and is fed from here for use in all operations on the plant,except the cooling tower, which draws water directly from UOS without prior storage. Theoffices and development laboratories uses water supplied by Umgeni Water. The mostsignificant contaminant present in the UOS water supply is chloride, which presentscorrosion problems if allowed to accumulate.
4.3.2 Effluent dilution from UOS
The treatment facility operated by UOS discharges treated effluent from other systems at thecomplex via the sea pipeline. AECI Bioproducts does not use the effluent treatment facilityas the general process effluent from the plant is of a suitable quality for discharge directly tothe sea after dilution with the effluent from the UOS effluent treatment facility.
4.3.3 Raw materials
The raw materials are stored in a tank farm outside of the central processing area. For thefermentation process, the primary raw material is high-test molasses (HTM), which forms themain carbon source for the bacteria. The HTM is made up of glucose, fructose, and sucroseand contains a small amount of impurities, the most significant component of which is ash.Additional raw materials required as nutrients for fermentation include corn steep liquor(CSL), which is a protein source, along with the amino acids methionine and threonine, citricacid, phosphoric acid, ammonium sulphate (AS), vitamins, and minerals such as FeSO4,MnSO4 and MgSO4.
Other raw materials include anti foam, which is required to prevent excessive frothgeneration during fermentation; ammonia, which is used for both pH correction duringfermentation and regeneration of the primary ion exchange resin; and sodium hydroxide,which is used for pH correction of the broth effluent.
4.3.4 Fermentation
The Corynebacterium glutamicum bacterium produces the l-lysine, during the three-stagefermentation process. In the first stage, the population of bacteria cells is grown to a mass of2g under sterile laboratory conditions. This is transferred to an 18 m3 pre-fermenter, wherethe biomass increases to approximately 250 kg, after 30 to 40 h. The pre-fermenter feeds themain fermentation stage. Four 200 m3 tanks are operated cyclically, each fermentation batchlasting 3-5 days. During the first 8 to 12 hours, the biomass increases to 4 to 5 t. Changingthe balance of substrate nutrients during the remainder of the period, causes the cellpopulation to stop increasing and the micro-organisms begin to overproduce lysine.
4.3.5 Sterilisation
Foreign micro-organisms must not enter the fermentation process. The mutated lysineproducing micro-organism cannot compete with natural micro-organisms, and thefermentation batch must be discarded if contamination of this nature occurs. For this reason,all nutrients and anti foam required for pre-fermentation and fermentation - apart from thevitamins - are diluted with process water and heat sterilised. The sterilised media is stored in
27

sterile tanks before use as feed to the fermenters. The vitamins are filter sterilised and areintroduced directly into the fermenters.
The bacteria metabolise aerobically, and filter-sterilised air is used to supply the requiredoxygen. Gaseous NH3 may be added with the air for pH correction. Refrigerated water iscirculated through coils in the fermenters for temperature control. The fermenters are agitatedcontinuously throughout the fermentation process to homogenise the broth.
Fermentation is complete when lysine production stops and the population of living cellsbegin to decrease. The mixture of cells and lysine solution, called fermentation broth, istransferred from the main fermenters into drop-tanks. A fraction of the fermentation broth iswithdrawn from the drop-tanks and ultra-filtered to remove the biomass, which is recycled tothe drop-tanks. The lysine-rich permeate is fed to the lysine evaporator, where it isconcentrated to a 28 % lysine solution. This liquid-lysine product is sold locally as a spray-onanimal feed additive. The remainder of the fermentation broth is acidified with sulphuric acidin the drop-tanks, forming lysine sulphate. The liquid hold-up in the drop tanks and the cyclicbatch fermentation production of lysine-rich broth is sufficient to continuously supply theprimary ion exchange process with acidified broth at a flowrate of 10 to 13 t/h.
Lysine production may be summarised by the following (unbalanced) chemical equation:
Glucose + fructose + O2 + (NH4)2SO4 + NH3 → Lys2SO4 + CO2 + byproducts
4.3.6 Primary ion exchange
The primary ion exchange (PIX) process (figure 4.1 (a)) consists of 30 cells of cationic ionexchange resin, arranged in a 20-stage revolving carousel (several of the stages consist ofdouble-cell pairs). Because the resin beds are moving, the resin can be considered to flow inthe direction of bed rotation. The function of the PIX process is to separate the lysine fromthe acidified fermentation broth. The process may be broadly classified into three mainphases of operation: the adsorption phase, backwash phase and the strip phase.
4.3.6.1 Adsorption phase
The acidified broth is fed from the drop-tanks to the PIX process. The fermentation broth isintroduced to the adsorption zone and is fed countercurrent to the resin flow. Because thefermentation broth is acidified with H2SO4, the lysine exists in both the +1 and +2 ionisedstates. In this charged state, the lysine ion has an affinity for the resin, molecules in the +2state having a greater affinity than ions in the +1 state. The resin is in the ammonia formbefore the adsorption phase, i.e.. NH4
+ molecules are attached to the active sites in the resin.During adsorption, the charged lysine molecules from the fermentation broth are adsorbed bythe resin, displacing ammonia into solution, forming AS. Lysine adsorption may becharacterised by the following chemical reactions:
2R-NH4 + Lys2+ → R2 Lys + 2NH4+
R-NH4 + Lys+ → R Lys + NH4+
Other charged species present in the broth compete with the lysine for adsorption sites. Smallquantities of amino acids, such as valine, alanine and threonine, are present in the broth.Trace potassium ions have a high affinity for the resin and are adsorbed with the lysine.However, the major contaminant is ash, which is present in the HTM raw material.Concentrations greater than 3 % can effectively reduce the lysine adsorption to zero, ascharged ash particles block the active resin sites.
After adsorption, the AS-rich effluent that remains - the broth effluent - forms the majorsingle source of effluent, in terms of cost of disposal, from the entire lysine producingprocess. Sulphuric acid from the secondary ion exchange (SIX) process (process 5 in
28

Figure 4.1) is recycled to the adsorption zone of the PIX process. This recycle streamcontains the metallic cation contaminants removed from the lysine solution in the SIXprocess. These cations are discharged with the broth effluent. The broth effluent is 60 %solids sludge, high in free and saline ammonia, biomass and nutrients. At the time of theinvestigation, Bioproducts was prohibited by effluent exemption from releasing thisbiomass-rich effluent to the sea. The effluent was transported off-site to the Durban SouthernWastewater Treatment Works (SWW).
4.3.6.2 Backwash phase
The loaded resin is rinsed to remove any product entrained on and between the resin beads.The beds are subsequently back washed to remove loosely bound amino acid contaminants.The backwash effluent stream is fed directly to the sea pipeline. Dilute ammonia solution isused to displace the amino acids, which are adsorbed onto the resin with the lysine, but aremore labile as they are in the +1 ionised state. These contaminants must be removed as theyaffect the purity of the final product.
4.3.6.3 Strip phase
The lysine is displaced from the resin during the strip phase, by feeding a 4M ammoniasolution, countercurrent to the resin flow, after which the resin is in the ammonia form. Thecells are rinsed with pure water (which is fed to the ammonia stripper) and purged withcompressed air before re-entering the adsorption zone.
4.3.7 Ammonia stripper and lysine evaporator train
The ammonia and lysine-rich solution from the strip phase is fed to the ammonia stripper inorder to remove the ammonia from solution. The stripped ammonia is recycled to the PIXprocess. From the ammonia stripper, the lysine solution is concentrated in the third stage of a3-stage evaporation process. From the evaporation third stage, the lysine solution is fed to theSIX process (see paragraph 4.7) for further purification. The pure lysine solution from theSIX process is further concentrated in the first and second stages of the evaporation process.
4.3.8 Secondary ion exchange
The lysine solution is further purified in the SIX process. During lysine adsorption, metalliccations are adsorbed, with the lysine, by the resin. The most significant metallic contaminantis potassium. Positively charged metallic contaminants are removed by adsorption. As thefeed is not acidified, lysine is not adsorbed, as it exists in a neutral state. The resin isregenerated with diluted H2SO4, which is recycled to the adsorption phase of the PIX processfor feed acidification. Pure water is used to rinse the cells after regeneration (the rinse wateris recycled to the PIX adsorption zone) and the cells are purged with compressed air, beforere-entering the adsorption zone. The compressed air purge stream is reused in the PIXbackwash.
4.3.9 Ammonium sulphate evaporator
About a third of the broth effluent is fed to the single-effect AS evaporator (Figure 4.1 (c)),where it is concentrated to form an 80 % solids AS-rich solution, which, when there is ademand, is sold as a cattle-feed supplement. The condensate from the AS evaporator isoccasionally contaminated by contact with the process stream (the broth effluent in this case),due to overflow into the shell-side of the evaporator during boiling. Contaminated processcondensate contains saline ammonia and suspended solids. Condensate with a suspendedsolids concentration of less than 1000 ppm is used as part of the PIX backwash feed.However, if the suspended solids concentration rises above 1000 ppm, reuse is prevented (byturbidity control). In this case, feed to the PIX backwash is prevented and the AS condensate
29

tank is allowed to overflow and drain into the wash-down sump. The contents of thewash-down sump are discharged via the sea pipeline.
4.3.10 Steam condensate
Pure condensate arises from the three-stage evaporation train. In addition, utility operations,such as steam heaters and pipe lagging, produce condensate. These have been groupedtogether as one operation in Figure 4.1. The condensate from these miscellaneous operationsand utilities are combined with the pure condensate from the evaporation train, and reused aspart of the feed to other operations.
4.3.11 Granulation and bagging
The concentrated product from the first and second stages of the evaporator train is acidifiedwith HCl. This stabilises the dried product. After acidification, the concentrated lysine isdried and granulated.
4.3.12 Cleaning and cooling utilities and pump-seal water
The auxiliary processes (figure 4.1 (b)) use UOS water either from the process water tank ordirectly, as is the case for the cooling tower. The clean-in-place (CIP) system usescondensate, made up with process water. All of these water-using operations discharge theireffluent via the sea pipeline.
4.3.12.1 Clean-in-place system
Clean-in-place (CIP) is an automatic tank cleaning system. The water for the feed consists ofcondensate made up with process water when required. Sodium hydroxide is added as acleaning agent. The CIP medium is pumped from a central storage facility and used wherenecessary.
4.3.12.2 Pump seals
Two basic pumping systems were considered for this investigation. The tank farm pumpstransfer material from the tank farm to the central processing facility. The process pumpstransport liquids within the processing facility. The pump seal water is collected in the tankwash-down sumps for the tank farm pumps, and in the plant wash-down sumps for theprocess pumps.
4.3.12.3 Cooling tower
The cooling tower draws makeup water directly from UOS, without prior storage. Theblowdown rate is determined by the chloride concentration.
4.4 Water reuse and recycle opportunities
In general, reuse of effluent from the downstream processes in the fermentation process islimited by the need to maintain a sterile medium for fermentation. Free and Saline Ammonia(FSA) and Suspended Solids (SS) are both monitored and limited in the effluent discharged tothe sea. Chlorides pose a problem for operations sensitive to corrosion, such as stainless steelvessels and heat exchangers. Apart from pH correction, the effluent discharged to the sea isnot treated on-site or at UOS.
4.4.1 PIX: Broth effluent
At 16 R/t, the PIX broth effluent had the highest per ton cost of disposal associated with itsflow. It is high in SS, which is mainly in the form of biomass, as well as FSA, which consistsmainly of AS, as the broth effluent is acidified with sulphuric acid. The concentrated natureof this effluent source makes it unsuitable for reuse in most operations. Recycling of brotheffluent to the fermentation process would result in a recovery of both water and nutrients
30
such as AS required as a substrate for cell metabolism. Broth effluent has not beenconsidered at AECI Bioproducts, since a broth effluent recycle would lead to accumulation ofcharged ash particles (that arise from the HTM), which would reduce the PIX adsorptionefficiency.
4.4.2 PIX: Backwash effluent
The main contaminants present in the backwash effluent are trace amino acids that areadsorbed with the l-lysine and are removed during backwash. A dilute ammonium solution isused as feed to the backwash stage of the PIX process. The ions displace loosely boundmono-valent amino acids, such as valine and alanine, the predominant species being valine.The presence of free ammonia restricts reuse or recycle of this stream to the PIX strip andPIX backwash phase, however the amino acid contaminant prohibits this.
4.4.3 Condensate
As process steam is imported, pure condensate is not recycled to the boiler; hence it is asource of high quality water. Current water saving practices see this source being used as partof the feed to the CIP process, as well as making up a small fraction of the feed to the SIXrinse and PIX strip phase. Pure condensate is collected in the condensate tank, which issupplied with a makeup water feed, activated by a level controller.
The AS evaporator condensate is a viable source if it is pure. However, sporadiccross-contamination from the process stream makes reuse of this source risky. This hasinvestigated by considering three models; the first two vary the contaminant level in the ASevaporator condensate, and the third looks at the case where condensate reuse is prevented(section 4.6).
4.4.4 PIX: adsorption and strip phase
The PIX adsorption phase is sensitive to species, which compete with lysine, and requires arelatively pure feed stream. Micro-scale particles suspended in solution can become chargedin the acidified medium and block active adsorption sites. Regeneration is required beforeany reuse of other wastewater streams. Similarly, the PIX strip phase requires pure water asfeed to limit the contaminant concentration in the liquid lysine solution. As both theseoperations require pure water, the scope for reuse of contaminated process effluent is limited.
4.4.5 Pump seals
Pump seal water may be reused, but the current design prevents this: pump seal water drainsinto an exposed sump beneath the pumps and from there, to the wash-down sumps. In bothcases, considerable contamination results from exposure to the environment. A lack ofqualitative data for the individual pump seal effluents restricted further investigation into thisarea.
4.4.6 Clean-in-place system
The overall quality of the Clean-In-Place (CIP) effluent after use in tank washing is poor.Cleaning chemicals such as sodium hydroxide limit the extent of reuse of CIP effluent inother operations. Reuse of cleaning water within the CIP system is an option, if sodiumhydroxide levels are recharged and individual tank-cleaning concentration requirements areidentified. However, the flowrate of water within the CIP system is too low, relative to therequirements of the total system, to warrant an investigation of this nature.
4.4.7 Cooling tower
Cooling tower blowdown is high in fungicidal and anti-corrosion chemicals, which limits itsreuse. However, in petroleum refineries, cooling tower blowdown is frequently used as seal
31

water for pumps (Alva-Argaez, 1999). Feed to the cooling tower must be as pure as possiblein order to reduce the blowdown rate.
4.5 Water pinch model of the water-using system
The Linnhoff-March Waterpinch software was used for the analysis of the system. Thesoftware is described in chapter 2.
4.5.1 Key contaminants
Three contaminants were selected: free and saline ammonia (FSA), suspended solids (SS)and chlorides (Cl).
4.5.1.1 Free and Saline Ammonia
Dissolved ammonium species, predominantly (NH3)2SO4 and NH3(aq) (depending on the pH)are collectively classified as FSA. The concentration of this contaminant must be below300 ppm in the discharge to the sea. The following operations add or remove FSA to andfrom the water-using system:
Fermentation tanks. AS is added during tank cleaning, which is manifested inthe outlet from the CIP system, i.e.. tank cleaning adds FSA to the system.PIX adsorption. Free ammonia is added, when ammonia is displaced from the
resin by the adsorbed species.The PIX backwash adds free ammonia, which is discharged via the sea
pipeline. 4.5.1.2 Suspended Solids
This is a broad-spectrum contaminant, which is limited to below 400 ppm in the discharge tothe sea. This concentration constraint is based on aesthetics since a brown coloured plume isvisible in the region of the outlet of the sea pipeline at high SS concentrations. The followingoperations add or remove SS to the water-using system:
Fermentation. The broth effluent is a high solids source comprised mainly ofcellular residue, which is added during the fermentation process.PIX backwash. Cellular residue from the adsorption phase adds SS, to the
backwash effluent.Cooling tower. Pickup of atmospheric solids adds SS to the water system
during evaporative cooling.Tank cleaning. General particle residue in tanks, such as cellular residue in
the fermentation tanks, is added to the system during CIP.Pump seals. Although SS addition by the pump itself is marginal, SS pickup
in the pump sumps is considerable due to exposure to the atmosphere.UOS water supply. The UOS water supply has a small quantity of SS, which
is not removed during treatment.4.5.1.3 Chloride
High chloride concentration causes corrosion problems in most operations. The coolingtower, and to a lesser extent, the pumps are especially sensitive to corrosion. Although thiscontaminant is not directly limited in effluent discharges to the sea, the conductivity must bebelow 2 000 mS/m. The cooling tower is the only operation that contributes to the chlorideconcentration in the system, by concentrating the UOS water makeup.
It was assumed that current operating concentration conditions at the inlet to eachwater-using operation was limiting. Three scenarios were investigated that look at potential
32

for reducing cost by varying the concentration conditions of the AS condensate. In addition,the scope for reducing the cost associated with effluent discharge was investigated byrelaxing the sea pipeline concentration constraint. Several operating scenarios wereinvestigated, which explored the variability in the concentration of the AS evaporatorcondensate. In addition, the potential for relaxing environmental constraints was investigated.Several possible configurations for the water-using network were produced.
4.5.2 Elements of the water-using system and model assumptions
In order to carry out a water pinch analysis of a water-using system, only the elements thathave a demand for water and a supply of associated wastewater need to be included. Hence,various process-related elements of the water-using system at AECI Bioproducts can beomitted. This is shown in figure 4.2, which interprets the simplified process representation infigure 4.1 as a water pinch supply and demand model. Most of the simplifications arestraightforward: raw material, intermediate, and product streams that are required as part ofthe necessary processing stages (to produce the l-lysine product) are omitted, as they are afeature of the intrinsic process and cannot change. Likewise, gaseous water streams such asprocess steam and cooling tower evaporation are not included in the model. Condensedprocess steam leaves the operations that require steam as condensate, which was included asa water supply. Additional miscellaneous simplifications were made, which are discussed indetail below.
4.5.2.1 PIX strip
Two separate water sources were used to feed the PIX strip phase (figure 4.2 (d)):Condensate was used to dilute the ammonia solution; and freshwater at a differentcontaminant concentration was used to rinse the cells after stripping. For this reason, afteromission of the process streams the PIX strip phase has been modelled as two waterdemands.
4.5.2.2 Evaporators and condensate
In the analysis, all the pure condensate sources (figure 4.2 (f)) are treated as one source. Thisis reasonable, as they are of the same concentration, and are collected in the same tank (thecondensate tank) on the plant.
4.5.2.3 SIX
As with the PIX strip phase, two water supplies at different contaminant concentration levelswere used in the SIX operation (figure 4.2 (g)). Freshwater was used to dilute the sulphuricacid feed; and condensate was used to rinse the operation after each purification stage. Forthis reason, after omission of the process streams, the SIX operation was modelled as twowater demands. In the case of the SIX-rinse outlet, only a fraction is available for reuse, asmost is fed back into the adsorption cycle to recover residual l-lysine. This is a dilute streamthat has a negligible effect on the configuration of the network and for this reason has beenexcluded from the analysis.
4.5.2.4 Clean-in-place
The volumetric and concentration requirements for each individual tank cleaning aredependent on the tank dimensions and mass of contaminants present. It has been assumedthat the concentration requirements for each individual tank are the same as for the collectivetanks on the plant. This allows the CIP system (figure 4.2 (j)) to be treated as a singlewater-using operation, with a single demand and effluent supply. This is a validsimplification as, at a flowrate of approximately 6.38 t/h, the demand from the CIP system issmall compared to the demand of the entire system.
33

FERM.
1.Raw Materials
WaterH2SO4 To PIX
(2.1)
PIX2.12.1
Water
From FERM.
Broth effluent
To PIX (2.2)
2.2PIX
Water+
Condensate
From PIX (2.1)
Backwash effluent
To PIX (2.3)
2.3PIXWater
Diluted NH3
From PIX (2.2)
To Strip / Evap
Ferment
3.3.AS
EVAP.
Broth Effluent
CFS
Condensate
From PIX (2.1)
Steam
PIX ads.
PIX BW.
PIX strip
PIX NH3 dil
AS cond.
4.4.STRIP / EVAP
Steam
Stripped NH3
To SIXCondensate
From PIX (2.3)
From SIX
To DRY
6.6.STEAM COND.
Steam
Pure cond.
(a)
(b)
(c)
(d)
(e)
(f)
5.SIX
H2SO4
From STRIP / EVAP
Water To STRIP / EVAP
To PIX (2.1)
7.PUMP SEALS
Water Process Effluent
COOL TOWER
8.
Evap.
WaterBlowdown (Process Effluent)
9.CIP
Water+
Condensate
Process Effluent
Cooling tower
Pump seals
SIX acid
SIX rinse
CIP
(g)
(h)
(i)
(j)
Figure 4.2 : The set of water-using operations used for the water pinch model
34

4.5.2.5 Pump seals
As with the CIP system, the pump seals were treated as a single water-using operation, with atotal demand of 6.5 t/h .
4.5.3 Water users
From figure 4.2, the water users considered in this study consist of:
Steam condensate (pure condensate producers grouped together);
PIX backwash;UOS dilution.PIX adsorption;SIX rinse;Pump seals;CIP;Cooling tower;PIX strip water;Fermentation;SIX acid dilution;AS condensate;
One freshwater source was available from the UOS water pre-treatment facility. Twodischarge points were available: the sea pipeline and the SWW. The sea pipeline wasconstrained to environmental limits, however, for the purpose of this investigation, the SWWdid not impose any limiting constraints. A worst-case scenario was assumed, where the cattlefeed supplement product from the AS evaporator was not sold, but was combined with thebroth effluent from the PIX adsorption stage.
The base-case water-using network configuration is shown in figure 4.3. The flowrates thatachieve this configuration are given in table 4.1.
Pure cond.
Cooling tower
Pump seals
PIX ads.
PIX BW.
SIX acid
PIX strip
PIX NH3 dil
SIX rinse
Ferment
UOS water
Sea pipeline
SWW
AS cond.
UOS diln.
Water-using operation
Splitter Mixer
Base CaseWater flowrate: 62.32 t/h Operating cost: 559.73 R/h
CIP
Figure 4.3: Base-case model configuration for the AECI Bioproducts system.
35

Table 4.1: Inter-operation flowrates for base-case configuration; flows in t/h.
CIP
Pump seals
Cooling tower
Pure condensate
UOS dilution
PIX backwash
PIX adsorption
AS condensate
UOS water
Ferm
ent
CIP
Pum
p se
als
Coo
ling
tow
er
PIX
strip
PIX
ads.
PIX
b-w
SIX
acid
Sea
pipe
line
SWW
Existing flowrate (t/h)
From
To
6.50
3.59
5.67 11.08
80.14
17.43
24.97
3.99 0.71 6.50 29.76 1.35 14.44 4.05 1.38
6.40
SIX
rinse
1.16
0.14
PIX
NH 3
dil.
0.16
6.38
No on-site treatment facilities exist; hence the problem became one of determining theconfiguration of the water-using subsystem. Three contaminants were included: FSA, SS andCl. Equation 2.1, was used to relate the outlet conditions to the inlet concentration for eachoperation. The coefficients A and B were assumed constant for all operating scenariosinvestigated in section 4.6. The coefficient values for each operation that has a wastewateroutlet are presented in table 4.2, below.
The contaminant concentration in the UOS freshwater source, pure condensate and UOSdilution were taken as constant, as were the flowrate from the pure condensate source and theUOS dilution. However, the freshwater flowrate was considered variable, (the upper andlower limits in equation 4.5 is unconstrained and zero respectively), as it is dependent on theconfiguration of the water-using system. Table 4.3 lists the flow and concentrationcharacteristics of each of these sources.
Table 4.2: Mass loading relationships and flowrates for the water-using operations
0.01.00Cl0.01.00FSA 6.386.387 670.31.00SSCIP
0.01.00Cl240.10.60FSA 17.4310.450.01.00SSPIX
backwash
1 0000.00Cl35 0000.00FSA 24.9714.4435 00000.00SSPIX
Adsorption
0.01.00Cl0.01.00FSA 6.56.5197.61.00SSPump seals
0.08.31Cl0.08.30FSA 3.5929.76793.38.30SSCooling
Tower
Fiout (t/h)Fi
in (t/h)B (ppm)A (-)ContaminantOperation
36

Table 4.3 : Flow rates and concentrations of water sources
1 000Cl35 000FSA350 000SS80.14UOS dilution
0.0Cl0.0FSA197.6SS18.07Condensate
0.0Cl0.0FSA793.3SSVariableUOS fresh water
cout (ppm)ContaminantFlow (t/h)Source
The positions of the water-using operations are given in table 4.4. These were used tocalculate the cost of installing new piping wherever a new connection was identified.
Table 4.4 : Approximate positions of the operations at AECI Bioproducts
100UOS water2040Pure condensate1030SWW2540AS evaporation025Sea outfall pipe025UOS dilution905Cooling tower2020PIX NH3 dilution2020PIX b-w1530SIX rinse2020PIX ads1530SIX acid dilution040CIP2020PIX strip rinse50Pump seals3520Fermentation
Yposition[m]
Xposition[m]
OperationYposition[m]
Xposition[m]
Operation
New pipes were assumed to be constructed of stainless steel and a flow velocity of 1 m/s wasassumed for the calculation of pipe diameter, for all connections. The cost coefficients usedare given in table 4.5. The cost of using the SWW was based on the mass-flowrate of effluent(i.e.. R/t of effluent). This contrasts with the sea pipeline: an annual license fee was chargedby the water authorities for its use, which was translated to an hourly usage fee (i.e.. R/h).
Table 4.5 : Cost parameters used in the analysis
0.9 (stainless steel)Exponent for material of construction, n
4.78×10⁻³ R/(h·m)Hourly cost per meter piping
(based on 1” pipe diameter), X
R4.41 /hDischarge to sea pipeline, bi
R6.00 /tDischarge cost to SWW, ai
R2.50 /tFreshwater cost, αi
37
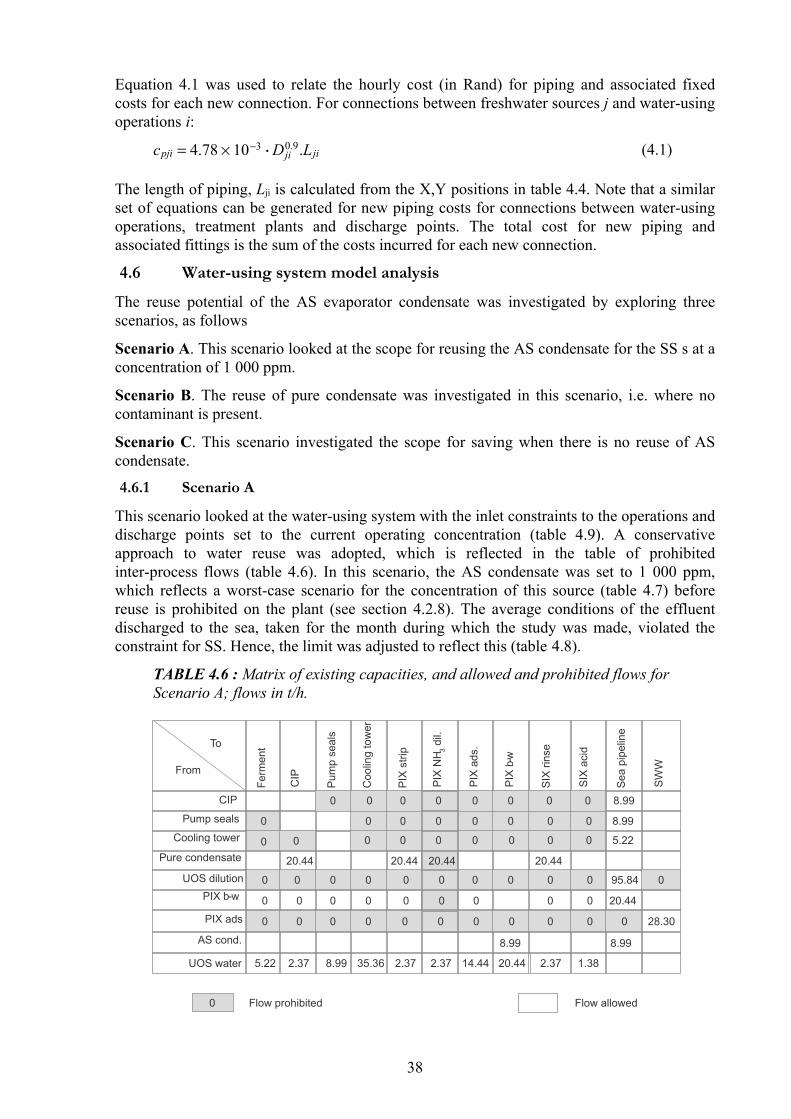
Equation 4.1 was used to relate the hourly cost (in Rand) for piping and associated fixedcosts for each new connection. For connections between freshwater sources j and water-usingoperations i:
(4.1)cpji = 4.78 % 10−3 $Dji0.9.Lji
The length of piping, Lji is calculated from the X,Y positions in table 4.4. Note that a similarset of equations can be generated for new piping costs for connections between water-usingoperations, treatment plants and discharge points. The total cost for new piping andassociated fittings is the sum of the costs incurred for each new connection.
4.6 Water-using system model analysis
The reuse potential of the AS evaporator condensate was investigated by exploring threescenarios, as follows
Scenario A. This scenario looked at the scope for reusing the AS condensate for the SS s at aconcentration of 1 000 ppm.
Scenario B. The reuse of pure condensate was investigated in this scenario, i.e. where nocontaminant is present.
Scenario C. This scenario investigated the scope for saving when there is no reuse of AScondensate.
4.6.1 Scenario A
This scenario looked at the water-using system with the inlet constraints to the operations anddischarge points set to the current operating concentration (table 4.9). A conservativeapproach to water reuse was adopted, which is reflected in the table of prohibitedinter-process flows (table 4.6). In this scenario, the AS condensate was set to 1 000 ppm,which reflects a worst-case scenario for the concentration of this source (table 4.7) beforereuse is prohibited on the plant (see section 4.2.8). The average conditions of the effluentdischarged to the sea, taken for the month during which the study was made, violated theconstraint for SS. Hence, the limit was adjusted to reflect this (table 4.8).
TABLE 4.6 : Matrix of existing capacities, and allowed and prohibited flows forScenario A; flows in t/h.
CIP
Pump seals
Cooling tower
Pure condensate
UOS dilutionPIX b-w
PIX ads
AS cond.
UOS water
Ferm
ent
CIP
Pum
p se
als
Coo
ling
tow
er
PIX
strip
PIX
ads
.
PIX
b-w
SIX
rinse
SIX
acid
Sea
pipe
line
SWW
0 Flow allowedFlow prohibited
From
To
0 0 0 0 0
0 8.99
0 0 0 0 5.22
20.44 20.44 20.44
0 0 0 95.84
0 0 0 0 0 0 0 20.44
0 0 0 0 0 0 28.30
8.99
5.22 2.37 8.99 2.37 14.44 20.44 2.37 1.3835.36
0 0 8.99
0 0 0 0 0 0
0 0 0 0
0 0 0 0 0 0 0
0
0 0 0 0
PIX
NH 3
dil.
0
0
2.37
0
0
0
0
20.44
8.99
38

The general assumption was that effluent from operations where the concentration isunpredictable may not be reused as feed to sensitive operations (section 4.3), as additionalunspecified contaminants may interfere with the normal operating conditions to produce aninferior product, or a failed batch. For this reason, the PIX adsorption and fermentationoperations may only use pure water or condensate (UOS water or condensate). Use ofcondensate was allowed in all operations. Reuse of CIP and pump seal effluent was limited tolocal recycling; reuse of the pump seal effluent was allowed in the CIP process. Coolingtower blowdown was deemed suitable for reuse in the pump seals only. UOS effluentdilution was constrained to the sea outfall pipe and could not be used anywhere else.Discharge of the broth effluent was constrained to the SWW for off-site treatment, inaccordance with the DWAF effluent agreement in force at the time. Note that this lastconstraint was later relaxed to determine the sensitivity of the configuration to relaxation ofthe environmental constraint for the sea pipeline.
Table 4.7: Conditions for the AS evaporator (Scenario A)
0.00 Cl
1.00 FSA
0.00 SS
6.40 AS Condensate
CoutContaminantFout (t/h)Operation
The FSA concentration was assumed to be zero (table 4.7) for this scenario; however smallquantities of this contaminant may have been present, but the concentration was notmeasured. The chloride concentration was very low in this source, and was assumed to bezero.
Table 4.8: Sea pipeline discharge constraints (Scenario A)
-unconstrained Cl
75 - SS
-300 SA
Sea pipeline
Min MAX (kg/h)Cin MAX (ppm)ContaminantDischarge point
The SS in the sea pipeline was limited by a mass-load constraint, rather than a concentrationconstraint, in order to prevent dilution of the effluent with purer sources. This mass-loadconstraint represents a concentration of 666 ppm in the sea pipeline, which violated theenvironmental constraint of 400 ppm, but reflected the average discharge conditions duringthe period of the investigation.
In this scenario, current operating conditions determined the maximum inlet concentrationconstraints for each operation (equation 2.2). The maximum outlet concentration wascalculated using equation 2.1, by setting:
The chloride concentration in the broth effluent from the PIX adsorption stage was assumedto be at the same level as the freshwater chloride concentration.
39

Table 4.9 : Inlet and outlet flowrate and maximum inlet and outlet concentrationconstraints (Scenario A)
80.6380.63Cl24.924.9SS0.00*0.00*FSA
Processstream
12.43PIX striprinse
80.6380.63Cl24.924.9SS0.00*0.00*FSA
Processstream
3.99Fermentation
80.6380.63Cl1.381.38SS0.00*0.00*FSA
Processstream
1.38IX aciddilution
80.6380.63Cl24.924.9SS0.00*0.00*FSA
Processstream
0.16PIX NH3dilution
80.6380.63Cl24.924.9SS0.00*0.00*FSA
6.386.38CIP
80.6380.63Cl24.924.9SS0.00*0.00*FSA
Negligible(Flow<0.02)
1.3SIX rinse
80.6380.63Cl625625SS100100FSA
17.4310.45PIXbackwash
80.6380.63Cl24.924.9SS3,9903,990FSA
24.9714.44PIXadsorption
80.6380.63Cl24.924.9SS0.00*0.00*FSA
6.56.5Pump Seals
80.6380.63Cl24.924.9SS0.00*0.00*FSA
3.5929.76CoolingTower
Cin MAX (ppm)Cin MAX (ppm)ContaminantFout (t/h)Fin ( /h)
Operation
* Zero contaminant concentration levels were used to approximate negligible amounts of contaminant presentin sources, which is reflected as an inlet constraint and outlet value when negligible contaminant loading takesplace.
The Linnhoff-March WaterPinch software was used to carry out the optimisation subject tothe specified constraints. The configuration of the resulting water-using system is shown infigure 4.4.
40

Pure cond.
Cooling tower
Pump seals
PIX ads.
PIX BW.
SIX acid
PIX strip
PIX NH3 dil
SIX rinse
Ferment
UOS water
Sea pipeline
SWW
AS cond.
UOS diln.
Water-using operation
Splitter Mixer
Scenario AWater flowrate: 60.95 t/h Operating cost: 556.30 R/h
CIP
Figure 4.4 : Configuration of the optimised water-using network for Scenario A.
The flowrates for the above configuration are presented in table 4.10. The configuration doesnot differ substantially from the existing configuration (figure 4.3). The reuse of AScondensate is reduced, some of which is discharged to the sea pipeline.
Table 4.10 : Matrix of inter-operation flows for the configuration of the Scenario Awater system; flows in t/h.
CIP
Pump seals
Cooling tower
Pure condensate
UOS dilution
UOS water
Ferm
ent
CIP
Pum
p se
als
Coo
ling
tow
er
PIX
strip
PIX
ads.
PIX
b-w
SIX
acid
Sea
pipe
line
SWW
Existing connenction
From
To
6.50
3.59
6.38 11.53
80.14
16.43
24.97
3.99 6.50 29.76 0.90 14.44 2.68 1.38
4.29
SIX
rinse
1.30
PIX
NH 3
dil.
0.16
6.38
3.48
2.11
PIX backwash
PIX adsorption
AS condensate
41

The major feature of this configuration is the recycle of the PIX backwash: about one fifth ofthe PIX backwash effluent is identified as suitable for recycle. This decreases the freshwaterdemand by 2.32 t/h in this operation, leading to a decrease in the water-using systemoperating cost of 0.61% or R 29 635 per annum (with 360 operating days). No extra pipingcapital costs are incurred as existing connections are utilised in this configuration and theflow capacities are not exceeded.
4.6.1.1 Initial sensitivity values
The limiting concentration constraint for this scenario was calculated using the WaterPinchsensitivity analysis feature, and was determined to be at the PIX backwash for FSA and SSand the sea pipeline for SS (figure 4.5 (a)). The potential for further relaxation of the SSconstraint to the PIX backwash (as well as other constraints) is explored in section 4.7.Reducing the outlet concentration of SS from the AS evaporator provides the greatestpotential for saving by regeneration of this stream.
INLE
T S
ENSI
TIV
ITY
(Rh-
1 /∆pp
m)
0.000
0.005
0.010
0.015
0.020
0.025
Cooling tow er in
PIX b-w in Sea outfall pipe
0.030Cl
FSA
SS
Cl
FSA
SS
UOS dilution
AS evap.condensate
CIP out UOS w ater0.00
0.01
0.02
OUT
LET
SEN
SITI
VIT
Y (R
h-1 /∆
ppm
)
Cl
FSA
SS
Cl
FSA
SS
(a) (b)
Figure 4.5 : Inlet (a) and outlet (b) sensitivity values for Scenario A.
4.6.2 Scenario B
The system configuration was investigated for the case where the AS condensate is pure(table 4.11), i.e.. no contamination of the condensate from the process stream occurs.Mass-loading characteristics (table 4.2) for the operations and inlet concentration constraints(table 4.9) remain the same as for Scenario A.
Table 4.11 : Conditions for the AS evaporator (Scenario B)
0.00 Cl
0.00 FSA
0.00 SS
6.40 AS Condensate
CoutContaminantFout (t/h)Operation
The network configuration generated by the WaterPinch software is presented in figure 4.6.The major feature of this configuration is the complete reuse of the AS condensate in the PIXbackwash process. This reduces the freshwater demand to 58.84 t/h, which is a totalwater-using system operating cost saving of 1.56 % or R 75 443 per annum.
42

Pure cond.
Cooling tower
Pump seals
PIX ads.
PIX BW.
SIX acid
PIX strip
PIX NH3 dil
SIX rinse
Ferment
UOS water
Sea pipeline
SWW
AS cond.
UOS diln.
Water-using operation
Splitter Mixer
Scenario BWater flowrate: 58.84 t/h Operating cost: 551.02 R/h
CIP
Figure 4.6 : Configuration of the water-using system with pure AS evaporatorcondensate (Scenario B).
4.6.2.1 Initial sensitivity analysis
The limiting inlet constraint for this scenario was determined to be at the PIX backwash forFSA and the sea pipeline for SS (figure 4.7 (a)). The reported initial sensitivity of theobjective cost to changing outlet concentrations is negligible for this scenario (figure 4.7 (b)).
0.00
0.02
0.04
0.06
0.08
PIX b-w in Sea outfall pipe
INLE
T S
ENSI
TIV
ITY
(Rh-
1 /∆pp
m)
Cl
FSA
SS
Cl
FSA
SS
0.00
0.05
0.10
UOS dilution UOS w ater
OUT
LET
SEN
SITI
VIT
Y (R
h-1 /∆
ppm
)
Cl
FSA
SS
Cl
FSA
SS
(a) (b)
Figure 4.7: Inlet (a) and outlet (b) sensitivity values for Scenario B.
43
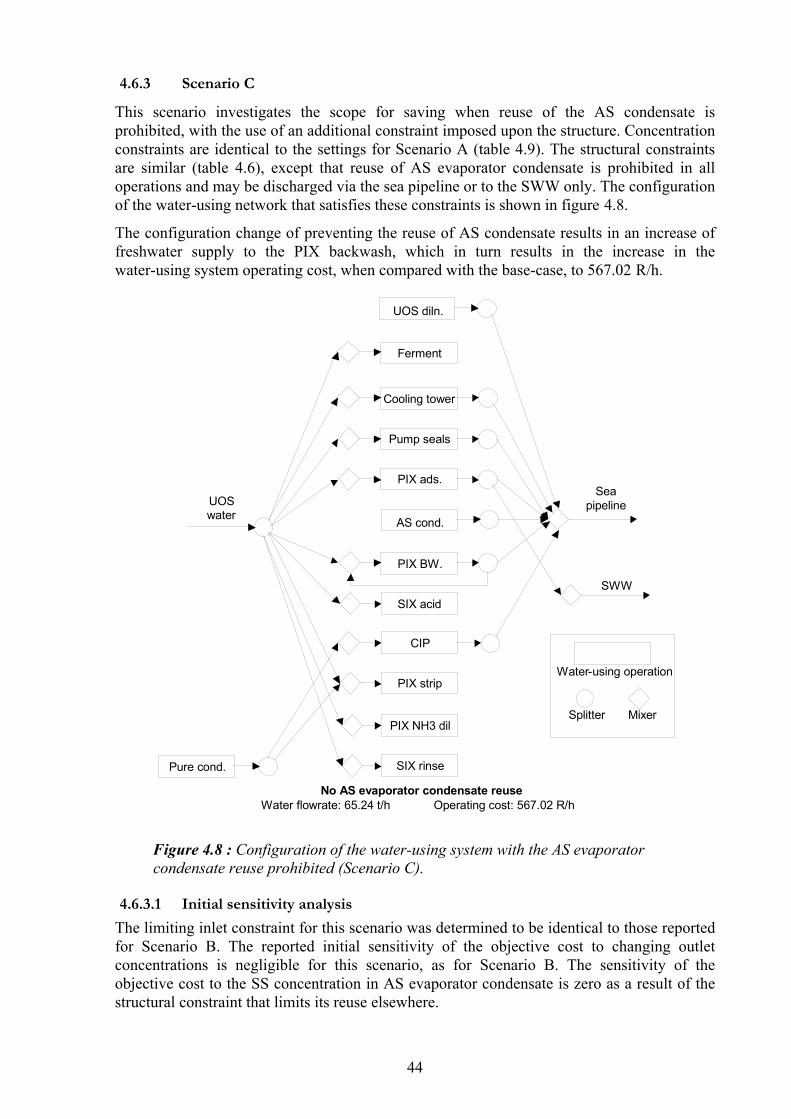
4.6.3 Scenario C
This scenario investigates the scope for saving when reuse of the AS condensate isprohibited, with the use of an additional constraint imposed upon the structure. Concentrationconstraints are identical to the settings for Scenario A (table 4.9). The structural constraintsare similar (table 4.6), except that reuse of AS evaporator condensate is prohibited in alloperations and may be discharged via the sea pipeline or to the SWW only. The configurationof the water-using network that satisfies these constraints is shown in figure 4.8.
The configuration change of preventing the reuse of AS condensate results in an increase offreshwater supply to the PIX backwash, which in turn results in the increase in thewater-using system operating cost, when compared with the base-case, to 567.02 R/h.
Pure cond.
Cooling tower
Pump seals
PIX ads.
PIX BW.
SIX acid
PIX strip
PIX NH3 dil
SIX rinse
Ferment
UOS water
Sea pipeline
SWW
AS cond.
UOS diln.
Water-using operation
Splitter Mixer
No AS evaporator condensate reuseWater flowrate: 65.24 t/h Operating cost: 567.02 R/h
CIP
Figure 4.8 : Configuration of the water-using system with the AS evaporatorcondensate reuse prohibited (Scenario C).
4.6.3.1 Initial sensitivity analysis
The limiting inlet constraint for this scenario was determined to be identical to those reportedfor Scenario B. The reported initial sensitivity of the objective cost to changing outletconcentrations is negligible for this scenario, as for Scenario B. The sensitivity of theobjective cost to the SS concentration in AS evaporator condensate is zero as a result of thestructural constraint that limits its reuse elsewhere.
44

4.7 Model sensitivity analysis
The sensitivity of the solution was tested in order to determine the robustness of the networkconfiguration, as well the scope for further saving when inlet constraints were relaxed oroutlet conditions were changed. This was investigated by determining the response of theobjective cost, flowrates, and contaminant concentrations to changing the following:
i) Freshwater cost parameter;ii) PIX backwash SS inlet concentration constraint;iii) Sea pipeline inlet mass-flowrate constraint for SS and FSA concentration constraint;iv) AS evaporator outlet SS concentration level.
The concentration parameters that were investigated are the highest initial sensitivity valuesfrom Scenario A, reported in figure 4.5. The Scenario A model was used for part i), ii),and iii) of the investigation. The WaterPinch software was used to calculate the response ofthe objective function to changing the above mentioned cost, flowrate, and concentrationconditions.
4.7.1 Fresh water
The sensitivity of the objective cost to changes in freshwater cost was explored first. Infigure 4.9, a plot of the total objective cost (in R/h) as a function of the freshwater supply (inR/t), is presented.
0
200
400
600
800
1000
1200
1400
1600
0 2 4 6 8 10 12 14 16 18FRESH WATER COSTS (R/t)
OBJ
ECTI
VE
CO
ST (R
/h)
Figure 4.9: Sensitivity of the optimum objective function to freshwater costs.
In this range, the network structure and flow rates did not change as the water cost increased.
4.7.2 Inlet constraints
The sensitivity of the solution to changing the concentration constraint for the PIX backwashand sea pipeline were tested by relaxing the inlet constraint for SS, for the PIX backwash,and SS and FSA for the sea pipeline. The sensitivity of the objective cost to the changing theinlet constraint for chlorides was found to be negligible for all operations.
4.7.2.1 PIX Backwash sensitivity
In figure 4.10, a plot of the objective cost as a function of the change in the inlet SSconcentration constraint to the PIX backwash operation, is presented. By relaxing the inletconstraint to the PIX backwash, the amount of AS condensate (at a SS concentration of
45
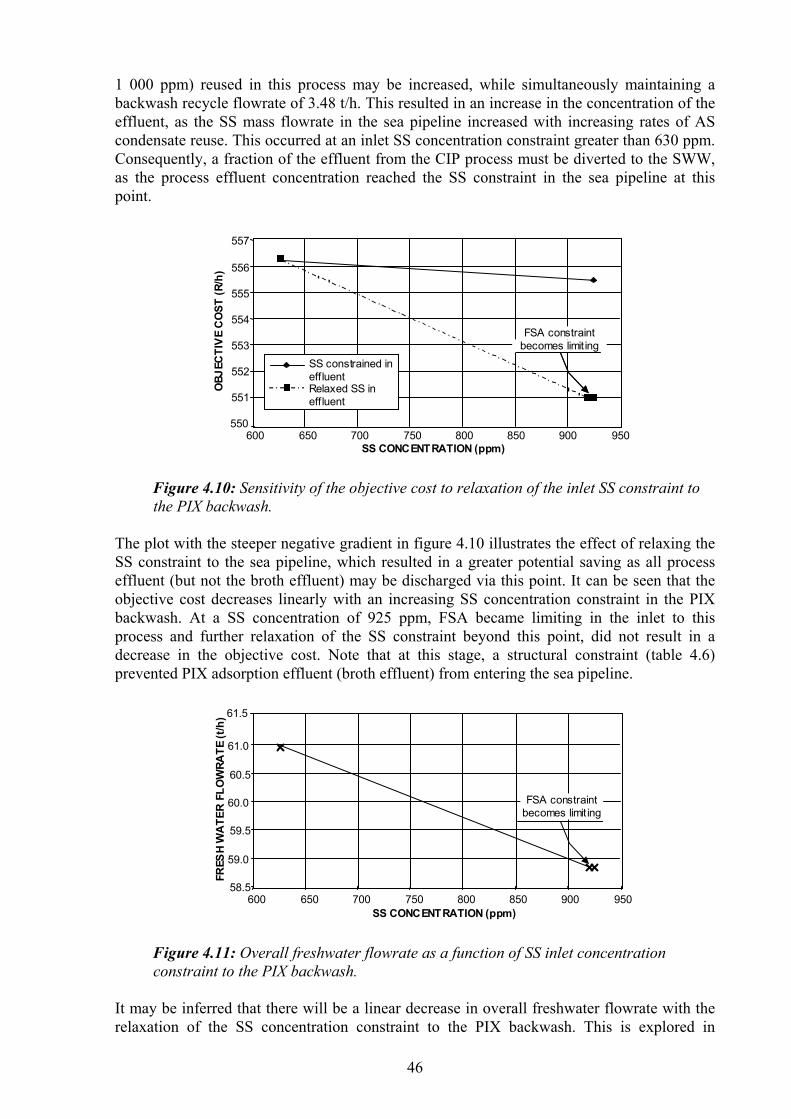
1 000 ppm) reused in this process may be increased, while simultaneously maintaining abackwash recycle flowrate of 3.48 t/h. This resulted in an increase in the concentration of theeffluent, as the SS mass flowrate in the sea pipeline increased with increasing rates of AScondensate reuse. This occurred at an inlet SS concentration constraint greater than 630 ppm.Consequently, a fraction of the effluent from the CIP process must be diverted to the SWW,as the process effluent concentration reached the SS constraint in the sea pipeline at thispoint.
OBJ
ECTI
VE
CO
ST (R
/h)
SS CONCENTRATION (ppm)
551
552
553
554
555
556
557
550600 650 700 750 800 850 900 950
Relaxed SS in effluent
SS constrained in effluent
FSA constraint becomes limit ing
Figure 4.10: Sensitivity of the objective cost to relaxation of the inlet SS constraint tothe PIX backwash.
The plot with the steeper negative gradient in figure 4.10 illustrates the effect of relaxing theSS constraint to the sea pipeline, which resulted in a greater potential saving as all processeffluent (but not the broth effluent) may be discharged via this point. It can be seen that theobjective cost decreases linearly with an increasing SS concentration constraint in the PIXbackwash. At a SS concentration of 925 ppm, FSA became limiting in the inlet to thisprocess and further relaxation of the SS constraint beyond this point, did not result in adecrease in the objective cost. Note that at this stage, a structural constraint (table 4.6)prevented PIX adsorption effluent (broth effluent) from entering the sea pipeline.
58.5
59.0
59.5
60.0
60.5
61.0
600 650 700 750 800 850 900 950SS CONCENTRATION (ppm)
FRES
H W
ATE
R FL
OW
RATE
(t/h
) 61.5
FSA constraint becomes limit ing
Figure 4.11: Overall freshwater flowrate as a function of SS inlet concentrationconstraint to the PIX backwash.
It may be inferred that there will be a linear decrease in overall freshwater flowrate with therelaxation of the SS concentration constraint to the PIX backwash. This is explored in
46
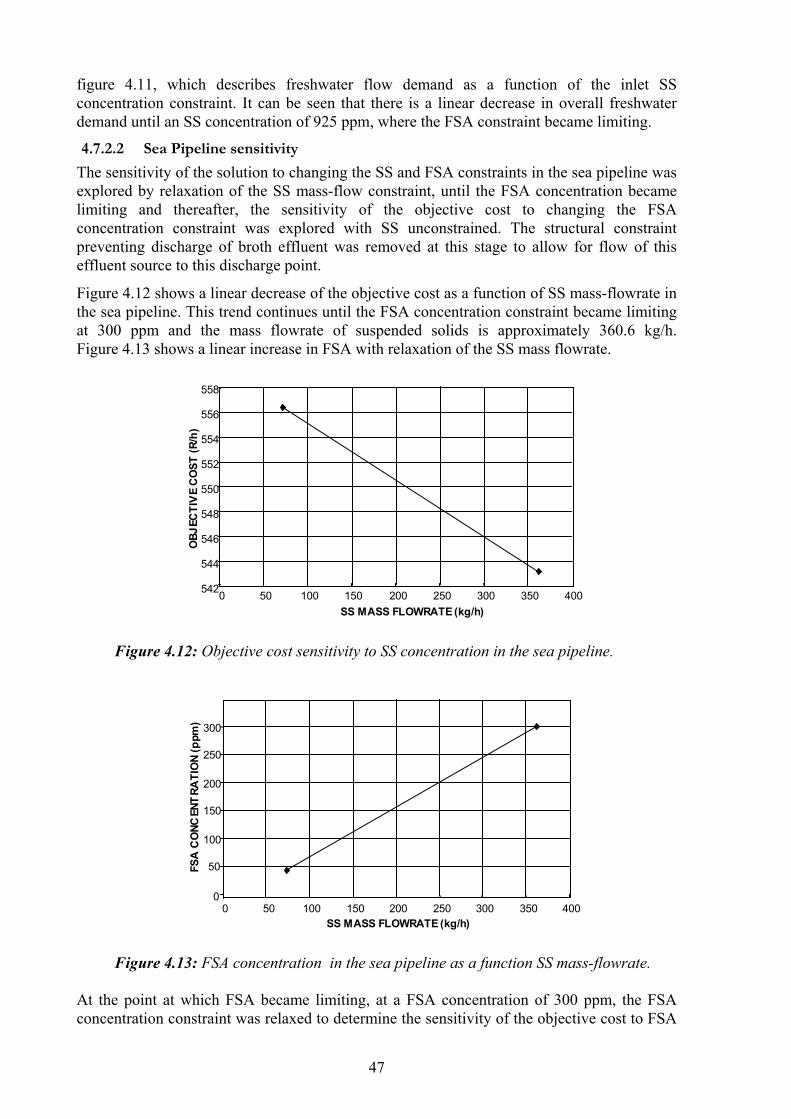
figure 4.11, which describes freshwater flow demand as a function of the inlet SSconcentration constraint. It can be seen that there is a linear decrease in overall freshwaterdemand until an SS concentration of 925 ppm, where the FSA constraint became limiting.
4.7.2.2 Sea Pipeline sensitivity
The sensitivity of the solution to changing the SS and FSA constraints in the sea pipeline wasexplored by relaxation of the SS mass-flow constraint, until the FSA concentration becamelimiting and thereafter, the sensitivity of the objective cost to changing the FSAconcentration constraint was explored with SS unconstrained. The structural constraintpreventing discharge of broth effluent was removed at this stage to allow for flow of thiseffluent source to this discharge point.
Figure 4.12 shows a linear decrease of the objective cost as a function of SS mass-flowrate inthe sea pipeline. This trend continues until the FSA concentration constraint became limitingat 300 ppm and the mass flowrate of suspended solids is approximately 360.6 kg/h.Figure 4.13 shows a linear increase in FSA with relaxation of the SS mass flowrate.
542
544
546
548
550
552
554
556
558
OBJ
ECTI
VE
CO
ST (R
/h)
SS MASS FLOWRATE (kg/h)0 50 100 150 200 250 300 350 400
Figure 4.12: Objective cost sensitivity to SS concentration in the sea pipeline.
0
50
100
150
200
250
300
0 50 100 150 200 250 300 350 400SS MASS FLOWRATE (kg/h)
FSA
CO
NCEN
TRA
TIO
N (p
pm)
Figure 4.13: FSA concentration in the sea pipeline as a function SS mass-flowrate.
At the point at which FSA became limiting, at a FSA concentration of 300 ppm, the FSAconcentration constraint was relaxed to determine the sensitivity of the objective cost to FSA
47

concentration. The objective cost was plotted as a function of FSA concentration infigure 4.14. Initially, in can be seen that the objective cost decreases linearly with anincreasing FSA concentration constraint. However, after a concentration of 5 000 ppm wasreached in the sea pipeline, the rate of cost decrease increases slightly. The reason for thisbecame clear when the SS mass flowrate was plotted as a function of FSA concentration infigure 4.15. After a concentration of 5 000 ppm was reached, the SS mass flowrate increasedat a higher rate than the FSA. Thus the volume discharged to the sea pipeline increased at thisFSA concentration constraint in order to accommodate a higher flow of broth effluent and theflowrate of freshwater increased in order to dilute the effluent.
0
100
200
300
400
500
600
OBJ
ECTI
VE
CO
ST (R
/h)
FSA CONCENTRATION (ppm)0 1000 2000 3000 4000 5000 6000 7000
Figure 4.14 : Objective cost sensitivity to FSA concentration in the sea pipeline.
The sensitivity of the configuration to increasing the FSA concentration constraint in seapipeline was explored in figure 4.15, which shows the plot of sea pipeline effluent flowrateand freshwater flowrate as a function of FSA concentration.
0
1x10³
2x10³
3x10³
4x10³
5x10³
6x10³
7x10³
8x10³
9x10³
0 1000 2000 3000 4000 5000 6000 7000FSA CONCENTRATION (ppm)
SS M
ASS
FLO
WRA
TE (k
g/h)
Figure 4.15: SS mass-flowrate as a function of the FSA constraint in the sea pipeline.
The flowrate of effluent discharged to the sea pipeline increased above the rate predicted by alinear relationship. The freshwater flowrate increased from 60.95 t/h to 67.26 t/h in order toproduce a more dilute effluent. This flowrate was maintained until the concentration of FSAin the sea pipeline rose above 6 000 ppm. At this point the freshwater flowrate dropped to62.3 t/h.
48

0
20
40
60
80
100
120
140
160
0 1000 2000 3000 4000 5000 6000 7000FSA CONCENTRATION (ppm)
FW A
ND E
FFLU
ENT
FLO
WRA
TE (t
/h)
Flow rate to sea pipelineFreshwater f lowrate
Flow rate to sea pipelineFreshwater f lowrate
Figure 4.16 : Sensitivity of the design to FSA concentration in the sea pipeline(in terms of freshwater and effluent flowrate).
Pure cond.
Cooling tower
Pump seals
PIX ads.
PIX BW.
SIX acid
PIX strip
PIX NH3 dil
SIX rinse
Ferment
UOS water
Sea pipeline
SWW
AS cond.
UOS diln.
Water-using operation
Splitter Mixer
Scenario A: FSA 5000ppm in sea pipelineWater flowrate: 67.26 t/h Operating cost: 257.73 R/h
CIP
Figure 4.17: Configuration of the water-using system with the FSA concentrationconstraint in the sea pipeline relaxed to 5 000 ppm and SS unconstrained. (Scenario A).
The configuration of the water-using system with the FSA concentration constraint set to5 000 ppm in the sea pipeline and SS unconstrained is shown in figure 4.17. The significant
49
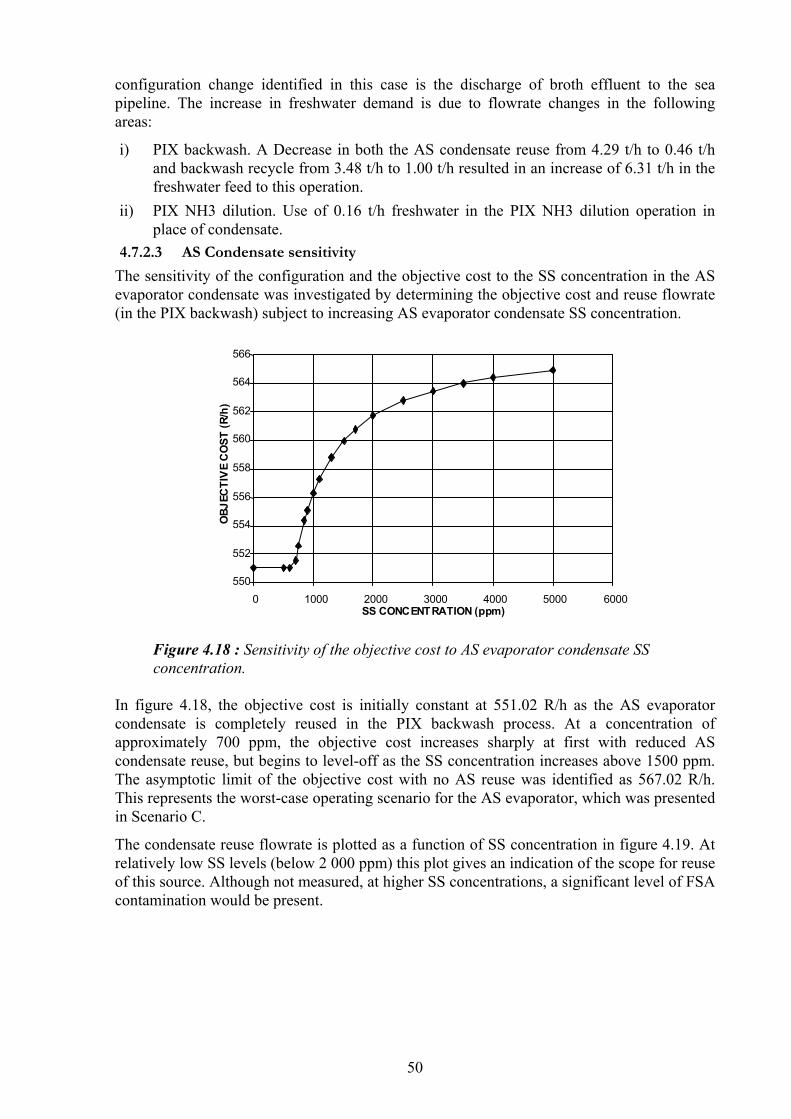
configuration change identified in this case is the discharge of broth effluent to the seapipeline. The increase in freshwater demand is due to flowrate changes in the followingareas:
i) PIX backwash. A Decrease in both the AS condensate reuse from 4.29 t/h to 0.46 t/hand backwash recycle from 3.48 t/h to 1.00 t/h resulted in an increase of 6.31 t/h in thefreshwater feed to this operation.
ii) PIX NH3 dilution. Use of 0.16 t/h freshwater in the PIX NH3 dilution operation inplace of condensate.
4.7.2.3 AS Condensate sensitivity
The sensitivity of the configuration and the objective cost to the SS concentration in the ASevaporator condensate was investigated by determining the objective cost and reuse flowrate(in the PIX backwash) subject to increasing AS evaporator condensate SS concentration.
550
552
554
556
558
560
562
564
566
0 1000 2000 3000 4000 5000 6000SS CONCENTRATION (ppm)
OBJ
ECTI
VE
CO
ST (R
/h)
Figure 4.18 : Sensitivity of the objective cost to AS evaporator condensate SSconcentration.
In figure 4.18, the objective cost is initially constant at 551.02 R/h as the AS evaporatorcondensate is completely reused in the PIX backwash process. At a concentration ofapproximately 700 ppm, the objective cost increases sharply at first with reduced AScondensate reuse, but begins to level-off as the SS concentration increases above 1500 ppm.The asymptotic limit of the objective cost with no AS reuse was identified as 567.02 R/h.This represents the worst-case operating scenario for the AS evaporator, which was presentedin Scenario C.
The condensate reuse flowrate is plotted as a function of SS concentration in figure 4.19. Atrelatively low SS levels (below 2 000 ppm) this plot gives an indication of the scope for reuseof this source. Although not measured, at higher SS concentrations, a significant level of FSAcontamination would be present.
50

0
1
2
3
4
5
6
7
0 1000 2000 3000 4000 5000 6000SS CONCENTRATION (ppm)
AS
CO
ND. R
EUS
E FL
OW
(t/h
)
Figure 4.19: Sensitivity of reuse flowrate to AS evaporator condensate SSconcentration.
4.8 Evaluation of the results
The scenarios investigated were compared with a base-case network design. Improvements tothe base-case design are discussed below for each scenario. The implications of relaxation ofthe concentration constraints to the PIX backwash and the sea pipeline, as well as changes inthe outlet SS concentration of the AS evaporator condensate, are discussed. Based on theresults, suggestions have been made to improve operating conditions, which are in line withthe aims of the investigation.
4.8.1 Scenario A
This scenario examined the case where the AS evaporator condensate at a SS concentrationof 1 000 ppm, in which case reuse (to the PIX backwash inlet) is barely allowed. Whencompared with the base-case operating conditions, the following savings were identified:
An objective cost decrease of 3.43 R/h or 0.61 % was identified.This saving was incurred by a 1.37 t/h reduction in freshwater flowrate
(approximately 2.2 % reduction) resulting from a recycle of water in the PIXbackwash, with a recycle rate of 3.48 t/h.
4.8.1.1 PIX recycle
The solution for Scenario A identified the configuration change of the recycle of PIXbackwash effluent back to the inlet. The AS condensate reuse in the PIX backwash wasreduced; 4.29 t/h was reused, as opposed to 6.40 t/h in the base-case design, the remainingwater demand being made-up by the combination of the PIX backwash recycle withfreshwater. While this configuration change may seem counter-intuitive, using the totalcondensate source (at a concentration of 1 000 ppm) as feed to the PIX backwash preventsthe backwash recycle, due to the comparatively high SS concentration in the condensatesource. Consequentially, more freshwater was used in the base-case model, which wasrequired to dilute the AS condensate to meet the inlet concentration constraint for the PIXbackwash operation. Amino acid contaminants, which are not considered in the model, willrequire removal in order to make it possible to recycle. The viability of this would requirefurther investigation.
51

In addition, this design change may identify an improved operating practice, as theconcentration and flowrate of the PIX backwash is more predictable than that of the ASevaporator condensate, thereby providing a reliable source for reuse or recycle.
4.8.2 Scenario B
This scenario examined the case where the AS evaporator condensate is pure, which reflectsthe best-case operating conditions for this unit operation. When compared with the base-caseoperating conditions, the following savings were identified:
An objective cost decrease of 8.71 R/h or 1.56 % was identified.The operating cost saving was incurred by a 3.48 t/h reduction in freshwater
flowrate (approximately 5.6 % reduction) arising from an increase in thedegree of reuse / recycle of water in the following areas:
PIX backwash recycle of 3.48 t/h;Total AS evaporator condensate integration.
The cost reduction identified in this scenario, less the saving identified in Scenario A, reflectsthe upper limit for annualised capital investment in process improvements - while sustainingan overall saving - that would lead to the AS evaporator condensate being of a suitablequality for total reuse. This amount is approximately 5.28 R/h, or R 45 619 per annum.
4.8.3 Scenario C
This scenario looked the case where there was no reuse of AS condensate (reuse wasprevented by the inclusion of a structural constraint). This reflects a worst-case operatingcondition for the water-using network model. In this case, the AS evaporator condensate isdischarged directly to the sea pipeline. When compared with the base-case model, an increasein cost of 1.30 % was identified, although when compared to normal operating conditionswith no reuse of AS evaporator condensate, an improved network configuration wasidentified which lead to a saving of 1.54 %. The improvement was made possible by the PIXbackwash recycle, as in Scenario A and B.
4.8.4 AS Evaporator condensate reuse
By testing the model under a range of AS evaporator condensate SS concentrations, the scopefor reuse of this source was ascertained (section 4.7.3). As illustrated in figure 4.20, atconcentrations below 700 ppm, the AS condensate is of a suitable contaminant concentrationfor total reuse, without requiring freshwater dilution, hence the objective cost and freshwaterflowrate are constant within this range. As the concentration increased, an inverserelationship between reuse flowrate and concentration was observed. The proportionalityconstant, p, was calculated by multiplying the flowrate values by the concentration values inthis region. Above 2000 ppm reuse has been prohibited due to the likely presence of FSA(this level has been assumed and would need to be further investigated). Hence therelationship between reuse flowrate and outlet concentration may be expressed as follows:
(4.1)
( ) out
cond AS SS
out cond AS SS
out cond AS SS bw PIX cond AS
out cond AS SS
C
C C p F
C
,
, 1 -
, ,
,
2000 ppm if
2000 ppm 700 ppm if 0
40 . 6 700 ppm if
≤
< ≤ ⎪ ⎩
⎪ ⎨
⎧
⋅ =
<
where p = 4284.00 t/(h·ppm) ± 0.79% for outlet SS concentrations in the specified range.The deviation in a is a result of small fluctuations in the computation of the result, which is acharacteristic of the software
52

0
1
2
3
4
5
6
7
0 1000 2000 3000 4000 5000SS CONCENTRATION (ppm)
AS
CO
ND. R
EUS
E FL
OW
(t/h
)
(a) (b) (c)
Figure 4.20 : AS evaporator condensate reuse flowrate as a function of outletconcentration of SS.
In the region Cout < 700 ppm (a), complete reuse of the condensate is allowed. In the region700 ppm = Cout < 2 000 ppm (b) the reuse flowrate is governed by the inverse relationship ofequation 4.1. For outlet concentrations greater than 2 000 ppm reuse is probably preventeddue to the presence of FSA.
Equation 4.1 could be used as an improved control measure for the flowrate of the ASevaporator condensate to the PIX backwash. At the time of the investigation the FSAconcentration in the AS evaporator condensate was not measured. At the time of theinvestigation, the operating practice was to prevent all reuse of AS evaporator condensate atSS concentrations greater than 1 000 ppm.
4.8.5 Sea pipeline constraints
Relaxation of the constraints associated with the pipeline showed the greatest scope for costreduction.
4.8.5.1 SS mass-flowrate constraint
The potential for saving was investigated by relaxing the SS mass-flowrate constraint fromits setting, at the time of the investigation, of 75 kg/h (which corresponds to a concentrationof 666 ppm) over a range. At the point at which the FSA concentration constraint becamelimiting (at a SS mass-flowrate of 360 kg/h), the objective cost had decreased to 543 R/h.This corresponds to a financial saving of 2.9 % when compared with the base-case objectivecost. No further freshwater savings were incurred (apart from those identified in Scenario A),as the additional financial saving was associated with a reduction in flowrate of broth effluentto the SWW.
4.8.5.2 FSA constraint
At the point at which the FSA constraint became limiting, the SS constraint was removed andthe FSA concentration constraint was relaxed over a range to determine the potential forfurther improvement. As before, a linear decrease in the objective cost was observed, until aFSA concentration constraint of approximately 4 500 ppm was reached. At this point thefreshwater flowrate increased slightly to dilute the effluent and allow for an increase in therate of discharge of broth effluent via the sea pipeline. This dilution was permitted in thiscase as the concentration constraint did not prevent an increase in effluent flowrate, as a
53

result of dilution with freshwater. Although this occurred at a high concentration constraint itmay be inferred from this result that concentration constraints can in some cases becounter-productive, i.e.. operating conditions can be worsened instead of improved inattaining an economically efficient solution.
4.8.5.3 Unconstrained sea pipeline
The total potential for saving (i.e.. when all the sea pipeline constraints are removed) was asfollows:
The objective cost decreased to 157 R/h, which corresponds to a saving of72 %. This was mainly accomplished by discharge of all broth effluent via thesea pipeline, effectively making the SWW discharge point redundant.No further freshwater saving was identified (apart from those identified in
Scenario A) with the removal of the sea pipeline constraints.4.8.6 Overall saving
The structure of the optimised water-using network is almost invariant for all outletconditions of the AS evaporator condensate. As discussed above, the only alteration in theoptimal configuration is the incorporation of the PIX backwash recycle. This remained at aflowrate of 3.48 t/h for all scenarios investigated. However, varying the flowrate of the ASevaporator condensate to compensate for fluctuation in the level of impurities requires aprocess modification that will involve further capital investment.
The distribution of operating concentrations for the AS evaporator condensate is unknown,hence determining the average overall annual saving that would be accrued by implementingthe discussed changes is indefinite. The saving identified in each scenario is illustrated bycomparison with the base-case operating cost (figure 4.21).
535
540
545
550
555
560
565
570
575
580
SS CONCENT RATION
OBJ
ECTI
VE
CO
ST (R
/h)
Optimal 551.02 556.3 567.02
normal 559.73 559.73 575.73
Scenario B – 0 ppm Scenario A – 1000ppm No reuse
Figure 4.21 : Comparison of the optimal design cost with the current water-usingnetwork operating cost.
Figure 4.21 shows that the optimal water-using network hourly operating cost lies betweenR 551 with complete integration of the AS evaporator condensate, and R 567 with no reuse.In terms of percentage saving, a minimum saving of 0.61% (Scenario A) and a maximumsaving of 1.56 % (Scenario B) is attainable, with no relaxation of the limiting concentration
54

constraint. This saving corresponds to a minimum freshwater saving of 2.2 % and amaximum saving of 5.6 %.
4.8.7 Barriers to saving
Two kinds of limiting constraints were identified, those due to the process technology, andthose due to the environmental regulations.
4.8.7.1 Technical obstacles to process integration
The Scenario A objective function was shown (in figure 4.5, section 4.6.1.1) to be mostsensitive to changing the SS and FSA constraint at the inlet to the PIX backwash. Relaxationof the inlet constraint for SS resulted in an increase in reuse of contaminated AS evaporatorcondensate, thereby further reducing the overall freshwater demand. It was demonstrated (infigure 4.11) that a larger saving could be realised if the inlet SS constraint to the sea pipelinewas relaxed, which allowed for all process effluent, with the exception of the broth effluent(a structural constraint prevented the broth effluent from entering the sea pipeline) to bedischarged to this point. Hence, the analysis demonstrated that the SS concentrationconstraint at the sea pipeline was the critical constraint limiting economic saving, as well aslimiting improvement of operating conditions through increased process integration.
4.8.7.2 Broth effluent discharge regulations
At the time of the investigation, the regulations concerning the broth effluent preventeddischarge of this effluent source via the sea pipeline. It was demonstrated that partial orcomplete relaxation of the sea pipeline constraint along with the removal of the structuralconstraint that forbids discharge of the broth effluent to the sea pipeline, resulted in thelargest potential economic saving. The cost of discharging to the SWW amounts to 400 R/han amount which is 71 % of the base-case water-using system operating cost, and between98 % (Scenario B operating conditions) and 99 % (Scenario A operating conditions) of thetotal achievable saving. In order to effectively reduce overall water usage costs, this effluentsource must be addressed. Some suggestions are as follows:
Investigate feasibility of a broth effluent recycle as suggested by Hsiao andGlatz (1996). This would require prior removal of the HTM ash contaminant.Implement a quantitative constraint for the sea pipeline that is in line with the
impact of the broth effluent source, as opposed to the current practice offorbidding any discharge from this source via the sea pipeline. Dischargingeffluent at night, for example, may circumvent aesthetic issues, if dispersion inthe sea is adequate.
55

4.8.8 Summary of results
The reductions to the cost of operating the water-using network and freshwater consumptionidentified in the investigation are summarised in table 4.12.
Table 4.12 : Summary of economic and freshwater savings at AECI Bioproducts.
5.583.4872.93408.19Total
3.392.110.945.26AS condensate reuse (Scenario B).
0071.38399.52Discharge of Broth effluent to sea pipeline.
2.21.370.613.41PIX backwash recycle.
% (t/h)%(R/h)
Freshwater savingCost savingAction
4.9 Discussion and conclusions
This case study had the following notable features:
1) It demonstrated the use of the Linnhoff-March WaterTarget software and themathematical programming approach to water pinch analysis. It was limited to utilitywater streams and process effluent, considered multiple contaminants, an economicobjective function, and used sensitivity analysis extensively.
2) Although it was not able to identify significant water savings, it did identify significantcost savings, which is in strong contrast to the classical pinch analysis methodology.
3) The nature of these cost savings raised some interesting issues. The pinch analysisdemonstrated that savings were prevented by the external limit on the concentration ofsuspended solids (SS) constraint at the sea pipeline. Saving could be achieved byrelaxing this constraint and allowing for discharge of broth effluent to the sea. At R16 /t,the hourly cost of disposing the broth effluent at the local wastewater treatment worksamounted to R400 /h, approximately 72% of the total water-using network operating costof R 556 /h. Thus, the DWAF effluent discharge permit concerning the broth effluent,with its SS constraint of 400 mg/L at the sea outfall, was established as the major barrierto further savings. Subsequently to the study, the factory applied to DWAF to allow thedischarge of broth effluent to sea, and to increase the 400 mg/L SS limit. The reason forsetting this limit had been purely to avoid an unsightly stain of the sea surface, and thescientific basis for the value of 400 mg/L was far from certain. However, DWAF wouldnot consider environmental arguments for relaxing it until the factory had demonstratedthat it had reached the limit of what could be achieved by improving its operation. Thepinch analysis was accepted as evidence that this was indeed the case, so it was agreed torelax the limits, subject to monitoring the resulting condition of the sea. To date noadverse effects resulting from the discharge have been detected.
4) This outcome suggests a useful role for pinch analysis in the interaction betweenindustries and regulatory authorities in establishing the parameters of water use permits.It offers systematic and transparent analysis of the industry’s water needs which couldprovide the basis for trust between the parties. However, it does require a capacity inboth parties to understand and question the basis of the analysis.
56
5 THE MONDI PAPER MILL AT MEREBANK,
DURBAN
During the project three studies were started at paper mills, Mondi Merebank, Sappi Tugelaand Sappi Ngodwana. All three were undertaken by process engineers at the respectivecompanies, who enrolled part-time for MScEng degrees. Unfortunately only the MondiMerebank study was complete at the time that this report was compiled. However, becausethe students involved met regularly to exchange experiences, the others had a significantinfluence on the success of this one. This chapter is based on the MScEng thesis of GladysNaylor (née Crampton).
5.1 Process description
The Mondi Paper mill at Merebank in south Durban is an integrated pulp and paper mill,producing three types of pulp, supercalendered magazine paper, uncoated woodfree paper,newsprint, telephone directory and carbonless coated paper. The three types of pulpproduced at Mondi Paper are:
thermomechanical pulpgroundwood pulprecycled fibre pulp
The groundwood and thermomechanical pulps are produced by mechanically separating thefibres from other wood constituents, by means of log grinding in the groundwood process andchip refining in the thermomechanical process.
The fibre sources used in the production of the pulp and paper are:
logs and chips - pinerecycled paper - newspapers and magazineschemical pulp - hardwood pulp produced from eucalyptus wood and
softwood pulp produced from pineThere are five paper machines at Mondi Paper producing the following paper grades:
Paper Machine 1 Supercalendered magazine paper
Paper Machines 2 and 3 Uncoated woodfree paper
Paper Machines 4 and 5 Newsprint and telephone directory
Some of the uncoated woodfree paper produced at the mill is coated with microcapsules, on aseparate coating machine, to produce carbonless coated paper.
The steam requirements of the mill are supplied by the power plant which comprises two coalfired boilers, two standby oil boilers and two standby gas boilers. The coal boilers supply thesteam required to produce the pulp and dry the paper.
The paper produced is wound into various size reels to meet customers' requirements or cutinto sheets and sold as flat sheets.
57

5.1.1 Pulp mill
The pulp mill consists of the wood yard as well as the three pulping plants, namely thethermo-mechanical pulping plant, the groundwood pulping plant and the recycled fibrepulping plant.
5.1.1.1 Wood yard
The wood used in the thermomechanical and groundwood pulping processes arrives at Mondiin the form of logs and chips. The logs are transported to the mill via rail trucks and roadtrucks. The production of pulp requires approximately 1 600 t of logs per day.
The logs are debarked in a dry drum debarker and then fed to the saw decks to be cut intosmaller logs for the groundwood pulping process or fed to the chipper to be chipped for thethermo-mechanical pulping process.
5.1.1.2 Thermo-mechanical Pulping
Thermo-mechanical pulping produces pulp with high tearing resistance for newsprint andtelephone directory paper. The process involves steaming wood chips under pressure for ashort period of time prior to and during refining. The steaming, which happens in thedigester, softens the chips and the result is a greater percentage of long fibres in the pulpproduced and fewer shives. The heating and first stage refining are carried out underpressure, while the second stage refining is carried out at atmospheric pressure.
The refiner consists of two revolving discs driven in opposite directions by two electricmotors. The chips are fed in between the discs at the centre of the discs and the centrifugalforce forces the chips along the discs and over the edges. Consistency control of the stock isvery important as it plays a large part in the retention time of the stock between the plates.
Plate pattern
Chips
Pulp
Figure 5.1: Principle of refining
After refining, the stock is screened and cleaned and finally thickened, before being fed to thepaper machines. The purpose of screening and cleaning is to remove unseparated fibrebundles, shives, and other undesirable components (e.g. dirt particles) from the pulp stream.The objective of thickening is to remove water containing impurities dissolved duringpulping and to raise the consistency of the stock before it is pumped to the paper machines.
5.1.1.3 Groundwood pulping
In the stone groundwood process, pulp is produced by pressing logs against an abrasiverotating stone surface. The logs are oriented parallel to the axis of the stone so that thegrinding action removes intact fibres.
58
Temperature control by showering is an important aspect of the grinding operation sincevirtually all the grinding energy is dissipated as heat in the grinding zone. Too much coolingwater will impede the softening action, while insufficient cooling water will allow the woodto become charred.
5.1.1.4 Recycled fibre pulping
The raw material for this process is newspapers and magazines. The recycled fibre processremoves contaminants, including ink, from the waste paper and produces clean fibre forpaper making.
Ink is separated from the fibres by chemical and mechanical action and removed from thestock by flotation. Other contaminants are removed by sorting, screening and cleaning. Theprocess comprises of the following stages:
5.1.1.5 Waste paper repulping
Bales of waste paper are slushed in a high consistency batch pulper at about 14 %. Setamounts of water and chemicals are added at the start of the repulping cycle. A combinationof chemical and mechanical action separates the fibres and loosens the ink particles from thefibres.
After repulping the stock is diluted to 4-5 % consistency and dumped through a coarsescreen, where the largest contaminants are removed. Accepted stock is pumped to a tankwhere chemical reaction continues. Water for repulping is heated to 50 °C with direct steaminjection. The chemicals added to the pulper are: caustic soda, sodium stearate, sodiumsilicate and hydrogen peroxide.
5.1.1.6 High density cleaning and screening
After the pulper the process becomes continuous. Contaminants with a high density areremoved in the high density cleaners and other large contaminants are removed in the coarsescreens. The consistency of the stock is controlled to approximately 3 % by the addition ofcloudy filtrate.
5.1.1.7 Flotation
Once the larger contaminants have been removed from the stock, it is fed to the flotation cell.Here the ink is removed from the process using air bubbles and calcium ions. Calcium soapsform in the hard water conditions. These act as collectors for the ink particles by attaching tothe ink particles and also attaching to the air bubbles. The air bubbles carry the ink to thesurface and are removed by overflows. Stock in the flotation feed tank is diluted to 1.2 % bythe addition of cloudy filtrate dilution water. The pH of the stock flowing to the flotation cellis controlled to a preset value, normally 8.5, by the addition of sulphuric acid. The pH isadjusted to this level to prevent precipitation of calcium salts in the flotation cells. Calciumchloride solution is added to give the required amount of water hardness.
5.1.1.8 Cleaning for removal of lightweight rejects
After the flotation cell, the next sections of the plant are designed to remove the smallercontaminants by centrifugal cleaning and fine screening. Stock is first pumped throughrotary, horizontal hydrocyclones, which efficiently remove the light weight contaminants,those with specific gravity of less than one.
5.1.1.9 Cleaning for removal of heavy rejects
Fine sand, grit and heavy clay particles with specific gravity of greater than one are removedby a four stage, cascade cleaner plant.
59

5.1.1.10 Screening with pressure screens
Final cleaning of the stock is achieved by pressure screens. A three stage cascadearrangement is used. These screens have slotted baskets with a slot width of 0.25 mm andremove any fibre clumps which are still held together.
5.1.1.11 Thickening and washing
In this section of the plant the chemicals from the de-inking process are removed from thestock by thickening it to remove the alkaline, de-inking process water. Accepted stock fromthe fine screens is thickened to about 10 % consistency and then diluted to approximately5 % consistency with cleaner water. The stock is then thickened to approximately 30 % in awire pulp press to prevent water from being carried over from the pulp mill to the papermachines. The pH is adjusted to the level used on the paper machines. This is so that extrastickies which precipitate at low pH can be dispersed in the disperser. A displacementwashing section of the press uses paper machine water to replace up to 30 % of the processwater.
5.1.1.12 Dispersion
Other chemical contaminants and remaining ink particles are made less troublesome bydispersing them evenly throughout the stock. Stock from the wire pulp press is heated tosoften stickies such as hot melt adhesives and other similar contaminants. The disperser alsoremoves any ink particles still attached to the fibres and breaks them up into smaller particlesso that they are less noticeable. The dispersing section consists of a heating screw and adisperser. The stock is pushed through the screw and heated by direct injection of steam.The temperature is normally controlled to about 90 °C to melt the stickies and adhesives.After the disperser the stock is diluted to 10 to 12 % consistency using water from the papermachines.
5.1.2 Paper mill
The paper mill consists of the stock preparation plant, the additives plant and five papermachines.
5.1.2.1 Additives plant
Additives is the term used to describe a wide range of chemicals and other substances used inthe manufacture of paper. The additives plant is where these substances are mixed and storedbefore they are dosed to the paper machines.
5.1.2.2 Stock preparation plant
Pulp bales
ConveyorWater
PulperDumpChestWater
Pulper
Figure 5.2 : Slushing of baled pulp
60

The chemical pulp purchased primarily for the production of uncoated woodfree grades, aswell as for strength properties in the other paper grades, is delivered to Mondi Paper in balesof dry pulp. Water and dry pulp bales are fed into a pulper vat and a rotor disintegrates thebales to form the fibre slurry. The objectives of slushing are to disintegrate:
the bales into a pumpable slurry by releasing fibre bonds created in the pulpdewatering and drying processesthe fibre slurry so that there are no visible fibre flakes or bundlesthe fibre slurry so that fibres are separated, wetted, and flexible before
entering the refining stage.The stock preparation plant has nine vertical pulpers, with the rotor located at the bottom ofthe pulper vats. The pulp bales are fed onto conveyors, which feed the bales into the pulpervats. The operation of the pulpers is batch wise and at 5 to 6 % consistency. The fibre slurryis diluted to 4 to 5 % during discharging. Figure 5.2 shows the slushing sequence.
The pulper vat is filled with a given amount of water and a given amount of pulp. The balesare dropped into the pulper, which has been filled with water. Water temperature and pHinfluence the pulper operation. A higher water temperature reduces slushing time and energyrequirement. A low pH means slower water penetration into the fibres and higher energyrequirements in pulping.
5.1.3 Paper machines
The production conditions and parameters on the five paper machines are quite differentaccording to the different paper grades produced. Process conditions have to be stable toensure the required product quality and a high production efficiency. Variation in any of thefollowing can cause problems on the paper machines:
Flow ratePressureTemperatureTurbulence ConsistencyFurnish composition and inorganic solids contentSpecific surface of fibres, content of fines, freenessCharge content, cationic demand, pHContent and distribution of chemicals and additivesUndesired substances and contaminants, including air
The properties of the different paper grades produced on the paper machines are determinedby the properties of the stock components used. The stock is a blend of the differentcomponents in order to achieve the desired paper properties in the most economical way.Figure 5.3 is a schematic diagram of the operations taking place in a paper machine.
61

Blend chest
Machine chest
Wire pit
Cleaners
Deaerator
Screening
Headbox
Former, wires
Pressing and drying
Broke system
Disc filter
Paper
White watertower
Pulp
Figure 5.3 : Block diagram of a paper machine
5.2 Development of a of water pinch model for Mondi Paper
In order to perform a Water Pinch analysis on a site which is as complicated as the Merebankmill, the operation was divided into manageable sections (see Figure 5.4) A flow sheetmodel of the sections was then developed and a water and contaminant balance wasdeveloped, accurate to within 10 % of the metered amounts of the larger streams. Once asufficiently accurate water and contaminant balance was achieved, the streams which werenot variable, and therefore did not form part of the water pinch analysis (e.g. productstreams), were not considered further. In order to perform a water pinch analysis arelationship between streams into and out of the unit operations which make up the sectionswas required. In this study the balance produced using the Water Tracker software was usedto determine these relationships. Once the streams which did not form part of the waterpinch analysis had been removed and the water pinch model of the plant had been developed,this model was tested by forcing the streams to represent the actual plant situation as closelyas possible by introducing flow constraints into the model. The next step involved removingthose constraints which appeared not to be absolutely required in terms of process
62

considerations, and allowing the model to re-route streams in order to achieve a minimumfresh water consumption.
5.2.1 Division of the mill into sections
The Merebank mill can be divided into three main sections based on the paper gradesproduced.
Woodyard
Debarked logs
Wood chips
Groundwood pulping
Thermo-mechanical
pulping
Recycled Fibre Plant
Groundwood pulp
Thermo-mechanical
pulp
Recycled Fibre pulp
PM1 PM4&5 PM1&2
Additives Plant
Stock Preparation
Chemical additives
Chemical pulp (L/F, SF)
SC mechanical paper
Newsprint, Telephone
Directory paperFine paper
Products Processes
Figure 5.4 : Division of the mill into sections
The paper machine number one, producing supercalendered magazine paper, along with thegroundwood pulp mill forms the first section. The second section of the mill consists ofpaper machines numbers two and three which produce fine paper, the additives plant and thestock preparation plant. The third section of the mill consists of the two newsprint papermachines, machines numbers four and five, as well as the woodyard, the thermo-mechanicalpulp mill and the recycled fibre plant. The utility plants which service the production plantinclude are the power plant and the waterworks. These utility sections were not included inthis study.
5.2.2 Choice of key contaminant
In order to perform a pinch analysis at the Merebank mill it was necessary to select keycontaminants which would limit the recycling and reuse of water streams. The keycontaminants which could be considered are as follows:
i) Dissolved solidsii) Suspended solidsiii) COD
In order to perform this water pinch analysis with the information available, the assumptionwas made that in the Merebank mill fibre is the main contaminant in the streams which formpart of the analysis. Data on dissolved solids, COD and temperature of all the streams wasnot readily available. Suspended solids, i.e.. fibre, was therefore selected as the key
63
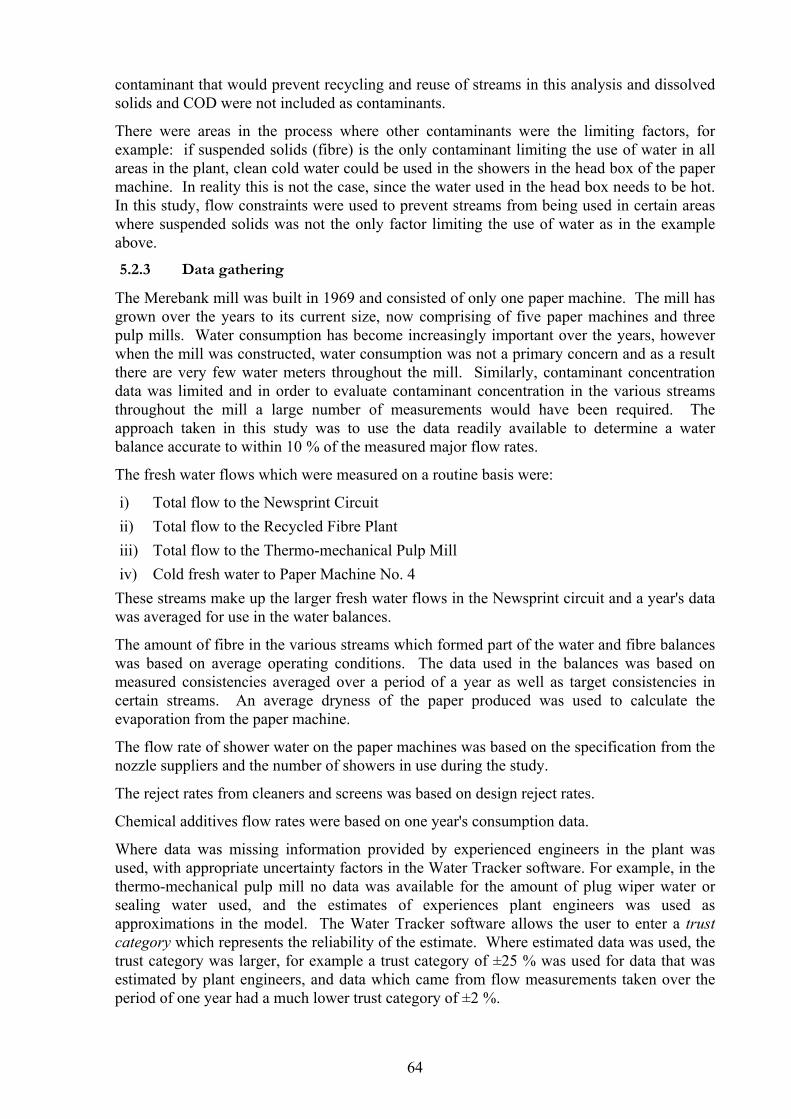
contaminant that would prevent recycling and reuse of streams in this analysis and dissolvedsolids and COD were not included as contaminants.
There were areas in the process where other contaminants were the limiting factors, forexample: if suspended solids (fibre) is the only contaminant limiting the use of water in allareas in the plant, clean cold water could be used in the showers in the head box of the papermachine. In reality this is not the case, since the water used in the head box needs to be hot.In this study, flow constraints were used to prevent streams from being used in certain areaswhere suspended solids was not the only factor limiting the use of water as in the exampleabove.
5.2.3 Data gathering
The Merebank mill was built in 1969 and consisted of only one paper machine. The mill hasgrown over the years to its current size, now comprising of five paper machines and threepulp mills. Water consumption has become increasingly important over the years, howeverwhen the mill was constructed, water consumption was not a primary concern and as a resultthere are very few water meters throughout the mill. Similarly, contaminant concentrationdata was limited and in order to evaluate contaminant concentration in the various streamsthroughout the mill a large number of measurements would have been required. Theapproach taken in this study was to use the data readily available to determine a waterbalance accurate to within 10 % of the measured major flow rates.
The fresh water flows which were measured on a routine basis were:
i) Total flow to the Newsprint Circuitii) Total flow to the Recycled Fibre Plantiii) Total flow to the Thermo-mechanical Pulp Milliv) Cold fresh water to Paper Machine No. 4
These streams make up the larger fresh water flows in the Newsprint circuit and a year's datawas averaged for use in the water balances.
The amount of fibre in the various streams which formed part of the water and fibre balanceswas based on average operating conditions. The data used in the balances was based onmeasured consistencies averaged over a period of a year as well as target consistencies incertain streams. An average dryness of the paper produced was used to calculate theevaporation from the paper machine.
The flow rate of shower water on the paper machines was based on the specification from thenozzle suppliers and the number of showers in use during the study.
The reject rates from cleaners and screens was based on design reject rates.
Chemical additives flow rates were based on one year's consumption data.
Where data was missing information provided by experienced engineers in the plant wasused, with appropriate uncertainty factors in the Water Tracker software. For example, in thethermo-mechanical pulp mill no data was available for the amount of plug wiper water orsealing water used, and the estimates of experiences plant engineers was used asapproximations in the model. The Water Tracker software allows the user to enter a trustcategory which represents the reliability of the estimate. Where estimated data was used, thetrust category was larger, for example a trust category of ±25 % was used for data that wasestimated by plant engineers, and data which came from flow measurements taken over theperiod of one year had a much lower trust category of ±2 %.
64

Another type of data which was used in the mass balances was plant data - for example,pressure readings from pumps were recorded and the corresponding flow rates, from thepump curves, were used to estimate the flows for certain streams. This type of informationwas used where there were no flow measurements available, however the trust category forthese streams was also set to ±25 %.
5.2.4 Water balances
Water balances for each of the sections were performed using the Linnhoff March WaterTracker software, which performs the water and contaminant balance simultaneously. Inwhat follows, only the model of the recycled fibre plant will be presented in detail, as themodels for the other sections followed very much the same pattern.
5.2.4.1 Recycled fibre plant
The Recycled Fibre Plant was divided into functional units and each unit / block analysed.Figure 5.5 shows the breakdown of this section of the plant.
Pulper andPoire Coarse
Screen
High DensityCleaning
CoarseScreening Flotation Gyro
Cleaners
Disperser &HD Tower
Wire PulpPress Disc Filter Fine Screens Centri
cleaners
1
2 3 4 5 6
7
8
9
10
11
12
13
14
15
19
20
16 17 18 21
2322
24
25
26
27313640
303439
28
29
32
33
35
37
38
41 42
43
Pulper andPoire Coarse
Screen
High DensityCleaning
CoarseScreening Flotation Gyro
Cleaners
Disperser &HD Tower
Wire PulpPress Disc Filter Fine Screens Centri
cleaners
1
2 3 4 5 6
7
8
9
10
11
12
13
14
15
19
20
16 17 18 21
2322
24
25
26
27313640
303439
28
29
32
33
35
37
38
41 42
43
Pulp43Hydrosulphite42Steam41White Water40Cloudy Filtrate39Pulp38H2SO437White Water36Clear Filtrate35Cloudy Filtrate34Pulp33Tempered Water32Clear Filtrate31Rejects30Pulp29Cloudy Filtrate28Clear Filtrate27Rejects26Pulp25Clear Filtrate24Rejects23Pulp22Clear Filtrate21Ink Sludge20Pulp19H2SO418CaCl2 17Soap16Cloudy Filtrate15Rejects14Pulp13Cloudy Filtrate12Rejects11Pulp10Cloudy Filtrate9Rejects8Pulp7Steam6Cloudy Filtrate5Caustic Soda4H2O23Sodium Silicate2Waste Paper1
Figure 5.5 : Recycled fibre plant functional units. The bold arrows represent processstreams which were excluded from the pinch analysis.
The function of each unit shown in Figure 5.5 is described in Table 5.1.
65

Table 5.1: Function of each process unit in the Recycled Fibre Plant
Pulp is heated to soften stickies, hot melt adhesives and other similarcontaminants. These contaminants are then dispersed evenly throughoutthe stock. Any ink particles still attached to the fibres are broken up intosmaller particles so that they are less noticeable.
Disperser andHD tower
Pulp is thickened from 5 % to 30 % consistency to remove alkalinede-inking process water
Wire pulppress
Thickening pulp Disc filter
Removal of fibre clumpsFine screens
Removal of fine sand, grit and heavy clay particles with specific gravity > 1
Centricleaners
Removal of smaller, lightweight contaminants (specific gravity <1)
Gyro cleaners
Removal of inkFlotation
Removal of remaining large contaminantsCoarsescreening
Removal of high density contaminants from pulpHigh densitycleaning
Waste paper repulping and coarse screening to remove largestcontaminants
Pulper andPoire Screen
A mass and water balance was performed over these functional units using the Water Trackersoftware. The water flow rates were based on design conditions for the recycled fibre plantas well as the total flow rate of fresh water to this plant, which is metered. The fibre contentof the streams was based on design conditions and on-line consistency measurements in theplant.
5.2.4.2 Thermo-mechanical plant and paper machine sections
The water and contaminant balances for these sections followed the same pattern as for therecycled fibre plant, and are not presented here.
5.3 Water pinch models of the individual sections of the plant
The individual sections of the plant, as described in sections 5.2, were analysed separately todetermine the minimum fresh water consumption in each of these sections of the plant. Thissection describes the methodology used to perform the analysis on the individual plantsections, before considering the analysis of the combined system.
5.3.1 Recycled fibre plant (RFP)
Following the standard methodology of water pinch analysis, the plant was divided intocomponent functional units, as shown in figure 5.6. These are shown without anyinterconnections, since the purpose of the analysis is to find the best set of connections.
66

Pulping
Cloudy filtrate
HD Cleaning Coarsescreening Flotation
Gyro cleaners Centri cleaners Fine screens Disc filter
Wire pulp press
Rejects
Cloudy filtrate
Rejects
Cloudy filtrate
Rejects
Cloudy filtrate
Rejects
Cloudy filtrate
Clear filtrate
Clear filtrate
Fresh water
Clear filtrate
Cloudy filtrate
Rejects
Clear filtrate
Rejects
Clear filtrate
Rejects
Disperser
PM white water
PM white water
Cloudy filtrate
Figure 5.6 : Representation of the Recycled Fibre Plant for the water pinch analysis
The process sources in the recycled fibre plant were:
Cloudy filtrateClear filtratePaper machine white water
The process unit operations were:
PressingCentri-cleaningCoarse screeningFilteringGyro-cleaningHigh density cleaningFine screeningFlotationPulping
The utility source and sink were fresh water and effluent.
The flowrates and fibre content of each source are given in Table 5.2 and 5.3.
Table 5.2 : Utility source flowrates and fibre content in the Recycled Fibre Plant
0VariableFresh water
100VariablePaper machine white water
600VariableClear filtrate
1 000VariableCloudy filtrate
Fibre Content [ppm]
Flowrate [t/h]
Source
67

Table 5.3 : Flow and fibre constraints for process sinks in the Recycled Fibre Plant
600125.6Paper machine white waterRFP Disperser60043.2Paper machine white waterRFP Wire pulp press1 000103.7Clear filtrateRFP Disc filter1 8000Cloudy filtrate1 00050.7Clear filtrateRFP Fine screens
1 000224.4Clear filtrateRFP Centricleaners1 00096.7Clear filtrateRFP Gyrocleaners1 800251.7Cloudy filtrateRFP Flotation1 8003.7Cloudy filtrateRFP Coarse Screening1 80087Cloudy filtrateRFP High Density Cleaning1 800288Cloudy filtrateRFP Pulping
Max Fibre [ppm]
Flow [t/h]StreamOperation
* RFP: Recycled fibre plant
The model represented by the above figures was analysed using the Linnhoff-MarchWaterPinch software. This water pinch analysis of the recycled fibre plant in isolation wasunable to identify a significant reduction in fresh water consumption. The minimum freshwater consumption determined by the water pinch analysis was 45 t/h while in reality theprocess consumes 44 t/h, based on a production of 150 t/day. The routing of the streams inthe water pinch solution differed in some detail from the actual plant configuration, howeverthis could be expected since multiple optimal solutions often occur for simple objectivefunctions. These are referred to in optimisation theory as degenerate solutions. It is possiblefor the flows to be split in different ways between various units and still give rise to the sameoptimum objective function value. The difference in the amount of fresh water consumptiondetermined by the water pinch model and the actual plant consumption was negligible, andcould be attributed to the accuracy of the data available for producing this model.
5.3.2 Thermo-mechanical pulp mill (TMP)
The thermo-mechanical pulp mill was broken down into functional units for the pinchanalysis as shown in Figure 5.7.
68

Figure 5.7 : Grouping of equipment in the TMP mill. The dotted lines indicate theplant equipment that were grouped together for the water pinch analysis.
The resulting set of functional units representing the thermo-mechanical pulp mill are shownin figure 5.8.
Chip washer
Cloudy filtrate
HydrasievesL1 to L4 Primary Refiners
L1 to L4 Sec Refiners
TMP1 & TMP2 Latency Chests
and screens
L1 to L4 Deckers
Reject System Cooling
Dirty chip wash water Rejects
Fresh water
Fresh water
Fresh water
Cloudy filtrate
Rejects
Clear filtrate
Cloudy filtrate
Hydrasieves filtrate
Dirty chip wash water
Hydrasieves filtrate
Clear filtrate
Cloudy filtrate
Cooling water
Figure 5.8 : Representation of the TMP mill for the water pinch analysis
The flowrates and fibre content of each source are given in Table 5.4 and 5.5.
69

Table 5.4 : Process source flowrates and fibre content in the TMP mill.
0VariableFresh water
100VariablePaper machine white water
600VariableClear filtrate
1000VariableCloudy filtrate
Fibre Content [ppm]
Flowrate[t/h]
Source
Table 5.5 : Flow and fibre constraints for process sinks in the TMP plant.
020Fresh waterCooling2000277.2Cloudy filtrateReject system1000120Clear filtrateLine 4 Decker1000120Clear filtrate Line 3 Decker1000120Clear filtrate Line 2 Decker1000120Clear filtrate Line 1 Decker1000398.65Cloudy filtrateTMP1 Latency and screens1000398.65Cloudy filtrateTMP1 Latency and screens0126.35Fresh waterLine 4 Secondary Refiner0126.35Fresh waterLine 3 Secondary Refiner0126.35Fresh waterLine 2 Secondary Refiner0126.35Fresh waterLine 1 Secondary Refiner00.01Fresh waterLine 4 Primary Refiner00.01Fresh waterLine 3 Primary Refiner00.01Fresh waterLine 2 Primary Refiner00.01Fresh waterLine 1 Primary Refiner4000395.7Dirty chip wash waterHydrasieves3000376.15Hydrasieves filtrate300022.27Cloudy filtrateChip washer
Max FibreFlow[t/h]StreamOperation
The process sources in the thermo-mechanical pulp mill were:
Paper machine white waterClear filtrateCloudy filtrate
The utility source and sink were fresh water and effluent.
The process unit operations were:
Sealing waterLine 1 to Line 4 DeckersReject SystemCoolingHydrasievesChip washer
70

The process sinks were:
Line 1 to Line 4 Primary refinersLine 1 to Line 4 Secondary refinersTMP1 and TMP2 Latency and screens
The model represented by the above figures was analysed using the Linnhoff-MarchWaterPinch software. This water pinch analysis of the thermo-mechanical pulp plant inisolation was unable to identify a significant reduction in fresh water consumption. Theminimum fresh water consumption determined by the water pinch analysis was 182 t/h whilein reality the process consumes 185 t/h, based on a production of 150 t/day of paper per line.As was the case in the water pinch analysis of the recycled fibre plant, the routing of thestreams within the water pinch solution differed from the actual plant configuration. Thissolution is once again an example of a degenerate solution, as was the case in the recycledfibre plant, where difference routings of the streams gave rise to the same objective functionvalue. The difference between the actual consumption of fresh water in thethermo-mechanical pulp mill and the modelled minimum fresh water consumption is simply areflection of the accuracy of the data used to develop the model and does not represent anreal opportunity for fresh water saving.
5.3.3 Paper machines
In view of the results for the other two sections, an individual water pinch analysis of thepaper machines was not carried out when it was realised how limited opportunity there wasfor re-routing streams, since the paper machines were already effectively countercurrentsystems. However, the units making up the paper machines (figure 5.9) were subsequentlyincorporated in the combined pinch analysis of the entire newsprint circuit (see section 5.4)
Blend Chest
Fresh water
Silo Cleaners and Deculator Headbox
Forming Section Press Section Saveall
White water
Rejects
Fresh water
Clear filtrate
Cloudy filtrate
Fresh water
White water
Fresh water
White water
Cloudy filtrate
Figure 5.9 : Representation of a paper machine for the water pinch analysis
5.4 Water pinch analysis of the newsprint circuit
The Newsprint circuit, as described earlier, is the combination of the individual sectionsconsidered earlier: recycled fibre plant, the thermo-mechanical pulp mill and the papermachines.
71
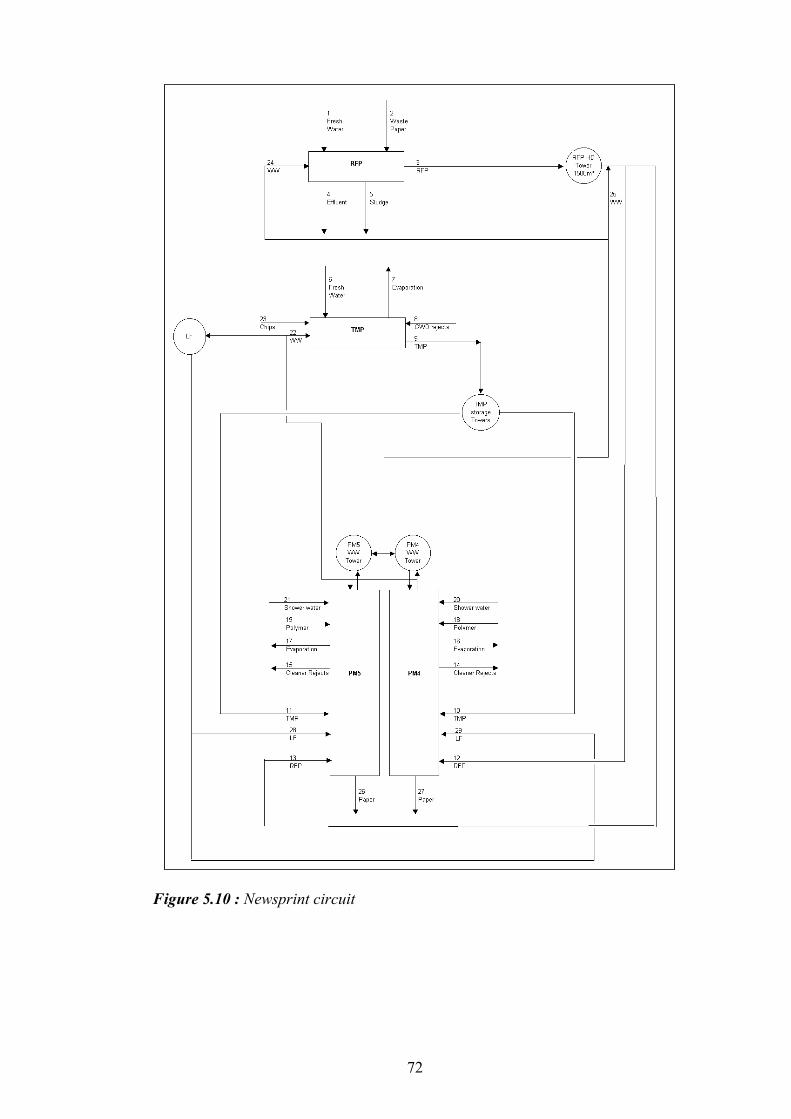
Figure 5.10 : Newsprint circuit
72

Stream key for figure 5.10 :
Long Fibre29Long Fibre28Paper27Paper26White water25White water24Chips23White water22Shower water21Shower water20Polymer19Polymer18Evaporation17Evaporation16Cleaner rejects15Cleaner rejects14RF Pulp13RF Pulp12TM pulp11TM pulp10TM pulp9Groundwood rejects8Evaporation7Fresh water6Sludge5Effluent4RF Pulp3Waste Paper2Fresh water1
* RF : recycled fibre TM : thermo-mechanical
Figure 5.10 above represents the newsprint circuit without showing the details of theindividual plants. In order to identify opportunities for re-routing streams and minimisingfresh water consumption it is necessary to include the details of each of the sections of thenewsprint circuit and the model used for the water pinch analysis is shown in Figure 5.11with the dotted line indicating the various sections that were combined to form the newsprintcircuit.
Chip washer &
hydrasieveL1 Prim Ref L1 Sec Ref
TMP1 Lat & Screens
L1 Decker RFP Pulping
HD Cleaners
Coarse screens
L2 Prim Ref
L3 Prim Ref
L4 Prim Ref
L2 Sec Ref
L3 Sec Ref
L4 Sec Ref
TMP2 Lat & Screens
L2 Decker
L3 Decker
L4 Decker
Centri cleaners
Gyro cleaners Flotation
Fine screens Disc filter Wire pulp
press
PM4 Cleaners &
DecPM4 Silo PM4 Blend
ChestPM5 Blend
Chest
PM5 Cleaners &
DecPM5 Silo
PM4 screens
PM4 headbox
PM4 forming section
PM5 forming section
PM5 screens
PM5 headbox
PM4 press section
PM5 press section
Fresh water
Effluent
Reject system Cooling
Disperser
Sealing water
Figure 5.11 : The newsprint circuit as represented in the water pinch analysis
73
The water pinch model elements for the newsprint circuit were:
Utility source and sink: Fresh water and effluent
Process unit operations:
PM5 SaveallPM5 Press sectionPM5 blend chestPM5 Forming sectionPM4 SaveallPM4 Press sectionPM4 Forming sectionPM4 blend chestRFP PressingRFP FilteringRFP Fine screening
RFPCentri-cleaning
RFP Gyro-cleaningRFP Flotation
RFP Coarsescreening
RFP High densitycleaning
Sealing waterRFP PulpingLine 4 DeckerLine 1 DeckerLine 3 DeckerLine 2 DeckerCoolingReject systemHydrasievesChip washer
Process sources :
PM4 ScreensPM5 Cleaners and deculatorPM4 ScreensPM4 Cleaners and deculator
Process sinks :
PM5 Head boxPM5 SiloPM4 Head boxPM4 SiloTMP1 & TMP2 Latency and screensTMP Lines 1 - 2 Secondary refinersTMP Lines 1 - 4 Primary refinersRFP Disperser
The relationships between the inlet and the outlet streams in the unit operations weredetermined using the results from the water balance performed using the Water Trackersoftware and a mass pickup equation with the constant A (see equation 2.1, section 2.3.3.2)determined by the relationship between the inlet and outlet stream in the water balance.
Table 5.6 contains the flow and concentration constraints that were applied to the processsinks.
74

Table 5.6 : Constraints for process sinks
7001 428Cloudy white waterPM5 Saveall088Fresh waterPM5 Press section300166Clear white water021Fresh waterPM5 Forming section020Fresh waterPM5 Head box3 6002 179Cloudy white waterPM5 Silo04.5Fresh waterPM5 Blend Chest7001428Cloudy white waterPM4 Saveall088Fresh waterPM4 Press section300122Clear white water021Fresh waterPM4 Forming section020Fresh waterPM4 Head box3 6002 181Cloudy white waterPM4 Silo04.5Fresh waterPM4 Blend Chest5019Fresh waterSealing020Fresh waterCooling2 000277.2Cloudy filtrateReject system1 000120Clear filtrateL4 Decker1 000120Clear filtrate L3 Decker1 000120Clear filtrate L2 Decker1 000120Clear filtrate L1 Decker1 000398.7Cloudy filtrateTMP1 Latency and screens1 000398.7Cloudy filtrateTMP1 Latency and screens0126.4Fresh waterL4 Secondary Refiner0126.4Fresh waterL3 Secondary Refiner0126.4Fresh waterL2 Secondary Refiner0126.4Fresh waterL1 Secondary Refiner00.01Fresh waterL4 Primary Refiner00.01Fresh waterL3 Primary Refiner00.01Fresh waterL2 Primary Refiner00.01Fresh waterL1 Primary Refiner4 000395.7Dirty chip wash waterHydrasieves3 000376.2Hydrasieves filtrate3 00022.3Cloudy filtrateChip washer600125.6Paper machine white waterRFP Disperser60043.2Paper machine white waterRFP Wire pulp press1 000103.7Clear filtrate1 8000Cloudy filtrateRFP Disc filter1 00050.7Clear filtrateRFP Fine screens1 000224.4Clear filtrateRFP Centricleaners1 00096.7Clear filtrateRFP Gyrocleaners1 800251.7Cloudy filtrateRFP Flotation1 8003.7Cloudy filtrateRFP Coarse Screening1 80087Cloudy filtrateRFP High Density Cleaning1 800288Cloudy filtrateRFP Pulping
Max Fibre [ppm]Flow [t/h]StreamOperation
75

The newsprint circuit, which is a combination of the recycled fibre plant, thethermo-mechanical pulp mill and the two newsprint paper machines provided greateropportunity for optimising the amount of fresh water consumed by re-routing existing waterstreams between the individual sections of the circuit.
The analysis was carried out in three stages. In the first step (A), the model was forced tocorrespond to the then current operating state of the plant by introducing flow constraintswhich fixed the flow rates of all streams to the operating values. For this scenario, the totalfresh water consumption for the plant was 636.3 t/h and the total effluent generated 954.4 t/h.This initial step served three purposes:
i) Comparing the model output to available plant data, in terms of flow rates and fibrecontents of streams, provided a check on the validity of the model’s representation ofthe plant.
ii) The objective function calculated by the model, representing the operating cost associ-ated with the water system, served as a reference for comparing the results obtainedsubsequently.
iii) The optimiser calculates sensitivities of the objective function to all imposedconstraints. Looking at the values of the sensitivities for the flow constraints whichwere imposed to force to model to match the plant configuration, it was possible toidentify where relaxing particular constraints would have the greatest benefit.
The second step (B) involved removing all the flow constraints that were specificallyimposed to match the actual plant configuration (constraints that reflected processrequirements were retained). This optimised result from this step was taken to represent thebest water utilisation that could be achieved with the given process technology. However,this solution was considered impractical due to the large number of small-flowrate newconnections that it required. A total of 32 new connections were used in the solution, and theoverall fresh water consumption and effluent generation were reduced by 51.54 t/h to584.5 t/h and 902.9 t/h respectively. These values were taken to represent the best waterusage that could possibly be achieved - effectively the equivalents of the water use targets inthe classical pinch analysis methodology.
The final step (C) involved removing the constraints one at a time (instead of all together asin step B) from those connections which were identified as having the greatest cost sensitivityin step A. After only 3 new connections, the fresh water consumption and effluent generationwere reduced to same values as obtained in step B. These figures amount to 8.1 % reductionin fresh water consumption and 5.4 % effluent generation.
The identical overall performance of the scenario B and scenario C solutions providesanother illustration of the degeneracy phenomenon.
To present the various solutions in detail would be ineffective due to the number of streamsinvolved. Since the pinch analysis was unable to identify significant savings within the threeindividual sections of the plant, it follows that the most significant changes must involveflows between the sections. These can be seen by comparing figures 5.11 (step A) and 5.12(step C), which show only the flows which go between the three sections of the factory. Thebold lines in Figure 5.12 represent the new connections identified by the pinch analysis.
76

Chip washer &
hydrasieveL1 Prim Ref L1 Sec Ref
TMP1 Lat & Screens
L1 Decker RFP Pulping
HD Cleaners
Coarse screens
L2 Prim Ref
L3 Prim Ref
L4 Prim Ref
L2 Sec Ref
L3 Sec Ref
L4 Sec Ref
TMP2 Lat & Screens
L2 Decker
L3 Decker
L4 Decker
Centri cleaners
Gyro cleaners
Flotation
Fine screens Disc filter
Wire pulp press
PM4 Cleaners &
DecPM4 Silo PM4 Blend
ChestPM5 Blend
Chest
PM5 Cleaners &
DecPM5 Silo
PM4 screens
PM4 headbox
PM4 forming section
PM5 forming section
PM5 screens
PM5 headbox
PM4 press section
PM5 press section
Fresh water
Effluent
Reject system Cooling
Disperser
Sealing water
To all sections
To Recycled Fibre Plant and
Thermo-mechanical pulp
plant
Figure 5.12 : Flow of water streams between sections of the newsprint circuit in thecurrent plant configuration (corresponding to step A of the analysis).
Chip washer &
hydrasieveL1 Prim Ref L1 Sec Ref
TMP1 Lat & Screens
L1 Decker RFP Pulping
HD Cleaners
Coarse screens
L2 Prim Ref
L3 Prim Ref
L4 Prim Ref
L2 Sec Ref
L3 Sec Ref
L4 Sec Ref
TMP2 Lat & Screens
L2 Decker
L3 Decker
L4 Decker
Centri cleaners
Gyro cleaners
Flotation
Fine screens Disc filter
Wire pulp press
PM4 Cleaners &
DecPM4 Silo PM4 Blend
ChestPM5 Blend
Chest
PM5 Cleaners &
DecPM5 Silo
PM4 screens
PM4 headbox
PM4 forming section
PM5 forming section
PM5 screens
PM5 headbox
PM4 press section
PM5 press section
Fresh water
Effluent
Reject system Cooling
Disperser
Sealing water
To all sections
To Recycled Fibre Plant and
Thermo-mechanical pulp
plant
TMP cloudy filtrate to RFP pulping
TMP clear filtrate to RFP HD cleaning
Sealing water to L4decker showers
8.95 t/h
183.91 t/h
39.14 t/h
Figure 5.13 : Flow of water streams between sections of the newsprint circuit in theoptimised model (corresponding to step C of the analysis)
77

5.5 Discussion and conclusions
From this investigation of the application of water pinch analysis in an integrated pulp andpaper mill, the following can be concluded:
i) Scope for optimisation and water savings within individual sections of the mill wasinsignificant. There were a number of reasons for this namely:only utility water was considered in this analysis;There has been a considerable amount of effort already put into reducing waterconsumption at the mill over a number of years;water is already recycled and reused within the process.
ii) By application of single contaminant analysis to a larger section of the mill it waspossible to reduce the fresh water requirement by 51.54 t/h (8.1 %) and effluent gener-ated by the same amount (5.4 %).
iii) These reductions translated into a saving of R1 548 593 /annum. The savings wascalculated by the objective function which included fresh water costs and effluentcosts, but did not include engineering costs or piping costs. In addition, the objectivefunction did not take geographical costs into account, the distance between the sectionsin the plant was not included in the analysis.
iv) There are operability constraints which could prevent these savings from beingachieved, since they involve the transfer of water from two batch processes which arenot always in operation at the same time. The thermo-mechanical pulp plant isoperated at full capacity during periods when the electricity charges are the lowest,which is during the night. The recycled fibre plant is operated according the papermachines' demand for recycled fibre. As a result there are times when the thermo-mechanical plant is in operation and the recycled fibre plant is not in operation or viceversa. The transfer of water between these two sections of the plant is therefore notideal.
v) Thirty two new connections were generated in the optimised model, however, onlyhowever the same savings could be achieved with just three. These three streams wereidentified using a novel approach to implementing water pinch analysis which involvedthe evaluation of sensitivity coefficients of the flow constraints in combination with themagnitude of the streams involved. The top three new connections identified in thismanner corresponded to the three streams which were responsible for the fresh watersavings in the optimised model generated by the water pinch analysis.
This study did not consider the use of treatment options to reduce the fibre content in theexisting streams and thereby reduce the fresh water consumption further. Removal of fibrefrom streams will allow further reuse and recycling within the process and thus a furtherreduction in the amount of fresh water required.
During the course of the study, the water supply situation for the mill was changedsubstantially with the commissioning of the Durban Water Recycling Plant. This treatsrecovered domestic and industrial wastewater to a standard which makes it suitable forindustrial use. Mondi is the scheme’s main customer, and is supplied recycled water in termsof a "take or pay" agreement. The mill uses the recycled water for all the processrequirements and in terms of the agreement with the Recycling Plant the mill pays for aminimum amount of water per day, whether this amount of water is used or not. Currentlythe mill consumption of water is slightly below the "take or pay" minimum specification, sothe commercial incentive to implement water saving measures has disappeared.
78

From a theoretical point of view, the method of first introducing and then selectively relaxingflow constraints to find an optimal solution which involves the minimum installation of newpiping is a novelty, and constitutes a small but possibly significant contribution to the theoryand practice of water pinch analysis. To put it into perspective, in the past water pinchanalysis has largely focussed on concentration constraints, and has developed various eleganttechniques for handling them. This is particular true of the graphical pinch analysistechniques, and it is notable that, in the current water pinch analysis literature, the ‘pinch’itself refers to a concentration limit. This emphasis on concentration limits has been carriedover into the versions of pinch analysis which are based on the use of general purposeoptimisation algorithms, such as the version of the Linnhoff-March WaterPinch softwareused for this study. Although facilities for applying flow constraints were provided, thefacilities for interpreting their effects on the system had not been developed, in contrast withthe facilities for interpreting concentration constraints.
At the level of the optimisation algorithm, all constraints are treated in exactly the same way,and exactly the same kind of information is available for flow constraints as for concentrationconstraints, however the user interface selected only the concentration limit sensitivities topresent to the user. (Fortunately it was possible to extract the missing flow constraintsensitivities from the temporary files used by the GAMS solver to communicate theoptimised solution to the WaterPinch software user interface.)
In the Linnhoff-March framework, these concentration sensitivities take the place of thepinch concentration in the simple graphical approach. The results of this study point to theusefulness of the flow rate sensitivities, and suggest a further extension of the pinch conceptto include the entire set of constraints which prevent further optimisation of the system (theset of active constraints at the constrained optimum point).
79

6 THE SASOL POLYMERS CHLOR-ALKALI COMPLEX
AT UMBOGINTWINI
The application of Pinch Analysis to water and wastewater management at the SasolPolymers chlor-alkali complex was first addressed as part of WRC Project K5/851(Brouckaert and Buckley (2003). As part of that project, a Water Pinch Analysis study at thechlor-alkali complex was conducted by Gardner, starting in 1997 (Gardner, 2000).Motivated by the results from this study and with a number of process changes that had beenmade to the chlor-alkali complex, the follow-up study reported here was undertaken by PaoloGianadda and began in 1999. This chapter is based on his PhD thesis.
The Sasol Polymers chlor-alkali complex, formerly operated by Polifin Limited andpreviously by AECI Chlor-Alkali and Plastics Limited, was located within the UmbogintwiniIndustrial Site some 25 km south of Durban, South Africa. During its period of operation,which extended from 1955 to 2001, the complex produced chlorine and caustic soda, togetherwith a range of other derived products. It was also in this period that the complex underwenta number of changes as processes were upgraded and decommissioned. As it stood at thetime of its closure, the complex produced caustic soda, chlorine, hydrogen, hydrochloric acidand sodium hypochlorite. Unless otherwise indicated, references to the plant describe itsconfiguration as it stood at the point of closure.
6.1 Description of the complex
Cl2Processing
Brine Circuit
CausticEvaporation
H2Processing
HClSynthesis
Hypo-chlorite
Synthesis
DeminPlant
Plant Washdown
Pressure Testing
Cooling Towers
Storage
Hydecat
StorageUmgeniWater
UmbogintwiniRiver Water
Storage
Pump Seals
Desuperheat
Raw Salt,Na2CO3,NaHSO3
Condensate
NaOH 32%
Effluent
NaOH 50%
CondensateCl2
Storage
Dry
H2 H
2
Dem
in W
ater
HCl
HC
l
Wet Cl2
Wet H2
Brine Sludge,Brine Purge
Figure 6.1 : Schematic diagram of the Sasol Polymers chlor-alkali complex
80

Figure 6.1 presents a schematic diagram of the various plants which made up the SasolPolymers chlor-alkali plant at Umbogintwini. Central to the activities of the complex was thebrine circuit which converts raw salt to caustic soda, chlorine and hydrogen. Part of thechlorine and hydrogen generated from the circuit was used for the production of hydrochloricacid in the hydrochloric acid synthesis plant. Chlorine was further used, along with causticsoda, in the manufacture of sodium hypochlorite in the sodium hypochlorite synthesis plant.Two other plants located within the complex were the demineralisation plant, whichproduced a high quality water for use within the complex, and the Hydecat destruction plantwhich destroyed surplus or below-specification sodium hypochlorite along with otherchlorine-containing effluents.
6.1.1 The Brine circuit
Figure 6.2 presents a simplified process flow diagram of the brine circuit. The electrolyserwas the core process of the circuit and the operation in which sodium chloride was convertedto chlorine gas and caustic soda, with hydrogen gas being generated simultaneously. Theelectrolyser was preceded by a series of raw material purification operations (precipitation,clarification, filtration and ion-exchange) which condition the brine solution to a standardacceptable to the electrolyser. The electrolyser was followed by various product processingoperations (chlorine processing, hydrogen processing and caustic evaporation) and brinerecycle conditioning operations (physical and chemical dechlorination and resaturation).
Resaturator CalciumPrecipitator
MagnesiumPrecipitator
PrimaryFiltration
Ion-ExchangeElectrolyserNaOCl
Destruction
PhysicalDechlori-
nation
ChemicalDechlori-
nation
Raw Salt,Water Na2CO3
BrineSludge
Cl2, H2,NaOHHClChlorinated
Condensate
Bisulphite,NaOH
Waste Cl2
BrinePurge
Clarifier
NaOH Flocculant
SecondaryFiltration
Alpha-Cellulose
Figure 6.2 : Schematic diagram of the brine circuit.
6.1.1.1 Raw material purification
Raw salt was dissolved in a solution made up of recycled brine and demineralised water inthe resaturator. The salt contained predominantly sodium chloride but also some traceimpurities, amongst which were calcium and magnesium cations. Brine from the resaturator(~25% m/m NaCl) passed through the calcium precipitator, where dilute sodium carbonate(~16% m/m Na2CO3) was added to precipitate the calcium as calcium carbonate, and themagnesium precipitator, where dilute caustic soda (18% m/m NaOH) was added toprecipitate the magnesium as magnesium hydroxide. A flocculant was added ahead of theclarifier where the precipitated material was removed from the brine stream as brine sludge.
81
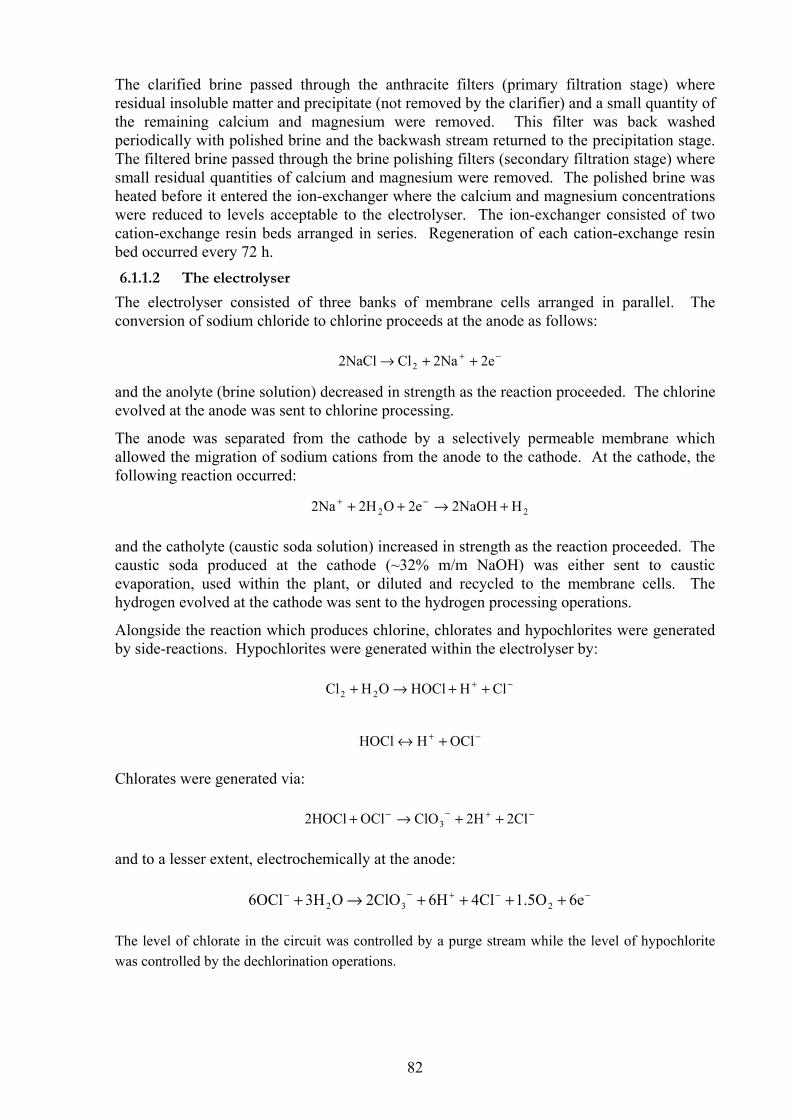
The clarified brine passed through the anthracite filters (primary filtration stage) whereresidual insoluble matter and precipitate (not removed by the clarifier) and a small quantity ofthe remaining calcium and magnesium were removed. This filter was back washedperiodically with polished brine and the backwash stream returned to the precipitation stage.The filtered brine passed through the brine polishing filters (secondary filtration stage) wheresmall residual quantities of calcium and magnesium were removed. The polished brine washeated before it entered the ion-exchanger where the calcium and magnesium concentrationswere reduced to levels acceptable to the electrolyser. The ion-exchanger consisted of twocation-exchange resin beds arranged in series. Regeneration of each cation-exchange resinbed occurred every 72 h.6.1.1.2 The electrolyser
The electrolyser consisted of three banks of membrane cells arranged in parallel. Theconversion of sodium chloride to chlorine proceeds at the anode as follows:
−+ ++→ 2e2NaCl2NaCl 2
and the anolyte (brine solution) decreased in strength as the reaction proceeded. The chlorineevolved at the anode was sent to chlorine processing.
The anode was separated from the cathode by a selectively permeable membrane whichallowed the migration of sodium cations from the anode to the cathode. At the cathode, thefollowing reaction occurred:
22 H2NaOH2eO2H2Na +→++ −+
and the catholyte (caustic soda solution) increased in strength as the reaction proceeded. Thecaustic soda produced at the cathode (~32% m/m NaOH) was either sent to causticevaporation, used within the plant, or diluted and recycled to the membrane cells. Thehydrogen evolved at the cathode was sent to the hydrogen processing operations.
Alongside the reaction which produces chlorine, chlorates and hypochlorites were generatedby side-reactions. Hypochlorites were generated within the electrolyser by:
−+ ++→+ ClHHOClOHCl 22
−+ +↔ OClHHOCl
Chlorates were generated via:
−+−− ++→+ 2Cl2HClOOCl2HOCl 3
and to a lesser extent, electrochemically at the anode:
−−+−− ++++→+ 6e1.5O4Cl6H2ClOO3H6OCl 232
The level of chlorate in the circuit was controlled by a purge stream while the level of hypochloritewas controlled by the dechlorination operations.
82
6.1.1.3 Raw material conditioning
The depleted brine solution (~20% m/m NaCl) leaving the electrolyser was saturated withdissolved chlorine and chlorine-releasing species (hypochlorites), and was mixed withchlorine-containing condensate from the chlorine processing operations. The cation-exchangeresin is extremely sensitive to oxidising species and all chlorine and chlorine-releasingspecies must be eliminated before the brine is recycled to the ion-exchanger.
Dechlorination was carried out in two stages. In the primary stage, concentrated hydrochloricacid (31% m/m HCl) was dosed to the brine such that chlorine was liberated from thechlorine-releasing species:
OHClNaClNaOCl2HCl 22 ++→+
Following acid dosing, the brine was passed through three dechlorinators in which thedissolved chlorine was displaced by an air stream blown through the dechlorinators (physicaldechlorination). The displaced chlorine gas was routed to the sodium hypochlorite synthesisplant. The pH of the brine leaving the primary dechlorination stage was corrected throughthe addition of caustic soda (18% m/m NaOH).
A residual quantity of dissolved chlorine remained in the brine stream following physicaldechlorination. This was removed by chemical (secondary) dechlorination. Chemicaldechlorination involved the addition of excess sodium bisulphite (10% m/m NaHSO3) to thebrine. The chlorine was destroyed via the following reaction:
O2H2NaClSONaNaHSO3NaOHCl 24232 ++→++
The build-up of sulphate in the circuit was controlled via the brine purge. The depleted brinewas cooled and returned to the resaturator.
6.1.1.4 Cation-exchange regeneration
The cation-exchange regeneration sequence comprised seven stages: Brine Displacement,Backwash, Acid Regeneration, Acid Rinse, Caustic Regeneration, Caustic Rinse and BrineReplacement. During the Brine Displacement stage, brine was displaced from thecation-exchange resin bed using demineralised water. The Backwash stage saw the resin bedbeing flushed with demineralised water in the opposite direction to the brine flow. A weakhydrochloric acid solution (7% m/m HCl) was used for the Acid Regeneration stage. Duringthis stage, the cation-exchange resin was converted from the divalent cation form to thehydrogen form.
The hydrochloric acid hold-up from the Acid Regeneration stage was displaced from theresin bed using demineralised water (Acid Displacement stage). A weak caustic sodasolution (4% m/m NaOH) was used in the Caustic Regeneration stage to convert thecation-exchange resin back to the sodium form.
The caustic soda hold-up from the Caustic Regeneration stage is displaced from the resin bedusing demineralised water (Caustic Displacement). The regeneration sequence is completedby the replacement of brine in the resin bed (Brine Replacement). Effluent from thecation-exchange regeneration sequence is sent to an acid pit where partial neutralisation ofthe hydrochloric acid effluent by the caustic soda effluent occurs, prior to the effluent beingdischarged to the effluent treatment facility.
6.1.1.5 Chlorine processing
The chlorine gas stream emerging from the electrolyser was saturated with water at anelevated temperature (~87 °C). The majority of this water condensed out of the chlorine gas
83

stream in the chlorine cooler; the residual water was removed by concentrated sulphuric aciddrying. The condensate from the chlorine cooler, which contained a quantity of dissolvedchlorine, was blended with the depleted brine stream prior to the primary dechlorination stagewhile the dry chlorine was either used within the complex or sent to storage.6.1.1.6 Hydrogen processing
The hydrogen gas stream left the electrolyser at an elevated temperature (~89 °C) and in asaturated state. Most of the water was removed via condensation, as the hydrogen streamwas cooled in the hydrogen cooler. Hydrogen gas leaving the cooler was either usedinternally within the complex, bottled for sale or cooled further in the hydrogen chiller forexport to the hydrogen peroxide plant located on the Umbogintwini Industrial Site.
6.1.1.7 Caustic evaporation
Caustic soda left the electrolyser at a strength of approximately 32 % m/m NaOH. Theconcentration was increased to saleable strength (50 % m/m NaOH) in the dual-effect causticevaporation plant. Steam condensate and process condensate from the evaporators wererecycled to the brine resaturator.
6.1.2 The hydrochloric acid synthesis plant
The hydrochloric acid synthesis plant comprised two hydrochloric acid synthesis units, eachconsisting of a burner and an absorption section. Chlorine gas was burnt in excess hydrogengas in the burner to produce hydrogen chloride gas.
The hydrogen chloride gas and unreacted gases rose into the absorption section of the unitwhere the hydrogen chloride was absorbed in demineralised water to produce hydrochloricacid. This was drawn off from the unit. The remaining gas stream was passed to a scrubberwhere a weak caustic soda solution removed any residual hydrogen chloride and chlorine gasprior to the gas stream being vented to the atmosphere.
6.1.3 The sodium hypochlorite synthesis plant
While sodium hypochlorite was produced for sale, the sodium hypochlorite synthesis planthad the added function of being a reliable sink for any excess chlorine present within thevarious process systems of the complex. All waste chlorine from the brine circuit and thechlorine processing system was sent to the sodium hypochlorite synthesis plant where it isreacted, together with a make-up chlorine stream, with dilute caustic soda (22 % m/m NaOH)according to:
OHNaClNaOClCl2NaOH 22 ++→+
The sodium hypochlorite synthesis plant consisted of five primary absorption towers, three ofwhich were on-line at any given time. The dilute caustic soda was circulated over theabsorption towers where it reacted with the chlorine. The batch was withdrawn from thetowers when the sodium hypochlorite has reached the required strength (~17.5 % m/mNaOCl).
6.1.4 The Hydecat destruction plant
With some of the sodium hypochlorite production being forced to absorb excess chlorinefrom the various process systems of the complex, the quantity of sodium hypochloriteproduced sometimes exceeded the saleable demand. In such situations, or when the qualityof sodium hypochlorite was off-specification, the waste sodium hypochlorite had to bedisposed of through the effluent treatment facility. Before disposal however,chlorine-releasing species had to be destroyed so as to prevent downstream releases. Thiswas done by processing the waste sodium hypochlorite in the Hydecat destruction plant.
84

Waste sodium hypochlorite was diluted with Umbogintwini River water and preheated bydirect steam injection. The dilute sodium hypochlorite (4 % m/m NaOCl) was passed over anickel-based catalyst which destroys the hypochlorite species.
The effluent produced by the Hydecat destruction plant, a weak brine solution with tracequantities of dissolved chlorine and nickel, was sent to the effluent treatment facility.
6.1.5 The demineralisation plant
The demineralisation plant provided a steady supply of high purity water to the variousprocess systems within the chlor-alkali complex. The plant consisted of a cation-exchangeresin bed and an anion-exchange resin bed arranged in series. The raw water feed to the plantcomprised an equal-ratio blend of Umgeni Water (municipal supply) and water from theUmbogintwini River.
During the normal ion-exchange cycle of operation, cations were removed from the influentwater in the cation-exchange bed and the cation-exchange resin is converted from thehydrogen form to the cation form. Anions were removed from the influent water in theanion-exchange bed, and the anion-exchange resin was converted from the hydroxide form tothe anion form. These reactions proceeded until the exchange capacities of the ion-exchangeresins had been reached. Regeneration of the demineralisation plant took place every 16 h.
The regeneration sequence had five stages: Pre-Inject, Regenerant Inject, RegenerantDisplacement, Fast Rinse and Quality Rinse. The Pre-Inject stage established a flow ofdemineralised water through the elution ducts. During the Regenerant Inject stage, dilutecaustic soda (~4 % m/m NaOH) was used to convert the anion-exchange resin from the anionform to the hydroxide form, and dilute hydrochloric acid (~4 % m/m HCl) was used toconvert the cation-exchange resin from the cation form to the hydrogen form. Demineralisedwater was used to displace the hydrochloric acid and caustic soda hold-ups from thecation-exchange and anion-exchange beds respectively during the Regenerant Displacementstage. Two rinse stages completed the regeneration sequence: a Fast Rinse stage, using rawwater, and a Quality Rinse stage, using demineralised water. All effluents from the variousstages, except that of the Quality Rinse stage, which was recycled, were sent to the effluenttreatment facility.
6.1.6 Miscellaneous operations
Miscellaneous operations includes those activities within the chlor-alkali complex that didnot necessarily fall into the process systems described previously. These activities included:cooling circuits, pump seals, plant wash down, cylinder and drum pressure testing andcleaning, effluent pH correction and steam desuperheating.
6.1.6.1 Cooling circuits
The complex had four cooling circuits: the Linde, the Sulzer, the Liquid Chlorine (LC) andthe Membrane Cell (MBC). The Linde and Sulzer cooling circuits were associated with theliquefaction of chlorine, while the LC cooling circuit met the cooling requirements associatedwith the use of the liquefied chlorine. The MBC cooling circuit satisfied the coolingrequirements of the brine circuit. All the cooling towers used water from the UmbogintwiniRiver as make-up; the blow downs were sent to the effluent treatment facility.
6.1.6.2 Pump seals
Demineralised water was used to maintain the seal on several pumps within the complex.After use, this water was sent to the effluent treatment facility.
85

6.1.6.3 Plant wash down
The plant was washed down once a week using Umbogintwini River water. This water wasdrained to the effluent treatment facility.
6.1.6.4 Cylinder and drum pressure testing and cleaning
The empty gas cylinders and drums were cleaned using steam and pressure tested usingUmbogintwini River water. Effluent from these activities was sent to the effluent treatmentfacility.
6.1.6.5 Effluent pH correction
The effluent treatment facility is owned and managed by Umbogintwini Operational Services(UOS) which serves the industrial site as a whole. Excess hydrochloric acid present in theeffluent had to be neutralised prior to the effluent leaving the Sasol Polymers site, and thiswas done through the addition of concentrated caustic soda (~32% m/m NaOH) at a pointnear the boundary of the complex.
6.1.6.6 Steam desuperheating
Steam was supplied to the Sasol Polymers site by UOS in a superheated form. This steamwas desuperheated by direct injection of demineralised water.
6.2 Theoretical considerations
Results from the initial study (presented in WRC report 851/1/03) showed that there wassignificant potential for savings to be effected on the chlor-alkali complex through the reuseand recovery of both water and reagents. However, the approach adopted at the timeresulted in the problem being considered from a single contaminant perspective; as such theoptimality and even the feasibility of the proposed network configurations could not beguaranteed from the multiple contaminant perspective. Thus, with a number of changes alsohaving taken place on the complex in terms of the closure of certain plants, the follow-upstudy was proposed with the intention of optimising water-use from the multiple contaminantperspective.
As seen in the previous study, the chlor-alkali complex did not correspond to the typicalsituation associated with the application of water pinch analysis. Existing water pinchanalysis tools, and the theory from which they developed, rely on the assumption that a cleardistinction can be made between so-called water streams and process streams. With thisdistinction in place, only the water side of the problem is considered in the pinch analysis: theprocess-side is not represented explicitly. As will however be illustrated by the followingdiscussion, it is not easy to distinguish between process streams and water streams in thechlor-alkali complex.
Consider the brine circuit presented in Figure 6.2. The most sensitive region of this circuit isthe electrolyser for which there exists a range of strict concentration limits on the variousspecies in the brine stream, in particular calcium and magnesium cations. Calcium andmagnesium cations enter the brine circuit alongside the sodium chloride in the raw salt andare removed from the circuit via the series of operations which precede the electrolyser. Themajor portion of the calcium and magnesium load is removed via the precipitation stage.During this stage, sodium carbonate is used to precipitate the calcium as calcium carbonateand caustic soda is used to precipitate magnesium as magnesium hydroxide, both of whichare subsequently removed via clarification. Precipitation of calcium carbonate andmagnesium hydroxide are controlled by their associated solubility products. Thus, using theprecipitation of calcium carbonate for the purposes of discussion, to achieve a desiredresidual calcium cation concentration in the stream leaving the precipitator requires anadjustment to the dose of sodium carbonate. The amount of sodium carbonate required is
86
further dependent on the concentration of calcium cations entering the precipitator. Hence, ifthe calcium cation load entering the precipitator was to increase through the reuse of water orthe recovery of reagent, an additional amount of sodium carbonate would be needed toproduce the required residual concentration in the outlet stream. Thus a balance must bestruck between the savings achieved through increased reuse of water and reagents and thepenalties incurred through the need to remove additional contaminant loads from the system.Similar situations occur in a number of other operations within the brine circuit.
A further aspect of the above operations is the transformation of species via chemicalreaction. Individual species are not independently conserved, as is the case with thenon-reacting systems considered by standard water pinch analysis theory. Chemicalreactions do not only occur between reagent species and external contaminant species either.A range of by-products are generated via chemical reaction in the electrolyser alongside thecaustic soda, chlorine and hydrogen products. These species are contaminants which musthave their concentration controlled within the system. Further operations in which chemicalreactions take place include the hydrochloric acid synthesis plant, the sodium hypochloritesynthesis plant, the Hydecat destruction plant, the demineralisation plant and the effluent pHcorrection stage. In addition, the operating cost of the demineralisation plant and the effluentpH correction stage is dependent on the contaminant load entering the operation.
Thus, there were three key aspects to the problem presented by the chlor-alkali complexwhich make the application of current water pinch analysis theory to the situation difficult.These were:
The lack of distinction between process streams and water streams;The presence of multiple resources, in this case reagents and raw materials,
in addition to water. These resources carried species which had an economicvalue to the system, and could not be treated in the same way as contaminants;andThe chemical reactions taking place between the various species in the
system.An extension of the theory was needed to address these issues, and the term Combined Waterand Materials Pinch Analysis was coined to describe the new methodology.
6.2.1 Problem statement for Combined Water and Materials Pinch Analysis
A general statement of the problem is:
The system is characterised by a set of process operations which convert the raw materials tothe desired products at the desired production level. Within this process system, a number ofdemands for water, reagents and raw materials are present, each of which may becharacterised by specific quantity and/or quality requirements which are established by theprocess operations. These demands must be satisfied using sources of water, reagent or rawmaterial which are either internal to the process system or supplied externally. Each externalsource, whether it be water, reagent or raw material, is characterised by a composition profileof contaminants and other species, a cost associated with its supply and possibly a finiteavailability limit. Each internal source is similarly characterised by a composition profile ofcontaminants and other species and a finite availability limit, both of which are dependent onthe functioning of the various process operations within the process system; these sourcesmay also have a cost associated with their use. The process operations do not conform to anyone particular model and may have any number of associated sources and demands. Inaddition, the various species present in the system may or may not be chemically reactive.Finally, the process system is characterised by certain effluent discharge limits, whether theybe flowrate or composition based, which must be satisfied. As such, a number of different
87
treatment operations, each with an associated cost which may be volume and/or loaddependent, are available such that these discharge limits are satisfied. The task at hand isthen to satisfy the various demands within the process system together with the effluentdischarge requirements at the lowest overall cost.
The problem statement may be extended to include other considerations such as imposed andforbidden matches, safety, controllability and plant geography. The overall cost maycomprise only operating costs or the total annualised investment cost. The assumption ismade that energy and pressure effects are not significant. The assumption is also made thatthe individual process operations are functioning optimally for the current water allocation.As usual for design, this problem considers the system at steady-state.
6.2.2 Model formulation for combined water and materials pinch analysis
This section presents a general mathematical model for Combined Water and Materials PinchAnalysis. This model involves the representation of the various options as a superstructure,as is the usual approach with this type of problem.
The superstructure for the water and materials minimisation problem represents the set of allpotential inter-process flows between the various process operations within the processsystem and the flows to and from the external sinks and sources respectively. The typicalsuperstructure encountered in the literature on water minimisation considers only a singletype of process operation (Takama et al., 1980a,b; Doyle and Smith, 1997; Alva-Argáez etal., 1998b; Alva-Argáez, 1999; Mann and Liu, 1999; Benkõ et al., 2000; Dericks et al., 2001;Bagajewicz and Savelski, 2001), that is, the fixed contaminant mass-load addition modelconsidered by Wang and Smith (1994). The majority of operations encountered on thechlor-alkali complex however did not conform to one particular type of unit model. Apartfrom not being able to describe the different operations according to a single performancecharacteristic such as mass transfer, the operations did not have a common topologicalstructure in terms of the number of associated inlets and outlets. In formulating thesuperstructure for the model, it was desirable that the model framework be sufficientlygeneral for all process operations to be integrated efficiently and easily. As such, the overallframework of the superstructure needed to be independent of the types of process operationsconsidered. This was accomplished by formulating the superstructure in such a way that itrepresented the set of all possible flows from any source to any sink. The models for theindividual process operations are then incorporated as modules within this framework. Thesuperstructure is thus described as follows:
Every sink is preceded by a mixer.Every source is followed by a splitter.Process units are incorporated as modules connected between sinks and
sources.Figure 6.3 uses a simple example with three process modules to illustrate the superstructureframework.
The question of reagents and raw materials in the system was simply a matter of the kinds ofconcentration limits that could be applied. For contaminants, the only kind of limit that isappropriate is a maximum value that can be tolerated by the equipment. For reagents and rawmaterials, the constraint might be a minimum value, or a required value (an equalityconstraint).
Chemical reactions were accommodated by providing for stoichiometric transformationswithin the process unit modules.
88

FreshwaterSource
WastewaterSink
ReagentSource
III
II
Processunit
I
InternalSources
InternalSinks
Figure 6.3 : An example of a superstructure for a simple process with three units.
The pinch model was formulated from the mass balance equations for the water and materialsflows in the superstructure, together with the input-output relationships for all the processmodules. To these were added all the concentration and flow rate constraints that applied ateach node of the superstructure. The result is a standard non-linear programming (NLP)problem, which can be solved using a general-purpose NLP algorithm. The softwareplatform used in this study was GAMS (General Algebraic Modelling System) (GAMSDevelopment Corporation, 2001). GAMS is a high-level language for the compactrepresentation of large and complex optimisation problems (Brooke et al., 1998). A keyfeature of the language is that the model may be described independently of the requiredsolution algorithm. Thus, models are formulated using a consistent notation and within acommon development environment, termed the Integrated Development Environment.
6.2.3 Species selection
Table 6.1 presents a listing of the species of significance to the chlor-alkali systemconsidered in this investigation. Included within this table is both a justification for theselection of the species and a categorisation of the species in terms of its associateddesirability or undesirability. Some of these species were neither desirable nor undesirable,but were included since they were involved in some of the chemical reactions taking place inthe complex. The inclusion of these species in the Pinch Analysis was not essential sincethey did not constrain the reuse of materials; their inclusion did however provide a morerealistic representation of what was occurring in the system from a mass-balance perspective.
89
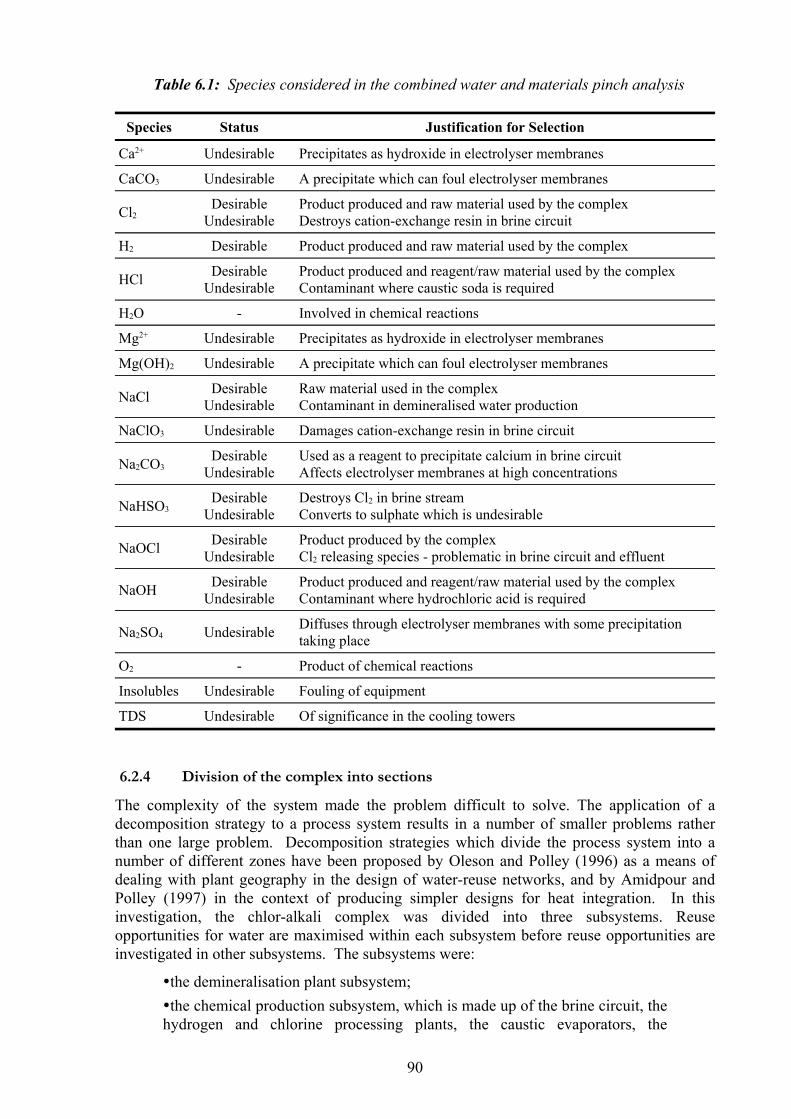
Table 6.1: Species considered in the combined water and materials pinch analysis
Of significance in the cooling towersUndesirableTDS
Fouling of equipmentUndesirableInsolubles
Product of chemical reactions-O2
Diffuses through electrolyser membranes with some precipitationtaking placeUndesirableNa2SO4
Product produced and reagent/raw material used by the complexContaminant where hydrochloric acid is required
DesirableUndesirableNaOH
Product produced by the complexCl2 releasing species - problematic in brine circuit and effluent
DesirableUndesirableNaOCl
Destroys Cl2 in brine streamConverts to sulphate which is undesirable
DesirableUndesirableNaHSO3
Used as a reagent to precipitate calcium in brine circuitAffects electrolyser membranes at high concentrations
DesirableUndesirableNa2CO3
Damages cation-exchange resin in brine circuitUndesirableNaClO3
Raw material used in the complexContaminant in demineralised water production
DesirableUndesirableNaCl
A precipitate which can foul electrolyser membranesUndesirableMg(OH)2
Precipitates as hydroxide in electrolyser membranesUndesirableMg2+
Involved in chemical reactions-H2O
Product produced and reagent/raw material used by the complexContaminant where caustic soda is required
DesirableUndesirableHCl
Product produced and raw material used by the complexDesirableH2
Product produced and raw material used by the complexDestroys cation-exchange resin in brine circuit
DesirableUndesirableCl2
A precipitate which can foul electrolyser membranesUndesirableCaCO3
Precipitates as hydroxide in electrolyser membranesUndesirableCa2+
Justification for SelectionStatusSpecies
6.2.4 Division of the complex into sections
The complexity of the system made the problem difficult to solve. The application of adecomposition strategy to a process system results in a number of smaller problems ratherthan one large problem. Decomposition strategies which divide the process system into anumber of different zones have been proposed by Oleson and Polley (1996) as a means ofdealing with plant geography in the design of water-reuse networks, and by Amidpour andPolley (1997) in the context of producing simpler designs for heat integration. In thisinvestigation, the chlor-alkali complex was divided into three subsystems. Reuseopportunities for water are maximised within each subsystem before reuse opportunities areinvestigated in other subsystems. The subsystems were:
the demineralisation plant subsystem;the chemical production subsystem, which is made up of the brine circuit, the
hydrogen and chlorine processing plants, the caustic evaporators, the
90

hydrochloric acid synthesis plant, the sodium hypochlorite synthesis plant andthe Hydecat destruction plant; and,the cooling circuit subsystem, which is made up of the various cooling
towers and their associated cooling circuits located within the complex.Aside from making it easier to handle the problem from the perspective of optimisation, thesedivisions were justified to some extent on practical grounds. Water from the cooling circuitsubsystem, which may have biological contaminants associated with it, could not be used thedemineralisation plant subsystem or the chemical production subsystem. Similarly, effluentfrom the regeneration cycle of the demineralisation plant subsystem could not be reused inthe chemical production subsystem or the cooling circuit subsystem.
Nevertheless, interactions between these divisions did exist. In particular, demineralisedwater from the demineralisation plant subsystem was required by the chemical productionsubsystem. Similarly, caustic soda and hydrochloric acid from the chemical productionsubsystem were required by the demineralisation plant subsystem. Thus in modelling thesubsystems, it was necessary to account these interactions.
With the subsystem approach to dealing with the chlor-alkali complex, water not reusedinternally within a subsystem was available for reuse in other subsystems. This interactionbetween the subsystems was handled by assigning a hierarchy to each subsystem with respectto the allocation of water resources from other subsystems. As has already been noted, waterfrom the cooling circuit subsystem could not be reused in either of the other subsystems.Demineralised water from the demineralisation plant subsystem could be used in either of theother subsystems, though it may not have been economic to use the water in the coolingcircuit subsystem. The chemical production subsystem however took priority with regard tothe use of demineralised water. Excess water from the chemical production subsystem maysimilarly be reused in either of the other subsystems. However, since the quality of the waterentering the demineralisation plant subsystem had a greater impact on cost than that for thecooling circuit subsystem, priority was assigned to reusing excess water from the chemicalproduction subsystem in the demineralisation plant subsystem. Any of the water notaccepted by the demineralisation plant subsystem was made available for use in the coolingcircuit subsystem.
Figure 6.4 provides a schematic representation of the interactions between the varioussubsystems of the chlor-alkali complex. The strategy for dealing with them was to firstoptimise the water use within each subsystem, regarding the streams flowing between themas fixed, and then to consider the opportunities for reuse between the subsystems.
91

ChemicalProduction
DemineralisationPlant
CoolingCircuit
Water
DemineralisedWater
Caustic Soda,HydrochloricAcid
DemineralisedWater
Figure 6.4 : The interactions between the three subsystems of the complex.
6.2.5 Subsystem modelling
The following sections considers the modelling of each of the individual subsystems inisolation from each other. The different process modules which constitute the varioussubsystems are presented together with their integration into the superstructure framework.As a general strategy for the optimisation of the different subsystems, the initial set ofconcentration constraints imposed on the subsystem superstructures were derived from plantrecords. Relaxation of constraints was considered only in subsequent optimisation runs andonly where appropriate.
6.2.5.1 The demineralisation plant
The demineralisation plant subsystem had only one process module, which was used todescribe both the normal cycle of operation and the regeneration cycle of operation of thedemineralisation plant. This section considers the optimisation of the demineralisation plantsubsystem in isolation from the other subsystems. The demand for demineralised waterwithin the chlor-alkali complex was therefore assumed to remain at the level determined fromthe plant data; this assumption was relaxed when the different subsystems were integrated.
Figure 6.5 shows the different stages of the regeneration sequence, together with the effluentsproduced by each stage and the hold-up volumes at the conclusion of each stage. Thepositioning of the regeneration cycle relative to the normal cycle of operation is alsoindicated. The normal cycle of operation is represented in Figure 6.5a and 6.5h while theregeneration sequence is represented in Figure 6.5c to 6.5g. Figure 6.5b represents thechangeover from the normal cycle of operation to the regeneration cycle.
92

C A
RawWater
RawWater
DeminWater
DeminWater
Raw &DeminWater
Raw &DeminWater
C A DeminWater
DeminWater
(e) Regenerant Displacement
(c) Pre-Inject
(a) Normal Operation
(g) Quality Rinse
C A
RawWater
DeminWater
C A
DeminWater
DeminWater
DeminWater
DeminWater
NaOH,DeminWater
HCl,DeminWater
C ARawWater
RawWater
(f) Fast Rinse
(d) Regenerant Inject
(b) Changeover
(h) Normal Operation
C A
NaOHHCl
NaOHHCl
NaOH, Raw& DeminWater
HCl, Raw & DeminWater
C A RawWater
RawWater
RawWater
RawWater
Raw & DeminWater
Raw & DeminWater
C A
RawWater
DeminWater
Figure 6.5 : The various stages of operation of the demineralisation plant
The progress of fluid through the demineralisation plant during the regeneration sequencemay be described as follows:
Changeover (Figure 6.5b): When the changeover from the normal cycle ofoperation to the regeneration cycle is made, both the anion-exchange (A) andcation-exchange (C) resin beds contain raw water.Pre-Inject Stage (Figure 6.5c): The Pre-Inject stage introduces a small
volume of demineralised water into each resin bed. This demineralised waterdisplaces an equal volume of raw water from the bed. At the end of this stage,the resin bed contains raw water and the small volume of demineralised waterintroduced during the stage.
93

Regenerant Inject Stage (Figure 6.5d): During the Regenerant Inject stage,hydrochloric acid, at the required concentration, is injected into thecation-exchange bed and caustic soda, at the required concentration, isinjected into the anion-exchange bed. As the stage proceeds, water presentlyin the resin beds is displaced by the regenerants. Simultaneously, the cationsare stripped from the cation-exchange resin and replaced by H+ cations whilethe anions are stripped from the anion-exchange resin and replaced by OH-
anions. At the end of the stage, the resin bed volumes are occupied by theregenerants at the concentrations at which they were supplied to the stage.The effluent from this stage comprises a mixture of the raw water displacedfrom the resin beds, the regenerants that have passed through the resin bedsand the ions eluted from the ion-exchange resins.Regenerant Displacement Stage (Figure 6.5e): During the Regenerant
Displacement stage, demineralised water is used to displace the regeneranthold-ups from the Regenerant Inject stage. At the end of this stage, the resinbeds are filled with demineralised water. The effluent from this stage is aweak hydrochloric acid solution from the cation-exchange bed and a weakcaustic soda solution from the anion-exchange bed.
The regeneration sequence is completed by two rinse stages, the Fast Rinse and the QualityRinse:
Fast Rinse Stage (Figure 6.5f): The Fast Rinse stage uses raw water. Thedemineralised water hold-up in the resin bed from the previous stage isdisplaced by this raw water and at the end of the stage the resin bed is filledwith raw water. The effluent from the Fast Rinse stage is a mixture of the rawwater that has passed through the resin beds and the demineralised waterhold-up from the Regenerant Displacement stage.Quality Rinse Stage (Figure 6.5g): The Quality Rinse stage uses
demineralised water. This water is recycled through the resin beds and after aperiod of time, the demineralisation plant returns to the normal cycle ofoperation (Figure 6 2h). No effluent is produced during this stage.
From the preceding description, four demands associated with the regeneration sequence ofthe demineralisation plant may be identified. These demands are for demineralised water,raw water, caustic soda and hydrochloric acid. Raw water is also required by the normalcycle of operation of the demineralisation plant. From a survey of the effluents arising fromthe regeneration cycle, the following potential reuse opportunities are identified:
While the effluents from the Regenerant Inject stage were considered too contaminated forreuse, the effluents from the Displacement stage may be reused in subsequent regenerationcycles. From the cation-exchange bed, the effluent is a weak solution of hydrochloric acidand this could be used when the hydrochloric acid supply for the subsequent cycle isprepared. From the anion-exchange bed, the effluent is a weak solution of caustic soda andthis could be used when the caustic soda supply for the subsequent cycle is prepared. Bothreuse opportunities would result in savings in demineralised water, concentrated regenerant(reagent) and effluent treatment costs.
Effluents from the Fast Rinse stage may be reused during the normal cycle of operation of thedemineralisation plant. This effluent is a mixture of demineralised water and raw water. Itsreuse would result in savings in raw water and effluent treatment costs.
Both of the above opportunities, if feasible, would further result in small reductions in thefrequency of regeneration of the demineralisation plant. The reuse of the effluent (raw water)
94

from the Pre-Inject stage is not considered a viable possibility since the quantity involved issmall.
From a modelling perspective, the superstructure concept implies that all flow emerging froma source in the superstructure must flow to a sink in the superstructure. Thus, all effluentsnot reused directly within the demineralisation plant process module must be sent elsewhere,and two terminal sinks were provided for this purpose. The first sink was used for thestorage of the demineralised water produced by the demineralisation plant while the secondsink represented the effluent treatment facility. The connectivity matrix representing thelogical possibility of connections between process sources and sinks for the demineralisationplant thus appears as shown in Table 6.2. All process sources may be sent to the effluenttreatment facility.
Demands associated with the demineralisation plant process module not satisfied by theassociated process sources must be satisfied by an external source. Two sources of raw waterwere available, namely Umgeni Water (municipal supply), for which an availability limitexisted, and Umbogintwini River water, for which no availability limit existed. A singlesource of hydrochloric acid was available to meet the demands requiring hydrochloric acid,while three sources of caustic soda, each of differing strength, were available to meet thedemands requiring caustic soda. These three sources correspond to the caustic soda producedby the electrolyser, and the caustic soda withdrawn after the first and second effects of thedual-effect caustic evaporators. The connectivity matrix representing the possibleconnections between external sources and sinks for the demineralisation plant is shown inTable 6.3
Table 6.2 : The connectivity matrix between process sources and sinks for thedemineralisation plant subsystem. Shaded squares show disallowed connections.
Demineralised Water
Effluent - Anion Regeneration - FastRinse Stage
Effluent - Anion Regeneration -Regenerant Displacement Stage
Effluent - Anion Regeneration -Pre-inject & Regenerant Inject Stage
Effluent - Cation Regeneration - FastRinse Stage
Effluent - Cation Regeneration -Regenerant Displacement Stage
Effluent - Cation Regeneration -Pre-Inject & Regenerant Inject Stage
Hyd
roch
loric
Aci
dD
eman
d - R
egen
erat
ion
Cau
stic
Sod
a D
eman
d- R
egen
erat
ion
Dem
iner
alis
ed W
ater
Dem
and
- Reg
ener
atio
n
Raw
Wat
er D
eman
d- R
egen
erat
ion
Raw
Wat
er D
eman
d- N
orm
al O
pera
tion
Dem
iner
alis
ed W
ater
Stor
age
Efflu
ent T
reat
men
tFa
cilit
y
Sinks
Sources
95

Table 6.3 : The connectivity matrix between external sources and sinks for thedemineralisation plant subsystem. Shaded squares show disallowed connections.
Caustic Soda (50% m/m NaOH)
Caustic Soda (38% m/m NaOH)
Caustic Soda (32% m/m NaOH)
Hydrochloric Acid (31% m/m HCl)
Umbogintwini River Water
Umgeni Water (Municipal Supply)
Hyd
roch
loric
Aci
dD
eman
d - R
egen
erat
ion
Cau
stic
Sod
aD
eman
d - R
egen
erat
ion
Dem
iner
alis
ed W
ater
D
eman
d - R
egen
erat
ion
Raw
Wat
erD
eman
d - R
egen
erat
ion
Raw
Wat
er D
eman
d- N
orm
al O
pera
tion
Dem
iner
alis
ed W
ater
Stor
age
Efflu
ent T
reat
men
tFa
cilit
y
Sinks
Sources
The unshaded squares in Table 6.2 and Table 6.3 represent the total set of possible networkconfigurations included in the optimisation problem for the demineralisation plant subsystem.It is from this set of configurations that the optimal network configuration was selected.
Figure 6.6 illustrates the model for the demineralisation plant process module. The functionsof the various building blocks associated with the normal cycle of operation and the variousstages of the regeneration sequence are described in Table 6.4.
The objective function for this problem may be stated verbally as follows:
Given two different sources of raw water, together with sources of hydrochloric acid andcaustic soda, the task is to identify an optimal network configuration which achieves therequired rate of production of demineralised water at the lowest cost. This cost includes thecosts associated with the replacement of the cation-exchange and anion-exchange resins, thepurchase of external sources and the disposal of the effluents produced by the system.
The objective function did not include capital costs. Given that this was a retrofit problem,capital costs require of new piping rather than the purchase of costly equipment. Additionalstorage capacity may also be required. It was assumed that the savings in operating coststhrough the more efficient use of water and materials would be sufficient to offset the costsassociated with effecting these minor changes to the process system, so capital costs were notconsidered explicitly.
96

R2
R1
FS1
CS1
FS2
CS2
M1FS3
FS4
FS4FS4
M5
FS5
M2
M3
M4
M6
f1
f2
f3
f6
f7
f5
f4
f8 f9
f10
f11
f13
f12
f14
f15
f17
f18
f16
f11 + f12 + f13
f8 + f9 + f10
f19
RawWater
DemineralisedWater
HydrochloricAcid
CausticSoda
Effluent - Anion- Pre-Inject &- Regenerant Inject
Effluent - Anion- Regenerant- Displacement
Effluent - Anion- Fast Rinse
Effluent - Cation- Regenerant- Displacement
Effluent - Cation- Fast Rinse
Effluent - Cation- Pre-Inject &- Regenerant Inject
DemineralisedWater toRegenerationDemand
Demin water hold-up from cation regenRegen Displacement to Fast Rinsef10
Raw water, demin water and NaOH to anion regenPre-Inject & Regen Inject reaction
f19Demin water to cation regen RegenDisplacementf9
NaOH hold-up from anion regen Pre-Inject & RegenInject to Regen Displacement
f18Demin water to cation regen Pre-Inject &Regen Injectf8
NaOH to anion regen Pre-Inject & Regen Injectf17Raw water to anion regen Fast Rinsef7
Raw water, demin water and HCl to cation regenPre-Inject & Regen Inject reaction
f16anion regen Pre-Inject & Regen Injectf6
HCl hold-up from cation regen Pre-Inject & Regen Injectto Regen Displacement
f15Raw water to cation regen Fast Rinsef5
Mass flow of HCl cation regen Pre-Inject & Regen Inject f14Raw water to cation regen Pre-Inject &Regen Injectf4
Demin water hold-up from anion regen Regen Displace-ment to anion regen Fast Rinse
f13Salts from demin to regenf3
Demin water to anion regen Regen Displacementf12Raw water to regeneration f2
Demin water to anion regen Pre-Inject & Regen Injectf11Raw water to normal operation f1
Figure 6.6 : The model for the demineralisation plant module.
97

Table 6.4 : The building blocks of the demineralisation plant module.
Associated with the anion-exchange regeneration part of the model. Representsthe removal of anions from the anion-exchange resin by the regenerant.R2
Associated with the cation-exchange regeneration part of the model. Representsthe removal of cations from the cation-exchange resin by the regenerant.R1
Associated with the cation-exchange regeneration part of the model. Representsthe combination of demineralised water hold-up from the Regenerant Displace-ment stage (f5) and the raw water effluent from the Fast Rinse stage (f10).
M6
Associated with the cation-exchange regeneration part of the model. Representsthe combination of the hydrochloric acid hold-up from the Pre-Inject & Regener-ant Inject stage (f15) and the demineralised water effluent from the RegenerantDisplacement stage (f 9).
M5
Associated with the anion-exchange regeneration part of the model. Representsthe combination of demineralised water hold-up from the Regenerant Displace-ment stage (f13) and the raw water effluent from the Fast Rinse stage (f7).
M4
Associated with the anion-exchange regeneration part of the model. Representsthe combination of the caustic soda hold-up from the Pre-Inject & RegenerantInject stage (f18) and the demineralised water effluent from the RegenerantDisplacement stage (f12).
M3
Associated with the anion-exchange regeneration part of the model. Representsthe combination of the raw water (f6), demineralised water (f11) and caustic soda(f17) for the Pre-Inject & Regenerant Inject stage. Stream f19 is produced.
M2
Associated with the cation-exchange regeneration part of the model. Representsthe combination of the raw water (f4), demineralised water (f8) and hydrochloricacid (f14) for the Pre-Inject & Regenerant Inject stage. Stream f16 is produced.
M1
Divides the species removed by CS1 into ions which are sent to the cation-exchange and anion-exchange parts of the model.CS2
Effects the removal of species (f3) from the raw water being treated by thedemineralisation plant (f1) such that demineralised water is produced.CS1
Associated with the anion-exchange regeneration part of the model. Divides theflow of caustic soda between the Pre-Inject & Regenerant Inject stage (f17) andthe Regenerant Displacement stage (f18).
FS5
Divides the flow of demineralised water amongst the various stages of theregeneration sequence. f8, f9 and f10 are sent to the cation-exchange regenerationpart of the model while f11, f12 and f13 are sent to the anion-exchange part of themodel. These streams are associated with the Pre-Inject & Regenerant Injectstage (f8 and f11), the Regenerant Displacement stage (f9 and f12) and the FastRinse stage (f10 and f13).
FS4
Associated with the cation-exchange regeneration part of the model. Divides theflow of hydrochloric acid between the Pre-Inject & Regenerant Inject stage (f14)and the Regenerant Displacement stage (f15). The Pre-Inject stage and theRegenerant Inject stage are represented as a single stage in the model.
FS3
Divides the flow of raw water between the cation-exchange regeneration part ofthe model and the anion-exchange regeneration part of the model. Two streamsare sent to the cation-exchange regeneration part of the model (f4 and f5) and twostreams are sent to the anion-exchange regeneration part of the model (f6 and f7).
FS2
Divides the flow of raw water between the normal cycle of operation (f 1) and theregeneration sequence (f2) of the demineralisation plant.FS1
FunctionBuilding Block
98

The regeneration frequency is dependent on the quantity and quality of the water treated bythe plant. As the solver alters the flow configuration in search of the optimum, these mightchange, requiring in turn a change in the regeneration frequency. This will affect thequantities of regenerant chemicals required and the amount of effluent generated by thedemineralisation plant subsystem. While the quantities of these materials and the effluentgenerated will be the same per regeneration cycle, the time-average quantities will bedifferent. In addition, a change in the regeneration frequency will affect on the rate ofproduction of demineralised water.
A cost factor associated with the replacement of the ion-exchange resins was included in theobjective function. In practice, a portion of the ion-exchange resin had to be replacedannually due to resin losses and resin fracture. This portion was related to the number ofregeneration cycles taking place annually, and is thus to the total ionic load removed from theinfluent water.
The model considered the production of an amount of demineralised water over one totalcycle of operation at the current regeneration frequency, that is, the amount of waterproduced between two successive regenerations over a period of 16 h. A demineralisedwater production rate of 16 m3/h is assumed over the normal cycle of operation. Theregeneration procedure lasts 191 min which means that the average rate of production overthe total cycle of operation is 13.3 m3/h.
Figure 6.7 shows the demineralisation plant process module integrated with the externalsources and terminal sinks present in the superstructure as a representation of the overalloptimisation problem for the demineralisation plant subsystem.
UmbogintwiniRiver Water
NaOH (32% m/m)
HCl (31% m/m)
NaOH (50% m/m)NaOH (38% m/m)
Umgeni Water
Demineralised Water StorageUOS Effluent Treatment
External Sources
Terminal Sinks
Demineralisation Plant Process Module
Effluent - Anion - Fast Rinse
Rawwater
DemineralisedWater Produced
HydrochloricAcid
CausticSoda
Effluent - Anion - Pre-Inject &Regenerant Inject
Effluent - Anion - RegenerantDisplacement
Effluent - Cation - RegenerantDisplacementEffluent - Cation - Fast Rinse
Effluent - Cation - Pre-Inject &Regenerant Inject
DemineralisedWater RegenDemand
Figure 6.7 : Diagram showing the integration of the demineralisation plant processmodule with the external sources and terminal sinks present in the superstructure as arepresentation of the overall optimisation problem for the demineralisation plantsubsystem.
99

Table 6.5 : Comparison of water and material requirements and effluent productionassociated with the existing network configuration and the optimised networkconfiguration.
202.64195.13[kg]NaCl Load to Effluent
14.5122.42[t]Effluent
241.18239.20[t]Demineralised Water Available toOther Subsystems
00[kg]Caustic Soda (50% m/m NaOH)
00[kg]Caustic Soda (38% m/m NaOH)
407.70390.00[kg]Caustic Soda (32% m/m NaOH)
366.42350.00[kg]Hydrochloric Acid (31% m/m HCl)
254.93260.90[t]Total Water
0130.45[t]Umgeni Water
254.93130.45[t]Umbogintwini River Water
1.221[ ]Number of Regeneration Cycles
254.87254.87[t]Demineralised Water Produced
Optimised ConfigurationExisting Configuration Unit
UmbogintwiniRiver Water
HCl (31% m/m)
NaOH (32% m/m)
DemineralisedWater Storage
UOS EffluentTreatment
HydrochloricAcid
DemineralisedWater RegenDemand
CausticSoda
Rawwater
Storage
Storage
Effluent - Anion- Fast Rinse
DemineralisedWater Produced
Effluent - Anion- Pre-Inject &- Regenerant Inject
Effluent - Anion- Regenerant- Displacement
Effluent - Cation- Regenerant- Displacement
Effluent - Cation- Fast Rinse
Effluent - Anion- Pre-Inject &- Regenerant Inject
Figure 6.8 : Diagram showing the optimal network configuration for thedemineralisation plant subsystem
The results of the optimisation are summarised in table 6.5 and figure 6.8
The notable features of the solution from the optimisation of the demineralisation plantsubsystem are:
100

Only Umbogintwini River water is used in the production of demineralisedwaterA portion of the NaOH containing effluent from the Regenerant
Displacement stage of the anion regeneration is used in the preparation of thedilute caustic soda required for the subsequent regeneration cycle. HClcontaining effluent from the Regenerant Displacement stage of the cationregeneration is reused in a similar way.Effluent from the Fast Rinse stages of the cation and anion regenerations is
recovered completely and used in the production of demineralised water.There is an increase in the frequency of regeneration of the demineralisation
plant. This increase is due to the exclusive use of the Umbogintwini Riverwater rather than the blend of Umgeni Water and Umbogintwini River water.This indicates that the costs associated with the increased regenerationfrequency are offset by the savings accrued through the use of the lessexpensive, but lower quality, water source.There are increases in the amounts of caustic soda and hydrochloric acid
required in the production of the fixed quantity of demineralised water.However, the quantity of water required for this production and the effluentassociated with this production are reduced. The NaCl load associated withthe effluent does however show a slight increase. The proportion of the total demineralised water production available to the
rest of the plant has increased in the optimal configuration; a smallerproportion of the water treated by the demineralisation plant is used forregeneration purposes, despite the increase in regeneration frequency.There is a 36 % reduction in the quantity of effluent produced by the optimal
configuration, and an 18 % reduction in the overall operating cost. Thisreduction sees a decrease in the unit cost associated with demineralised waterfrom R 4.71 per ton to R 3.88 per ton.
The implementation of the proposed reuse strategy would have involved only minor processchanges.
6.2.5.2 The Chemical Production subsystem
The chemical production subsystem included the brine circuit, the hydrogen and chlorineprocessing plants, the caustic evaporators, the hydrochloric acid synthesis plant, the sodiumhypochlorite synthesis plant, the Hydecat destruction plant, and a number of other associateddemands and sources of water located within the chlor-alkali complex. This subsectionconsiders the optimisation of the chemical production subsystem in isolation from the othersubsystems. Allowance was made for the various interdependencies that existed between thechemical production subsystem and the demineralisation plant subsystem.
Figure 6.9 shows the chemical production subsystem in terms of its constituent plants. Eachof these divisions in turn may consist of a number of process modules.
101

Hypo-chlorite
Synthesis
Brine Circuit
CausticEvaporation
H2Processing
HydecatDestruction
Unit
Cl2Processing
HClSynthesis
Point SourcesPoint Demands
DemineralisationPlant
Chemical Production SubsystemDemineralisationPlant Subsystem
Hydrochloric Acid,Caustic Soda
Demineralised Water
Figure 6.9 : The chemical production subsystem and its existing interactions with thedemineralisation plant subsystem.
The brine circuit was the major component of the chemical production subsystem, and thevarious operations making up the circuit were modelled as a number of process modules(refer to figure 6.2). A series of raw material purification steps preceded the electrolyser andconditioned the brine to a standard acceptable to the electrolyser. The chief contaminantsthat these operations removed were calcium and magnesium, which were impurities in theraw salt introduced at the resaturator. This purification sequence was considered to be fixed,and not subject to the optimisation.
Figure 6.10 presents the brine circuit model as a collection of process modules. Theseprocess modules include the electrolyser, primary dechlorination, secondary dechlorination,precipitation, clarification, primary filtration, secondary filtration and cation-exchange. Itshould be noted that while the brine circuit is modelled as a collection of process modules,the required sequence of the raw material purification steps is established by theincorporation of the necessary logic into the connectivity matrix.
102

ClarificationPrecipitationSecondaryDechlorination
PrimaryFiltration
Electrolyser
PrimaryDechlorination
The Brine Circuit
Ion-Exchange SecondaryFiltration
Figure 6.10 : The brine circuit model process modules.
The electrolyser module
The electrolyser module contained elements which model the conversion of NaCl to productsand by-products, the transfer of species across the membrane into the caustic soda solutionand the processing of the chlorine and hydrogen gases produced by the electrolyser. Inaddition, the process module included an element for the dosing of hydrochloric acid to thelean brine emerging from the electrolyser.
Three demands and five sources were associated with the electrolyser process module. Thedemands are for brine, demineralised water (a process requirement) and hydrochloric acid,while the sources produced by the process module were treated brine, caustic soda andcondensate from the chlorine and hydrogen coolers and hydrogen chiller. The treated brinewas routed to the primary dechlorination process module as a process requirement. Thecaustic soda could be used within the complex or sent to the caustic evaporators. Thecondensate from the chlorine cooler could be sent to either of the dechlorination stages or tothe sodium hypochlorite synthesis module. No restrictions were placed on the routing of thecondensate from the hydrogen cooler and chiller.
The primary dechlorination process module
The primary dechlorinator was used air to strip chlorine from the brine stream. Alongside theremoval of chlorine, water was also removed from the brine. The quantity of water removedfrom the brine was assumed to be the same as that currently removed by the dechlorinators,while the removal of chlorine was represented by a removal ratio. The primarydechlorination process module had a single brine inlet and produces two sources of material,that is, a dechlorinated brine stream and a waste chlorine stream. The dechlorinated brinewas sent to the secondary dechlorination stage as a process requirement, while the wastechlorine stream was sent to the sodium hypochlorite synthesis module.
The secondary dechlorination process module
The secondary dechlorination module had three demands associated with it, that is, brine,caustic soda and sodium bisulphite. Caustic soda was used for the neutralisation of any
103

hydrochloric acid remaining in the brine coming from the primary dechlorination stage, whilesodium bisulphite was added to destroy residual chlorine present in the brine.
The precipitation process module
The precipitation of calcium as calcium carbonate and the precipitation of magnesium asmagnesium hydroxide were represented together in the precipitation process module. Themodule had associated with it three demands and one source. The demands were for brine,caustic soda and sodium carbonate. The source was the brine stream emerging from themodule, and was routed to the clarification process module.
The clarification process module
This module removed insoluble matter from the brine stream as brine sludge. Two demandsand two sources were associated with the module. The demands were for brine andflocculant, while the sources produced by the process module were a brine sludge stream anda clarified brine stream. The dose of flocculant was assumed to be proportional to theamount of solid material removed from the brine stream. The flocculant itself was notrepresented in the model since the assumption is made that it is completely removed by theclarification process; only the dilution water accompanying the flocculant was represented inthe model. The removal of solids was modelled in terms of a removal ratio and the totalsolids fraction associated with the brine sludge was assumed constant. The brine sludgestream emerging from the process module was routed to the terminal effluent sink, while theclarified brine was routed to the primary filtration process module.
The primary filtration process module
Both the normal cycle of operation and the backwash cycle, on a time-average basis, wererepresented in the model for the primary filtration process module. Correspondingly, therewere two demands and two sources associated with this module. The demands were for brineby the normal cycle of operation and by the backwash cycle of operation. The demand by thebackwash cycle was assumed proportional to the amount of material removed by the filter. Aremoval ratio was used to represent the removal of insoluble matter from the brine stream,while removal ratios were also used to represent the concentration differences of calcium andmagnesium observed across the filter. The brine stream emerging from the normal cycle ofoperation could be routed to the backwash cycle of the primary filtration process module ifdeemed appropriate by the optimisation. Brine from the backwash cycle was routed to theclarification module.
The secondary filtration process module
The secondary filtration process module had two demands and two sources associated with it.These demands are for brine and for alpha-cellulose. The secondary filtration stage usescandle filters, and alpha-cellulose is used as the filter aid. The amount of alpha-cellulosedosed to the brine was assumed proportional to the material removed by the filter. Thealpha-cellulose itself was not represented in the model since it was completely removedduring the filtration stage and only the water accompanying its addition was represented. Asuitable cost factor was however attached to the alpha-cellulose inlet to account for thepurchase cost associated with the alpha-cellulose. The removal of material was modelledusing a removal ratio for insoluble material; removal ratios were also used to represent thecalcium and magnesium concentration differences observed across the filter. The brinestream emerging from the process module was routed to the cation-exchange process moduleand possibly to the backwash cycle of the primary filtration process module. The solidsremoved by the filtration process (excluding the spent filter medium) were routed to the
104

terminal effluent treatment sink. An appropriate cost factor was applied to the materialremoved by the filter to represent the cost associated with the disposal of this solid waste.
The cation-exchange process module
The cation-exchange module was similar to the demineralisation plant module and both thenormal cycle of operation and the regeneration cycle of operation were considered. Themodule had two demands for brine, one by the normal cycle of operation and one by theregeneration cycle of operation, and demands for hydrochloric acid, caustic soda and water.Eight sources were associated with the module. Apart from the brine stream emerging fromthe normal cycle of operation which was routed to the electrolyser module, there were sevensources associated with the regeneration cycle of operation. These sources corresponded tothe seven stages of the regeneration procedure, that is, Brine Displacement, Backwash, AcidRegeneration, Acid Displacement, Caustic Regeneration, Caustic Displacement and BrineReplacement. The possible reuse opportunities for these effluents were as follows:
The effluents from the Brine Displacement and Brine Replacement stageswere mixtures of demineralised water and polished brine. These effluentscould be recycled to the brine circuit.Effluent from the Backwash stage was assumed to be of demineralised water
quality but may have some filterable material present in it. This effluent couldbe recycled to the brine circuit, possibly at some point before the filtrationstage.The effluents from the Caustic Regeneration and Caustic Rinse stages were
both mixtures of demineralised water and caustic soda. These effluents couldbe reused directly in the preparation of the caustic soda requirement for thesucceeding regeneration cycle or elsewhere in the chemical productionsubsystem.Effluent from the Acid Rinse stage was a mixture of hydrochloric acid and
demineralised water. This effluent could be reused when the hydrochloricacid requirement for the succeeding regeneration cycle is prepared.Effluent from the Acid Regeneration stage was a mixture of hydrochloric
acid, demineralised water and cations eluted from the cation-exchange resin.This effluent is thus a mixture of desirable species (HCl) and undesirablespecies (CaCl2 and MgCl2). In practice, ion-exchange is typically a final polishing step in a series of
purification steps. Much of the cation load entering the brine circuit will thushave been removed by this stage and the cation load associated with theeffluent is therefore not large. Clearly, with some hydrochloric acid beingpresent in the effluent, there is a certain inherent value associated with thiseffluent. Conceivably, the effluent could be used in the hydrochloric aciddosing of the brine in the electrolyser process module. The question ishowever raised as to whether the cost associated with the removal of anadditional load of cations from the circuit is offset by the savings accrued fromthe recovery of HCl.
The above possibilities were included in the connectivity matrix of the chemical productionsubsystem.
The caustic evaporation plant process module
This module had two demands and four sources associated with it. The demandscorresponded to the inlets for caustic soda to the first and second effects, while two of the
105

sources corresponded to the concentrated caustic soda produced by the first and secondeffects. The remaining sources corresponded to the steam condensate produced by the firsteffect and the process condensate removed from the caustic soda during the evaporationprocess. The steam required by the first effect was assumed to be proportional to the causticsoda throughput.
Two terminal storage sinks were included in the superstructure to accept any concentratedcaustic soda from either the first or second effect of the caustic evaporator. Both of thesesinks had an appropriate cost factor associated with them which provided an incentive forcaustic soda to be sent to these sinks as opposed to the effluent sink.
The hydrochloric acid synthesis process module
The raw materials used in the production of hydrochloric acid are hydrogen gas, chlorine gasand demineralised water. As there were no other acceptable sources of raw materials presentin the complex except those currently used, the hydrochloric acid synthesis plant was notconsidered in the optimisation. The hydrochloric acid product was however available for usein the rest of the complex.
The hydrogen chloride scrubber associated with the elimination of gaseous hydrogen chloridereleased from the hydrochloric acid product storage vessels was however represented in themodule. This scrubber had a single caustic soda demand and produced a single caustic sodasource. With the amount of hydrochloric acid produced by the complex constant, themass-load of gaseous hydrogen chloride entering the scrubber was considered fixed. Thecaustic soda effluent was available for reuse. NaOH was modelled as a desirable species atthe inlet of the scrubber.
The sodium hypochlorite plant process module
Unlike the case of the hydrochloric acid synthesis plant, raw materials for the production ofsodium hypochlorite could be drawn from a number of sources within the complex. Thesodium hypochlorite plant was thus included in the optimisation model and was representedby a demand requiring a specific flowrate of material. Here, Cl2 and NaOH were modelled asdesirable species. The amount of waste sodium hypochlorite sent to the Hydecat destructionprocess module was considered fixed.
The Hydecat destruction process module
The function of this module was the destruction of the excess or off-specification sodiumhypochlorite. It has a single demand associated with it and produced a single source. Wastesodium hypochlorite and steam were sent to this demand as enforced matches; dilution waterwas added to this mixture such that the resulting concentration of NaOCl was below themaximum permitted by the operation. Umbogintwini River water was used for this purposein the existing network configuration. The effluent produced by the process module has arelatively high concentration of NaCl and the recovery of this effluent was be a possibility.Alternatively, this effluent was routed to the effluent terminal sink.
Point sources and demands
A number of point sources and demands were present on the complex. The point sourcesincluded effluent from the chlorine filter, pump seals and condensate from a number ofdifferent sources such as the brine and catholyte heat-exchangers, intercondensors and othersteam traps. With the exception of the effluent from the chlorine filter, which has aconcentration of chlorine associated with it, these sources were assumed to have a qualityclose to that of demineralised water. While other point sources did exist, such as theeffluents from plant washing, pressure testing and cylinder steaming, these effluents wereconsidered to be either too contaminated for reuse or too difficult to recover and were not
106

considered in the Pinch Analysis. Point demands associated with these operations were alsonot considered due to variability in these demands; the quantities involved were howeversmall. The desuperheater and the pump seals represented further point demands; theseoperations could only use demineralised water and were excluded from the analysis.
The chemical production subsystem objective function
The objective function for the optimisation of the chemical production subsystem may bestated verbally as follows:
The system under consideration comprises the brine circuit and its associated processmodules, the caustic evaporation process module, the hydrochloric acid synthesis processmodule, the sodium hypochlorite synthesis process module, the Hydecat destruction processmodule, and a number of point sources and demands. Given different material resources,which include water, caustic soda, hydrochloric acid, raw salt, sodium carbonate and sodiumbisulphite and other materials such as the flocculant and alpha-cellulose, the task is toidentify an optimal network configuration which achieves the required rates of production ofchlorine gas, hydrochloric acid and sodium hypochlorite at the lowest cost. This costincludes the costs associated with the replacement of the cation-exchange resin, the purchaseof external sources and the disposal of wastes and effluents produced by the system.
Table 6.6 presents the results obtained from the optimisation using GAMS CONOPT.
Table 6.6 : Comparison of the water and material requirements and effluentproduction associated with the existing network configuration and the optimal networkconfiguration for the chemical production subsystem.
72.5672[h]Duration of Normal Cycle of Operation ofCat ion-Exchanger
84.039.9[kg/d]NaOH Load to Effluent
13.7314.2[t/d]NaCl Load to Effluent
37.6339.86[kg/d]Solid Waste
104.20235.19[t/d]Effluent
71.6770.80[t/d]Steam
14.7214.73[t/d]Chlorine
29.0131.08[kg/d]Alpha-Cellulose
8.037.77[kg/d]Flocculant
353.7359.5[kg/d]Sodium Bisulphite
1.0611.055[t/d]Sodium Carbonate
00[t/d]Caustic Soda (50% m/m NaOH)
00[t/d]Caustic Soda (38% m/m NaOH)
66.8267.21[t/d]Caustic Soda (32% m/m NaOH)
6.737.18[t/d]Hydrochloric Acid (31% m/m HCl)
142.71142.96[t/d]Raw Salt
98.64232.71[t/d]Total Water
034.62[t/d]Umbogintwini River Water
98.64198.09[t/d]Demineralised Water
Optimised ConfigurationExisting Configuration Unit
107

The saving in running costs that would be obtained by implementing the optimised solutionwas calculated at R 730 313 per annum, (rand values for the year 2000).
The optimised solution involved 74 connections, of which 39 were new. Presenting this as adiagram would be ineffective. The most significant features of the solution were:
The optimal network configuration shows a reduction of 58 % in the amountof water used and a reduction of 56 % in the amount of effluent produced bythose elements of the subsystem included in the optimisation model. There are slight improvements in the consumption of raw salt, hydrochloric
acid, caustic soda, sodium bisulphite, alpha-cellulose and chlorine gas. Theproposed network configuration however uses more sodium carbonate,flocculant and steam.The salt load associated with the effluent has decreased slightly from the
existing configuration but there is a slight increase in the NaOH load.The optimal configuration shows a slight decrease in the regeneration
frequency for the ion-exchange plant.6.2.6 The cooling circuit subsystem
The cooling circuit subsystem comprised the four cooling towers and their associated coolingcircuits located on the chlor-alkali complex, that is, the Linde, Sulzer, LC and MBC coolingcircuits. The Linde and Sulzer cooling circuits were associated with the liquefaction ofchlorine while the LC and MBC cooling circuits met the cooling requirements associatedwith the use of liquefied chlorine and the brine circuit respectively. In optimising thissubsystem, thermal effects were not considered and the assumption was made that thenecessary cooling requirements of the complex could be met if the flowrates to the variouscooling towers were maintained at their current levels.
The model subsystem comprised four modules representing each of the cooling towers andtheir associated cooling circuits. With the mathematical models being identical for all thecooling towers, the module is considered generally in the following discussion.
With regard to the formulation of a model to represent the operation of the cooling towers,two effects are noted. Firstly, there is the evaporation of water from the cooling tower whichconcentrates the dissolved species present in the water. The second effect is the absorption ofcarbon dioxide from the atmosphere which increases the carbonate concentration in thewater. With plant data collected for the cooling circuit subsystem not being conclusive on itsown, simulation was required in conjunction with this data in deriving models for the variouscooling towers. Here, the assumption was made that no dissolved solids are removed by theevaporation process. The absorption of carbon dioxide from the atmosphere by the water wasthen approximated by the addition of a mass-load of Na2CO3. This quantity was derived fromthe equilibrium concentration of carbonate in the water (following evaporation) in contactwith the atmosphere, as determined using the aquatic speciation software packageMINTEQA2 (Allison et al., 1991). It was assumed that this mass-load addition wasindependent of concentration in the concentration range considered by the optimisation.
The process module for each cooling tower had a single water demand and a single watersource associated with it. The blowdown flows were not specified in the models, since thesewere determined during the course of the optimisation and subject to the inlet concentrationlimits of the cooling towers (which are maintained at their existing concentrations initially).With the cooling towers only using water, it was not necessary to represent all species in themodel. The species included in the model was the total dissolved solids (TDS).
108

In considering the optimisation of the cooling circuit subsystem in isolation from the othersubsystems, only the water sources presently available to the subsystem were considered inthe optimisation. Any water sources currently used by the other subsystems, but not used inthe optimised scenarios were considered unavailable to the cooling circuit subsystem at thisstage. The objective function for the optimisation of the cooling circuit subsystem may thusbe stated as follows:
The system comprises process modules representing the four cooling towers located on thechlor-alkali complex and their associated cooling circuits. Given a single external source ofwater, the task is to identify an optimal network configuration which is able to supplysufficient water to each of the cooling towers, subject to the associated quality constraints, atminimum cost. This cost includes the costs associated with the purchase of the water and thedisposal of the blowdown effluent produced by the subsystem. Thermal effects are notconsidered in the optimisation.
Table 6.7 presents the comparison between the results obtained from the optimisationproblem and the current operating scenario while Figure 6.11 presents the proposed networkconfiguration for the cooling circuit subsystem.
Table 6.7 : Comparison of the water requirement and effluent production associatedwith the existing network configuration and the optimal network configuration for thecooling circuit subsystem.
109.66128.12[t/d]Effluent
828.16846.62[t/d]Umbogintwini River Water
Optimised ConfigurationExisting Configuration Unit
UmbogintwiniRiver Water
UOS Effluent Treatment
LC Inlet
MBC Inlet
Sulzer Inlet
Linde InletLinde Outlet
LC Outlet
MBC Outlet
Sulzer Outlet
Figure 6.11 : The optimised network configuration for the cooling circuit subsystem.
109

6.2.7 Subsystem integration
Having considered the optimisation of the three individual subsystems in isolation from eachother, attention now shifts to the integration of these subsystems. Before the strategy forintegrating the subsystems is described, it is necessary to consider some of the effects arisingfrom the optimisation of the individual subsystems.
The first of these effects relates to the decrease in demand for demineralised water by thechemical production subsystem, which means that the rate of production of demineralisedwater should decrease.
There were a number of good quality water sources present within the chemical productionsubsystem which might be more effectively used in the demineralisation plant subsystem. Inthe network configuration proposed by the optimisation of the chemical productionsubsystem in isolation from the other subsystems, these water sources were routed to theHydecat destruction plant. It was however feasible to use Umbogintwini River water for thispurpose instead, releasing the better quality water for the demineralisation plant.
The use of demineralised water in the cooling circuit subsystem has the effect of increasingthe overall demand for demineralised water. This results in an increase in the regenerationfrequency of the demineralisation plant. With this increase in regeneration frequency, theproportion of the total feed water to the demineralisation plant supplied by the chemicalproduction subsystem decreases and the unit cost of the demineralised water increases onceagain. As such, the use of demineralised water is only economically feasible as long as theunit cost for demineralised water remains below R2.695 per ton. It is thus possible to use anyadditional demineralised water in the cooling circuit but only to the extent that the unit costdoes not rise above the threshold value. This value is thus a significant point in theintegration strategy since it marks the change in the pattern of use of the demineralised water.
One further effect of the changing regeneration frequency is that it changes the amount ofcaustic soda required for the regeneration of the demineralisation plant. This amount must besupplied from the chemical production subsystem. A decrease in the regeneration frequencyresults in a decrease in the demand for caustic soda by the demineralisation plant. This inturn results in an increased throughput of caustic soda to the caustic evaporators. More steamis required to effect the evaporation and more condensate is produced from the evaporationprocess. The increase in the amount of condensate in turn will affect the amount of goodquality water available for export to the demineralisation plant and thus brings further changein the regeneration frequency of the demineralisation plant.
In light of these considerations, an iterative procedure is required for the integration of thesubsystems. This strategy is outlined as follows:
1) Initially, the assumption is made that there is no export of water from the chemicalproduction subsystem to the demineralisation plant subsystem. In addition, it is assumedthat the caustic soda demand from the demineralisation plant is the same as that of theexisting network configuration. The unit cost of demineralised water is similarlyassumed to be the same as that associated with the existing network configuration.
2) From the optimisation of the demineralisation plant subsystem, the quantity of wateravailable to the rest of the plant, the amount of caustic soda required for regeneration inproducing this quantity of water and the unit cost of demineralised water are recorded.
3) From the optimisation of the chemical production subsystem, the daily quantity of wateravailable for export from the chemical production subsystem and the demand fordemineralised water by those elements of the subsystem included in the optimisationmodel are recorded. The total daily demand for demineralised water by the chemical
110

production subsystem is determined by incorporating the demand associated with thoseelements not included in the optimisation model.
4) Based on the chemical production subsystem's annual demand for demineralised water,the number of regeneration cycles per annum and the total cycle time for thedemineralisation plant are calculated. The amount of water available for export to thedemineralisation plant subsystem from the chemical production subsystem during thisperiod is then determined. The demineralisation plant subsystem model is updated to reflect this amount of wateravailable from the chemical production subsystem and the model is optimised oncemore. As previously, the amount of caustic soda required for regeneration, the amountof demineralised water available to the rest of the plant and the unit cost ofdemineralised water are recorded.
5) Based on the results obtained from the optimisation of the demineralisation plantsubsystem model, the daily demand for caustic soda is determined. The model for thechemical production subsystem is modified to reflect the updated unit cost ofdemineralised water and the updated caustic soda demand as derived from Step 4). Fromthe optimisation of the chemical production subsystem, the daily quantity of wateravailable for export and the daily demineralised water demand are recorded.
6) If the criteria for convergence is satisfied, the procedure stops at this point. If thiscriteria is not satisfied, Step 4 is repeated.
Table 6.8 presents a comparison between the annual material consumption and effluentproduction figures for various subsystems of the chlor-alkali complex in their existingconfigurations and those configurations proposed by the optimisation. These figures reflectthe behaviour of the subsystems in combination with each other. The figures associated withthe existing network configuration have been adjusted to reflect the performance of thevarious subsystems on an integrated basis. Table 6.9 combines the figures from Table 6.8and presents a comparison between the two network configurations of the chlor-alkalicomplex in terms of the total consumption of materials and production of effluent.
The most notable features of these results are:
The demineralisation plant shows a significant improvement in itsperformance with the decrease in the demand for demineralised water by therest of the complex. Alongside this decrease, the frequency of regenerationdecreases such that the normal cycle of operation is now 27.4 h instead of 16.6h in the existing configuration. The unit cost associated with thedemineralised water decreases from R 4.710 to R 3.193 per ton.A decrease in the amount of caustic soda required by the subsystem is
observed compared to the demand associated with the subsystem when it isoptimised in isolation from the other subsystems.In total, the potential economic savings associated with the proposed network
configuration amount to R 945 727 per annum based on costs from the year2000. This solution achieves a 14 % reduction in the amount of water used bythe complex and a 42 % reduction in the amount of effluent generated.
Figure 6.12 presents a schematic diagram showing the interactions between the varioussubsystems as they exist in the proposed optimal configuration. The demineralisation plantsubsystem now treats raw water and regenerates effluent from the chemical productionsubsystem.
111

Table 6.8 : Comparison of materials used and waste generated by the chlor-alkalicomplex in its existing network configuration and the optimal network configuration.
-584 844-[R/y]Annual Saving* (AS2)
613 54514 349[kg/y]Solid Waste
-11030.2214.36[t/y]NaOH Load in Effluent
24 9455 047[t/y]NaCl Load in Effluent
5539 28786 655[t/y]Effluent
6.610 44411 188[kg/y]Alpha-Cellulose
-3.32 8902 797[kg/y]Flocculant
-1.325 82825 487[t/y]Steam
0260.4260.4[t/y]Hydrogen
0.0511 79711 802[t/y]Chlorine
6.22 4242 584[t/y]Hydrochloric Acid (31% m/m HCl)
1.323 88124 196[t/y]Caustic Soda (32% m/m NaOH)
1.6127.3129.4[t/y]Sodium Bisulphite
-0.54382.1380.0[t/y]Sodium Carbonate
0.1751 37751 464[t/y]Raw Salt
3082 885118 686[t/y]Total Water
014 37814 378[t/y]Umbogintwini River Water
3468 507104 308[t/y]Demineralised Water
Chemical Production Subsystem
-27.416.6[h]Duration of Normal Operation
35282436[/y]Number of Regeneration Cycles
323.1934.710[R/t]Unit Cost of DemineralisedWater
-294 615-[R/y]Annual Saving* (AS1)
490.490.96[t/y]NaOH Load in Effluent
454785[t/y]NaCl Load in Effluent
663 3619 779[t/y]Effluent
4485153[t/y]Hydrochloric Acid(31% m/m HCl)
4494170[t/y]Caustic Soda (32% m/m NaOH)
3671 679111 144[t/y]Demineralised Water Produced
4758 967111 164[t/y]Total Water
100055 582[t/y]Umgeni Water
-658 96755 582[t/y]Umbogintwini River Water
Demineralisation Plant Subsystem
Improvement[%]
OptimalConfiguration
ExistingConfiguration
Unit
112

Table 6.8 continued
-945 727-[R/y]Total Annual Saving(AS1 + AS2 + AS3)
-66 268-[R/y]Annual Saving* (AS3)
220.721.2[t/y]NaCl Load in Effluent
1439 47846 124[t/y]Effluent
2298 136304 782[t/y]Umbogintwini River Water
Cooling Circuit Subsystem
Improvement[%]
OptimalConfiguration
ExistingConfiguration
Unit
This network configuration has the advantage that most of the retrofit work involves routingthe effluent streams to the demineralisation plant. Once there, the piping is already in placeto distribute the demineralised water to the appropriate demands.
Table 6.9 : Comparison between the total consumption of materials and wastegenerated across all subsystems of the chlor-alkali complex in its existing networkconfiguration and the optimal network configuration.
-945 727-[R/y]Annual Saving
5.613 54514 349[kg/y]Solid Waste
-10030.715.3[t/y]NaOH Load in Effluent
2.75 0135 153[t/y]NaCl Load in Effluent
4282 126142 557[t/y]Effluent
6.610 44411 188[kg/y]Alpha-Cellulose
-3.32 8902 797[kg/y]Flocculant
-1.225 82825 487[t/y]Steam
0260.4260.4[t/y]Hydrogen
0.0511 79711 802[t/y]Chlorine
1.6127.3129.4[t/y]Sodium Bisulphite
-0.53382.1380.0[t/y]Sodium Carbonate
0.1751 37751 464[t/y]Raw Salt
8.32 5092 737[t/y]Hydrochloric Acid (31% m/m HCl)
1.623 97524 366[t/y]Caustic Soda (32% m/m NaOH)
3468 507104 308[t/y]Demineralised Water
14371 481430 325[t/y]Total Water
100055 582[t/y]Umgeni Water
0.9371 481374 743[t/y]Umbogintwini River Water
Improvement[%]
OptimalConfiguration
ExistingConfiguration
Unit
113

ChemicalProduction
DemineralisationPlant
CoolingCircuit
Water
DemineralisedWater
Caustic Soda,HydrochloricAcid
UmbogintwiniRiver Water
UOS EffluentTreatment
Figure 6.12 : Schematic diagram showing the distribution of water and collection ofeffluent from the subsystems of the chlor-alkali complex in its proposed optimalconfiguration.
6.3 Discussion and conclusions
This study represented the most comprehensive attempt to provide a thorough theoretical andpractical treatment of the process water pinch analysis problem. The issue of utility waterpinch analysis vs. process water pinch analysis was one which was encountered in some formin all the case studies undertaken during this project and WRC Project K5/851 that precededit. It seems that, at least in the context of a water-poor country like South Africa, that thelimitation to considering only utility water is a significant restriction. Clearly the extendedtheory is more complex and requires much more effort to apply. The individual processmodules have to be individually crafted, and require much more insight and modelling skillthan those which have been found adequate for utility water pinch analysis. The risks ofmaking changes which will adversely affect the process involved are also greater.
Some perspective on these issues can be obtained from a utility water pinch analysis of thesame chlor-alkali system carried out using the Linnhoff-March WaterPinch software, basedon the same input data. A comparison between the results of the (utility) water pinchanalysis results and the combined water and materials pinch analysis are shown in table 6.10.
The Water Pinch Analysis study was able to realise 57% of the total saving achieved byCombined Water and Materials Pinch Analysis. In terms of water abstraction and effluentgeneration, relatively small changes are observed between these two studies with theCombined Water and Materials Pinch Analysis achieving a further 3 % reduction in the totalamount of water used and an additional 10 % reduction in terms of the amount of effluentgenerated. It is however in the area of chemical recovery and reuse where Combined Waterand Materials Pinch Analysis outperforms Water Pinch Analysis and much of the additionalcost saving is attributable to this.
114
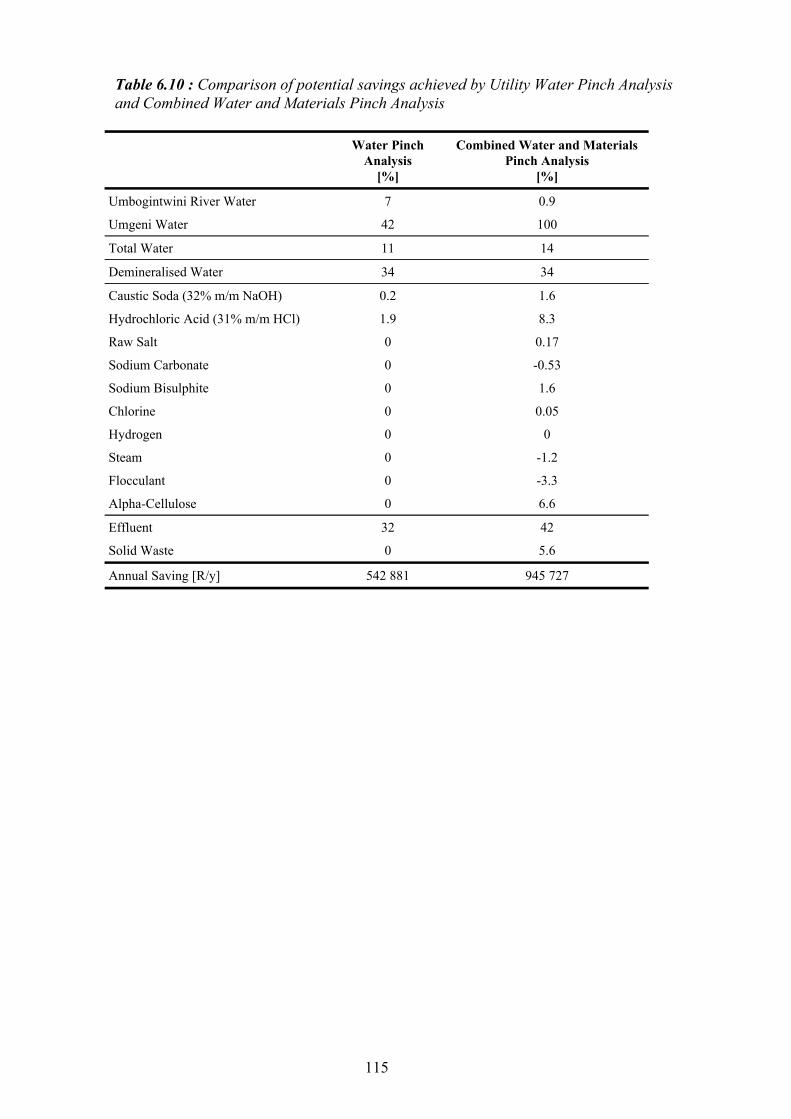
Table 6.10 : Comparison of potential savings achieved by Utility Water Pinch Analysisand Combined Water and Materials Pinch Analysis
945 727542 881Annual Saving [R/y]
5.60Solid Waste
4232Effluent
6.60Alpha-Cellulose
-3.30Flocculant
-1.20Steam
00Hydrogen
0.050Chlorine
1.60Sodium Bisulphite
-0.530Sodium Carbonate
0.170Raw Salt
8.31.9Hydrochloric Acid (31% m/m HCl)
1.60.2Caustic Soda (32% m/m NaOH)
3434Demineralised Water
1411Total Water
10042Umgeni Water
0.97Umbogintwini River Water
Combined Water and MaterialsPinch Analysis
[%]
Water PinchAnalysis
[%]
115
7 TECHNOLOGY TRANSFER
The main thrusts of this project were technology evaluation and technology transfer. Waterpinch analysis appeared in the literature as a technique that held much promise in the SouthAfrican context, and the project sought to test it on South African processes, and promote itsuse by South African industries. Any theoretical aspects arose purely in response toproblems encountered along the way. The chief modus operandi was to promote the waterpinch concept to industries, and wherever possible to recruit engineering personnel from thecompanies involved to enrol for part-time MScEng degrees, undertaking water pinch analysisstudies in their factories. Some more conventional academic projects involving full-timeMScEng students and one PhD have served to generate theoretical support for situationswhere the current techniques were not completely adequate. In all cases the projects werecentred on industrial case studies.
7.1 Industry based part time MScEng projects
The success of Thokozani Majozi’s project at Sanachem, which was undertaken during thepreceding water pinch project and presented in WRC report 851/01/03, prompted us to adoptthe idea of enrolling process engineers who wanted to further their technical studies as parttime postgraduate students on studies based at their own factories. The concept was that theproject should be related to their normal work, and should be of interest to the company, tominimise conflicting priorities between work and study time. Four projects of this kind werestarted : Gladys Naylor (née Crampton) at Mondi Merebank, Maryna Mansfield at SappiTugela, Eric Slabbert at Sappi Ngodwana and Annelie Lourens at Sasol Secunda.
The concept appeared to work well at first, with good support from the companies involved.However, it seems that the 2 to 3 year time scale for a part time MScEng is significantlylonger than the interest span of many companies. In most cases the priorities of thecompanies changed with time, and when the projects did not yield quick results, thestudents/engineers came under pressure to devote their attention to different areas which wereconsidered to be more urgent or important than improving water efficiency. At the time ofcompiling this report, only Gladys Naylor had completed, and, as was noted in chapter 4, shedid so in spite of the fact that company had by then completely lost interest in waterefficiency, because of the way its supply contract with the Durban Water Recycling Schemehad been structured.
Clearly this is not a satisfactory state of affairs, and the concept needs to be rethought for thefuture. However it was successful in making the companies aware of water pinch analysisand exposing them to some of its practicalities. The work done by Maryna Mansfield atSappi Tugela did lead to a paper presented at the WISA 2002 conference in Durban, andindeed all that remains to be done is the preparation of the thesis, which is progressinggradually. The work of Annelie Lourens at Natref also led to a paper at the same conference,however her emigration from South Africa probably ended any prospect of completing theproject.
A significant later outcome was that, after completing his PhD, Paolo Gianadda wasemployed by Sappi in an R&D position dealing with optimisation of their operations, whichincludes the application of pinch analysis.
116
7.2 Workshops and courses
A pre-conference workshop for WISA delegates was also held at the University of Natal onthe 19th of May, entitled Water Pinch Analysis: A tool for the rational management of waterand effluent in an industrial complex. It was attended by 14 persons. A similar workshopwas held at the University of Cape Town as part of WISA 2004. This was presented by ChrisBrouckaert and Duncan Fraser, and attended by 10 persons.
At WISA 2002 there was a WRC sponsored workshop on Tools for Cleaner Production, inwhich a presentation was made on Water Pinch Analysis as a Transparent Tool for theCo-regulation of Industrial Processes (BROUCKAERT, C.J., SCHNEIDER, J.,MANSFIELD, M. and BUCKLEY, C.A). This forum gave the project and the technique veryimportant exposure.
7.3 Conference presentations
The following paper was presented at The International Water Association Conference onWater and Wastewater Management for Developing Countries, Putra World Trade Centre,Kuala Lumpur, Malaysia, 29-31 October 2001, and subsequently accepted for publication inWater Science and Technology.
GIANADDA, P., BROUCKAERT, C.J., SAYER, R and BUCKLEY, C.A., The Applicationof Pinch Analysis to Water, Regent and Effluent Management in a Chlor-Alkali Facility
.t the Water Institute of Southern Africa Biennial WISA Conference and Exhibition, Durban,19-23 May 2002, the following posters and presentations were made:
LOURENS, A., The Application of Water Pinch at a Petrochemical Industry (Paper)
GIANADDA, P., BROUCKAERT, C.J., SAYER, R. and BUCKLEY, C.A., Process WaterPinch Analysis Guides Water, Reagent and Effluent Management in the Chlor-alkali Industry(Paper).
BROUCKAERT, C.J., SCHNEIDER, J., MANSFIELD, M. and BUCKLEY, C.A., WaterPinch Analysis as a Transparent Tool for the Co-regulation of Industrial Processes (Poster).
The last topic was also used as a presentation as part of a WRC sponsored workshop onTools for Cleaner Production. This forum gave the project and the technique very importantexposure.
At the International Seminar on Advanced Achievements in Pinch Technology and IndustrialResource Management for Energy Savings, Pollution Reduction and SustainableDevelopment in Africa, University of Durban-Westville, Durban, 18 - 20 November 2002 thefollowing presentations were made:
BUCKLEY, C.A., BROUCKAERT, C.J., MANSFIELD, M. And GIANADDA, P. ,Applying Water Pinch Analysis in the South African Context
GIANADDA, P., BROUCKAERT, C.J. And BUCKLEY, CA., Conceptual Developments inthe Field of Water Pinch Analysis - Selected Case Studies from the Chlor-Alkali
MANSFIELD, M., BROUCKAERT, C.J. And BUCKLEY, C.A., Water Pinch Analysis atthe Sappi Tugela Paper Mill.
BROUCKAERT, C.J., BUCKLEY, C.A., HANEKOM, D.* and WOODHOUSE, C.*,Optimal Location of a Membrane Treatment Plant in a Power Station
At the South African Chemical Engineering Congress, Chemical Engineers Competing in theGlobal Economy, Sun City, South Africa, 3-5 September 2003
117

GIANADDA, P., BROUCKAERT, C.J. AND BUCKLEY, C.A., The Application ofCombined Water and Materials Pinch Analysis to a Chlor-alkali Plant, (Paper)
GIANADDA, P., BROUCKAERT, C.J. And BUCKLEY, C.A., The Optimisation of anIon-exchange Demineralisation Plant Using Combined Water and Materials and PinchAnalysis (Poster)
At the Waste Management Emissions & Recycling in the Metallurgical and ChemicalProcess Industries Conference, Mintek Conference Centre, Randburg, Gauteng, SouthAfrica, 18-19 March 2004 :
BROUCKAERT, C.J., GIANADDA, P. and BUCKLEY, C.A., Process Integration for Waterand Energy Management (Paper)
7.4 Publication
GIANADDA, P., BROUCKAERT, C.J., SAYER, R. and BUCKLEY, C.A., The Applicationof Pinch Analysis to Water, Regent and Effluent Management in a Chlor-Alkali Facility,Water Science & Technology, 46 (9), pp. 21-28, October 2002, ISBN 1843394286.
118
8 CONCLUSIONS AND RECOMMENDATIONS
In addition to the individual conclusions pertaining to each case study, which appear in therelevant chapters, the range and scope of the case studies undertaken during the projectallows some broad conclusions to be drawn about water pinch analysis as a technique.
8.1 An assessment of the status of water pinch analysis theory and practice
Pinch analysis, whether applied to energy or water, is a special case of the more generaltechnique of process optimisation. In most cases the problem of fully optimising all aspectsof a process is so large that it is impractical to tackle as a whole. The strategy commonlyadopted is to break up the full optimisation problem into a set of more manageablesub-problems which can be solved independently; pinch analysis seeks to address one ofthese sub-problems. It considers the optimisation of the utility systems in the process - eitherthe thermal utility system or the water utility system.
As part of such a strategy, boundaries have to be set for each of the sub-problems. Forinstance, the usual assumption adopted in a pinch analysis is that, for the purpose ofoptimising the utility system, the process units are considered to be invariant. In terms of theoverall optimisation problem, such boundary conditions are artificial, and involveapproximations and assumptions concerning the behaviour of the parts of the system outsidethe sub-problem boundary which are excluded from the optimisation of the sub-problem (thedivision of the chlor-alkali complex into subsystem discussed in section 6.3.5 is also anexample of this kind of strategy). The success of the strategy depends critically on how wellthese assumptions and approximations apply to the system under consideration.
The experience of the case studies undertaken in this project has been repeatedly that thestandard assumptions of pinch analysis are somewhat restrictive. The continuous pressure toconserve water in South Africa means that many industries have already introduced measuresto use water more efficiently, so the easy savings reported in the literature are often notavailable, and it becomes necessary to venture into more difficult areas to make furtherprogress.
8.1.1 What pinch analysis promises
Pinch analysis was originally developed for the design of energy utility systems (Linnhoffand Hindmarsh, 1983). One of the more important features of pinch analysis is its ability totarget minimum utility requirements for any process. Such targets may be set without theneed for detailed design. (Hall and Linnhoff, 1994). The design of the utility can therefore beundertaken in two stages: determining the targets, for which only physical data are required,followed by detailed design, where all the other factors, such as economics, safety andoperability must be taken into account.
Apart from its direct role in facilitating the optimal design of the utility system, thischaracteristic of pinch analysis provides a means for setting the boundary to separate theoptimisation of the process units from the optimisation of the utility system. Since the utilitytarget values are a function of the process units, and are easily and rapidly evaluated, theycan be used to provide an approximate representation of the optimal utility design which isgood enough to use in the comparative assessment of process design options.
So far the discussion has implicitly referred to the design of a new process. Pinch analysismethods have also been developed for redesigning a utility system to improve efficiency: theso-called retrofit situation. (Smith, 2000). Here the process design units are in place, and
119

would not be expected to change. What pinch analysis offers in this case are the targetswhich show how much improvement in efficiency can possibly be achieved by the redesign,and the design rules which allow one to pinpoint where structural inefficiencies exist in thecurrent design, and so where to focus effort and investment to the best advantage.
8.1.2 Theoretical limitations encountered
The resounding success of numerous applications of energy pinch analysis suggests that itsunderlying assumptions work well in practice; the more limited success of water pinchanalysis suggests that its assumptions are not as useful in many cases. Part of the reason forthis is that water pinch analysis is based on an analogy between water and energy which isnot exact. The behaviour of energy in a stream is represented in the analysis by two variables,the energy flow (kW) and the energy quality, that is its temperature. The boundaries to theoptimisation problem are defined by the energy flows required by the process, together withthe temperatures at which these flows are required; for the purpose of the energy utilitysubsystem optimisation, these requirements are considered to be fixed. For water pinchanalysis, a similar structure is used to define the optimisation problem, with the key variablesbeing contaminant loads (kg/s) in the water streams, and water quality represented becontaminant concentrations. The first problem with the analogy is that, while the quality ofenergy is uniquely represented by temperature, the quality of water is an altogether morecomplex and less well-defined concept. The second problem is that the boundary assumptionsin terms of fixed contaminant loads and concentrations are less often appropriate in practice.
In energy pinch analysis, the formalism allows one to identify a thermodynamic limit(Smith, 2000) to energy recovery, which is independent of any economic considerationsrelated to the energy utility system. Optimising the system can thus be handled in two steps:the first identifies the thermodynamic limit, and then the second examines how close one canget to this limit economically. It is this clear separation of the physical and economic effectsthat has contributed greatly to the conceptual appeal and practical acceptance of thetechnique.
When it comes to water pinch analysis, the lack of rigour in the thermodynamic analogymeans that the equivalent of thermodynamic limit does not really exist independently ofeconomic factors. The crucial issue is that of quality regeneration. In the case of energy,quality is regenerated by means of a heat pump, which is driven by an input of energy, and socan be analysed on the same thermodynamic basis as the rest of the system. In the case ofwater, quality is regenerated essentially by the input of energy (including chemical energy),which cannot be represented in terms of contaminant load and concentration. Reductions inthe use of fresh water have to be balanced against the use of energy and/or chemicals intreating used water, and economic considerations are the usual means for determining therelative weighting of such disparate physical inputs. Thus, the separation of physical andeconomic effects in the analysis is not possible, unless quality regeneration is excluded as adesign option.
The brings into question the nature of the “pinch” itself. In the energy pinch analysis thepinch is a limiting temperature, and in the simplest form of water pinch analysis it is alimiting concentration, but this depends on interpreting the limit in terms of thethermodynamic analogy. In response to the problem of water quality being a function ofmultiple contaminant concentrations rather than a single variable, the Linnhoff-MarchWaterPinch software, that features in chapters 2, 4 and 5 of this report, uses the sensitivitiesor marginal costs of the concentration limits to take the place of the pinch, however inchapter 5 it was demonstrated that these do not suffice, and that flow rate constraints alsoneed to be considered. The leads to a concept of the pinch as the set of all constraints whichare active at the optimum. (Active constraints are those for which the relevant variables are at
120

their limiting values). Unfortunately this does not have the elegance and intuitive appeal ofthe original pinch concept. Furthermore, the utility target values that it provides do not havethe certainty associated with the original pinch concept, because they depend on what factorswere included the pinch analysis model.
When considering the question of the boundary assumptions for the subsystems to beanalysed, the considerations are fundamentally similar for both energy and water pinchanalysis. The utility stream / process stream distinction, as discussed in chapter 6, has anequally relevant counterpart in thermal pinch analysis. However, it does seem that in practiceprecluding process changes in the optimisation is more limiting in the case of water, perhapsbecause water is used for such diverse purposes.
The effect of these three issues (having to include economic effects early in the analysis; theconsequent absence of a purely physical pinch limit; and the pressure to include processstreams in the optimisation) is that water pinch analysis tends towards full processoptimisation, which dilutes its status as a separate discipline. From a practical viewpoint, thismeans that the one cannot accept the general procedures and conclusions of the standardpinch analysis theory, and that each application needs to be evaluated on its particular merits.
It must be acknowledged that the above conclusions mostly reflect the experience of applyingthe analysis in the retrofit mode: i.e.. to improving water utilisation in existing, wellestablished processes. In the case of a new design where process conditions have not yetbeen fixed, it may well be that the assumptions and approximations involved in the standardversion of pinch analysis would be quite justified in view of the uncertainties about what theprocess conditions will be.
8.1.3 Practical strategies for applying water pinch analysis
How can water pinch analysis be applied so as to circumvent its theoretical limitations andrealise its promise as far as possible? The case studies presented in this report suggest thatthere is no single answer to the question, and that an approach must be formulated accordingto the nature of the process involved.
The case study of Ceres Fruit Juices (chapter 3) demonstrated the most straightforwardapplication of water pinch analysis, as the process conformed most closely to the classicalassumptions of pinch analysis. The water involved is used for utility purposes of equipmentwashing and sterilisation and cooling (although some water is blended into the products, thiscould easily be excluded from the analysis). No wastewater treatment for qualityregeneration was practised or contemplated. Total solids was considered as the singlecontaminant representing water quality.
From this example the first strategy for applying water pinch analysis can be formulated as:
i) include only utility water streams in the analysis;ii) use a single, non-reactive contaminant to represent water quality.iii) exclude water treatment for the purpose of making it fit for reuse (treating the water to
meet discharge standards may be considered);This strategy avoids all the theoretical difficulties noted above, and allows one to use theclassical pinch analysis methodology. This comes at the potential expense of the accuracy inlocating the true optimum for the system design. Each option may be evaluated for itspossible effect:
i) Since this is a food process, risk factors would tend to preclude water reuse in anystreams which come into direct contact with the product, so excluding process streamsfrom the analysis is advisable in any case.
121

ii) The use of a single contaminant could make the predicted water savings over optimis-tic, in that specific contaminants might prevent the reuse of water for specific purposes.This issue was noted in the case study, with the caution that the results should be seenas a first assessment, with such issues requiring further investigation. The justificationfor using a single contaminant is not really theoretical, as the methods for using multi-ple contaminants are readily available, it is more about the effort and expense ofgathering the necessary data.
The case studies of the AECI Bioproducts Lysine Plant and the Mondi Merebank PaperMill (chapters 4 and 5) illustrate a second possible strategy. These also considered onlyutility water, excluding process from the analysis, however they deviated from the simplestrategy in several respects, thereby requiring the use of mathematical programmingsoftware. These deviations were:
i) Excluding certain connections between specific sources and specific sinks. This is notthe same as excluding a source or a sink: the source and sink involved remain in theanalysis, and a constraint is added to the optimisation problem which is of a differentkind to the concentration constraints in the standard pinch analysis.
ii) The objective function was not simply the amount of fresh water supplied, but includedcosts of water supply and effluent discharge. Although neither of these case studieshappened to involve regeneration for reuse, these factors had the same effect of movingaway from considering the thermodynamic minimum for water use.
iii) In the case of the lysine plant, multiple contaminants were considered.These examples can be taken as representing the second strategy for approaching a waterpinch analysis, in which mathematical programming is used to address all the restrictionsexcept the exclusion of process streams and chemically reactive species. These exclusionsallow the system to be modelled in terms of simple standardised elements, which makes itpossible to use a generalised software package, such as WaterTarget used in these twostudies.
The final case study of the Sasol Polymers Chlor-alkali Plant (chapter 6) accepted none ofthe restrictions noted above. While this resulted in the most rigorous approach to theproblem, it was also the most complex and time consuming. In particular for process watercontaining reacting species, individual models of each process unit had to be developedwhich adequately represented process constraints and economics, which means that thedevelopment of a generalised software solution is much more difficult. It could be arguedthat this approach is no longer really pinch analysis, but borders on full process optimisation.
Although the three approaches were applied to different case studies in this project, the aboveargument suggests that they could be used sequentially as a progressive overall approach in asingle project, in which one only moves to the next level of complexity if the results of thesimpler analysis indicate that it is justified.
8.1.4 Other considerations
There are some observations concerning the application of water pinch analysis that are notrelated to its theoretical structure:
1) The direct economic drivers for water conservation are not as great as those for energyconservation, so industries are not as easily motivated to undertake water pinch analysisas energy pinch analysis.
2) In water-scarce situations, not uncommon in South Africa, there are indirect driversrelated to the value chain of water, i.e.. the economic value derived from activities whichcould not take place without a sufficient supply of water of adequate quality.
122

3) In such situations regulators have the responsibility of balancing the water requirementsof different users in an equitable way. The systematic and transparent methodology ofwater pinch analysis could be useful for establishing the water requirements of industrialsystems for regulatory purposes. It must be emphasised that, in its present form, it isunlikely to be useful for non-industrial systems.
8.2 Recommendations
Recommendations that can be made fall into two categories: those that concern theapplication of water pinch analysis according to the current state of the art, and those thatconcern in what directions further development of water pinch is needed .8.2.1 The application of water pinch analysis
1) A water pinch analysis of a system needs to be approached with a very clearunderstanding of the conceptual basis of the technique, its underlying assumptions, itsrange of applicability and its limitations.
2) Water pinch analysis is essential a design tool; it is useful for deciding how a water usingsystem should be configured, or perhaps reconfigured. It does not have a useful role inmanaging the operation of a water using system.
3) As the case studies of this report demonstrate, pinch analysis encompasses a range ofvariants of the technique, each with a different set of modelling assumptions, and adifferent set of strengths and weaknesses. Care should be taken to select the mostappropriate variant for a particular system, and a particular purpose. All the variantshave been developed for application to industrial systems, and are intended to optimisethe use of water in an industrial context. Any attempt to use it in a different context (forinstance, in an environmental context) should be approached with great care to evaluatethe appropriateness of its underlying assumptions.
4) A pinch analysis of a system is usually an iterative process with much uncertainty in theearly iterations. It seems logical to start with the simplest form of the analysis, in spiteof the sweeping assumptions involved; and bring in more sophisticated considerations asthey are shown to be required.
8.2.2 The further development of water pinch analysis
1) Further efforts are required to encourage wider acceptance of water pinch analysis bySouth African industry. This should be undertaken in conjunction with industry on a casestudy basis.
2) Further work is needed to extend the water pinch analysis methodology to account forchemically reacting solutes and aqueous reagents.
3) Techniques for the early identification of the applicability of water pinch need to befurther developed.
4) Techniques need to be developed to reduce the time and effort required to gather the dataneeded for a water pinch analysis.
5) The use of water pinch analysis as a tool for co-regulation should be explored. This willrequire studies in which regulatory authorities are involved as partners, and thedevelopment of a a protocol for reporting the modelling assumptions and process limitsused in an analysis in a transparent and auditable way, so that it can be used withconfidence in negotiations between industrial and regulatory parties.
6) Local consultants should be encouraged to set up a water pinch analysis service toindustry.
123

7) The energy efficiency of a process has a significant impact on its water use for coolingand the concomitant generation of saline effluents. The simultaneous optimisation ofwater and energy use is therefore an important direction for further investigation.
124

9 REFERENCES
Allison, J.D., Brown, D.S. and Novo-Gradac, K.J. (1991) MINTEQA2/PRODEFA2, Ageochemical assessment model for environmental systems: Version 3.0 User's Manual.(http://www.epa.gov/ceampubl/mmedia/minteq/usermanu.pdf.)
Alva-Argaez, A., Kokossis, A. C., Smith, R. (1998) Process Integration for WastewaterTreatment Systems. 1998 AIChE Annual Meeting. Miami Beach, Florida.
Alva-Argaez, A., Kokossis, A. C., Smith, R.(1998b) Wastewater minimisation of industrialsystems using an integrated approach. Computers & Chemical Engineering 22 Suppl.S741-S744.
Alva-Argaez, A., (1999) Integrated Design of Water Systems, Thesis: Manchester Instituteof Science and Technology: Manchester.
Amidpour, M. and Polley, G.T. (1997) Application of problem decomposition in processintegration. Trans IChemE 75 (A1) 53-63.
Bagajewicz, M. and Savelski, M. (2001) On the use of linear models for the design of waterutilization systems in process plants with a single contaminant. Trans IChemE, 79 Part A600-610.
Benkõ N, Rev E and Fonyo Z (2000) The use of nonlinear programming to optimal waterallocation. Chem Engng Comm 178 67-101.
Buehner, F. W., Rossiter A. P. (1996). Minimize waste by process design. Chem. Tech,(April): 64 - 72.
Brooke. A., Kendrick D., Meeraus. A. and Raman R. (1998) GAMS A user’s guide., GAMSDevelopment Corporation, (http://www.gams.com/docs/gams/GAMSUsersGuide.pdf.)
Brouckaert, C.J. And Buckley, C.A. (2003), The application of pinch analysis for the rationalmanagement of water and effluent in an industrial complex., WRC Report No. 851/1/03,Water Research Commission, Pretoria.
Dericks, B.J., Savelski, M.J., Koppol, A.P.R. and Bagajewicz, M.J. (2001) Feasibility ofzero-liquid discharge solutions in the process industry. Proceedings of the 4th Conference onProcess Integration, Modeling, and Optimisation for Energy Saving and PollutionPrevention (PRES'01), Florence, Italy 7-12.
Doyle, S.J. and Smith, R. (1997). Targeting Water Reuse with Multiple Contaminants. TransIChemE, 75, Part B, 181-189.
El-Halwagi, M.M. (1995), Introduction to Numerical Optimization Approaches to PollutionPrevention, in Waste Minimisation Through Process Design, A.P. Rossiter, Editor.,McGraw-Hill: New York. 199-207.
El-Halwagi, M. M. (1997). Pollution Prevention through Process Integration. SystematicDesign Tools, Academic Press, San Diego.
GAMS Development Corporation (2001) GAMS - The Solver Manuals. GAMSDevelopment Corporation. (http://www.gams.com/docs/solver_man.pdf).
Gardner, G.A., (2000) Liquid Waste Minimisation on a Chloro-alkali Complex, MScEngThesis, University of Natal.
125

Hall, S.G. and Linnhoff, B., (1994), Targeting for Furnace Systems Using Pinch Analysis,Ind. Eng. Chem. Res. 33 3187-3195
Hsiao, T. and Glatz, C.E., (1996) Water Reuse in the L-Lysine Fermentation Process.Biotechnology and Bioengineering, 49(3) 341-347.
Linnhoff, B., Hindmarsh, E. (1983). The pinch design method of heat exchanger networks.Chem Eng Sci, 38(5) 745-763.
Mann, J.G. and Liu, Y.A. (1999) Industrial water reuse and wastewater minimisation.McGraw Hill.
Smith, R. (1995), Wastewater Minimisation, in Waste Minimisation Through ProcessDesign, A.P. Rossiter, Editor. , McGraw-Hill: New York. 93-107.
Smith, R. (2000), State of the art in process integration, Applied Thermal Engineering 201337-1345
Takama, N., Kuriyama, T., Shiroko, K., Umeda, T. (1980). Optimal water allocation in apetroleum refinery. Comput. Chem. Eng., 4: 251-258.
Wang, Y. P., Smith, R., (1994). Wastewater Minimisation. Chem Eng Sci., 49(7): 981-1006.
126