the application of liquid chromatography and mass
TRANSCRIPT

THE APPLICATION OF LIQUID CHROMATOGRAPHY AND MASS SPECTROMETRY
FOR THE DETERMINATION OF NUCLEOSIDE ANALOGUES IN BIOLOGICAL
MATRICES
by
YAZEN M ALNOUTI
(Under the Direction of MICHAEL G BARTLETT)
ABSTRACT
Multidrug therapy has become the standard treatment of acquired immunodeficiency
syndrome (AIDS) caused by the human immunodeficiency virus (HIV). Nucleoside reverse
transcriptase inhibitors (NRTIs) are used in all AIDS combination therapies. In combination
therapies, there is a high potential for pharmacokinetic interaction between the individual drugs.
This interaction can alter the transport profile of anti HIV agents to the fetus in pregnant women.
In order to study pharmacokinetic interactions, sensitive and valid analytical methods are
required for the quantification of NRTIs in different biological matrices.
This dissertation focuses on developing valid analytical methods to quantify NRTIs in
different pregnant rat matrices. Lamivudine (3TC) and zidovudine (AZT) were studied as model
NRTIs. These matrices include plasma, amniotic fluid, placenta and fetus. Method
development includes 3 steps, sample preparation, chromatographic separation and spectroscopic
detection. Due to the complicity of tissue matrices, ultra clean sample extraction is required.

Different sample preparation techniques like protein precipitation by acids, organic solvents and
salting out, solid phase extraction (SPE) and liquid-liquid extraction (LLE) were used. High
performance liquid chromatography (HPLC) and capillary electrophoresis (CE) are the
separation techniques that were used. For spectrometric detection, ultraviolet (UV) and mass
spectrometry (MS) detectors were used. After developing the optimum sample extraction,
chromatographic separation and spectrometric detection conditions, the methods were validated
according to FDA criteria.
The validated methods were successfully applied in animal studies using the pregnant rat
model. The animal studies have shown that fetal exposure to 3TC was significantly increased
when co-administered with AZT. The mechanism of this drug-drug interaction has not been
found, but it may be due to AZT competitive inhibition of the 3TC efflux transporters in the
fetal-facing side of the placenta. These results suggest that the underlying mechanism behind the
3TC placental transport in rats is carrier mediated.
INDEX WORDS: HPLC, CE, MS, SPE, LLE, Sample Preparation, liquid chromatography,
Biological matrices, Nucleoside reverse transcriptase inhibitors, Lamivudine, 3TC, Zidovudine, AZT, placental transport
THE APPLICATION OF LIQUID CHROMATOGRAPHY AND MASS SPECTROMETRY
FOR THE DETERMINATION OF NUCLEOSIDE ANALOGUES IN BIOLOGICAL
MATRICES
by
YAZEN M ALNOUTI
B.S., Jordan University of Science and Technology, Jordan 2000
A Dissertation Submitted to the Graduate Faculty of The University of Georgia in Partial
Fulfillment of the Requirements for the Degree
DOCTOR OF PHILOSOPHY
ATHENS, GEORGIA
2004

© 2004
Yazen M Alnouti
All Rights Reserved

THE APPLICATION OF LIQUID CHROMATOGRAPHY AND MASS SPECTROMETRY
FOR THE DETERMINATION OF NUCLEOSIDE ANALOGUES IN BIOLOGICAL
MATRICES
by
YAZEN M ALNOUTI
Major Professor: Michael G Bartlett
Committee: Catherine A White Warren J. Beach Randall L Tackett A.C (Tony) Capomacchia
Electronic Version Approved: Maureen Grasso Dean of the Graduate School The University of Georgia August 2004

iv
DEDICATION
This dissertation is dedicated to my father, Mohammad Alnouti. He installed in me the
love of science since my childhood. I always tried to follow his footsteps in the way he tackles
cumbersome problems when they seem insolvable. I owe him, whom I am now.

v
ACKNOWLEDGEMENTS
First, I need to thank my mother for her continuous support in every step of my life. I
also must thank my major professor, Dr. Michael Bartlett for being a wonderful mentor and a
close friend. I also must thank Dr. Catherine White and Dr. Warren Beach for their major
contribution in my research progress. I thank all my lab mates, Stacy Brown, David Delinsky,
Nicole Clark, Amy Dixon, Yan Ding and Shonetta Gregg. I finally must thank my closest friend,
Betty Ngo. She listened to me during my happy and sad moments. With her forthcoming
support, she helped me overcome many obstacles I faced during my graduate study.
.

vi
TABLE OF CONTENTS
Page
ACKNOWLEDGEMENTS............................................................................................................ v
INTRODUCTION........................................................................................................................... 1
CHAPTER
1 SIMULTANEOUS QUANTIFICATION OF ZIDOVUDINE AND ZIDOVUDINE
MONOPHOSPHATE FROM PLASMA, AMNIOTIC FLUID AND TISSUES BY
MICELLAR CAPILLARY ELECTROPHORESIS............................................... 30
2 DETERMINATION OF LAMIVUDINE IN PLASMA, AMNIOTIC FLUID AND
RAT TISSUES BY HPLC...................................................................................... 58
3 SIMULTANEOUS DETERMINATION OF ZIDOVUDINE AND LAMIVUDINE
FROM RAT PLASMA, AMNIOTIC FLUID AND TISSUES BY HPLC............ 76
4 SIMULTANEOUS DETERMINATION OF ZIDOVUDINE AND LAMIVUDINE
FROM RAT PLASMA AND TISSUES BY LC-MS-MS..................................... 96
5 CONCLUSION......................................................................................................... 119
APPENDICES............................................................................................................................. 121

vii
A COMPARISON OF LOCAL ANESTHETIC-CYCLODEXTRIN NON-COVALENT
COMPLEXES USING CAPILLARY ELECTROPHORESIS AND
ELECTROSPRAY IONIZATION MASS SPECTROMETRY........................... 121

1
INTRODUCTION
High-Performance Liquid Chromatography (HPLC)
A basic definition was developed by a special committee of the International Union of
Pure and Applied Chemistry (IUPAC) to characterize chromatography as: A method, used
primarily for the separation of the components of a sample, in which the components are
distributed between two phases, one of which is stationary while the other moves. The stationary
phase may be a solid or a liquid supported on a solid. The stationary phase may be packed in a
column or spread as a layer. The mobile phase may be gaseous or liquid [1].
Despite the efforts of IUPAC, an accepted definition of chromatography has remained
elusive. All the definitions show the denominator of describing chromatography as an analytical
technique, which allows the separation of different compounds according to a differential
interaction between two phases [2].
The analytical technique known as high-performance liquid chromatography (HPLC)
represents the climax of the development started when the Italo-Russian botanist Mikhail S.
Tswett coined the name chromatography and recognized the potential of his method for
separating plant pigments almost 100 years ago [3, 4]. The theory of chromatography underwent
continuous development until 1956 when van Deemter, Zuiderweg and Klinkenberg put forth
their rate theory, expressing column efficiency as a function of the flow velocity and the most
significant characteristics of the chromatographic system such as the particle diameter and solute
diffusivity [5]. This theory was developed for gas chromatography (GC) and soon applied to
liquid chromatography (LC). Therefore, the conclusion was reached, by Giddings in 1963, that
if efficiencies comparable to GC were to be achieved in LC, this could be done only by using

2
stationary phase particles of 2-20 µm in size, which would mean very high inlet pressure [6].
This was the starting point of modernizing LC into HPLC.
An HPLC system contains the major components listed in the table:
Solvent delivery system Pump, gradient elution programmer and a degassing system
Sample introduction system Syringe injector, switching valve and a loop
Analytical column Columns packed with particles in the range of 2-20 µm, different packing chemistry
Temperature control Heat the column compartment Detector UV, RI, LIF or MS Data handling device Recorder, integrator and a computer
The ultimate goal of using HPLC is to achieve a satisfactory resolution between the
analytes of interest under the required sensitivity level. This is theoretically achieved by
determining the separation conditions that maximize the differences in the analytes affinity to the
stationary phase. In order to achieve this goal, both instrumentation and chemistry conditions
need to be optimized. The chemistry parameters to be optimized for better HPLC separation are
mobile phase content, pH, sample preparation, sample solvent composition, temperature, column
choice and sample volume. By tuning these parameters, the resolution and sensitivity can be
drastically improved through altering retention and peak shape profiles.
A successful HPLC chemist needs to be equipped with a very thorough understanding of
the instrumentation hardware in addition to the molecular theory of separations. Every part of
the system hardware has a great impact on the chromatographic separation. Pulse less pumps
with constant delivery rate, accurate injectors, switching valves with minimum dead volume and

3
carry over and tubing system with minimum extra column volume and tight fittings are
essential for optimum separation, reproducibility and sensitivity.
Capillary Electrophoresis (CE)
In CE, charged analytes are separated based on differences in their charge-to-volume ratio. High
voltage is applied across a fused silica capillary filled with electrolyte background. Anionic
analytes migrate toward the anode while cationic analytes migrate toward the cathode. This type
of migration is called electrophoretic mobility. The net observed migration direction might be
different than the electro migration direction at the molecular level because of the influence of
electroosmotic flow. Electroosmotic flow is generated by the constant movement of the
electrolyte background. At pHs higher than 3, the interior surface of the silica capillary becomes
negatively charged due to the ionization of the silinol groups. The electrolyte background
cations become attracted to the negatively charged capillary interior surface. Eventually, a
concentration gradient of these cations is built up across the capillary width. The loose cations
start migrating toward the cathode moving along solvent and analyte molecules. Therefore, a net
flow toward the cathode is generated. The net migration direction of the cationic and the anionic
analytes is therefore determined by the net effect of the electrophoretic mobility and the
electoosmotic flow.
This mode of CE is the simplest mode and is called capillary zone electrophoresis (CZE)
or free zone electrophoresis. The main limitation of CZE is its inability to separate neutral
molecules. Capillary electrochromatography (CEC) and capillary electrokinetic chromatography
(CEKC) are other CE modes, which extend the CE applications to neutral analytes as well. In
CEC, the capillary is filled with stationary phases similar to the ones used in LC columns.
Electroosmotic flow is equivalent to the mobile phase flow in HPLC. In CEKC a surfactant is

4
added to the electrolyte background. The surfactant moves with the electroosmotic flow and
serves like a pseudo-stationary phase [7-9].
Compared with the traditional chromatography techniques, CE provides an alternative
separation characterized by high efficiency, rapid sample analysis time and a low consumption of
reagents as well as solvents. Unfortunately, CE suffers from relatively low sensitivity because of
the very small sample volumes injected under standard conditions and because of the narrow
beam path across the capillary width. The narrow beam path can be improved by using bubble
cells and z-shaped cells. Although sensitivity is increased by a factor of 3-6 using these special
detection windows, loss of electrophoretic resolution limits their application. The small injection
volume can be extended by injecting large volumes followed by analyte focusing (stacking)
during CZE analysis. Sample stacking may take place when the sample plug is sandwiched
between leading and terminating electrolytes (isotachophoresis sample stacking) or when the
sample is prepared in a solvent of lower conductivity than the running buffer (field-amplified
sample stacking). More sensitive detectors than UV such as laser induced fluorescence (LIF) or
mass spectrometry (MS) can also be utilized to increase CE sensitivity [10-12].
The rapid adoption of MS detectors to replace the traditional UV detectors has had
arguably the most dramatic impact on sample preparation demands. Non-specific UV detectors
require baseline separation of analyte from interferences; which necessitates long analysis times
in order to maximize chromatographic efficiency. Selective MS detectors reduce the separation
demands. This allows the analyst to increase the analysis speed at the expense of
chromatographic resolution.

5
Mass Spectrometry (MS)
Mass spectrometry is a very selective analytical technique that is used as both a separation and
detection technique. Analytes are separated according to their mass-to-charge ratios (m/z). All
mass spectrometers are composed of four basic components, an ion source, a mass analyzer, a
detector and a vacuum system to operate the instrument under low pressure. The detector and
vacuum system components are similar among all mass spectrometers. Therefore, mass
spectrometers are classified according to the type of the ion source and mass analyzer they have.
Mass Analyzers
Magnetic Sector
The Magnetic sector is the oldest type of analyzers. They were used when the first mass
spectrometer was invented by Dempster in 1918 [13]. After ionization in the ion source, ions are
accelerated through an electric field created by the accelerated potential. Ions obtain their kinetic
energy during acceleration, which is calculated from the equation:
KE = zeV = ½ mv2
Where, “KE” is kinetic energy, “z” is charge, “e” is the electron charge, V is the acceleration
voltage and “m” and “v” are the ion mass and velocity, respectively. When the accelerated ion
enters a magnetic field, normal to the field lines, a perpendicular magnetic force is exerted on the
ion. The magnetic force is balanced by a centrifugal force causing the ion to move in a circular
path according to the equation:
zevB = mv2/r
Where B is the magnetic field strength and r is the radius of the circular path. By substitution:
r2 = 2mV/zeB2

6
The equation indicates that at a fixed acceleration voltage and magnetic field, ions of different
mass to charge ratio can be separated into different radii of circular motion. By positioning a
detector, preceded by a slit, at a fixed position, ions with different m/z ratios can be sequentially
detected by sweeping the acceleration voltage or the magnetic field strength [14].
A low resolution of no more than 1000 is typical for such a simple single focusing
magnetic sector. The reasons for the low-resolution power of the magnetic sector are, fringe
field effects, irregular field boundaries and the heterogeneity of the ions kinetic energy.
Very high resolution can be achieved by a double focusing magnetic sector instrument.
In double focusing instruments, an electric sector is aligned in tandem with the magnetic sector.
The electric sector works as an energy filter, refining the kinetic energy spread to a minimum.
Furthermore, the two sectors are aligned so that the angular divergence of one sector is corrected
by the other, achieving both energy and direction focusing (double focusing) [14-16].
Time of Flight (TOF)
The TOF analyzer is the simplest type among all MS analyzers. After ionization, ions are
accelerated in a homogenous electrostatic field. Ions then travel, with different velocities,
through a field-free region until they reach a detector. The ion velocity is determined from the
equation:
v = (2zeV1/2/m)
Where z is the ion charge state, e is the electron charge, V is the acceleration voltage and m is the
ion mass. From the equation, lighter ions will reach the detector first and therefore have a
shorter time of flight [17].
TOF analyzers have intrinsically low resolving power. This is due to the initial spatial
and energy distribution of molecules in the ionization chamber. The resolution of TOF

7
instruments has tremendously improved with the aid of new techniques such as, the “double
acceleration field” source, the “ reflectron” deceleration field and the time lag focusing technique
[18,19].
TOF instrument have several unique features, which make them a very useful instrument.
In addition to simplicity and robustness, TOF involves array rather than scanning detection,
where the entire mass spectrum is obtained in every single cycle of the measurement without the
need of scanning any voltage or current. Furthermore, since TOF depends on time-based rather
than spatial separation, few ion optical elements and no slits are required resulting in higher ion
transmission efficiencies [15].
Fourier-transform Ion-cyclotron resonance (FT-ICR)
Fourier transform MS is based on the ion cyclotron resonance theory developed by Lawrence in
the 1930s [20]. After ionization, ions are accelerated, by a static electric field, normal to a
magnetic filed. The ion experiences a magnetic force perpendicular to both the magnetic field
and the original velocity, causing the ion to travel in a circular orbit perpendicular to the
magnetic field. This motion is called cyclotron motion and is characterized by its frequency:
fc = qB/2� m
Where q, m and B are the ion charge, the ion mass and the magnetic field strength respectively
[21]. The magnetic field is held constant and the mass-to-charge ratio is determined by
measuring the cyclotron frequency. To detect ions, they are excited by applying a sinusoidal
voltage. The ion with the cyclotron frequency that matches the applied voltage will absorb
energy and move to an orbit of increased radius while maintaining its characteristic cyclotron
frequency and producing a measurable electric signal. Ions of all masses can be detected
simultaneously by programming the applied sinusoidal voltage to sweep over a wide frequency

8
range allowing excitation of ions of all masses. The resulting signal will be a complex function
consisting of an overlay of all the component frequencies of different ions. The individual
frequency components can be back extracted by the deconvolution of the function by applying a
Fourier transform to the time domain [22-24].
FT-MS has the highest potential for mass accuracy among all mass analyzers because the
separation criterion (cyclotron frequency) is independent of ions velocities and therefore
insensitive to the initial distribution of kinetic energy, [23]. On the other hand, technical
problems associated with the low-pressure requirements (10-9 Torr), isolation and cooling of the
strong and expensive magnets (2-20 T) reduce the attractiveness of using FT-MS for routine
applications [25].
Quadrupole
A quadrupole is a magnet-free path stability analyzer. An ideal quadrupole consists of 4
hyperbolic rods arranged in a square array. Opposite rods are electrically connected. Direct
Current (DC) potentials, equal in magnitude but opposite in sign are applied to the two pairs of
rods. The two pairs of rods also receive a radio frequency voltage (RF), equal in frequency and
amplitude but out of phase by 180°. This arrangement creates a complex electric field, where the
electric potential field at any point is calculated by the equation:
� = [U + V cos(ωt)] x2 – y2/r
Where �
is the potential, U is the DC voltage; V is the RF amplitude, ωt is the angular
frequency, r is the radius of the spacing between the rods and x and y are the distances along the
z axis [26, 27]. The true solution of this formula describes only one m/z with a stable oscillation
movement, which allows the ion to pass through the quadrupole without colliding with the rods,
under certain U and V values. The instrument is operated under a fixed ratio of U:V, the

9
operation line, which determines the instrument resolution and sensitivity [28]. A steeper
operation line means higher resolution but lower sensitivity due to lower transmission efficiency.
The DC and the RF voltages are swept at a fixed ratio to scan the entire spectrum. By scanning
the magnitude of RF and dc potentials from a low to a high value, ions of increasing mass will
sequentially take on stable trajectories and be transmitted to the detector [29]. From the
equation, the electric potential is zero along the z-axis. This means that the ions are not
accelerated along the z-axis and move with the momentum they gain from the ion source. The
more time the ions spend inside the quadrupole, the higher the resolution. Therefore, the source
acceleration voltage is kept under 50 V [30].
The quadrupole is insensitive to the initial distribution of ion kinetic energy and is
tolerant to high pressures due to the short flight path [31]. Therefore, quadrupoles are very well
suited for use with ion sources that require high pressure, such as atmospheric pressure
ionization techniques. The quadrupole analyzer can be operated under RF only conditions with
no DC voltage applied. Under these conditions, quadrupoles work as an ion lens to pass all ions
through regions of differential pressures [15]. Low cost, compactness, high scan speeds, high-
pressure tolerance, high sensitivity and simple operation make quadrupole instruments the most
widely used [15].
Ion trap
An ion trap is a three-dimensional analogue of a quadrupole analyzer. It consists of a hyperbolic
central ring electrode and two end-cap electrodes. The end-cap electrodes have small gates that
allow entrance and exit of ions. A DC voltage is applied to the end-cap electrodes and a RF
voltage is applied to the central electrode. At certain values of dc and RF values, all ions above a

10
specific m/z value will demonstrate stable trajectories and be trapped inside. The trapped ions
are then sequentially ejected from the trap for detection by scanning the RF voltage [32, 33].
Ion Sources
Electron impact (EI)
Atoms in the gaseous state are bombarded with a beam of energetic electrons emitted from a hot
metallic filament. The accelerated electrons exchange energy with the neutral gaseous atoms
promoting them to a higher and unstable energy level. The energetic atoms then release the
excess energy by emitting electrons producing positive ions with an odd number of electrons
[34]. The energy of the bombarding electrons must be greater than the ionization energy of the
molecule, in order for ionization to occur. The ionization efficiency increases by increasing
bombarding electron energy and reaches a maximum between 50-100 eV. Most EI sources are
routinely operated at the 70 eV energy level.
EI yields fairly good energy homogeneity (± 3V) but its application is restricted to
volatile samples. EI is a hard ionization technique causing intensive in-source fragmentation,
which serves as a fingerprint for molecules and is used in the structure elucidation of unknown
compounds with the aid of softer ionization techniques to identify the molecular weight [15].
Chemical Ionization (CI)
A source similar to that used for EI is used for CI. The ionization chamber is filled with a
reagent gas at a partial pressure of 1 torr. Similar to EI, electrons are emitted from a heated
filament and accelerated to several hundred electron volts. The reagent gas is bombarded with
electrons and converted to a set of reactive proton-rich ions. Ionization of the analyte molecules
occurs, usually by protonation, if the proton affinity of the analyte molecules is higher than that
of the carrier gas ions. CI is a soft ionization technique that does not involve the transfer of

11
excessive energy to the analyte molecules and therefore causes less fragmentation. Methane,
isobutane and ammonia are examples of reagent gases often used in CI. Selective ionization can
be achieved in CI by using a reagent gas with a proton affinity slightly lower than the analyte of
interest. All other compounds with proton affinity lower than the reagent gas will not be ionized
[35, 15].
Fast atom bombardment (FAB)
Although CI overcomes the problem of extensive fragmentation encountered in EI, the volatility
limitation remains critical. FAB, on the other hand, was one of the desorbtion ionization
techniques to bring a variety of nonvolatile or thermally labile compounds into the realm of MS
analysis. The sample is mixed with a nonvolatile matrix and deposited as a thin film on a flat
surface. The sample plate is then bombarded with a beam of atoms, i.e. Xe, Ar, of 6-10 keV
energy. The impact of the bombardment sputters both atoms and ions from the solution. FAB is
not a hard ionization technique but it does impart enough energy to induce mild fragmentation
[36-38]. The matrix, used in FAB, must be inert and of a desirable acid-base nature. For
positive ion detection, the matrix should be more acidic than the analyte while for negative ion
detection it should be more basic than the analyte [39]. Glycerol, thioglycerol, m-nitrobenzyl
alcohol and triethanol amine are examples of compounds used as matrices in FAB.
FAB has a discrimination action against the surface tension properties of analytes.
Because the external surface of the sample-matrix film is more exposed to bombardment,
analytes that partition more to the surface are preferentially ionized. The surfactancy profile of
the analyte can be improved by derivatization with non-polar moieties or by the addition of
surface-active agents [40].

12
Matrix-assisted Laser Desorption/Ionization (MALDI)
Photoionization is based on the interaction between light quanta of sufficient energy, applied as
an intense laser beam, and neutral molecules. Early attempts of directly irradiating neat sample
molecules with UV or IR laser beams faced limitations such as the differential ionization
efficiencies of compounds according to their absorption coefficient at the laser wavelength. In
MALDI, the sample is mixed with a suitable matrix allowing a large amount of energy to be
efficiently absorbed by the matrix and retransferred to the sample molecules without inducing
their thermal degradation. The MALDI spectrum is mainly dominated by single-protonated ions
with minimum fragmentation. Therefore, MALDI is perfect for the determination of the
molecular weights of large and nonvolatile biological molecules.
The intensity and quality of the signal in MALDI spectra are highly dependent on the
choice of the matrix type and the mixing proportions of the matrix and the analyte. Matrix-to-
analyte molar ratio in the order of 103-104 is preferred. The more homogenous and fine-grained
morphology of the crystal, the more intense the signal, compared with noncrystalline glassy
appearance of the final mixture [41, 42]. Sinapinic acid, aminohydroxybenzoic acid and
hydroxycinnamic acid are examples of compounds often used as a matrix in MALDI.
Electrospray Ionization (ESI)
ESI was an important development in the MS field that allowed direct analysis of LC effluents.
In ESI, a continuous stream of a sample in a suitable solvent, i.e. LC mobile phase, flows
through a narrow capillary. The capillary tip is held at a potential difference from a counter
electrode. The effluent from the capillary tip travels through the ion source at atmospheric
pressure and high temperature. The potential difference, high temperature and a flow of a drying
gas, i.e. N2, results in an efficient spray, evaporation of the solvent and eventually the formation

13
of tiny droplets. The droplets size continues shrinking, due to solvent evaporation, to the point
where the columbic forces of the concentrating charges exceeds the surface tension of the
droplets. At this point fission of the droplets into even smaller ones and eventually emission of
the analyte molecule with residual charges attached [15, 43, 44].
ESI is a soft ionization technique yielding very mild fragmentation, if any. This feature
entitles ESI for the study of non-covalent complexes in the gas phase. Multiply charged ions are
the dominant species in an ESI mass spectrum. A series of peaks representing the same
compound with different charge status appear in the spectrum. This is a very useful feature of
ESI, where molecules of very high masses appear at low m/z values. Therefore, massive
molecules can be analyzed with inexpensive instruments that have limited m/z range such as
quadrupole MS. ESI has also been combined with high-resolution analyzers, i.e. FT-ICR, for the
exact mass determination of very large proteins. With high-resolution analyzers, the spacing
between the isotopic peaks for large molecules can be determined and therefore the charge state
can be calculated [45].
Ionization in ESI takes place under atmospheric pressure. Therefore, ESI is most
commonly hyphenated with analyzers of high-pressure tolerance, i.e. quadrupole [46].
Extraction of biological samples
The successful extraction of drugs from biological fluids and matrices presents several
challenges. Biological materials, including urine, blood and tissues are much more complex than
other matrices. They often contain proteins, salts, acids, bases and numerous organic compounds
with similar chemistry to the analytes of interest. Thus, general extraction methods for
biological matrices have either been complex, if selectivity is desired, or straightforward, but not
selective, leaving the analyst with a complicated separation following the extraction.

14
In the early years of reversed-phase chromatography, attempts were made to inject such samples
directly onto a HPLC column [47, 48]. It was quickly realized that this approach generally
resulted in a rapid deterioration of the column’s separation performance, an increase of
background interferences, and a dramatic increase in column backpressure. In addition, the
chromatographic sorbent selectivity may be altered by irreversible adsorption of matrix
compounds such as proteins [49]. Therefore, effective sample preparation techniques are needed
to clean biological samples before analysis. Sample preparation techniques include solid phase
extraction, liquid-liquid extraction and protein precipitation.
Solid Phase Extraction (SPE)
SPE is so far the most popular sample preparation method [50]. However, this trend is rather
recent. Liquid-liquid extraction (LLE) has been the technique of choice for sample preparation
for decades [51]. The transition from LLE to SPE can be refered to several reasons. First, the
strict rules of organic solvents disposal has encouraged solvent-free procedures. Second, the
increasing need to analyze more polar compounds has discouraged LLE, which is usually
associated with poor recoveries for polar compounds. Third, SPE is more compatible with full
automation of on-line extraction than any other sample preparation technique. Finally, the
tremendous advances in the SPE product technology, which produces sorbents of a very wide
diversity in selectivity, allows SPE to be suitable for the extraction of a wide spectrum of
compounds with different physicochemical properties [52, 53].
The most appealing feature of SPE is the availability of a wide variety of sorbents that are
specially made to cover a broad polarity range of analytes. SPE sorbents can be classified under
6 categories:

15
Chemically modified silica
Silica-based stationary phases are the oldest sorbents to be used and yet the most popular.
Modified silica sorbents are the same as the stationary phases used in LC columns except that
they are made of larger granules [54]. Bare silica slurries are derevatized with n-alkyl chloro
silanes under acidic conditions and passed through sieves to make derivatized silica granules.
The n-alkyl chain can range in length from C1 to C18. The analyte is mainly retained in the
stationary phase by hydrophobic bonding with the exposed alkyl chains [55, 56]. In order to
maximize this hydrophobic action, the sorbent granules are made porous with large specific
surface area. Also, a high percentage of carbon loading corresponding to a maximum coverage
by the alkyl moieties is required. In disagreement with the trend of minimizing the residual
underivatized silanol groups in LC, these free silanol groups might add a beneficial secondary
interaction in the SPE process [57]. Electrostatic interactions between the analytes and the free
silinol groups provide supplementary retention mechanism in addition to the hydrophobic
interaction with the derivatized silinol groups.
Other chemically derivatized silica includes cyanopropyl, aminopropyl, cyclohexyl and
phenyl phases. These moieties provide additional secondary types of interaction like H-bonding,
electrostatic and dipole-dipole interactions.
The main advantage of silica-based sorbents is their compatibility with high pressure,
allowing for performing on-line extraction. However, the use of silica-based sorbents is
restricted to the pH range of 3-7.

16
Polymeric-based sorbents
Poly (styrene-divinylbenzene) (PS-DVB) copolymers and its derivatives are the most commonly
used polymeric-based cartridges. PS-DVB can be derivatized to add positively or negatively
charged active moieties [58]. Hydrophobic interaction with the polymer and the electrostatic
interaction with the charged active sites provide the basis for analytes retention. The main
advantage of the polymeric-based sorbents is their compatibility to operate under all pH
conditions [59].
Carbon-based sorbents
The most widely used carbon-based SPE are graphitized carbon black (GCB) obtained by
heating carbon at high temperature. Every carbonaceous sorbent contains various functional
groups that provide stronger retention for polar compounds. Compounds are retained by both
hydrophobic and electrostatic interactions, so that very polar, but also non-polar analytes are
retained [60]. The main disadvantage of carbon-based sorbents is their low resistance to high
pressure; therefore they are harder to integrate with on-line analysis [61].
Ion-exchange sorbents
Ionizable analytes can be retained in the stationary phase by ionic bonding with active moieties
of opposite charge to the analytes of interest. Strong exchangers are strong acids or bases with a
permanent charge over a wide pH range. Weak exchangers are weak acids or bases that can be
in the ionized or the unionized form, depending on the pH. The analyte should be in the ionized
form to interact with the ionic moieties of the stationary phase. The analyte is then eluted by
changing the pH to transform the analyte into the unionized form or by introducing a counter ion,
which has a stronger affinity to the sorbent ionic moieties. Cationic exchangers include weak
carboxylic acid and strong sulfonic acid groups. Anionic exchangers include weak 1°or 2°

17
amino groups, while strong anionic exchangers have 3° amino groups [50]. The main problem
encountered with the use of ion exchange SPE is the technique incompatibility with samples that
contain a high amount of inorganic salts [62].
Mixed-mode sorbents
Sorbents made of two or more types of packing exhibit higher selectivity by providing several
types of interactions to specifically retain the analyte of interest. Alkyl silica-free silinol and PS-
DVB sulfonated cation exchange are examples of mixed-mode sorbents [63, 64].
Normal-phase sorbents
Normal phase sorbents include bare silica, alumina and silica chemically modified with polar
groups such as amino, cyano or diol groups. Only analytes dissolved in non-polar solvents can
be handled by normal phase SPE. Few natural matrices are readily soluble in these solvents such
as oil, lipids and cosmetics.
Immuno-based sorbents
Antigen-antibody interactions are more specific than any other type of chemical interaction. The
binding of the antigen to antibody is the result of spatial complementarity and is a function of the
sum of intermolecular interactions. The analyte of interest are injected to the appropriate
biological system to induce the immune system to produce specific antibodies [65]. The
antibodies are covalently bonded onto an appropriate sorbent to produce the so-called
immunosorbent. Cross-reactivity between structurally related compounds is a common
phenomenon, especially for small molecules. This phenomenon can be exploited to extract a
compound and it’s metabolites from a complex matrix [66].

18
Restricted access matrix sorbents (RAM)
RAM sorbents were developed for direct injection of biofluids containing a high content of
macromolecular contaminants. The mechanism of restricted access depends on exclusion of
high molecular-weight matrix components from the internal surface of sorbent particles. The
access of proteins is prevented by a physical diffusion barrier (size exclusion) by an appropriate
pore diameter and a chemical barrier by modification of the outer surface of sorbent particles
with hydrophilic polymers [67]. This polymer coating prevents the irreversible non-specific
adsorption of proteins to the sorbent particles. The low molecular-weight analytes are retained
by conventional retention mechanisms, such as hydrophobic and ionic interactions to the internal
active surface of the sorbent particles [68, 69].
Molecularly imprinted polymers (MIPs)
MIPs involve the preparation of polymers with specific recognition sites for certain molecules.
The synthesis is made by the assembly of monomers around a template molecule and a
subsequent polymerization using a cross –linker providing a rigid material. Then the template
molecules are removed and the resulting polymers have cavities which are the imprints. These
cavities are the recognition sites allowing binding of the template molecule. Like
immunosorbents, the recognition is due to shape and mixture of hydrogen, hydrophobic and
electronic interactions [70, 71].
Protein Precipitation
The main objective of sample preparation for the analysis of components in biological fluids is
the removal of macromolecular contaminants, mainly proteins. Protein precipitation can be
achieved by several means. Proteins may be precipitated by decreasing the dielectric constant
with the addition of an organic reagent such as methanol or acetonitrile. Protein precipitation

19
can also be accomplished by increasing the ionic strength, i.e. the salting out effect by the
addition of high concentrations of ammonium sulfate. Finally, proteins can be precipitated by
changing the sample pH with the addition of concentrated acids such as perchloric acid or
trichloroacetic acid or concentrated alkaline reagents like sodium or potassium hydroxide.
Protein precipitation is the least selective method for biological sample preparation but yet the
fastest [72, 73].
Liquid-liquid extraction (LLE)
LLE is another traditional method for sample clean up. It offers better selectivity in sample
preparation than simple protein precipitation, particularly for non-polar analytes. LLE depends
upon the greater solubility of the analyte in a suitable organic solvent in comparison to their
solubility in the aqueous phase. The pH of the sample is adjusted so that the drug to be extracted
is unionized, thus facilitating partitioning into the organic solvent [74]. The organic layer is then
aspirated, evaporated and reconstituted in a solvent compatible with the buffer system. Freezing
the aqueous layer by cooling the sample may facilitate the collection of the organic layer. The
reconstituted aqueous sample can be further washed with non-polar organic solvents if lipophilic
co-eluants have to be removed. Alternatively, after the collection of the organic layer, the
analyte can be back extracted into an acid or a base. Trimethylbutylether, chloroform,
diethylether, and dichloromethane are the most used organic solvents in LLE of biological
samples [75].
Membrane-based sample preparation (Dialysis)
Dialysis is a separation technique that utilizes the differential mass flux through a semi
permeable membrane. The membrane is usually a microporous network of a synthetic polymer
with a distinctive molecular weight cut off (MWCO), which specifies the smallest molecule to be

20
able to cross through the membrane pores. The primary application of dialysis is the isolation of
drugs from the macromolecular interferences, proteins mainly, of the matrix. Dialysis is driven
by a concentration gradient across the membrane. In order to keep the mass flux across the
membrane, the analyte should be constantly removed from the acceptor side, which leads to
excessive dilution of the analyte. Therefore, a concentration step, by evaporation or SPE, is
usually required prior to analysis [76].
The advantage of dialysis comes from its ability to selectively extract the protein-
unbound fraction of the total drug concentration. Protein precipitation, LLE and SPE extraction
techniques are not able to distinguish the protein-unbound fraction from the total fraction of
drug. The unbound fraction of a drug is the only fraction available for any pharmacological
action and for body distribution. The unbound drug analysis allows access to the information on
drug transport equilibration across biological membranes [77, 78].
Most importantly, microdialysis devices are now available for direct and continuous
sampling of biological fluids inside the living system. Because the microdialysis technique
involves minimal biological fluid loss from the body, multiple sampling from the same animal
becomes possible. Thus, more data points are collected from a relatively smaller number of
animals [79].
Dissertation Structure
This dissertation is composed of 4 chapters presenting different validated analytical methods for
the detrmination of the nucleoside analogues zidovudine (AZT) and lamivudine (3TC) as well as
the zidovudine intracellular monophosphate metabolite (AZT-MP) in different biological
matrices. The biological matrices included pregnant rat plasma, amniotic fluid, placenta and
fetus tissues. In each chapter, the stepwise process of the bioanalytical method development and

21
validation is presented including sample preparation, chromatographic separation and
spectrometric detection. The applications of these analytical methods were demonstrated in
animal studies.
The first chapter presents a validated method to quantify AZT and AZT-MP in rat tissues
using capillary electrophoresis. The second and third chapters present validated methods to
quantify 3TC and simultaneous 3TC-AZT in pregnant rat plasma and tissues using HPLC-UV.
The fourth chapter presents a validated method to quantify the 3TC-AZT combination in
pregnant rat tissue using LC-MS-MS. These valid methods were applied to animal studies to
investigate the mechanism of anti-HIV nucleoside analogues placental transport in the pregnant
rat model. Finally, the appendix presents a fundamental study to compare the behavior of
cyclodextrin-local anesthetic non-covalent complexes in solution and gas phases using capillary
electrophoresis and electrospray ionization mass spectrometry, respectively.
References
1. IUPAC Analytical Chemistry Division, Commission on Analytical Nomenclature.
Pure Appl Chem 37 (4): 445-462 1974
2. J. C. Giddings. Dynamics of Chromatography, Dekker, New York, 1965.
3. M. S. Tswett. Ber Dtsc Bot Ges. 24, 316-323, 1906
4. M. S. Tswett. Ber Dtsc Bot Ges. 24, 384-393, 1906
5. J. J. Vandeemter, F. J. Zuiderweg, A. Klinkenberg. Chem Eng Sci 5 (6): 271-289
1956
6. J. C. Giddings. Liquid chromatography with operating conditions analogous to those of gas
chromatography. Anal Chem 35 (13): 2215, 1963.
7. M. G. Khaledi. High-performance capillary electrophoresis : theory, techniques, and

22
applications. John Wiley & Sons, New York, 1998.
8. Chankvetadze B. Capillary electrophoresis in chiral analysis. John Wiley, New
York, 1997
9. Altria K. D. Capillary electrophoresis guidebook: principles, operation, and
applications. Humana Press, Totowa, N.J., 1996.
10. Camilleri P. Capillary electrophoresis : theory and practice. Boca Raton : CRC
Press, c1993
11. Li, S. F. Y. Capillary electrophoresis : principles, practice, and
applications. Amsterdam ; New York : Elsevier, 1992
12. Kuhn, R. Capillary electrophoresis : principles and practice. Berlin ;
New York ; Springer-Verlag, 1993
13. Dempster AJ. Positive-ray abundance spectrometry. Phys Rev 11:316-321, 1918
(http://masspec.scripps.edu/information/history/perspectives/borman.html)
14. Roboz J. Introduction to mass spectrometry; instrumentation and techniques.
New York, Interscience Publishers, 1968
15. Watson, J. Introduction to mass spectrometry. New York : Raven Press,
1985
16. Cooks RG, Beynon JH, Caprioli RM, Lester GR. Metastable Ions. Elsevier, New
York, 1973.
17. Weickhardt C, Moritz F, Grotemeyer J. Time of flight mass spectrometry: State of
the art in chemical analysis and molecular science. Mass Spectrom Rev 15 (3): 139-
162 MAY-JUN, 1996
18. Wiley WC, McLaren IH. Time of flight mass spectrometer with improved
23
resolution. Rev Sci Instrum (12): 1150-1157, 1955
19. Wiley WC, McLaren IH. Time of flight mass spectrometer with improved resolution
(Reprinted from Review of Scientific Instrumensts vol 26, pg 1150, 1995). J Mass
Spectrom 32 (1): 4-11 JAN, 1997
20. E. O. Lawrence and N. E. Edlefsen, Science 72, 376, 1930
21. Winger BE, Hofstadler SA, Bruce JE, et al. High resolution accurate mass
measurement of biomolecules using a new electrospray ionization mass
spectrometer. J Am Soc Mass Spectrom 4 (7): 566-577 JUL, 1993
22. Pitsenberger CC, Easterling ML, Amster IJ. Efficient ion remeasurement using
broadband quadrupole excitation FTICR mass spectrometry. Anal Chem (21): 3732-
3739 NOV, 1996
23. Amster IJ. Fourier transform mass spectrometry. J Mass Spectrom 31 (12): 1325-
1337 DEC, 1996
24. Graff DK. Fourier and hadamard transforms in spectroscopy. J Chem Educ 72 (4):
304-309 APR, 1995
25. Johlman CL, White RL, Wilkins CL. Applications of Fourier transform mass
spectrometry. Mass Spectrom Rev 2 (3): 389-415, 1983
26. Wollnik H. Ion optics in mass spectrometers. J Mass Spectrom 34 (10): 991-1006
OCT, 1999
27. R. M. Caprioli (eds.), selected topics and mass spectrometry in the biomolecular
Science, kluwer academic publishers, Netherlands, 213-238, 1997
28. Miller PE, Denton MB. The quadrupole mass filter-basic operating concepts
J Chem Educ 63 (7): 617-622 JUL, 1986
24
29. Dawson PH. Quadrupole mass spectrometry and its applications, Elsevier, New
York, 1976.
30. Dawson PH. Quadrupole mass analyzers, performance, design and some recent
applications. Mass Spectrom Rev 5 (1): 1-37 SPR, 1986
31. Douglas DJ, French JB. Collisional focusing effects in radio frequency quadrupoles.
J Am Soc Mass Spectrom 3 (4): 398-408 MAY, 1992
32. Stafford GC, Kelley PE, Syka JEP, et al. Recent improvements and analytical
applications of advanced ion trap technology. Int J Mass Spectrom: 85-98 SEP,
1984
33. Kaiser RE, Cooks RG, Stafford GC, et al. Operation of a quadrupole ion trap mass
spectrometer to achieve high mass to charge ratios. Int J Mass Spectrom 106: 79-115
MAY 15, 1991
34. Nier, A.O. Rev. Sci. Instr., 11, 212 (1940); 18, 398 (1947)
35. Munson MSB, Field FH. Chemical ionization mass spectrometry .I. General
Introduction. J Am Chem Soc 88 (12): 2621-& 1966
36. Barber M, Bordoli RS, Elliott GJ, et al. Fast atom bombardment mass spectrometry.
Anal Chem 54 (4): A645-& 1982
37. Barber M, Bordoli RS, Sedgwick RD, et al. Fast atom bombardment as an ion source
in mass spectrometry. Nature 293 (5830): 270-275, 1981
38. Barber M, Bordoli RS, Sedgwick RD, et al. Fast atom bombardment of solids (FAB),
A new ion source for mass spectrometry. J Chem Soc Chem Comm (7): 325-327,
1981
39. Malorni A, Marino G, Milone A. Effect of matrix modification by strong mineral
25
acids on the positive fast atom bombardment mass spectra of peptides. Biomed
Environ Mass 13 (9): 477-482 SEP
40. Desiderio DM. Mass spectrometry: clinical and biomedical applications. Plenum Press,
New York, 1992
41. Cohen SL, Chait BT. Influence of matrix solution conditions on the MALDI-MS
analysis of peptides and proteins. Anal Chem 68 (1): 31-37 JAN, 1996
42. Vorm O, Roepstorff P, Mann M. Improved resolution and very high sensitivity in
MALDI-TOF of matrix surfaces made by fast evaporation. Anal Chem 66 (19):
3281-3287 OCT, 1994
43. Willoughby RC, Browner RF. Mono-disperse aerosol generation interface for
combining liquid chromatography with mass spectroscopy. Anal Chem 56 (14):
2626-2631, 1984
44. Bruins AP, Covey TR, Henion JD. Ion spray interface combined liquid
chromatography/atmospheric pressure ionization mass spectrometry. Anal Chem 59
(22): 2642-2646 NOV 15 1987
45. Alimonti A, Petrucci F, Santucci B, et al. Determination of chromium and nickel in
human blood by means of inductively coupled plasma mass spectrometry. Anal
Chim Acta 306 (1): 35-41 APR 28, 1995.
46. Song HC, Kusmierz J, Abramson F, et al. Implementation of the chemical reaction
interface mass spectrometry techniques on a Hewlett-Packard mass selective detector.
J Am Soc Mass Spectrom 5 (8): 765-771 AUG,1994
47. Wahlund KG. Separation of acidic drugs in the µg/ml range in untreated blood by
direct injection on liquid chromatographic columns. J Chromatogr 218 (1-3): 671-

26
679, 1981
48. Manno BR, Manno JE, Dempsey CA, et al. A high pressure liquid chromatographic
method for the determination of N-acetyl-para-aminophenol in serum or plasma using
a direct injection technique. J Anal Toxicol 5 (1): 24-28, 1981
49. Arvidsson T, Wahlund KG, Daoud N. Procedures for direct injections of untreated
blood-plasma into liquid chromatographic columns with emphasis on a pre-column
venting technique. J Chromatogr 317: 213-226 DEC, 1984
50. Hennion MC. Solid phase extraction: method development, sorbents and coupling
with liquid chromatography. J Chromatogr A 856 (1-2): 3-54 SEP 24, 1999
51. Bouzige M, Pichon V, Hennion MC. On-line coupling of immunosorbent and liquid
chromatographic analysis for the selective extraction and determination of polycyclic
aromatic hydrocarbons in water samples at the ng level. J Chromatogr A 823 (1-2):
197-210, OCT 9 1998
52. Chiron S, Alba AF, Barcelo D. Comparison of on-line solid phase disk extraction to
liquid-liquid extraction for monitoring selected pesticides in environmental waters.
Environ Sci Technol 27 (12): 2352-2359, NOV 1993
53. Gilar M, Bouvier ESP, Compton BJ. Advances in sample preparation in
electromigration, chromatographic and spectrometric methods. J Chromatogr A 909
(2): 111-135, FEB 16 2001
54. M.C Hennion, P. Scribe, in : D.Barcelo (Ed.), Environmental analysis: Techniques,
Applications and Quality Assurance, Elsevier, Amsterdam, 1993, p. 24-77.
55. Kobayashi S, Tanaka I, Shirota O, et al. Synthesis and characterization of a polymer-
coated C-18 stationary phase with high carbon content for liquid chromatography. J

27
Chromatogr 828 (1-2): 75-81, DEC 18 1998
56. Sudo Y, Wada T. Characteristics of octadecylsilylated gels end-capped by high
temperature silylation. J Chromatogr A 813 (2): 239-246, JUL 17 1998
57. Wirth MJ, Swinton DJ. Single molecule probing of mixed adsorption at a
chromatographic interface. Anal Chem 70 (24): 5264-5271, DEC 15 1998
58. Schmidt L, Sun JJ, Fritz JS, et al. Solid phase extraction of phenols using membranes
loaded with modified polymeric resisns. J Chromatogr 641 (1): 57-61, JUL 2 1993
59. Barcelo D, Chiron S, Lacorte S, et al. Solid phase sample preparation and stability of
pesticides in water using pore disks. Trac-Trend Anal Chem 352-361, OCT 1994
60. Dicorcia A, Marchetti M. Multiresidue method for pesticides in drinking-water using
a graphitized carbon-black cartridge extraction and liquid chromatographic analysis.
Anal Chem 63 (6): 580-585, MAR 15 1991
61. Knox JH, Kaur B, Millward GR. Structure and performance of porous graphitic
carbon in liquid chromatography. J Chromatogr 352: 3-25, FEB 21 1986
62. Nielen MWF, Brinkman UAT, Frei RW. Industrial wate-water analysis by liquid
chromatography with precolumn and diode array detection. Anal Chem 57 (4): 806-
810, 1985
63. Dumont PJ, Fritz JS. Effetc of resin sulfonation on the extraction of polar organic
compounds in solid phase extraction. J Chromatogr A 691 (1-2): 123-131, FEB 3
1995
64. Mills MS, Thurman EM, Pedersen MJ. Application of mixed mode solid phase
extraction in environmental and clinical chemistry, combining hydrogen-bonding,
cation exchange and vanderwaals interactions. J Chromatogr 629 (1): 11-21, JAN 15
28
1993
65. MartinEsteban A, Kwasowski P, Stevenson D. Immunoaffinity-based extraction of
phenylurea herbicides used mixed antibodies against isoproturon and chlortoluron.
Chromatographia 45: 364-368 Suppl. S 1997
66. Stevenson D. Immuno-affinity solid phase extraction. J Chromatogr B 745 (1): 39-48,
AUG 4 2000
67. Ha Gestam IH, Pinkerton TC. Internal Surface reversed-phase silica supports for
liquid chromatography. Anal Chem 57 (8): 1757-1763, 1985
68. Unger KK. Packing materials with surface barriers, controlled distribution and
topography of ligands for sample clean-up and analysis of biologically active solutes
in HPLC. Chromatographia 31 (9-10): 507-511, MAY 1991
69. Yu Z, Westerlund D. Influence of mobile phase conditions on the clean-up effect of
restricted access precolumns for plasma samples injected in a column-switching
system. Chromatographia 44 (11-12): 589-594 JUN 1997
70. Hosoya K, Shirasu Y, Kimata K, et al. Molecular imprinted chiral stationary phase
prepared with racemic template. Anal Chem 70 (5): 943-945 MAR 1 1998
71. Ramstrom O, Ye L, Krook M, et al. Application of molecularly imprinted materials
as selective adeorbents: Emphasis on enzymatic equilibrium shifting and library
screening. Chromatographia 47 (7-8): 465-469 APR 1998
72. Hartwick RA, Vanhaverbeke D, Mckeag M, et al. Sample preparation techniques
prior to HPLC analysis of serum nucleosides and their bases. J Liq Chromatogr 2 (5):
725-744 1979
73. McDowall RD, Doyle E, Murkitt GS, et al. Sample preparation for the HPLC analysis

29
of drugs in biological fluids. J Pharm Biomed 7 (9): 1087-1096, 1989
74. McDowall RD. Sample preparation for biomedical analysis. J Chromatogr B 492: 3-58
AUG 8 1989
75. McDowall RD, Pearce JC, Murkitt GS. Liquid solid sample preparation in drug
analysis. J Pharm Biomed 4 (1): 3-21 1986
76. Pedersen-Bjergaard S, Rasmussen KE, Halvorsen TG. Liquid-liquid extraction
procedures for sample enrichment in capillary zone electrophoresis. J Chromatogr A
902 (1): 91-105, DEC 1 2000
77. van de Merbel NC. Membrane-based sample preparation coupled on-line to
chromatography or electrophoresis. J Chromatogr A 856 (1-2): 55-82, SEP 24 1999
78. Cordero BM, Pavon JLP, Pinto CG, et al. Analytical applications of membrane
extraction in chromatography and electrophoresis. J Chromatogr A 902 (1): 195-204
DEC 1 2000
79. Tsai TH. Assaying protein unbound drugs using microdialysis techniques. J
Chrmoatogr B 797 (1-2): 161-173 NOV 25 2003

30
CHAPTER 1
SIMULTANEOUS QUANTITATION OF ZIDOVUDINE AND ZIDOVUDINE
MONOPHOSPHATE FROM PLASMA, AMNIOTIC FLUID AND TISSUES BY
MICELLAR CAPILLARY ELECTROPHORESIS1
1 Alnouti, Y., C.A. White and M.G. Bartlett. Submitted to Biomedical Chromatography.

31
Abstract
Zidovudine (AZT) therapy given during pregnancy has been shown to reduce the vertical
transmission of the human immunodeficiency virus (HIV) from mother to fetus. In order to
investigate the efficacy of AZT, it is important to know the concentration of its active
phosphorylated metabolites. We have developed the first CE method for the simultaneous
quantitation of AZT and zidovudine monophosphate (AZT-MP) from rat plasma, amniotic fluid
and fetal tissues. Sample extractions were performed by protein precipitation using acetonitrile
for the plasma and amniotic fluids, while in fetal tissues solid phase extraction using Waters
OasisTM HLB extraction cartridges was used. Recoveries ranged from 78-92 % for AZT, AZT-
MP and 3`-azidouridine (internal standard, AZDU), in the three matrices. The optimum
separation conditions were achieved by using a 40 mM sodium dodecylsulfate (SDS) in 50 mM
phosphate buffer (pH 7) with a run voltage of 15 kV. The CE system consists of a 75 µm I.D.,
50 cm effective length uncoated fused silica capillary. The method was validated over the range
0.5- 100 µg/ml (µg/g for tissues). Intra-day precision (RSD) and accuracy (% Error) for AZT
ranged from 0.13-11 % and 0.68-11.1 %, respectively; while for AZT-MP it ranged from 2.05-
11.1 % and 4.22-11.7 %. Inter-day precision and accuracy for AZT ranged from 3.82-11.2 %
and 3.14-9.01 %; while for AZT-MP it ranged from 3.9-9.32 % and 3.44-9.37 %, respectively.
We also report the enzymatic dephosphorylation of AZT-MP in the placental tissue of rats. This
new enzymatic pathway provides increased understanding of the mechanism of anti-viral
transport in the rat during pregnancy.
Introduction An increasing proportion of newly diagnosed cases of acquired immune deficiency syndrome
(AIDS) are seen in women. The majority of these women are of reproductive age and many

32
become pregnant (Landesman et al., 1987). Transmission of the causative agent, the human
immunodeficiency virus (HIV), can occur from an infected mother to her newborn (Scott et al.,
1985). An estimated 7000 infants are born to HIV- infected mothers each year in the United
States (Olivero et al., 1999). Worldwide vertical transmission of HIV is reaching epidemic
proportions with over 600,000 infected infants being born each year (Mofenson et al., 2000).
This vertical transmission may occur early or late in pregnancy, during birth, or postnatally
through breast-feeding.
Zidovudine (AZT) was the first anti-HIV agent to be approved by the United States FDA
for the treatment of AIDS (Ho et al., 1989). AZT mono therapy during pregnancy has been
shown to reduce the incidence of HIV infection in the infants from 26% to 8% (Boal et al.,
1997). Combination therapies involving AZT can further reduce vertical transmission to 2%
(Mofenson et al., 2000). However, no method has been shown to be 100% effective.
AZT is a prodrug that produces its antiviral activity through its triphosphate metabolite
(Sandberg et al., 1995). AZT is first phosphorylated intracellularly by thymidine kinase to yield
AZT-MP. A second phosphate group is added by thymidylate kinase and finally the third
phosphorylation step is catalyzed by pyrimidine nucleotide diphosphate kinase to yield AZT-TP
(Patterson et al, 1997). AZT-TP inhibits the enzyme HIV reverse transcriptase and causes viral
DNA chain termination (Mitsuya et al., 1990). The second phosphorylation step catalyzed by
thymidine kinase is the rate-limiting step in the metabolic activation pathway of AZT (Qian et
al., 1994). Therefore, levels of AZT-MP may be used to predict the ultimate level of the active
triphosphate metabolite, making it an important indicator of intracellular AZT-TP levels. AZT-
TP constitutes < 5% of the total amount of the intracellular phosporylated metabolites and
therefore, is very difficult to detect even when using radio labeled compounds (Patterson et al.,

33
1997). This fact makes the determination of AZT-MP a more reasonable routine clinical
measurement.
In-vitro and in-vivo studies have shown that AZT readily transfers through the placenta
by passive diffusion (Qian et al., 1994; Liebes et al.,1990, 1993; Bawdon et al., 1992). In
contrast, the more polar highly charged phosphorylated metabolites produced by the mother’s
tissues, are unlikely to cross the placenta to the fetus (Qian et al., 1994; Liebes et al.,1990). The
phosphorylated AZT metabolites detected in the fetal tissues have therefore been suggested to be
produced by the fetal tissues (Patterson et al., 1997). In this study, we have characterized an
enzymatic dephosphorylation of AZT-MP in the rat placental homogenate. Several in vitro
studies report the phosphorylation of AZT by isolated human placentas (Qian et al., 1994; Liebes
et al.,1990, 1993). In a kinetic study, Sandberg et al., studied the distribution of AZT and its
phosphorylated metabolites in pregnant monkeys and their fetuses (Patterson et al., 1997). AZT-
MP was detected in all fetal tissues as well as placental tissues. However, the levels of AZT-MP
found in the placenta were much lower than in other tissues. To date, no studies have
investigated the presence of AZT-MP in the placenta of the rat.
Several analytical methods are available in the literature for the quantification of AZT in
animal and human plasma using HPLC-UV (Good et al., 1988, Unadkat et al., 1988),
Radioimmunoassay (RIA) (Huang et al., 1996; Tadepalli et al., 1990) and CE (Fan et al., 2002).
The method of Good et al. (Good et al., 1988), which used SPE and HPLC-UV for the
determination of AZT from plasma, has been used widely to study the pharmacokinetics of AZT
in pregnant monkeys (Lopez-Anaya et al., 1990, 1990, 1991) and humans (Watts et al., 1991).
A few other studies used RIA based techniques (Garland et al., 1996; O’sullivan et al., 1993).

34
All of these methods were only used to analyze for AZT alone or AZT and its glucoronidated
metabolite.
AZT levels have been shown to be poorly correlated with its active phosphorylated
metabolites (Peter et al., 1996). Therefore, it is very important to study the kinetics of the
phosphorylated metabolites directly. Several in vitro in blood cell, placental cell culture and
perfused placenta studies were dedicated to study the kinetics of AZT transfer and
phosphorylation kinetics (Qian et al., 1994; Liebes et al.,1990; Brody et al., 1997; Törnevik et
al., 1991, 1995). Although insightful, results from these studies can not be meaningfully
extrapolated to living systems until in vivo studies are conducted. One in vivo study (Patterson et
al., 1997) has addressed the kinetics of AZT phosphorylated metabolites. This study relied on a
single sample collection following the sacrifice of a monkey’s fetus and subsequent analysis of
the different fetal tissues for the phosphorylated metabolites.
In all the above-mentioned in vitro and in vivo studies, which addressed AZT
phosphorylated metabolites, AZT[3H] was used and quantification of AZT and its
phosphorylated metabolites was performed by liquid scintillation counting spectrometry (LSS).
Total radioactivity counting was sometimes used directly to quantify AZT, which could give
misleading results by not discriminating between responses for AZT and its metabolites. Despite
the availability of some HPLC-UV methods for the quantification of the phosphorylated
metabolites (Molema et al., 1992, Tan et al., 2000, Toyoshima et al., 1991) most methods have
not been used in any kinetic study. To date, all the kinetics studies involving the phosphorylated
metabolites have used the method of (Qian et al., 1994). In this method, samples were extracted
by acid precipitation and separated by anion exchange chromatography. Fractions were
collected and analyzed by LSS. The phosphorylated metabolites level was determined by

35
calculating the ratio of radioactivity counting at the time where the standard eluted to the total
radioactivity. More recently some studies used on line radioactivity detection (Törnevik et al.,
1991, 1995). However, the widely used method of Qian et al. has not been validated, including
even reports of the accuracy and precision. Furthermore, this technique is quite time consuming
and requires special instrumentation and training not available in most bioanalytical labs.
In this report we provide the first validated, sensitive and accurate CE method for the
simultaneous quantification of AZT and AZT-MP in pregnant rat plasma, amniotic fluid and
fetal tissues. This method is simple and suitable for conducting pharmacokinetic studies of AZT
and its mono phosphorylated metabolite in pregnant rats to determine their distribution and
transport profiles in the maternal as well as the fetal compartments.
Experimental Chemicals and Reagents AZT was obtained from Glaxo-Wellcome (RTP, NC, USA). AZT-MP, sodium lauryl sulfate,
tetrabutyl ammonium bromide, tetraethyl ammonium bromide, trichloroacetic acid,
trifluoroacetic acid were obtained from Sigma Chemical Co (St. Louis, MO, USA). HPLC-grade
acetonitrile and methanol and were purchased from Fisher Scientific (Fair Lawn, NJ, USA).
Dibasic and monobasic sodium phosphate were obtained from EM Science (Gibbstown, NJ,
USA). Ammonium sulfate, ammonium hydroxide, potassium hydroxide, perchloric acid,
hydrochloric acid, diethyl ether and triethanol amine were obtained from J.T Baker Inc
(Phillipsburg, NJ, USA). All chemicals were used without further purification. OasisTM HLB
1cc (30 mg) Extraction Cartridges were obtained from Waters (Milford, Massachusetts, USA).
These SPE cartridges are a polymeric mixed phase that is useful for separating compounds of
widely differing hydrophobicity. Syringe filters (0.22 µl) were obtained from XPERTEK (St.

36
Louis, MO, USA). Syringes (1 ml) were obtained from Becton Dickinson Co (Franklin Lakes,
NJ, USA).
Electrophoretic system
Analyses were performed with a P/ACE system 5000 (Beckman Inc., Fullerton, CA, USA).
Samples were introduced by pressure (0.5 PSI) for 5 seconds and detection was accomplished by
UV absorbance at 254 nm. The capillary was thermostated at 25 oC. The separations were run at
15 kV towards the cathodic end with an uncoated fused silica capillary (Polymicro Technology,
Phoenix, AZ, USA) of 75 µm I.D. and 50 cm effective length (the distance from the capillary
inlet to the detection window). Detection was performed by removing the polyamide coating
from a short segment of the capillary and placing it in the optical path of the detector. The final
optimized run buffer conditions were found to be 50 mM dibasic sodium phosphate containing
40 mM sodium lauryl sulfate (SDS) at pH 7. The pH was adjusted using concentrated
phosphoric acid and 1 M sodium hydroxide solutions. Under these electrophoretic conditions the
current intensity was 85 µA.
New silica capillaries were conditioned by rinsing with 1 N NaOH for 15 minutes, water
for 15 minutes, 1 N HCl for 30 minutes, distilled water for 30 minutes and finally with the
running buffer for one hour. Between runs, the capillary was rinsed with NaOH, distilled water
and the run buffer, for 2 minutes each.
Samples preparation
A number of sample preparation methods were employed to isolate AZT and AZT-MP from
other endogenous compounds. These methods broadly fall into these categories, 1) protein
precipitation, 2) salting out, 3) solid phase extraction.
1- Protein Precipitation:

37
Several different acids, bases and organic solvents were used to precipitate the biological
material in the samples. The procedure generally involved the addition of 300 µl of the
precipitating agent to 100 µl of the sample, which was prespiked with the analyte standard
solutions. Compounds tested as protein-precipitating reagents included trichloroacetic acid
(TCA), trifluoroacetic acid (TFA), perchloric acid (PCA), methanol (MeOH), acetonitrile (ACN)
and potassium hydroxide (KOH). All samples were vortexed and centrifuged at 13000 rpm
(Biofuge Fresco, Kendro Laboratory, Germany) for 10 minutes to aid the precipitation process.
The supernatant was aspirated and then evaporated in a vacuum centrifuge (Speed Vac Plus,
Savant Instruments Inc, NY, USA) and reconstituted in 100 µl of 4 mM phosphate buffer (pH 7)
prior to analysis.
2- Salting Out:
Three hundreds microliters of saturated ammonium sulfate solution and 400 µl acetonitrile were
added to 100 µl of the biological matrices containing the analytes. The samples were vortexed
and centrifuged at 13000 rpm for 10 minutes. The upper organic layer was then aspirated,
evaporated and reconstituted in 100 µl of 4 mM phosphate buffer (pH 7).
3- Solid Phase Extraction:
Solid phase extraction using C8, C18, silica, amino, cyano, and OasisTM HLB extraction cartridges
was attempted to clean up the samples. The cartridges were conditioned with water, methanol
and a buffer, one ml each. One hundred microliters of sample was then loaded onto the
cartridge. The cartridges were then washed with 1 ml buffer under negative pressure. The
analytes were then eluted with 2 ml of methanol. The eluents were finally evaporated and
reconstituted in 100 µl of 4 mM phosphate buffer (pH 7).

38
One hundred millimolar buffer solutions of sodium phosphate were adjusted using
phosphoric acid and ammonium hydroxide to a pH of 3, 7, or 9, and used to investigate the
conditioning and washing of the various SPE cartridges. For C8 and C18 SPE cartridges, further
ion pairing techniques were tried. In these cases, tetrabutyl- or tetraethyl ammonium bromide
cationic ion-pairing reagents were added to the buffer at a final concentration of 10 mM.
Preparation of standard solutions
Stock solutions of 1 mg/ml AZT, AZT-MP and AZDU solution were prepared in distilled water.
Serial dilutions of AZT, AZT-MP stock solution were performed in distilled water to yield final
concentrations of 500, 375, 250, 125, 50, 25, 10, 5 and 2.5 µg/ml. A 250 µg/ml AZDU standard
solution was prepared with distilled water from the AZDU stock solution. The final
concentrations of AZT and AZT-MP in each matrix were as follows: 100, 75, 50, 25, 10, 5, 3, 2,
1, 0.5 µg/ml (µg/g for tissues). The final AZDU concentration in each matrix was 25 µg/ml
(µg/g for tissues).
Calibration curves
To prepare the blank tissue homogenates, placentas and fetuses were obtained from untreated
animals, weighed and then homogenized with 2 volumes of distilled water. Twenty microliters
of the different AZT, AZT-MP solutions and 10 µl of the 250 µg/ml AZDU stock solution were
added to 100 µl of the biological sample.
The fetal and placental tissues were centrifuged at 13000 rpm for 10 minutes. The
supernatant was then loaded onto the polymeric SPE cartridges, which were preconditioned with
water, methanol, and pH 3 phosphate buffer (1 ml each). The samples were then washed with 1
ml of buffer under negative pressure. Samples were eluted from the cartridge with 2 ml of

39
methanol. The eluents were evaporated in a vacuum centrifuge and reconstituted in 100 µl of 4
mM phosphate buffer (pH 7).
For plasma and amniotic fluid samples, 300 µl of ice-cold acetonitrile was added and the
samples were centrifuged at 13000 rpm for 10 minutes. The supernatant was then evaporated in
a vacuum centrifuge and reconstituted in 100 µl of 4 mM phosphate buffer (pH 7). Before CE
analysis all samples were filtered through 0.22 micron nylon filters.
Results and Discussion
Sample Preparation
The AZT and AZDU structures are fairly similar except for an extra methyl group at the 5
position in the pyrimidine ring of AZT. Therefore, they exhibit similar solubility characteristics.
Several techniques were tried to extract the AZT, AZT-MP and the AZDU from the plasma,
amniotic fluid, fetal and placental tissues. For all these techniques 100 µl of the biological
matrices was spiked with the analytes prior to the extraction process. Acid and base protein
precipitation by different strengths of trichloroacetic acid (TCA), perchloric acid (PCA) or
potassium hydroxide (KOH) yielded very poor recovery of AZT-MP. No difference, in either
the appearance of the sample or in the recovery of the analytes was achieved by neutralizing the
aqueous layer with triethanol amine following acid precipitation. With acid and base protein
precipitation, the poor recovery of the AZT-MP may be attributed to the hydrolysis of the
phosphate ester bond caused by the harsh pH conditions. Increased AZT peak areas indicated
degradation of AZT-MP to AZT supporting this hypothesis.
Organic precipitation by acetonitrile or methanol resulted in samples clean enough to
separate the three analytes from the endogenous peaks. However, acetonitrile yielded samples

40
with fewer endogenous peaks than methanol. Organic precipitation for placental and fetal tissues
did not produce samples clean enough for analysis.
Salting the samples with saturated ammonium sulfate ((NH4)2SO4) yielded cloudy
extracts. Saturating the sample with (NH4)2SO4 salt followed by extraction with acetonitrile
(ACN) yielded extremely transparent samples with high AZT and AZDU recoveries and with no
interfering endogenous compounds but not surprisingly, the monophosphate failed to
significantly partition into the organic layer. The phosphate group creates a large difference in
the polarity between the AZT-MP and the nucleoside analogues. This polarity difference makes
it unlikely for the monophosphate to partition with the AZT and AZDU into the organic layer.
The low recovery using this technique excluded the use of salting out as a sample clean-up
technique in our study.
Solid phase extraction for the fetal tissues with the polar amino, cyano and underivatized
silica cartridges did not provide high recoveries for AZDU and AZT. These polar cartridges
were able to more efficiently retain the more polar AZT-MP versus the nucleoside analogues.
Contrasting results were obtained when non-polar cartridges like C8 and C18 were used. The
monophosphate was too hydrophilic to be retained by these cartridges and was found to elute
from the SPE cartridge during sample loading. Saturation of the C18 cartridges with cationic ion
pairing reagents like tetrabutyl or tetraethyl ammonium bromide greatly improved the recovery
of AZT-MP. The ion pairing reagents created cationic sites for the negatively charge AZT-MP
to interact with allowing the monophosphate to be eluted later with methanol. Unfortunately, the
ion-pairing reagent allows the retention of many polar endogenous constituents that were not
able to be easily resolved from the analytes during the CE separation. The unique composition

41
of the OasisTM HLB yielded high recoveries for all three analytes as well as electrophoretic
backgrounds free from interfering endogenous background.
The recoveries of the 3 analytes from the 3 matrices are shown in Table 1.1. The
absolute recoveries were calculated by comparing the peak areas of the spiked plasma, amniotic
fluid and tissue homogenate samples to the corresponding peak areas of the untreated stock
solutions. The recovery of the analytes was consistent across the concentration range of the
assay and did not significantly differ between matrices.
Electrophoretic Conditions
Figure 1.1 shows the structures of AZT, AZT-MP and AZDU. AZDU and AZT are nucleoside
analogues consisting of a modified ribose sugar added to a uracil (pKa = 9.5) or a thymine (pKa =
10) pyrimidine base, respectively. AZT-MP is a nucleotide analogue where a phosphate group is
attached to the 5’-hydroxyl group of the ribose sugar. The ionization of this phosphate group
occurs at all pH’s above 1 and therefore, AZT-MP is almost always negatively charged. AZDU
and AZT are neutral at pH’s below 9 (Gelbart et al., 1998). Neutral analytes cannot be
separated using regular capillary zone electrophoresis because they lack the electrophoretic
driving force and therefore, migrate with the speed and direction of the electroosmotic flow. By
increasing the pH, AZT and AZDU begin to separate at pH 9 where they start to become
negatively charged due to the removal of the proton attached to the amide nitrogen (N3) in the
nucleobase (See Figure 1.1). AZDU migrates later than AZT because it has higher charge to
frictional drag ratio and therefore, has a higher electrophoretic mobility in the opposite direction.
Base line separation between the nucleoside analogues was achieved at pH 10, but interferences
with endogenous peaks made this approach impractical.
In situations where neutral analytes need to be separated, miceller electrokinetic capillary

42
chromatography (MECC) is very useful (Elisabeth et al., 1998; Singhal et al., 1999; Bloom et
al., 1997). The anionic surfactant, sodium lauryl sulfate (SDS) is the most commonly used
surfactant in MECC. Above its critical miceller concentration (CMC, 8 mM), SDS forms
micelles that act as a pseudostationary phase. The differential partitioning of solutes between
the hydrophobic interior of the micelles and the aqueous buffer achieves separation between
analytes (Row et al., 1987). The anionic SDS micelle, containing the solute partitioned inside,
has an electrophoretic mobility towards the anodic end (toward the front of the capillary). Yet,
the overwhelming electroosmotic flow drives the micelle in the cathodic direction
(toward the detector). Since the micelle complex opposes the electroosmotic flow, the higher
the solubility of the analyte inside the SDS micelle, the slower the migration velocity of that
analyte (Lecoq et al., 1993). Because it has an extra methyl group, which allows for greater
solubility in the micelle interior, AZT migrates later than AZDU. Several SDS concentrations
were tried to optimize the separation. Starting from zero, increasing the SDS concentration
improved the resolution of AZDU and AZT. The minimum SDS concentration to achieve base
line resolution between AZDU and AZT and the endogenous interference was 40 mM.
Concentrations in excess of 40 mM caused an increase in the overall run time and were
therefore not pursued.
AZT-MP is negatively charged and has its own electrophoretic mobility that opposes the
electroosmotic flow. Therefore, it migrates much slower than the nucleoside analogues. The
addition of SDS did not significantly affect the migration properties of AZT-MP, which might
indicate poor partitioning with the anionic micelle surface or the hydrophobic micelle interior.
Another possible explanation for the insensitivity of the AZT-MP migration time by the presence
of SDS is that since both AZT-MP and SDS are migrating in the same direction, even a strong
43
interaction between the two would not significantly affect its migration velocity. However the
negative charge on the AZT-MP makes it unlikely to interact with either the negatively charged
surface or the highly hydrophobic interior of the SDS micelle. Figures 2.1-4.1 show
representative electropherograms of the fetal tissue, plasma and amniotic fluid matrices spiked
with the three analytes. Inter-day reproducibility of the analytes migration time was acceptable
and fell in the range of 8 % throughout the entire validation process.
When the run buffer is acidic the analysis time increases due to the decrease in the
electroosmotic flow. Using alkaline run buffers significantly decreases the analysis time.
However, faster run times decrease the method specificity and allow for potential endogenous
interferences. The concentration of the phosphate run buffer did not have a significant effect on
the separation, except that there was reduced reproducibility of the migration time with low (5
mM) and high buffer concentrations (250 mM).
Preparing the samples in a solvent of lower conductivity than the electrolyte background
resulted in sharper peaks and therefore, lower limits of detection. The lower conductivity solvent
was prepared by 10 times dilution of the phosphate buffer. A greater potential field develops
within the sample plug causing the ions to move faster when the voltage is applied across the
capillary. When the ions encounter the buffer boundary they slow down due to the reduced field
to which they are subjected, thereby resulting in analyte stacking within a narrow zone of the
capillary.
Accuracy and Precision
Assay precision and accuracy were calculated for each matrix over 3 days. Precision, as
expressed by % RSD, and accuracy, as expressed by % error for AZT, AZT-MP in the three
biological matrices are shown in Table 2.1. Intra-day (n = 5) precision and accuracy were

44
calculated from the measurement of 5 samples at each QC point on 3 separate days. Inter-day (n
= 15) precision and accuracy were calculated from the pooled data from the 3 days. Three QC
points of concentrations 3, 40, and 90 µg/ml were chosen for the validation of this method. Intra-
day precision (RSD) and accuracy (Error) for AZT ranged from 0.13-11 % and 0.68-11.1 %,
respectively; while for AZT-MP it ranged from 2.05-11.1 % and 4.22-11.7 %. Inter-day
precision and accuracy for AZT ranged from 3.82-11.2 % and 3.14-9.01 %; while for AZT-MP it
ranged from 3.9-9.32 % and 3.44-9.37 %, respectively
The calibration curves showed acceptable linearity (R2 > 0.99) over the range 0.5-100
µg/g. The limit of detection (LOD) was determined as the concentration at which the signal to
noise ratio was 3 measured as peak to peak ratio. The LOD for the three analytes was 0.4 µg/g in
the fetus tissue, plasma and amniotic fluid matrices.
Characterization of Enzymatic Degradation in the Placental Tissues
An interesting phenomenon was noticed while preparing the calibration curves in placental
tissue. The AZT-MP peak disappeared when the placental tissues were processed in a similar
manner to the fetal homogenates. At the same time the AZT signal was observed to double in
area, which indicated the degradation of AZT-MP into AZT. This conclusion was supported by
the fact that when the placental homogenate was spiked with the AZT-MP alone, a signal with
the same migration time for AZT and with a peak area indicating full degradation of AZT-MP to
AZT was observed. When the placental tissue was processed by organic precipitation with
acetonitrile or methanol, it was noticed that the AZT monophosphate produced responses of
varying intensity and was occasionally absent. It was later demonstrated that the peak area of the
AZT-MP varied depending on the time when the organic precipitating agent was added. The
later in time the organic solvent was added after spiking the placental homogenate with the

45
analytes, the smaller the monophosphate peak area and the larger the resulting AZT peak area.
When the organic solvent was added before or immediately after spiking, a full recovery of the
monophosphate and no gain in the AZT recovery resulted. Figure 5.1 shows the relationship
between the time of the organic solvent addition and the degradation of the AZT-MP in the
placental tissue. These results suggest an enzymatic break down of the monophosphate ester
bond to yield AZT. We believe that the addition of the organic solvent denatures the enzyme.
The identity of this enzyme and if it is species dependent has not been established and is the
subject of future investigation.
Conclusion
We have developed the first CE method for the simultaneous quantitation of AZT and AZT-MP
from the plasma, amniotic fluids and fetal tissues of the rat. The CE assay described here
showed acceptable precision, accuracy and linearity over the range from 0.5- 100 µg/g (for the
biological matrices). Plasma and amniotic fluid samples were extracted by protein precipitation
using acetonitrile while the fetal tissue samples were extracted by SPE using Oasis HLB
cartridges. The extraction process for the three biological matrices yielded high recoveries of
AZT, AZT-MP and AZDU. This report of the placenta’s ability to dephosphorylate the
monophosphate metabolite suggests that the placenta will exclude the passage of AZT
phosphorylated metabolites. Furthermore, it suggests that the mechanism of the reduction in the
vertical transmission of HIV by treating the infected mother with AZT is either due to the
reduction of the viral load in the mother, production of the active phosphorylated metabolites by
the fetus or a combination of both mechanisms.

46
References
Bawdon RE, Sobhi S, Dax J. The transfer of anti-human immunodeficiency virus
nucleoside compounds by the term human placenta. Am. J. Obstet. Gynecol. 1992; 167:
1570-1574.
Bloom J, Ortiz J, Rodriguez JF. Azidothymidine Triphosphate Determination Using
Micellar Electrokinetic Capillary Chromatography. Cell. Molec. Bio. 1997; 43:
1051-1055.
Boal JH, Plessinger MA, Reydt CV, Miller RK. Pharmacokinetic and toxicity studies of
AZT (Zidovudine) following Perfusion of Human Term Placenta for 14 Hours. Toxicol.
Applied Pharmacol. 1997; 143: 13-21.
Brody SR, Aweeka FT. Pharmacokinetics of intracellular zidoviudine and its
phosphorylated metabolites in the absence and presence of stavudine using in vitro
human peripheral blood mononuclear cell (PBMC) model. Int. J. Antimicrob. Agents
1997; 9: 131-135.
Elisabeth P, Yoshioka M, Sasaki T, Senda M. Separation of nucleotides using
miceller electrokinetic capillary chromatography. J. Chrmatogr. A 1998; 806: 199-207.
Fan B, Stewart JT. Determination of zidovudine/ didanosine/ nevirapamine
and zidovudine/ didanosine/ ritonavir in human serum by micellar electrokinetic
chromatography. J. Pharm. Biomed. Anal. 2002; 30: 955-960.
Garland M, Szeto HH, Daniel SS, Tropper P J, Myers MM, Stark RI. Zidovudine
kinetics in pregnant baboons. J. AIDS. 1996; 11: 117-127.
Geldart SE, Brown PR. Analysis of nucleotides by capillary electrophoresis. J.

47
Chromatogr. A 1998; 828: 317-336.
Good S, Reynolds, DJ, Miranada PD. Simultaneous quantification of zidoviudine
and its glucuronide in Serum by high performance liquid chromatography. J.
Chromatogr 1988; 431: 123-133.
Ho HT, Hitchcock MJ. Cellular pharmacology of 2,3-dideoxy-2,3-didehydrothymidine, a
nucleoside analog active against human immunodeficiency virus. Antimicrob.
Agents Chemother. 1989; 33: 844-849.
Huang CS-H, Boudinot FD, Feldman S. Radioimmunoassay for zidovudine in
rat placenta and fetus. J. Pharm. Biomed. Anal. 1996; 14: 855-860.
Landesman S, Minkoff H, Holman S, Mccalla S, Sijin O. Serosurvey of human
immunodeficiency virus infection in parturients. Implications for human
immunodeficiency virus testing programs of pregnant women. JAMA 1987; 258: 2701-
2703.
Lecoq A-F. Fraction collection after an optimized miceller electrkinetic capillary
chromatographic separation of nucleic acid constituents. J. Chromatogr 1993; 638: 363-
373.
Liebes L, Mendoza S, Dancis J. Further observations on zidovudine transfer and
metabolism by human placenta, AIDS (London, England) 1993; 7: 589-600.
Liebes L, Mendoza S, Wilson D, Dancis J. Transfer of Zidovudine (AZT) by human
placenta. J.Infect. Dis. 1990; 161: 203-207.
Lopez-Anaya A, Unadkat JD, Schumann LA, Smith AL. Pharmacokinetics of
Zidovudine (Azidothymidine). I. Transplacental Transfer. J AIDS 1990; 3: 959-
964.

48
Lopez-Anaya, A, Unadkat JD, Schumann LA, Smith AL. Pharmacokinetics of
Zidovudine (Azidothymidine). II. Development of Metabolic and Renal Clearance
Pathways in the Neonate. J AIDS 1990; 3: 1052-1058.
Lopez-Anaya, A, Unadkat JD, Schumann LA, Smith AL. Pharmacokinetics of
Zidovudine (Azidothymidine). III. Effect of Pregnancy. J. AIDS 1991; 4: 64-68.
Mitsuya H, Yarchoan R, Broder S. Molecular targets of AIDS therapy. Science 1990;
249: 1533-1544.
Mofenson LM, Mclntyre JA. Advances and research directions in the prevention of
mother-to-child HIV-1 transmission. Lancet 2000; 355: 2237--2244.
Molema G, Jansen RW, Visser J, Meijer DK. Simultaneous analysis of azidothymidine
and its mono-, di-, and triphosphate derivatives in biological fluids, tissue and cultures
cells by a rapid high-performance liquid chromatographic method. J. Chromatogr 1992;
579: 107-114.
Olivero OA, Parikka R, Poirier MC, Vähäkangas K. 3-azido-3-deoxythymidine (AZT)
transplacental perfusion kinetics and DNA incorporation in normal human
placentas perfused with AZT. Mutation Res. 1999; 428: 41-47.
O’sullivan M J, Boyer, PJ, Scott GB, Parks WP, Weller S, Blum R, Balsley J,
Bryson, YJ. The pharmacokinetics and safety of zidovudine in the third trimester of
pregnancy for women infected with human immunodeficiency virus and their infants:
Phase I Acquired Immunodeficiency Syndrome clinical trials group study (Protocol 082).
Am. J. Obstet. Gynecol. 1993; 168: 1510-1516.
Patterson TA, Binienda ZK, Lipe GW, Gillam MP, Slikker W. Transplacental

49
pharmacokinetic and fetal distribution of azidothymidine, its glucuronide and
phosphorylated metabolites in late-term rhesus macaques after maternal infusion. Drug
Metabol. Disp. 1997; 25: 453-459.
Peter K, Gambertoglio JG. Zidovudine phosphorylation after short-term and
long-term therapy with zidovudine in patients infected with the human
immunodeficiency virus. Clin Pharmacol Ther. 1996; 60: 168-176.
Qian M, Bui T, Ho RJ, Unadkat JD. Metabolism of 3-Azido-3-Deoxythymidine
(AZT) in human placental trophoblasts and hofbauer cells. Biochem. Pharmacol. 1994;
48: 383-389.
Row KH, Griest WH, Maskarinec MP. Separation of modified nucleic acid
constituents by micellar electrokinetic capillary chromatography. J. Chromatogr 1987;
409: 193-203.
Sandberg JA, Slikker W. Developmental pharmacology and toxicology of anti- HIV
therapeutic agents: dideoxynucleosides. FASEB 1995; 9: 1157-1163.
Scott GB, Fischl MA, Klimas N, Fletcher MA, Dickinson GM, Levine RS, Parks WP.
Mothers of infants with immunodeficiency syndrome. Evidence for symptomatic and
asymptomatic carriers. JAMA 1985; 253: 363-366.
Singhal R, Xian J, Otim O. Application of spherical and other polymers in capillary
zone electrophoresis: separation of antiviral drugs and deoxyribonucleoside
phosphates by different principles. J. Chromatogr. A 1996; 756: 263-277.
Tadepalli SM, Puckett L, Jeal S, Kanics L, Quinn RP. Differential assay of
zidovudine and its glucuronide metabolite in serum and urine with a
radioimmunoassay kit. Clin. Chem. 1990; 36: 897-900.

50
Tan X, Boudinot, FD. Simultaneous detrmination of zidovudine and its monophosphate
in mouse plasma and peripheral red blood cells by high-performance liquid
chromatography. J. Chromatogr. B 2000; 740: 281-287.
Törnevik Y, Jacobsson B, Britton S, Eriksson S. Intracellular Metabolism of
3-Azidothymidine in Isolated Human Peripheral Blood Mononuclear Cells. Aids
Res. Human Retrovir. 1991; 7: 751-759.
Törnevik Y, Ullman B, Balzarini J, Wahren B, Eriksson S. Cytotoxicity of
3-azido-3-deoxythymidine correlates with 3-azidothymidine-5 monophosphate (AZTMP)
levels, whereas anti-HIV activity correlates with 3-azidothymidine-5-triphosphate
(AZTTP) levels in cultured CEM T-lymphoblastoid Cells. Biochem. Pharmacol. 1995;
49: 829-837.
Toyoshima T, Kimura S, Muramatsu S, Takahagi H, Shimada K. A sensitive nonisotopic
method for the determination of intracellular azidothymidine 5- mono-, 5-di-, and 5-
triphosphate. Anal. Biochem. 1991; 196: 302-307.
Unadkat JD, Crosby SS, Wang JP, Hertel, CC. Simple and rapid high-performance
chromatographic assay for Zidoviudine (Azidothymidine) in plasma and urine. J.
Chromatogr 1988; 430: 420-423.
Watts DH, BrownAZ, Tartaglione T, Burchett SK, Opheim K, Coombs R, Corey L.
Pharmacokinetic disposition of zidovudine during pregnancy. J. Infect. Dis. 1991; 163:
226- 232.

51
Figure 1.1
Chemical structures of AZT, AZDU and AZT-MP
AZDU AZT
AZT-MP
NH
N
O
OO
N3
HO
NH
N
O
OO
N3
HO
NH
N
O
OO
N3
O
P
O
HO
HO

52
Figure 1.2
Typical electropherograms representing: a) blank fetal tissue. b.) fetal tissue spiked with 25
µg/g AZDU (14.05 minutes), 40 µg/g AZT (15.08 minutes) and 40 µg/g AZT-MP (25.37
minutes).
a.
b.

53
Figure 1.3
Typical electropherograms representing: a) blank plasma. b.) plasma spiked with 25 µg/ml
AZDU (13.94), 40 µg/ml AZT (15 minutes) and 40 µg/ml AZT-MP (25.25 minutes).
a.
b.

54
Figure 1.4
Typical electropherograms representing: a) blank amniotic fluid. b.) amniotic fluid spiked with
25 µg/ml AZDU (14.84), 40 µg/ml AZT (16.04) and 40 µg/ml AZT-MP (24.72 minutes).
a.
b.

55
Figure 1.5
0
10
0 10 20 30
Time (minutes)C
on
cen
trat
ion
AZT-MPAZT
The change in the concentration of AZT and AZT-MP in placental tissue following addition of
acetonitrile to a sample spiked with 20 µg/g AZT-MP and originally containing no AZT

56
Table 1.1
Extraction efficiencies of the analytes in the biological matrices. Absolute extraction efficiencies of the AZT, AZT-MP and AZDU analytes from the three biological matrices (n=15). Concentrations are reported as µg/g for fetal tissues and µg/ml for plasma and amniotic fluid
Concentration Analyte Fetal tissue Plasma Amniotic fluid AZT 88.2 ± 5.3 89.3 ± 7.1 89.8 ± 4.9 90 AZT-MP 83.1 ± 7.5 79.8 ± 12.2 80.5 ± 9.3 AZT 89.7 ± 7.5 91.7 ± 9.0 90.0 ± 5.4 40 AZT-MP 85.1 ± 9.5 82.1 ± 10.1 83.3 ± 8.5 AZT 90.2 ± 4.7 88.9 ± 11.2 88.5 ± 8.8 3 AZD-MP 84.3 ± 7.7 78.0 ± 12.4 87.6 ± 7.1
25 AZDU 89.5 ± 5.9 91.9 ± 6.5 90.2 ± 7.3
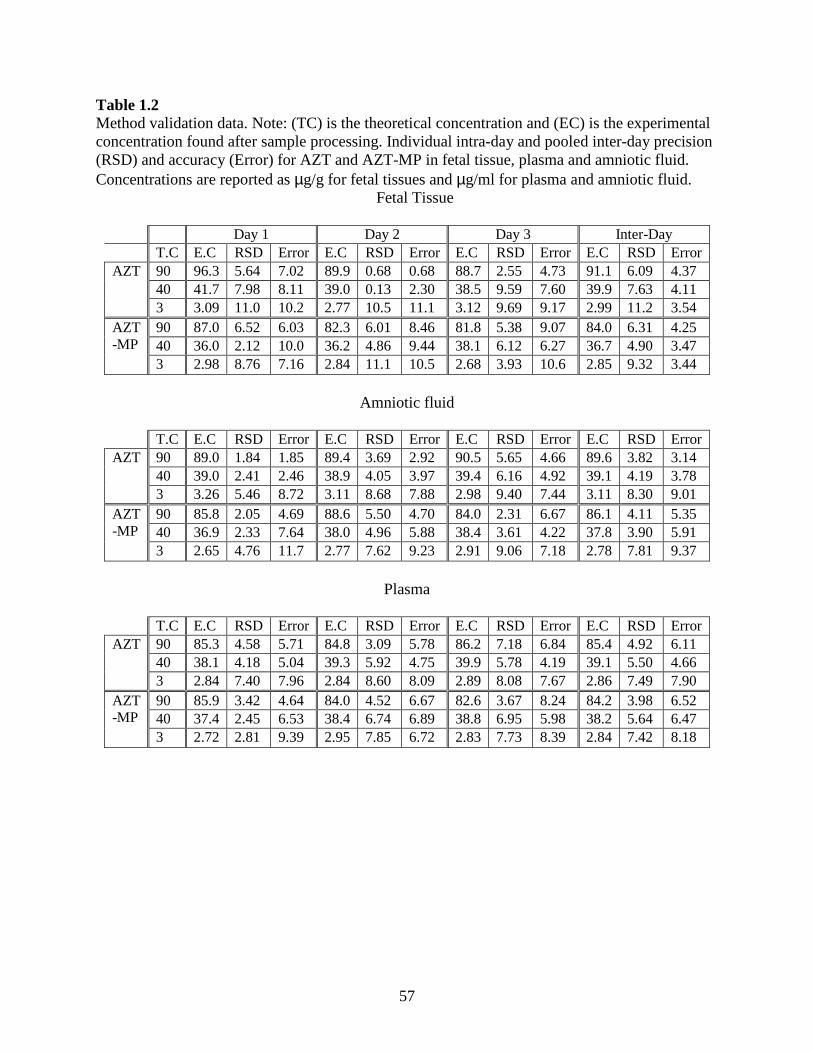
57
Table 1.2 Method validation data. Note: (TC) is the theoretical concentration and (EC) is the experimental concentration found after sample processing. Individual intra-day and pooled inter-day precision (RSD) and accuracy (Error) for AZT and AZT-MP in fetal tissue, plasma and amniotic fluid. Concentrations are reported as µg/g for fetal tissues and µg/ml for plasma and amniotic fluid.
Fetal Tissue
Day 1 Day 2 Day 3 Inter-Day T.C E.C RSD Error E.C RSD Error E.C RSD Error E.C RSD Error
90 96.3 5.64 7.02 89.9 0.68 0.68 88.7 2.55 4.73 91.1 6.09 4.37 40 41.7 7.98 8.11 39.0 0.13 2.30 38.5 9.59 7.60 39.9 7.63 4.11
AZT
3 3.09 11.0 10.2 2.77 10.5 11.1 3.12 9.69 9.17 2.99 11.2 3.54 90 87.0 6.52 6.03 82.3 6.01 8.46 81.8 5.38 9.07 84.0 6.31 4.25 40 36.0 2.12 10.0 36.2 4.86 9.44 38.1 6.12 6.27 36.7 4.90 3.47
AZT -MP
3 2.98 8.76 7.16 2.84 11.1 10.5 2.68 3.93 10.6 2.85 9.32 3.44
Amniotic fluid
T.C E.C RSD Error E.C RSD Error E.C RSD Error E.C RSD Error 90 89.0 1.84 1.85 89.4 3.69 2.92 90.5 5.65 4.66 89.6 3.82 3.14 40 39.0 2.41 2.46 38.9 4.05 3.97 39.4 6.16 4.92 39.1 4.19 3.78
AZT
3 3.26 5.46 8.72 3.11 8.68 7.88 2.98 9.40 7.44 3.11 8.30 9.01 90 85.8 2.05 4.69 88.6 5.50 4.70 84.0 2.31 6.67 86.1 4.11 5.35 40 36.9 2.33 7.64 38.0 4.96 5.88 38.4 3.61 4.22 37.8 3.90 5.91
AZT -MP
3 2.65 4.76 11.7 2.77 7.62 9.23 2.91 9.06 7.18 2.78 7.81 9.37
Plasma
T.C E.C RSD Error E.C RSD Error E.C RSD Error E.C RSD Error 90 85.3 4.58 5.71 84.8 3.09 5.78 86.2 7.18 6.84 85.4 4.92 6.11 40 38.1 4.18 5.04 39.3 5.92 4.75 39.9 5.78 4.19 39.1 5.50 4.66
AZT
3 2.84 7.40 7.96 2.84 8.60 8.09 2.89 8.08 7.67 2.86 7.49 7.90 90 85.9 3.42 4.64 84.0 4.52 6.67 82.6 3.67 8.24 84.2 3.98 6.52 40 37.4 2.45 6.53 38.4 6.74 6.89 38.8 6.95 5.98 38.2 5.64 6.47
AZT -MP
3 2.72 2.81 9.39 2.95 7.85 6.72 2.83 7.73 8.39 2.84 7.42 8.18

58
CHAPTER 2
DETERMINATION OF LAMIVUDINE IN PLASMA, AMNIOTIC FLUID, AND RAT
TISSUES BY HPLC1
1 Alnouti, Y., C.A. White and M.G. Bartlett. Journal of Chromatography B. 803(2): 279-284. Reprinted here with permission of publisher

59
Abstract
An HPLC method for the quantification of lamivudine (3TC) in rat plasma, amniotic fluid,
placental and fetal tissues has been developed, validated and applied to the study of the placental
transport of this drug in the pregnant rat. Placental and fetal tissues were processed using liquid-
liquid extraction enhanced by salting out the sample using a saturated solution of ammonium
sulfate. Plasma and amniotic fluid samples were processed by protein precipitation using 2 M
perchloric acid. Reverse phase chromatography was performed using a phenyl column (5 µm,
150 x 2 mm I.D) under a flow rate of 0.2 ml/min. The mobile phase consisted of 5% methanol in
20 mM dibasic phosphate buffer (pH 6). The method was validated over the range from 0.1- 50
µg/ml for plasma and amniotic fluid and 0.2- 50 µg/ml for the placental and fetal tissues.
1. Introduction
Viral infections are the cause of significant morbidity and mortality in modern society. Human
immunodeficiency virus (HIV), hepatitis B virus (HBV), herpes viruses (including herpes
simplex virus [HSV]), varicella zoster virus (VZV) and cytomegalovirus (CMV) are of special
socioeconomic importance because of their widespread prevalence in humans [1].
Lamivudine (3TC) is a synthetic dideoxynucleoside derivative that is active against HIV
and HBV [2]. In common with other dideoxynucleosides, lamivudine should be intracellularly
activated to its triphosphate derivative before it can inhibit the viral DNA polymerase enzyme
[3]. Treatment of HIV infections with an antiviral regimen that includes 3TC is desirable since
3TC shows lower toxicity than other nucleoside derivatives [4]. The US Department of Health
and Human Services current guidelines for the treatment of HIV infections strongly recommend
3TC in combination with other antiviral drugs [5].

60
Although much is known about the behavior of 3TC and other nucleoside antivirals in
infected individuals, very little is known about their effects on pregnant women and their fetuses.
Understanding the kinetics of these drugs in pregnant women and their transport profiles to the
fetal compartment is crucial toward providing better protection to the fetus from the mother’s
infection. Mother to child vertical transmission accounts for 90% of global viral infections in
children [6].
To investigate 3TC transport from the maternal to the fetal compartment, an appropriate
model is needed where the kinetic profile of drug transport across the placenta can be
extrapolated to humans. The pregnant rat model serves as an appropriate model to study drug
distribution between the maternal and the fetal compartments. Rat and human placentas show
anatomical resemblance because both placentas belong to the same hemochorial type and
therefore, are expected to show similarity in drug transport profiles [7, 8].
In order to build a kinetic profile with kinetic parameters that reliably describe the
transport profile of the drug across the placenta, an accurate, sensitive and rugged analytical
method is needed to analyze 3TC in the maternal plasma, amniotic fluid, placenta as well as the
fetal tissues. Several HPLC methods for the quantification of 3TC in plasma, urine, saliva and
cerebrospinal fluid are available in the literature [9- 13]. All these methods use solid phase
extraction techniques (SPE) with different cartridges for the extraction of 3TC out of the
biological matrices. These sample clean-up techniques were not readily adapted to fetal and
placental tissues. Fetal and placental tissues contain many more endogenous substances that
need to be removed to enable a chromatographic separation of the analyte from the matrix
components. Furthermore, SPE is generally an expensive and time-consuming process when
compared with liquid-liquid extraction or protein precipitation based techniques.

61
This paper validates an analytical method using HPLC-UV for the quantification of 3TC
in plasma, amniotic fluid, placental, and fetal matrices from the pregnant rat. This method
utilizes liquid-liquid extraction and protein precipitation techniques for the extraction of 3TC
from the 4 biological matrices. These extraction techniques provide faster and more convenient
sample preparation procedures than SPE.
2. Experimental
2.1. Chemicals and Reagents
Stavudine (d4T) was purchased from Sigma Chemical Co. (St. Louis, MO, USA). HPLC-grade
acetonitrile, methanol and sodium phosphate dibasic were obtained from Fisher Scientific (Fair
Lawn, NJ, USA). Ammonium sulfate was obtained from J.T Baker, Inc. (Philipsburg, NJ, USA).
Syringe filters (0.22 µm) were obtained from XPERTEK (St. Louis, MO, USA). Syringes (1 ml)
were purchased from Becton Dickinson Co. (Franklin Lakes, NJ, USA). BOND ELUT C2,
silica, cyano and phenyl cartridges were purchased from Varian (Harbor City, CA, USA). C8,
C18 and Oasis HLB cartridges were obtained from Waters Corporation (Milford, MA, USA).
2.2. Instrumentation
The chromatographic analyses were performed using an HPLC system consisting of Waters
(Milford, MA, USA) 510 pump, 717 autosampler and 486 UV detector operated with
Millennium 2010 data system.
A YMC phenyl column (5 µm, 150 x 2 mm I.D., Waters, Milford, MA, USA) equipped
with a Phenomenex C-18 guard column (Torrance, CA, USA) was used to achieve all the
chromatographic separations. The mobile phase consisted of 5% methanol in 20 mM dibasic
sodium phosphate (pH 6), pH was adjusted using phosphoric acid and NaOH concentrated
solutions. The flow rate was 0.2 ml/min and the detection wavelength was 256 nm. This low

62
flow rate would facilitate the transfer of this method to LC-MS, if it became necessary. The
injection volume of plasma and amniotic fluid samples was 20 µl, while the injection volume of
placental and fetal samples was 15 µl.
2.3. Preparation of standard solutions
One mg/ml stock solutions of 3TC and D4T were individually prepared in distilled water.
Lamivudine standard solutions with concentrations of 500, 400, 250, 100, 10, 7.5, 5, 2.5, 2 and 1
µg/ml were prepared from the 1mg/ml stock solution by serial dilution with distilled water. D4T
standard solution at the concentration 50 µg/ml was prepared by dilution from the stock solution
with distilled water.
2.4. Calibration curves
Blank plasma, amniotic fluid, placenta and fetal tissues were collected from untreated animals.
The placental and fetal tissues were homogenized with 2 volumes of distilled water (v/w).
Plasma, placental and fetal calibration points were prepared by spiking 100 µl of the biological
matrices with 10 µl of each lamivudine standard solution and 10 µl of the 50 µg/ml D4T
solution. Amniotic fluid calibration points were prepared by spiking 50 µl of the biological
matrices with 5 µl of each lamivudine standard solution and 5 µl of the 50 µg/ml D4T standard
solution.
The calibration curves of placental and fetal homogenates were in the range of 0.2-50
µg/ml with individual calibration points of 50, 25, 10, 1, 0.75, 0.25 and 0.2 µg/ml. The
calibration curves of the amniotic fluid and plasma were in the range of 0.1-50 µg/ml with
individual calibration points of 50, 25, 10, 1, 0.75, 0.25 and 0.1 µg/ml. The internal standard
concentration was 5 µg/ml for all samples.

63
2.5. Precision and Accuracy
This method was validated using 4 QC points for each calibration curve. Five replicates of each
QC point were analyzed each day to determine the intra-day accuracy and precision. This
process was repeated 3 times in 3 days to determine the inter-day accuracy and precision. The
QC points for plasma and amniotic fluid were 0.1, 0.5, 5 and 40 µg/ml while for the fetal and
placental homogenates the QC points were 0.2, 0.5, 5 and 40 µg/ml.
2.6. Sample Preparation
Solid phase extraction (SPE) using different cartridges was investigated for samples clean up.
The cartridges included C18, C8, silica, phenyl, cyano and Oasis mixed bed cartridges. Each
cartridge was first conditioned with 1 ml of methanol and 1 ml of distilled water followed by
loading a 100 µl sample. The cartridge was then washed with 1 ml of water and finally the
analytes were eluted with 1 ml of methanol. The eluent was then dried under vacuum and
reconstituted in 100 µl of distilled water.
Protein precipitation was another approach attempted to extract the analytes. Acid
precipitation with 2 M perchloric acid was tried. 15 µl of the acid was added to 100 µl of the
sample. Samples were then vortexed and centrifuged at 13000 rpm for 10 minutes. The
supernatant was aspirated and neutralized with 2 M NH4OH. Finally, the samples were filtered
through 0.2 micron nylon filters.
Protein precipitation using acetonitrile was also investigated. In this procedure, 400 µl of
cold acetonitrile was added to 100 µl samples, centrifuged at 13000rpm for 10 minutes and the
supernatant dried under vacuum. The samples were then reconstituted in 100 µl of distilled
water.

64
Finally, 3TC and D4T extraction from the different biological matrices were attempted
exploiting the salting out effect. 180 µl of saturated ammonium sulfate solution and 360 µl of
cold acetonitrile were added to 100 µl samples, vortexed and centrifuged at 13000 rpm for 10
minutes. The upper organic layer was aspirated and dried under vacuum. Samples were then
reconstituted in 100 µl of distilled water.
2.7. Sample Collection
The use of animals was approved by the UGA Animal Use and Care Committee. A pregnant
female Sprague-Dawley rat (Harlan, Indianapolis, IN, USA) weighting 330 g was anesthetized
with ketamine:acepromazine:xylazine (50:3.3:3.4 mg/kg IM) and dosed with 25 mg/kg of
lamivudine administered as an IV bolus on day 19th of gestation. For blood sampling a cannula
was placed in the right jugular vein. For sampling of the amniotic fluid, placenta and fetus, a
laparotamy was performed. Blood samples were collected at 5, 15, 30, 45, 60, 90, 120 and 180
minutes into heparinized tubes. Samples were then centrifuged at 5000 rpm for 10 minutes to
collect plasma. Amniotic fluid, fetuses and placentas were collected at the same time points as
plasma. Fetal and placental tissues were homogenized in 2 volumes of distilled water. Samples
from all the matrices were spiked with the internal standard (D4T) solution to yield a
concentration 5 µg/ml.
3. Results and Discussion
3.1. Development of HPLC assay
Structures of 3TC and D4T are shown in Figure 1.2. Lamivudine is a hydrophilic weak base
with a pKa = 4.3 [14]. To increase the retention time of such a base in reverse phase
chromatography and therefore separate it from the polar early eluting endogenous peaks, the
analyte should be in the unionized form. Therefore, the pH of the mobile phase was an

65
important factor in the successful separation of 3TC from endogenous peaks. At pH 3, 3TC was
in the ionized form, and eluted at 7 minutes. At pH 6, 3TC was in the unionized form, and eluted
at 13 minutes. pH was adjusted using concentrated phosphoric acid or NaOH solutions.
The organic content of the mobile phase was also investigated to optimize the separation
of 3TC from the endogenous peaks. Early on, acetonitrile was excluded as an organic modifier
because of its high eluotropic strength, which led to fast elution of 3TC and poor resolution from
endogenous peaks. Methanol was a better choice due to its weaker strength. The addition of 5%
methanol as the organic modifier achieved satisfactory resolution of 3TC and D4T from
endogenous peaks in all the biological matrices. Representative chromatograms of 3TC and D4T
in the 4 biological matrices are shown in Figure 2.2. The within day variation in the elution time
of 3TC and D4T was less than 3.5%.
3.2. Extraction Procedure
Several liquid and solid phase extraction procedures were investigated to extract 3TC and the
internal standard from the different biological matrices. Despite the availability of several
extraction techniques for 3TC, we were not able to adapt these for our application. The literature
techniques mainly focussed on the extraction of 3TC from human or animal plasma. In our case,
however, we had to deal with fetal and placental tissues, which carry a wider variety of
endogenous substances. Therefore, sample clean up played a critical role in generating
chromatograms with no peaks from endogenous substances overlapping with the peaks of
interest.
For fetal and placental homogenates, a salting out technique using saturated ammonium
sulfate solution and acetonitrile provided the best extraction technique. The resulting
chromatograms showed base line resolution of 3TC and D4T from all endogenous peaks. The

66
percentage of acetonitrile relative to the amount of saturated ammonium solution was
investigated. Increasing the percentage of acetonitrile relative to the ammonium sulfate
increased the extraction efficiency of 3TC, but also yielded more endogenous peaks in the
chromatogram. At high percentages of acetonitrile endogenous peaks were observed to overlap
with the 3TC peak. 180 µl of saturated ammonium sulfate solution and 400 µl of acetonitrile
resulted in the optimum extraction efficiency of the analytes and yet showed no unwanted
endogenous peaks.
For plasma and amniotic fluid, acid precipitation using 15 µl of 2 M perchloric acid
achieved satisfactory separation of the analytes from the biological content. From our
experience, the high acidity of the injected sample can significantly shorten the lifetime of the
analytical column, in spite of the small injection volume. Therefore, the samples were
neutralized with 2M NH4OH of equal volume prior to their injection. Figure 3.2 shows
representative chromatograms of plasma, amniotic fluid, placenta and fetus blank matrices.
The recoveries of 3TC and D4T from the 4 biological matrices are shown in Table1.2.
The absolute recoveries were calculated by comparing the peak areas of spiked plasma, amniotic
fluid, fetal and placental homogenate samples to the corresponding peak areas of the untreated
stock solutions. Absolute recoveries of 3TC and D4T (n= 15) in plasma and amniotic fluid
ranged from 72%-79%, while the range was from 61%-71% in fetal and placental tissues.
3.3. Accuracy and Precision
Assay precision and accuracy were calculated for each matrix over 3 days. Precision, as
expressed by %RSD, and accuracy as expressed by % error for 3TC and D4T in the 4 biological
matrices are shown in Table 2.2. Intra-day (n=5) precision and accuracy were calculated from
the measurement of 5 samples at each QC point on 3 separate days. Inter-day (n=15) precision

67
and accuracy were calculated from pooled data over 3 days. Four QC points of concentrations
40, 5, 0.5 µg/ml and the lowest concentration in the calibration curve (0.1 µg/ml for plasma and
amniotic fluid, 0.2 µg/ml for fetus and placenta) were used for these calculations. Intra-day
precision (% RSD) and accuracy (% error) of 3TC ranged from 0.82-14.7 % and 0.99- 16.9 %,
respectively. Inter-day precision and accuracy of 3TC ranged from 1.36- 12.1 % and 3.51- 12.6
%, respectively. Results are shown in Table 2.
The calibration curves showed acceptable linearity (R2 ~ 0.99) over the range 0.1-50
µg/ml for plasma and amniotic fluid and 0.2-50 µg/ml for placental and fetal homogenates.
3.4. Animal Study
To demonstrate the application of this method in animal studies, a female rat received an IV
bolus dose (25 mg/kg) of 3TC. This dose was chosen because of its comparability to human
dosing and to allow comparison to previous animal studies involving antiviral agents in the
pregnant rat [15-21]. Plasma, amniotic fluid, placental and fetal tissues were processed and
analyzed as mentioned. Figure 4.2 shows the concentration versus time profile for 3TC in all
matrices. Noncompartmental analysis was used to obtain pharmacokinetic parameters using
WinNonlin (Pharsight, Mountain View, CA, USA). The half-life, volume of distribution at
steady state, and clearance were 88.5 min, 1.4 L/kg, and 1 L/hr/kg, respectively. This data is
consistent with earlier reported pharmacokinetic data on 3TC [15].
Conclusion
A simple method was developed and validated for the quantification of lamivudine (3TC) in rat
plasma, amniotic fluid, placental, and fetal tissues. Samples were processed by acid protein
precipitation and salting out techniques as opposed to traditional solid phase extraction. The
liquid-liquid extraction method used here is much less expensive, faster, and more convenient.
68
This method is suitable for pharmacokinetic studies to investigate the 3TC distribution profile
between the maternal and fetal compartments in rats.
References
[1] Balzarini, J.; Naesens, L.; De Clercq, E. Curr. Opin. Microbiol. 1 (1998) 535.
[2] Lai, C.L.; Chien, R.N.; Guan, R.; Tai, D.I.; Gray, D.F.; Stephenson, S.L.; Dent, J.C. New
Engl. J. Med. 339 (1998) 61.
[3] Cammack, N.; Rouse, P.; Marr, C. Biochem Pharmacol. 43 (1992) 2059.
[4] Leeuwen, R.V.; Lange, J.M.; Hussey, E.K.; Donn, K.H.; Hall, S.T.; Danner, S.A. AIDS 6
(1992) 471.
[5] Guidelines for the Use of Antiretroviral Agents in HIV- Infected Adults and Adolescents, US
Department of Health and Human Services, January 2000.
[6] Joint United Nations Programme on HIV/AIDS, Prevention of HIV Transmission from
Mother to Child: Strategic Options, UNAIDS, Geneva, 1999,
(http://www.unaids.org/publications/documents/mtct/start0599.html).
[7] Faber, J.J.; Thornburg, K.L, Structure and function of fetomaternal exchange, Raven, New
York, 1983, p. 1.
[8] Boike, G.M.; Deppe, G.; Young, J.D.; Gove, N.L.; Bottoms, S.F.; Malone, J.M.; Sokol, R.J.
Gynecol. Oncol. 34 (1989) 187.
[9] Zheng, J.J.; Wu, S.T.; Emm, T.A. J. Chromatogr. B. 761 (2001) 195.
[10] Hsyu, P.H.; Lloyd, T.L. J. Chromatogr. B. 655 (1994) 253.
[11] Hoetelmans, R.M.; Profijt, M.; Meenhorst, P.L.; Mulder, J.W.; Beijnen, J.H. J. Chromatogr.
B. 713 (1998) 387.
[12] Zhou, X.J.; Sommadossi, J.P. J. Chromatogr. B. 691 (1997) 417.

69
[13] Harker, A.J.; Evans, G.L.; Hawley, A.E.; Morris, D.M. J. Chromatogr. B. 657 (1994) 227.
[14] Fridland, A.; Connelly, M.C.; Robbins, B.L. Antiviral Therapy. 5 (2000) 181.
[15] Rajagopalan, P; Boudinot, F.D.; Chu, C.K.; Tennant, B.C.; Baldwin, B.H.; Schinazi, R.F.
Antimicrob. Agents Chemother. 40 (1996) 642.
[16] Srinivasan, K.; Wang, P.P.; Eley, A.T.; White, C.A.; Bartlett, M.G. J. Chromatogr. B. 745
(2000) 287.
[17] Clark, T.N.; White, C.A.; Chu, C.K.; Bartlett, M.G. J. Chromatogr. B. 755 (2001) 165.
[18] Brown, S.D.; White, C.A.; Chu, C.K.; Bartlett, M.G. J. Chromatogr. B. 772 (2002) 327.
[19] Brown, S.D.; White, C.A.; Bartlett, M.G. Rapid Commun. Mass Spectrom. 16 (2002) 1871.
[20] Brown, S.D.; White, C.A.; Bartlett, M.G. J. Liq. Chromatogr. 25 (2002) 2857.
[21] Brown, S.D.; Bartlett, M.G.; White, C.A. Antimicrob. Agents Chemother. 47 (2003) 991.

70
Table 2.1
Absolute recoveries of 3TC and D4T from plasma, amniotic fluid, placenta and fetus (n = 15)
Analyte Concentration Plasma Amniotic
Fluid Placenta Fetus
40 76 ± 2.1 78 ± 4.1 61 ± 4.1 69 ± 2.1 5 73 ± 3.2 79 ± 3.6 62 ± 3.7 68 ± 4.4 0.5 72 ± 1.9 76 ± 2.4 63 ± 3.3 71 ± 4.9 0.2 - - 64 ± 2.8 68 ± 2.4
3TC
0.1 74 ± 3.3 76 ± 1.6 - - D4T 5 74 ± 1.5 75 ± 2.1 70 ± 3.5 67 ± 2.9

71
Table 2.2 Intra-day (n =5) and inter-day (n =15) precision (%RSD) and accuracy (% error) measured for 4 QC points for 3TC in plasma, amniotic fluid, placental and fetal tissues. Note: T.C stands for theoretical concentration and E.C stands for the experimental concentration
Plasma Day 1 Day 2 Day 3 Inter-Day T.C E.C RSD Error E.C RSD Error E.C RSD Error E.C RSD Error 40 43.2 8.71 7.51 44.2 6.13 6.25 44.2 8.67 9.37 43.9 6.96 7.71 5 5.17 2.16 0.99 5.26 3.54 3.61 5.14 2.17 7.34 5.19 2.28 3.98 0.5 0.54 9.43 7.53 0.47 9.30 8.91 0.49 12.6 9.36 0.50 10.2 8.60 0.1 0.11 10.9 9.41 0.12 14.7 16.9 0.09 11.4 7.40 0.11 12.1 11.3
Amniotic Fluid 40 42.1 6.71 6.51 39.2 7.54 5.43 37.4 8.12 8.11 39.6 7.14 6.68 5 4.75 3.64 5.12 4.73 2.63 8.65 5.26 1.13 3.16 4.91 1.98 5.64 0.5 0.48 0.91 9.44 0.46 8.97 9.53 0.45 9.42 12.4 0.46 9.16 10.5 0.1 0.10 13.4 12.9 0.09 7.86 10.3 0.11 12.14 14.0 0.10 8.89 12.4
Placenta 40 45.6 9.40 6.71 45.2 9.31 9.36 39.6 6.37 7.77 43.5 7.11 7.95 5 4.86 0.82 2.46 4.93 4.65 3.65 5.21 1.56 4.41 5.0 1.36 3.51 0.5 0.51 6.50 7.85 0.54 7.31 6.43 0.53 9.87 13.7 0.53 7.02 9.34 0.2 0.23 9.40 13.34 0.21 13.1 9.87 0.23 12.1 14.6 0.23 11.9 12.6
Fetus 40 42.1 4.54 5.36 45.1 10.4 8.14 38.4 6.43 4.49 41.9 6.14 6.00 5 5.46 6.13 4.88 5.51 2.17 3.76 5.32 6.55 5.21 5.43 3.65 4.62 0.5 0.55 8.30 9.33 0.53 6.51 8.76 0.48 9.35 11.2 0.52 7.55 9.76 0.2 0.19 7.50 12.16 0.17 14.4 8.47 0.21 7.51 9.52 0.19 9.43 10.1

72
Figure 2.1
Chemical structures of lamivudine and stavudine.
D4T 3TC
NH
N
O
NH2
S
O
OH
NH
N
O
OO
HO

73
Figure 2.2
Representative chromatograms of 3TC (peaks labeled ‘1’ ) and D4T (peaks labeled ‘2’ ) in (a) plasma, (b) placenta, (c) amniotic fluid and (d) fetus. The concentration of 3TC and D4T is 5 µg/ml in all the chromatograms.
a.
2 1
b.
2 1
c.
1
2
d.
1 2

74
Figure 2.3 Representative chromatograms of blank matrices (a) plasma, (b) placenta, (c) amniotic fluid and (d) fetus.
a. b
cd.

75
Figure 2.4
Concentration-time profile of 3TC in plasma, amniotic fluid, placental and fetal homogenates.
0.1
1
10
100
0 50 100 150 200
minutes
fetus
plasma
placenta
amniotic fluid

76
CHAPTER 3
SIMULTANEOUS DETERMINATION OF ZIDOVUDINE AND LAMIVUDINE FROM
RAT PLASMA, AMNIOTIC FLUID, AND TISSUES BY HPLC1
1 Alnouti, Y., C.A. White and M.G. Bartlett. Submitted to Biomedical Chromatography.

77
Abstract
A sensitive HPLC method has been developed and validated for the simultaneous quantification
of Zidovudine (AZT) and Lamivudine (3TC) in rat plasma, amniotic fluid, placental and fetal
tissues. Samples were processed by solid phase extraction using C2 cartridges. Chromatography
was performed using a phenyl column (5 µm, 150 x 2 mm I.D) under a flow rate of 0.2 ml/min.
The mobile phase consisted of 8% acetonitrile in 5 mM 1-heptane sulfonic acid dissolved in 30
mM ammonium formate buffer (pH 3.3). The method was validated in the range of 0.25- 50
µg/ml for both 3TC and AZT in the 4 biological matrices. Finally, the method was applied to a
study involving fetal transport of co-administration of these compounds in a pregnant rat.
KEY WORDS
Zidovudine, Lamivudine, Ion-pairing Chromatography, Validation, Bioanalytical.
INTRODUCTION
Multi drug therapy has become the standard treatment for acquired immunodeficiency syndrome
(AIDS) (Clercq et al., 2002). This situation is imposed by the need to delay the development of
resistance by the human immunodeficiency virus (HIV), the causative virus of AIDS, to single
anti HIV drugs and to minimize potential dose dependent side effects (Beach et al., 1998). The
current typical regimen for treating HIV infection is to use a combination of at least 3 drugs, a
practice known as “highly active antiretroviral therapy” (HAART) (Gallant et al., 2002).
All anti HIV drugs can be classified into 3 categories: (i) Nucleoside reverse transcriptase
inhibitors (NRTIs) that include: zidovudine, lamivudine, didanosine, zalcitabine, abacavir, and
stavudine. The active triphosphate metabolites of NRTIs act as a chain terminators at the
substrate-binding site of the viral enzyme reverse transcriptase. (ii) Non-nucleoside reverse
transcriptase inhibitors (NNRTIs) that includes nevirapine, delavirdine and efavirenz. NNRTIs

78
interact with the viral reverse transciptase enzyme at a non-substrate binding site. (iii) Protease
inhibitors (PIs) that include saquinavir, ritonavir, indinavir, nelfinavir, amprenavir and lopinavir.
PIs inhibit the HIV enzyme protease, which causes the production of immature viruses incapable
of spreading to new uninfected cells (Beach et al., 1998). Most of the HAART regimens include
at least 2 NRTIs, such as AZT and 3TC, in combination with another NNRTI, such as
nevirapine, or a PI, such as indinavir (Gallant et al., 2002). The use of AZT and 3TC together
has become so common that these two compounds are now formulated in the same tablet and
sold under the trade name CombivirTM.
The use of HAART has increased survival and improved quality of life for AIDS patients
(Gallant et al., 2002). This positive outcome results from extensive understanding of the
pharmacological, toxicological and pharmacokinetic profiles of all individual anti-HIV agents in
HIV infected individuals. Unfortunately, less is known about the behavior of these drugs in
pregnant women infected with HIV. Pregnant women are a group of special interest among
AIDS patients because of vertical transmission of HIV to fetuses. Vertical transmission can take
place before labor, during labor, or by breast-feeding after delivery [4]. Worldwide vertical
transmission of HIV is reaching epidemic proportions with over 600,000 infected infants being
born every year (Mofenson et al., 2000).
In pregnant women, the ultimate goal of therapy is to decrease the viral load and suppress
viral replication in the fetal compartment as well as the maternal compartment. A better
understanding of the kinetics of drug transport across the placenta would help in achieving this
goal. The acquisition of this data has become more important with the recent report of
significant drug-drug interactions in the placenta transport of the antiviral nucleosides acyclovir
and zidovudine (Brown et al., 2003). Therefore, more understanding of the consequences of

79
drug-drug interactions between the individual agents in HAART on the transport of these drugs
across the placenta would aid in achieving therapeutic levels in the fetal compartment.
To investigate the kinetic profiles of 3TC and AZT transport across the placenta, an
appropriate animal model is needed where the results can be successfully extrapolated to
humans. Pregnant rats are an appropriate model because of the anatomical resemblance between
the rat and human placenta and because both placentas belong to the same hemochorial type
(Faber et al., 1983, Knipp et al., 1999).
In order to develop a kinetic profile with reliable parameters that accurately describe the
kinetics of drug transport across the placenta, a reliable, accurate, sensitive and rugged analytical
method is needed to analyze 3TC and AZT in the plasma, amniotic fluid, placenta as well as the
fetal tissues of the rat. Several HPLC-UV and LC-MS methods are available in the literature for
the simultaneous quantification of AZT and 3TC in human plasma (Kenney et al., 2000, Pereira
et al., 2000). All these methods utilize solid phase extraction (SPE) using different cartridges for
the extraction of 3TC and AZT from the biological matrix. Extraction methods that are
optimized for less complex matrices, such as plasma or urine are frequently not robust enough
for direct transfer to tissues.
This paper reports an efficient and reproducible HPLC method using ultraviolet
detection. This method has been validated for quantifying AZT and 3TC from maternal plasma,
amniotic fluid, fetal and placental tissues collected during a maternal-fetal drug transfer study.
The assay reported here is the first to report quantitation of these commonly co-administered
compounds from such complex tissue matrices. This method requires small plasma and amniotic
fluid volumes in order to maximize the number of pharmacokinetic time points that can be
collected during the animal experiment. This study utilized the pregnant rat model where all

80
samples of the four biological matrices were collected at various time-points to get a complete
profile of the drug distribution across the placenta.
EXPERIMENTAL
Chemicals and Reagents
Albuterol (internal standard) and 1-heptane sulfonic acid were purchased from Sigma (St. Louis,
MO, USA). HPLC-grade acetonitrile and methanol were obtained from Fisher Scientific (Fair
Lawn, NJ, USA). Ammonium formate was obtained from Aldrich (Milwaukee, WI, USA).
Syringe filters (0.22 µm) were purchased from XPERTEK (St.Louis, MO, USA). Syringes (1
ml) were obtained from Becton Dickinson Co. (Franklin Lakes, NJ, USA). BOND ELUT-C2,
silica, cyano and phenyl cartridges were purchased from Varian (Harbor City, CA, USA). C8,
C18 and Oasis HLB cartridges were obtained from Waters (Milford, MA, USA).
Instrumentation
All chromatographic analysis were performed using a HP 1090 series II HPLC system (Agilent,
Wilmington, DE, USA) with an external Gilson Model 117 UV detector (Middleton, WI, USA).
All data were analyzed using Turbochrom 4.21 software (PerkinElmer, Torrance, CA, USA). A
YMC phenyl column (5 µm, 150 x 2 mm I.D., Waters, Milford, MA, USA) equipped with a
Phenomenex C-18 guard column (Torrance, CA, USA) was used to perform all chromatographic
separations.
The mobile phase consisted of 8% acetonitrile in 5 mM 1-heptane sulfonic acid dissolved
in 30 mM ammonium formate buffer (pH 3.3). The flow rate was 0.2 ml/min and the detection
wavelength was 254 nm. The injection volume was 15 µl.

81
Preparation of Standard Solutions
One mg/ml stock solutions of AZT and 3TC were individually prepared in distilled water.
Standard solutions of AZT and 3TC were prepared by mixing and diluting the appropriate
amounts from the individual stock solutions. The final concentrations of the standard solutions
were 500, 400, 250, 100, 10, 7.5, 5, 2.5 and 2 µg/ml. Two albuterol stock solutions of
concentrations 1 and 3 mg/ml were prepared in distilled water.
Calibration Curves
Blank plasma, amniotic fluid, placental and fetal tissues were harvested from untreated animals.
The placental and fetal tissues were homogenized with 2 volumes of distilled water (v/w).
Plasma, placenta and fetus calibration points were prepared by spiking 100 µl of the biological
matrices with 10 µl of each 3TC-AZT and albuterol standard solutions. Amniotic fluid
calibration points were prepared by spiking 50 µl of the biological matrix with 5 µl of each 3TC-
AZT and albuterol standard solutions.
Two different internal standard (albuterol) solutions were used to prepare the calibration
curves of the 4 matrices. An internal standard stock solution with a concentration of 1000 µg/ml
was used for the plasma and amniotic fluid matrices. For the fetal and placental homogenates, an
internal standard stock solution of 3000 µg/ml was used.
The calibration curves of all the 4 matrices were in the range of 0.2-50 µg/ml with
individual calibration points of 50, 25, 10, 1, 0.75 and 0.2 µg/ml. The internal standard
concentration was 100 µg/ml in plasma and amniotic fluid, while it was 300 µg/ml for the fetal
and placental tissue homogenates.

82
Precision and Accuracy
This method was validated using 4 QC points for each calibration curve. Five replicates of each
QC point were analyzed every day to determine the intra-day accuracy and precision. This
process was repeated 3 times over 3 days in order to determine the inter-day accuracy and
precision. The concentrations of the QC points for all the 4 matrices were 0.25, 0.5, 5 and 40
µg/ml.
Sample Preparation
Several liquid-liquid and solid phase extraction techniques were investigated for sample clean
up. Solid phase extraction (SPE) using C18, C8, C2, silica, cyano, phenyl, amino and Oasis
HLB cartridges were investigated. The SPE procedure includes conditioning the samples with 1
ml of methanol followed by 1 ml of water. The spiked samples were then loaded onto the
conditioned cartridges and washed with 75 µl of distilled water. The analytes were eluted with 1
ml of methanol and evaporated under vacuum. Finally, samples were reconstituted in 100 µl of
distilled water.
Protein precipitation using perchloric acid or acetonitrile was also investigated. Twenty
µl of 2 M perchloric acid or 400 µl of acetonitrile was added to 100 µl of the spiked samples.
Samples were vortexed and centrifuged at 13000 for 10 minutes. The supernatant was aspirated
and evaporated under vacuum. Samples were then reconstituted in 100 µl of distilled water.
Finally, 3TC, AZT and albuterol extraction from the different matrices was attempted by
the addition of a high concentration of salt. In these experiments, 200 µl of saturated ammonium
sulfate and 400 µl of cold acetonitrile were added to the spiked samples. Samples were vortexed
and centrifuged at 13000 rpm for 10 minutes. The upper organic layer was aspirated and dried
under vacuum. Samples were then reconstituted in 100 µl of distilled water.

83
Animal Experiment
The use of animals in this study was approved by the University of Georgia Animal Use and
Care Committee. The rats were housed one animal per cage in the University of Georgia
College of Pharmacy animal facility (AALAC accredited). The environment was controlled (20
– 22 °C, 14 hr of light per day) with daily feedings of standard chow pellets and water ad
libitum.
A timed pregnant Sprauge-Dawley rat (Harlan, Indianapolis, IN, USA) weighing 335 g
was anesthetized intramuscularly with ketamine:acepromazine:xylazine (50:3.3:3.4 mg/kg) and
dosed on day 19 of gestation. During anesthesia, the animal was given atropine (0.5 mg/kg)
subcutaneously. For dosing and blood sampling purposes, a cannula was surgically implanted in
the right jugular vein. For sampling of the pups (amniotic fluid, placenta, and fetal tissues), a
laparotamy was performed. The rats were administered an i.v. bolus dose of AZT (25 mg/kg)
and 3TC (25 mg/kg) dissolved in 0.1 N NaOH in physiological saline (pH 7.4) via the jugular
cannula. Blood samples were collected at 5, 15, 30, 45, 60, 90, 120, 180, 240, 300, 360 min
after-dosing into heparinized tubes and centrifuged at 10,000 rpm for 10 min to enable plasma
collection. Amniotic fluid, placenta, and fetus samples were collected at 5, 10, 15, 30, 45, 60,
90, 120, 180, 240, 300, 360 min. Placental and fetal tissue samples were homogenized in two
volumes of deionized water. All samples were stored at –20 °C until analysis.
RESULTS AND DISCUSSION
Development of HPLC assay
Structures of 3TC, AZT and albuterol are shown in Figure 1.3. 3TC is a hydrophilic weak base
with a pKa = 4.3 while AZT (pKa = 9.7) is much more lypophilic than 3TC (Fridland et al.,
2000). Under reverse phase chromatographic conditions, using a phosphate buffer mobile phase,

84
very little methanol was needed to separate 3TC from the polar endogenous compounds in the
different biological matrices. Using a low percentage of methanol, AZT eluted at 40 minutes
while 3TC eluted at 13 minutes.
To force AZT to elute earlier, a gradient method increasing the methanol percentage in
the mobile phase over time was employed. Combinations of continuous and step gradient
techniques were attempted, however the base line drift was too significant for effective
quantification. This base line drift made it hard to reproducibly integrate the base line for the
AZT peak causing the method to fail several validation days.
Therefore, an alternative method using ion-pairing chromatography was considered. 3TC
is a weak base and carries a negative charge at acidic pHs, while AZT is hydrophobic enough to
be retained in the column for a longer period of time. Therefore, we used a lower concentration
of an anionic ion-pairing reagent under acidic conditions. The ionic interaction between the
negatively charged ion pair and the positively charge 3TC will increase the retention of 3TC. At
the same time, the negative charge on the ion pair will decrease the hydrophobic interaction
between AZT and the phenyl column and therefore decreases the retention of AZT.
Pentane, heptane and octane sulfonic acids were investigated to serve as ion pairing
reagents. The retention time of 3TC increased by increasing the length of the hydrocarbon chain
or the concentration of the ion pair reagent. The retention time of AZT decreased from 40 to 15
minutes after the addition of any of these anionic ion pairing agents. Neither the hydrocarbon
chain length nor the concentration of the ion pairing reagent made a significant difference on the
AZT retention time. This behavior suggests that the retention of 3TC was due to electrostatic
interaction with the ion pair while the retention of AZT was primarily due to hydrophobic
interaction with the phenyl column. This hydrophobic interaction was decreased in the presence

85
of the ion pairing agent and resulted in a greater than 60% decrease of the retention time from
that observed in the absence of the ion pair agent. Five mM of heptane sulfonic acid provided
the condition to achieve base line resolution between the analytes and the endogenous peaks.
Representative chromatograms of 3TC, AZT and albuterol in the 4 biological matrices are shown
in Figure 2.3. 3TC, AZT and albuterol eluted in 9, 15 and 17 minutes, respectively.
The pH of the mobile phase was a critical factor to achieve a successful chromatographic
separation. In order to retain 3TC, the pH should be lower than the pKa (4.7) of 3TC.
Increasing the pH gradually from 3 to 7 decreased the retention time of 3TC. Interestingly, pH
also had a great effect on the retention time of an endogenous peak, marked D in the
chromatograms. AZT and this endogenous peak formed the critical pair of peaks for the
separation. A pH of 3.3 was found to achieve baseline resolution between all the compounds of
interest in the chromatogram.
Methanol and acetonitrile were investigated for use as organic modifiers. Acetonitrile
produced better peak shapes than methanol. This may be due to higher rates of mass transfer of
the analytes between the mobile and the stationary phases, which results from the higher strength
of acetonitrile as an organic solvent. Using 8% acetonitrile produced base line resolution of all
analytes of interest.
The main concern in the search for an internal standard was to find a compound to elute
within 20 minutes without co eluting with any of the analytes or the endogenous compounds
under our chromatographic conditions. Albuterol was found to elute in 17 minutes and was
therefore chosen as an internal standard.

86
Extraction Procedures
None of the liquid-liquid extraction or protein precipitation techniques produced samples clean
enough to work out chromatographic separation between the analytes and the peaks resulting
from the endogenous compounds in the different biological matrices. Therefore, solid phase
extraction was the remaining choice for our method.
Among the SPE cartridges investigated, C2 cartridges produced the cleanest samples with
chromatograms that contained very few endogenous peaks. The amount of water used to wash
the cartridges after loading the sample as well as the amount of methanol used to elute the
analytes was investigated to optimize the extraction efficiency of the analytes. A wash step
using 0.75 ml of water was enough to remove all the undesirable endogenous compounds and
produce a reasonable recovery of the analytes. One milliliter of methanol eluted the analytes
with the highest recovery. Further increases in the methanol amount did not result in higher
recovery of the analytes.
The recoveries of 3TC, AZT and albuterol from the 4 biological matrices are shown in
Table 1. The absolute recoveries were calculated by comparing the peak areas of spiked plasma,
amniotic fluid, fetal and placental homogenate samples to the corresponding peak areas of the
untreated standard solutions (n= 15). 3TC recoveries ranged from 60-78 % while AZT
recoveries ranged from 77- 90 % in the different biological matrices. The internal standard
recovery was lower and ranged from 12-40 %.
Accuracy and Precision
Assay precision and accuracy were calculated for each matrix over 3 days. Precision, as
expressed by %RSD, and accuracy as expressed by % error for 3TC and AZT in the 4 biological
matrices are shown in Table 2.3. Intra-day (n=5) precision and accuracy were calculated from

87
the measurement of 5 samples at each QC point on 3 separate days. Inter-day (n=15) precision
and accuracy were calculated from the pooled data from the 3 days. Four QC points of
concentrations 40, 5, 0.5 µg/ml and the lowest concentration in the calibration curve (0.25
µg/ml) were selected to validate the method. Intra-day precision (% RSD) and accuracy (%
error) for 3TC ranged from 0.6- 13.5 % and 0.9- 14.1 %, respectively; while for AZT it ranged
from 0.7- 12.9 % and 1.4- 12.3 %, respectively. Inter-day precision and accuracy for 3TC
ranged from 1.23- 10.8 % and 1.87- 11.7 %, respectively; while for AZT it ranged from 1.0- 10.2
% and 1.7- 10.3 %, respectively. The calibration curves showed acceptable linearity (R2 > 0.99)
over the range 0.25-50 µg/ml for plasma, amniotic fluid, placental and fetal homogenates.
Animal Study
To demonstrate the application of this method in animal studies, a female rat was dosed with a
combination of 3TC and AZT IV bolus (25 mg/kg for each compound). Plasma, amniotic fluid,
placental and fetal tissues were processed and analyzed as mentioned. Figure 3.3 shows the
concentration-time profile of 3TC and AZT in all matrices. The plasma data was analyzed using
WinNonlin (Pharsight, Mountain View, CA, USA). For 3TC, half life, volume of distribution at
steady state, area under the curve (AUC) and clearance were calculated to be 89 min, 1160
ml/kg, 2490 min*mg/L and 10 ml/min/kg, respectively. For AZT, half-life, volume of
distribution at steady state, the AUC and clearance were calculated to be 51 min, 650 ml/kg,
2620 min*mg/L, and 9.5 ml/min/kg, respectively.
The pharmacokinetic values for 3TC had interesting differences when compared to the
parameter estimates obtained when the compound was administered as a single agent.
Lamivudine shows an increased half-life (64 min) and AUC (1530 min*mg/L) and maintained a
similar volume of distribution at steady state (1250 ml/kg). The clearance of 3TC decreased by

88
40% from 16.3 ml/min/kg. However, zidovudine does not show much change in
pharmacokinetic parameters, with the possible exception of half-life (88 min). The volume of
distribution at steady state (880 ml/kg), AUC (2600 min*mg/ml) and clearance (9.7 ml/min/kg)
are very similar when zidovudine is administered as a single agent or in combination. This data
combined with the fetal and placental compartment data suggests that the transport of 3TC was
increased by the presence of AZT. However, this interaction requires further study before any
definitive conclusions can be drawn but the results are similar to the interaction between
acyclovir and zidovudine (Brown et al., 2003).
CONCLUSION
A sensitive, efficient and accurate method was developed and validated for the simultaneous
quantification of 3TC and AZT in rat plasma, amniotic fluid, placental and fetal tissues. The
solid phase extraction procedure produced samples with few remaining endogenous compounds.
This efficient sample clean up facilitated the method development by expediting the
development of the chromatographic conditions. This method is useful for pharmacokinetic
studies to investigate the distribution of 3TC and AZT in the maternal and fetal compartments of
rats, where the preliminary data suggests that there is a significant interaction between these two
compounds.
References
Beach JW. Chemotherapeutic Agents for Human Immunodeficiency Virus Infection:
Mechanism of Action, Pharmacokinetics, Metabolism and Adverse Reactions. Clinical
Therapeutics 1998; 20: 2-25.
Brown SD, Bartlett GM, White CA. Pharmacokinetics of Intravenous Acyclovir,

89
Zidovudine, and Acyclovir-Zidovudine in Pregnant Rats. Antimicrob. Agents
Chemother. 2003; 47: 991-996.
Clercq ED. New developments in anti-HIV chemotherapy. Biochem. Biophys. Acta
2002; 1587: 258-275.
Faber, J. J.; Thornburg, K. L, Structure and function of fetomaternal exchange, Raven,
New York, 1983, p. 1.
Fan B, Stewart JT. Determination of zidovudine/lamivudine/nevirapine in human plasma
using ion-pair HPLC. J Pharm. Biomed. Anal. 2002; 28: 903-908.
Fridland A, Connelly MC, Robbins BL. Cellular factors for resistance against
antiretroviral agents. Antiviral Therapy 2000; 5: 181-185.
Gallant JE. Initial therapy of HIV infection. J. Clin. Virol. 2002; 25: 317-333.
Joint United Nations Programme on HIV/AIDS, HIV/AIDS; The Global Epidemic, UNAIDS,
Geneva, 1996,
(http://www.unaids.org/publications/documents/epidemiology/estimates/situat96kine.html).
Kenney KB, Wring SA, Carr RM, Wells GN, Dunn JA. Simultaneous determination of
zidovudine and lamivudine in human serum using HPLC with tandem mass spectrometry.
J. Pharm. Biomed. Anal. 2000; 22: 967-983.
Knipp GT, Audus KL, Soares MJ. Nutrient transport across the placenta. Advanced
Drug Deliv. Reviews. 1999; 38: 41-58.
Mofenson LM, Mclntyre JA. Advances and research directions in the prevention of
mother-to-child HIV-1 transmission. Lancet 2000; 355: 2237--2244.
Pereira AS, Kenney, KB, Cohen MS, Hall, JE, Eron, JJ, Tidwell, RR, Dunn JA.

90
Simultaneous determination of lamivudine and zidoviudine concentrations in human
seminal plasma using high-performance liquid chromatography and tandem mass
spectrometry. J. Chromatogr B. 2000; 742: 173-183.

91
Table 3.1
Absolute recoveries of 3TC, AZT and albuterol in plasma, amniotic fluid, placenta and fetus (n = 15).
Concentration Analyte Plasma Amniotic Fluid
Fetal Tissue Placental Tissue
3TC 76 ± 5.4 % 74 ± 6.2 % 65 ± 4.9 % 61 ± 7.2 % 40 AZT 84 ± 6.3 % 85 ± 3.8 % 80 ± 7.0 % 77 ± 4.2 % 3TC 77 ± 7.0 % 76 ± 5.8 % 66 ± 2.4 % 61 ± 5.6 % 5 AZT 89 ± 3.9 % 90 ± 8.1 % 81 ± 6.6 % 78 ± 4.4 % 3TC 76 ± 5.8 % 78 ± 7.1 % 62 ± 4.6 % 61 ± 1.9 % 0.5 AZT 82 ± 4.3 % 86 ± 6.6 % 77 ± 5.5 % 77 ± 8.7 % 3TC 72 ± 3.9 % 74 ± 5.3 % 66 ± 6.1 % 60 ± 5.1 % 0.2 AZT 90 ± 6.0 % 88 ± 4.7 % 80 ± 3.9 % 87 ± 7.8 %
300 - - 16 ± 1.6 % 12 ± 1.1 % 100
Albuterol 38 ± 3.6 % 40 ± 2.6 % - -
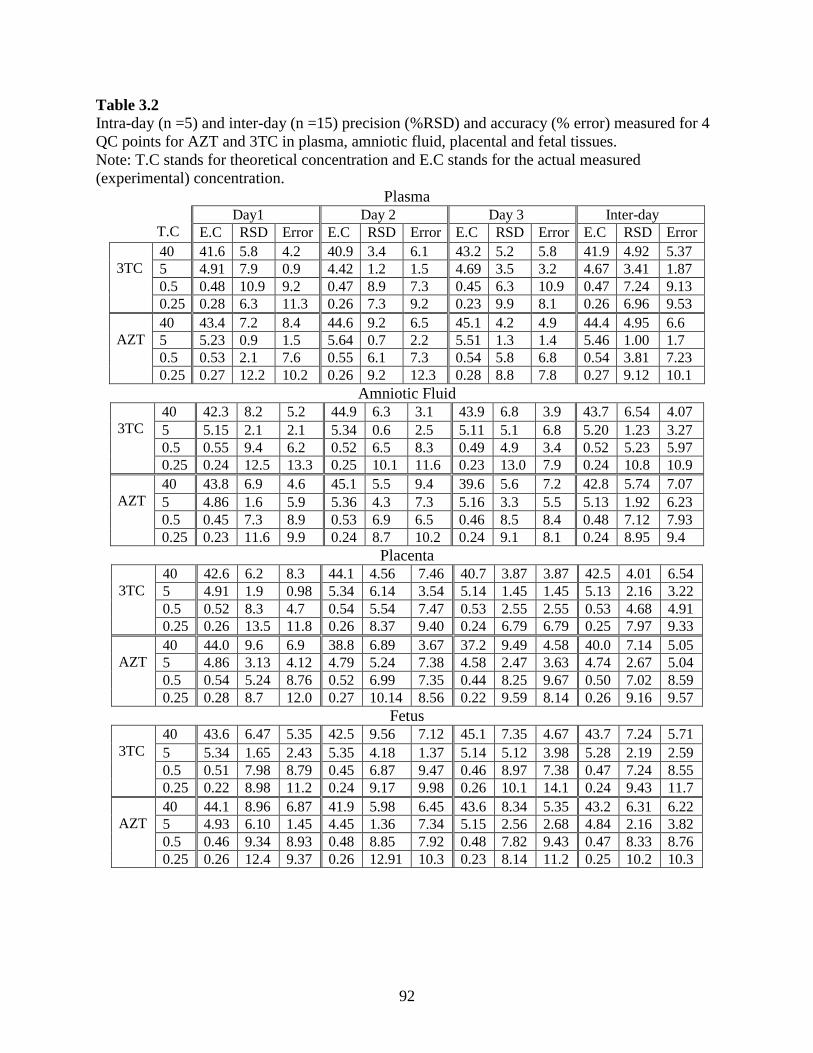
92
Table 3.2 Intra-day (n =5) and inter-day (n =15) precision (%RSD) and accuracy (% error) measured for 4 QC points for AZT and 3TC in plasma, amniotic fluid, placental and fetal tissues. Note: T.C stands for theoretical concentration and E.C stands for the actual measured (experimental) concentration.
Plasma Day1 Day 2 Day 3 Inter-day
T.C E.C RSD Error E.C RSD Error E.C RSD Error E.C RSD Error 40 41.6 5.8 4.2 40.9 3.4 6.1 43.2 5.2 5.8 41.9 4.92 5.37 5 4.91 7.9 0.9 4.42 1.2 1.5 4.69 3.5 3.2 4.67 3.41 1.87 0.5 0.48 10.9 9.2 0.47 8.9 7.3 0.45 6.3 10.9 0.47 7.24 9.13
3TC
0.25 0.28 6.3 11.3 0.26 7.3 9.2 0.23 9.9 8.1 0.26 6.96 9.53 40 43.4 7.2 8.4 44.6 9.2 6.5 45.1 4.2 4.9 44.4 4.95 6.6 5 5.23 0.9 1.5 5.64 0.7 2.2 5.51 1.3 1.4 5.46 1.00 1.7 0.5 0.53 2.1 7.6 0.55 6.1 7.3 0.54 5.8 6.8 0.54 3.81 7.23
AZT
0.25 0.27 12.2 10.2 0.26 9.2 12.3 0.28 8.8 7.8 0.27 9.12 10.1 Amniotic Fluid
40 42.3 8.2 5.2 44.9 6.3 3.1 43.9 6.8 3.9 43.7 6.54 4.07 5 5.15 2.1 2.1 5.34 0.6 2.5 5.11 5.1 6.8 5.20 1.23 3.27 0.5 0.55 9.4 6.2 0.52 6.5 8.3 0.49 4.9 3.4 0.52 5.23 5.97
3TC
0.25 0.24 12.5 13.3 0.25 10.1 11.6 0.23 13.0 7.9 0.24 10.8 10.9 40 43.8 6.9 4.6 45.1 5.5 9.4 39.6 5.6 7.2 42.8 5.74 7.07 5 4.86 1.6 5.9 5.36 4.3 7.3 5.16 3.3 5.5 5.13 1.92 6.23 0.5 0.45 7.3 8.9 0.53 6.9 6.5 0.46 8.5 8.4 0.48 7.12 7.93
AZT
0.25 0.23 11.6 9.9 0.24 8.7 10.2 0.24 9.1 8.1 0.24 8.95 9.4 Placenta
40 42.6 6.2 8.3 44.1 4.56 7.46 40.7 3.87 3.87 42.5 4.01 6.54 5 4.91 1.9 0.98 5.34 6.14 3.54 5.14 1.45 1.45 5.13 2.16 3.22 0.5 0.52 8.3 4.7 0.54 5.54 7.47 0.53 2.55 2.55 0.53 4.68 4.91
3TC
0.25 0.26 13.5 11.8 0.26 8.37 9.40 0.24 6.79 6.79 0.25 7.97 9.33 40 44.0 9.6 6.9 38.8 6.89 3.67 37.2 9.49 4.58 40.0 7.14 5.05 5 4.86 3.13 4.12 4.79 5.24 7.38 4.58 2.47 3.63 4.74 2.67 5.04 0.5 0.54 5.24 8.76 0.52 6.99 7.35 0.44 8.25 9.67 0.50 7.02 8.59
AZT
0.25 0.28 8.7 12.0 0.27 10.14 8.56 0.22 9.59 8.14 0.26 9.16 9.57 Fetus
40 43.6 6.47 5.35 42.5 9.56 7.12 45.1 7.35 4.67 43.7 7.24 5.71 5 5.34 1.65 2.43 5.35 4.18 1.37 5.14 5.12 3.98 5.28 2.19 2.59 0.5 0.51 7.98 8.79 0.45 6.87 9.47 0.46 8.97 7.38 0.47 7.24 8.55
3TC
0.25 0.22 8.98 11.2 0.24 9.17 9.98 0.26 10.1 14.1 0.24 9.43 11.7 40 44.1 8.96 6.87 41.9 5.98 6.45 43.6 8.34 5.35 43.2 6.31 6.22 5 4.93 6.10 1.45 4.45 1.36 7.34 5.15 2.56 2.68 4.84 2.16 3.82 0.5 0.46 9.34 8.93 0.48 8.85 7.92 0.48 7.82 9.43 0.47 8.33 8.76
AZT
0.25 0.26 12.4 9.37 0.26 12.91 10.3 0.23 8.14 11.2 0.25 10.2 10.3

93
Figure 3.1
Chemical structures of lamivudine, zidovudine and albuterol
AZT
OH H
N
OH
OH
Albuterol
3TC
NH
N
O
NH2
S
O
OH
NH
N
O
OO
N3
HO

94
Figure3.2
Representative chromatograms of 3TC (peaks marked ‘1’ ), AZT (peaks marked ‘2’ ) and albuterol (peaks marked ‘3’ ) in (a) amniotic fluid, (b) plasma, (c) fetus and (d) placenta. Concentration of AZT and 3TC in all the chromatograms is 500 ng/ml. Concentration of albuterol is 100 µg/ml in plasma and amniotic fluid and 300 µg/ml in placental and fetal tissues.
b.
1 2
3
Abs
orba
nce
(mv)
Time (min)
1 2
3
c.
Abs
orba
nce
(mv)
Time (min)
a.
1 2
3
Abs
orba
nce
(mv)
Time (min)
d.
1 2
3
Abs
orba
nce
(mv)
Time (min)

95
Figure3.3
Concentration-time profile of a. AZT and b. 3TC in plasma, amniotic fluid, placental and fetal homogenates when administered as a combination therapy.
a.
b.
A Z T
0 .0 1
0 .1
1
1 0
1 0 0
0 1 0 0 2 0 0 3 0 0 4 0 0
tim e (m in )
con
cen
trat
ion
(u
g/m
l)
p la sm a
a m n io tic f lu id
p la ce n ta
fe tu s
3TC
0.01
0.1
1
10
100
0 100 200 300 400
tim e (m in)
con
cen
trat
ion
(u
g/m
l)
plasm a
am niotic fluid
placenta
fetus

96
CHAPTER 4
SIMULTANEOUS DETERMINATION OF ZIDOVUDINE AND LAMIVUDINE FROM
RAT TISSUES BY LC-MS-MS1
1 Alnouti, Y., C.A. White and M.G. Bartlett. To be submitted to Rapid Communications in Mass Spectrometry.

97
Abstract
A sensitive LC-MS-MS method has been developed and validated for the simultaneous
quantification of Zidovudine (AZT) and Lamivudine (3TC) in rat plasma, amniotic fluid,
placental and fetal tissues. Samples were processed by acetonitrile precipitation.
Chromatography was performed using a C18 column (5 µm, 150 x 3.9 mm I.D). The mobile
phase consisted of 30% mobile phase A (methanol) and 7.5 mM ammonium acetate (pH 6.5).
The method was validated in the range of 0.05- 25 µg/ml for both 3TC and AZT in the 4
biological matrices. Finally, the method was applied to a study involving fetal transport of co-
administration of these compounds in a pregnant rat.
KEY WORDS
Zidovudine, Lamivudine, Validation, Bioanalytical, HPLC, MS.
INTRODUCTION
Vertical transmission of HIV from mother to fetus is reaching epidemic proportions with over
600,000 infected infants being born every year, worldwide.1 AZT was the first anti-HIV drug
proven effective in reducing the vertical transmission rate.2 However, because of the emergence
of resistance by the human immunodeficiency virus (HIV), the causative virus of AIDS, to single
anti HIV drugs, AZT is commonly combined with other antiviral drugs like 3TC.3, 4 The
combination of anti-HIV therapies and Caesarian sections has decreased the rate of vertical
transmission from 30% to 1.5%.5 The US Department of Health and Human Services has
recently charged a panel to create guidelines for the treatment of HIV infection. This panel
strongly recommends 3TC in combination with other antiviral drugs, especially AZT, due to the
high efficacy and acceptable toxicity of this therapeutic regimen.6 The use of AZT and 3TC

98
together has become so common that these two compounds are now formulated in the same
tablet and sold under the trade name CombivirTM.
While the use of combinations of antiviral drugs is popular, the impact of such
combination therapies on placental transport is largely unknown. A series of studies by Unadkat
and coworkers have reported the lack of interaction between several anti-HIV drugs when using
the macaque as an animal model. Their findings suggest passive diffusion as the primary
mechanism for placental transport .7- 9 However, the combination of 3TC and AZT was not
studied. More recently, a study by Brown et al. found substantial interactions between the
antivirals AZT and acyclovir in placental transport when using the rat as the animal model.10 The
data from this study supports a transporter-mediated mechanism for placental transport. The
differences between these studies may be related to the animal models, experimental design or
may be specific to the agents studied. Continued study of these compounds is needed to gain
further understanding of the mechanism of placental transport for this class of therapeutic agents.
To investigate the impact of the combination therapy on 3TC and AZT transport across
the placenta, an appropriate animal model is needed where the results can be successfully
extrapolated to humans. The pregnant rat is chosen as a model for the kinetic study. The
pregnant rat model has been successfully used to study the placental transfer of nucleoside
analogs.11-15 The large litter size makes pregnant rats a suitable model to study drug transport
from the maternal to the fetal compartment. The pregnant mother, usually, carries 10-15 pups,
each contained in its own fetal sac. Each fetal sac contains a fetus, placenta and amniotic fluid.
One fetal sac can be harvested at each time point to determine the drug level in the placenta,
fetus and amniotic fluid such that the entire kinetic profile is constructed from one rat. This
helps eliminate the inevitable variability from pooling data from different animals. Furthermore,

99
significant anatomical resemblance exists between the rat and human placenta because both
belong to the same haemochorial type.16, 17 This report describes the development and validation
of an LC-MS-MS assay for the simultaneous determination of 3TC and AZT in pregnant rat
plasma, amniotic fluid, fetal and placental tissues. Several methods are presented in the
literature for the simultaneous determination of 3TC and AZT in human plasma using capillary
electrophoresis,18 in human serum and semen using LC-MS-MS.19, 20 In addition to these
methods, there is a method to detect these compounds from mouse blood and spleen tissue using
LC-MS.21 The method presented here has a similar run time to the earlier LC-MS-MS methods
but is 40% faster than the LC-MS method. In addition, the protein precipitation sample
precipitation used here is much faster than other previous methods. Finally, no earlier methods
provide a full validation of their methods for tissues. The assay presented in this paper is the
first validated LC-MS-MS assay reported for simultaneous quantification of 3TC and AZT in
pregnant rat plasma and tissues. This method was applied to a comparative pharmacokinetic
study to investigate the impact of AZT and 3TC on placental transport.
EXPERIMENTAL
Chemicals and Reagents
Lamivudine (3TC), zidovudine (AZT) were extracted from commercially available tablets. The
purity of the extracts was determined by comparison to reference standards provided by the
manufacturer (GlaxoSmithKline, RTP, NC, USA) and were found to be greater than 98%. The
internal standard FTC was synthesized using the procedure of Chu and coworkers.22 HPLC-
grade methanol, acetonitrile and water were obtained from Fisher Scientific (Fair Lawn, NJ,
USA). Ammonium acetate, ammonium formate, formic acid and acetic acid were obtained from
Aldrich (Milwaukee, WI, USA).

100
Instrumentation
The HPLC system composed of Shimadzu LC-10ADVP, SCL-10AVP system controller
(Shimadzu, Tokyo, Japan) and a CTC HTS-PAL autosampler (LEAP Technologies, Carrboro,
NC, USA). The mass spectrometer was a Sciex API-4000 triple quadrupole instrument with
TurboIon Spray ESI source (Applied Biosystems, Toronto, Canada). The entire LC-MS system
is controlled by Analyst 2.1 Software (Applied Biosystems, Toronto, Canada). All
chromatographic separations were performed with a Symmetry C18 column (5 µm, 150 x 3.9 mm
I.D., Waters, Milford, MA, USA) equipped with a Phenomenex C-18 guard column (Torrance,
CA, USA).
Liquid chromatographic and mass spectrometric conditions
The Symmetry C18 column was used for all chromatographic separations. The mobile
phase consisted of methanol (mobile phase A) and 7.5 mM ammonium acetate pH 6.5 (mobile
phase B) delivered from 2 separate LC pumps. The flow rate was 0.65 ml/min. A switching
valve was used to send the LC flow to waste during times when peaks were not eluting. The LC
flow was directed to the MS in the time periods of 2.7-3.5 and 5.7-6.25 min. The autosampler
syringe and the injection valve were washed twice with a 100 µl of water: methanol (1:1)
washing solvent to reduce carryover.
The spray voltage, declustering potential, entrance potential, collision cell exit potential,
source temperature and collision gas were 4000 V, 41 V,10 V, 12 V, 700 ºC and 4 x 10⁻⁵ Torr
(level 7), respectively. Nitrogen was used as a collision gas. The collision energies were 15 eV
for AZT, 17 eV for 3TC and 53 eV for FTC. The multiple reaction monitoring (MRM)
transitions monitored were 268/127, 231/113 and 248/113 for AZT, 3TC and FTC, respectively.
101
Each transition was assigned a dwell time of 150 milliseconds. Figure 4.1 shows the chemical
structures of the three compounds.
Ionization suppression study
The ionization suppression regions for the different matrices were determined using post-column
infusion of a 2 µg/ml mixture of AZT, 3TC and FTC from an infusion pump at the rate of
10µl/min according to the procedure of King and coworkers.23 Blank samples from the amniotic
fluid, plasma, placental and fetal homogenates were extracted and 10 µls were injected. The
HPLC make up flow was 0.65 ml/min.
Preparation of Standard Solutions
One mg/ml stock solutions of AZT, 3TC and FTC were individually prepared in water: methanol
(1:1). Combined standard solutions of AZT and 3TC were prepared by mixing and diluting the
appropriate amounts from the individual stock solutions. The final concentrations of the
standard solutions were 250, 100, 50, 10, 2.5, 2, 1, 0.5 µg/ml. A 5 µg/ml internal standard
solution of FTC was prepared by diluting the 1 mg stock solution.
Calibration Curves
Blank plasma, amniotic fluid, placental and fetal tissues were harvested from untreated animals.
The placental and fetal tissues were homogenized with 2 volumes of distilled water (v/w).
Amniotic fluid, plasma, placenta and fetus calibration points were prepared by spiking 100 µl of
the biological matrices with10 µl of the 3TC-AZT and the 5 µg/ml standard solutions.
The calibration curves of all 4 matrices were over the range from 0.05-25 µg/ml with
individual calibration points of 25, 10, 1, 0.25, 0.1 and 0.05 µg/ml. The internal standard
concentration was 0.5 µg/ml.

102
Precision and Accuracy
The method was validated using 4 QC points for each calibration curve. Five replicates of each
QC point were analyzed every day to determine the intra-day accuracy and precision. This
process was repeated 3 times over 3 days in order to determine the inter-day accuracy and
precision. The concentrations of the QC points for all 4 matrices were 0.05, 0.2, 5 and 25 µg/ml.
Sample Preparation
In previous studies of nucleoside antivirals, solid phase extraction (SPE) was the primary sample
preparation method. For this assay, acetonitrile precipitation was used since the MS specificity
decreases the demands on sample preparation. Acetonitrile precipitation is simpler and cheaper
than SPE. 800 µl of acetonitrile was added to 100 µl of spiked samples. Samples were vortexed,
750 µl was aspirated and dried in vacuum. Finally, samples were reconstituted with a 100 µl of
water: methanol (1:1) solution.
To determine the extraction recovery, five blank samples of each matrix were spiked with
1 µg/ml of AZT-3TC and 0.5 µg/ml of FTC and extracted as mentioned. The same number of
blank samples were first extracted and then spiked with the same anlaytes solution. The
extraction recovery was calculated as the ratio of the average analytes peak areas (n=5) for
samples spiked before and after extraction.
Animal Experiment
The use of animals in this study was approved by the University of Georgia Animal Use and
Care Committee. The rats were housed one animal per cage in the University of Georgia
College of Pharmacy animal facility (AALAC accredited). The environment was controlled (20
– 22 °C, 14 hr of light per day) with daily feedings of standard chow pellets and water.

103
A timed pregnant Sprauge-Dawley rat (Harlan, Indianapolis, IN, USA) weighing 335 g
was anesthetized intramuscularly with ketamine:acepromazine:xylazine (50:3.3:3.4 mg/kg) and
received atropine (0.5 mg/kg) subcutaneously. For dosing and blood sampling purposes, a
cannula was surgically implanted in the right jugular vein. For sampling of the pups (amniotic
fluid, placenta, and fetal tissues), a laparotamy was performed. The rats were administered an
i.v. bolus dose of AZT (25 mg/kg) and 3TC (25 mg/kg) dissolved in 0.1 NaOH in physiological
saline (pH 7.4) via the jugular cannula on day 19 of gestation. Blood samples were collected at
5, 15, 30, 45, 60, 90, 120, 180, 240, 300, 360 min after dosing into heparinized tubes and
centrifuged at 10,000 rpm for 10 min to enable plasma collection. Amniotic fluid, placenta, and
fetus samples were collected at 5, 10, 15, 30, 45, 60, 90, 120, 180, 240, 300, 360 min. Placental
and fetal tissue samples were homogenized in two volumes of deionized water. All samples
were stored at –20 °C until analysis.
RESULTS AND DISCUSSION
Structures of 3TC, AZT and FTC are shown in Figure 4.1. 3TC is a hydrophilic weak base with
a pKa = 4.3 while AZT (pKa = 9.7) is more lipophilic than 3TC.24 Under reverse phase
chromatographic conditions, 3TC elutes much earlier than AZT. Methanol rather than
acetonitrile was considered as the organic component of the mobile phase because of the weak
retention profile of 3TC in reverse phase columns. Therefore, we followed the strategy of using
the maximum methanol percentage in the mobile phase, which would elute 3TC right after the
ion suppression region and at the same time result in a reasonable retention time for AZT.
Increasing the methanol percentage in the mobile phase up to 30% did not cause 3TC to elute
within the ion suppression region for all 4 matrices, Figure 4.2. In order to elute AZT earlier,
several gradient profiles were tried. The methanol percentage was steeply ramped at 3 minutes

104
from 30% to 90% within 30 seconds. This steep gradient caused AZT to elute at 5 minutes, but
the column required equilibration with 30% methanol for 2 minutes afterward. The equilibration
time was determined by monitoring the LC-pumps pressure reading and the reproducibility of
the 3TC elution time. The pressure reading should come back to the original value, before
starting the gradient. Under 30% isocratic conditions 3TC, FTC (internal standard) and AZT
eluted at 2.9, 3.2 and 6.1 minutes, respectively. Therefore, the actual duty cycle for running
samples is faster when running in an isocratic manner. In addition, a pregnant rat animal study
generates approximately 40 samples per rat, thus a six-minute run time was not considered
excessively long. Figure 4.3 shows representative chromatograms of 3TC, AZT and FTC in the
different biological matrices.
During the mass spectrometric condition development, both negative and positive
ionization modes were investigated. 3TC and AZT ionized in both negative and positive modes.
However, 3TC had higher ionization efficiency in the positive ion mode, while AZT had higher
ionization efficiency in the negative ion mode. In this case, the source polarity could be
switched from positive to negative after 3TC elution from the column. This approach was used
earlier for the simultaneous quantitation of 3TC and AZT.19, 20 However, the signal intensities
for 3TC and AZT, in their favorable ionization modes, were much higher than the quantitation
range required for our application (0.05- 25 µg/ml). Therefore, the signal intensity of AZT even
in positive ion mode was still satisfactory to reach the lower limit of quantification for this study
(0.05 µg/ml), while 3TC did not produce an acceptable signal in the negative ion mode. The
peak height of 0.05 µg/ml AZT was 5000 cps (counts per second) in the positive ionization
mode, while the peak height of the same concentration of 3TC was 800 cps in the negative
ionization mode. Despite the lower ionization efficiency of AZT, the positive ion mode was

105
chosen since both analytes were sufficiently ionized. Using the positive ion mode, another
problem was faced. 3TC had 10 times higher ion abundance than AZT. Since this assay was
developed for simultaneous quantitation of AZT and 3TC in rat plasma and tissues that contain
comparable levels of the 2 analytes, we needed to decrease the signal intensity of 3TC. Two
approaches were investigated to decrease the 3TC signal intensity. First, unfavorable conditions
for the 3TC transition were applied i.e. high collision energy. Second, the 13C isotope (M+ 1)+H
and the corresponding 13C containing fragment ion was monitored instead of the most abundant
all 12C isotope. Both approaches were successful but monitoring the 13C isotope produced a
more linear calibration curve over the concentration range from 0.05-25 µg/ml. Under these
conditions, AZT and 3TC produced comparable and acceptable signal intensities in the range for
which this assay was developed. Figure 4.4 shows a product ion spectrum (10 summed scans) of
AZT, 3TC and FTC (IS) at a concentration of 5 µg/ml. For AZT and 3TC the protonated
pyrimidine bases, thymidine (127 amu) and the 13C cytidine (113) were the dominant fragments
observed in the product ion scan mass spectrum, respectively. For FTC, the product ion chosen
for MRM was at 113 amu. This ion results from the loss of ammonia from the protonated
fluorocytidine base and was used make the signal from the internal standard similar in abundance
to the analytes.
For the aqueous mobile phase component, ammonium formate and ammonium acetate
buffers with different pH levels (3-7) were investigated. The AZT and 3TC signals were slightly
increased by decreasing the pH to 3 but 3TC eluted 15 seconds earlier at this low pH. A pH of
6.5 was selected because it resulted in the highest 3TC retention without significantly
compromising the ion abundance in the mass spectrometer. Ammonium acetate rather than
ammonium formate was selected because it has greater buffering capacity at pH 6.5.

106
FTC was selected as an internal standard because of its structural similarity to the
analytes, especially 3TC. Therefore, it ionizes well in the positive ion mode. FTC had
comparable extraction recoveries from all matrices, Table 4.1.
For sample preparation, protein precipitation was first investigated because of its
simplicity and low cost. According to the ionization suppression experiment, the analytes elute
later than the ion suppression region in all matrices, Figure 4.2. Furthermore, sample extraction
using acetonitrile precipitation yielded acceptable recoveries, ranging from 68-86% in all
matrices, Table 4.1. Therefore, protein precipitation using acetonitrile was adopted for this assay
with no further investigations of other extraction techniques.
Accuracy and Precision
Assay precision and accuracy were calculated for each matrix over 3 days. Intra-day (n=5)
precision and accuracy were calculated from the measurement of 5 samples at each QC point on
3 separate days (data not shown). Inter-day (n=15) precision and accuracy were calculated from
the pooled data from the 3 days. Four QC points of concentrations 25, 5, 0.2 µg/ml and the
lowest concentration in the calibration curve (0.05 µg/ml) were selected to validate the method.
Inter-day precision, as expressed by %RSD, and accuracy as expressed by % error for 3TC and
AZT in the 4 biological matrices are shown in Table 4.2. Inter-day precision and accuracy for
3TC ranged from 5.8- 10.8 % and 5.2- 9.6 %, respectively; while for AZT it ranged from 5.9-
11.4 % and 4.9- 10.6 %, respectively. All calibration curves were weighted according to the
1/x2-weighting scheme. The calibration curves showed acceptable linearity (R2 > 0.99) over the
range 0.05-25 µg/ml for plasma, amniotic fluid, placental and fetal homogenates.

107
Animal Study
To demonstrate the application of this method in animal studies, a female rat was dosed with a
combination of 3TC and AZT IV bolus (25 mg/kg for each compound). Plasma, amniotic fluid,
placental and fetal tissues were processed and analyzed as mentioned. Figure 4.5 shows the
concentration-time profile of 3TC and AZT in all matrices. The plasma data was analyzed using
WinNonlin (Pharsight, Mountain View, CA, USA). For 3TC, half life, volume of distribution at
steady state, area under the curve (AUC) and clearance were calculated to be 105 min, 1.24 L/kg,
2280 min*mg/L and 11 ml/min/kg, respectively. For AZT, half-life, volume of distribution at
steady state, the AUC and clearance were calculated to be 57 min, 0.779 L/kg, 2324 min*mg/L,
and 10.8 ml/min/kg, respectively. This data is consistent with earlier reported pharmacokinetic
data on 3TC and AZT.14, 15, 10
Amniotic fluid, fetal and placental tissue data show interesting differences in the
exposure to 3TC between 3TC monotherapy and 3TC-AZT combination therapy.
Noncompartmental analysis was used to calculate 3TC AUC in tissues and the relative exposure
compared to plasma (AUCtissue/AUCplasma) were calculated, Table 4.3. The relative exposure of
amniotic fluid, fetal and placental tissues to 3TC increased, when 3TC was co administered with
AZT, by a factor of 1.47, 1.21 and 1.42, respectively. This data suggests that the placental
transport of 3TC to the fetal compartment was increased by the presence of AZT. However, this
interaction requires further study before any definitive conclusions can be drawn but the results
are similar to the interaction between acyclovir and zidovudine.10
CONCLUSION
A sensitive, efficient and accurate method was developed and validated for the simultaneous
quantification of 3TC and AZT in rat plasma, amniotic fluid, placental and fetal tissues. Simple

108
sample preparation technique using acetonitrile precipitation was used. This method is useful for
pharmacokinetic studies to investigate the distribution of 3TC and AZT in the maternal and fetal
compartments of rats, where the preliminary data suggests that there is a significant interaction
between these two compounds.
109
REFERENCES
1. Mofenson LM, Mclntyre JA. Lancet 2000; 355: 2237-2244.
2. Connor EM, Sperling RS, Gelber R, Kiselev P, Scott G, Osullivian MJ, Vand yke R, Bey
M, Shearer W, Jacobson RL, Jimenez E, Oneill E, Bazin B, Delfraissy JF. N. Eng. J.
Med. 1994; 331: 1173-1180.
3. Gallant JE. J. Clin. Virol. 2002; 25: 317-333.
4. Beach JW. Clin Ther. 1998; 20: 2-25.
5. Soilleux EJ, Coleman N. Int. J. Biochem. Cell. B. 2003; 35: 283-287.
6. Guidelines for the Use of Antiretroviral Agents in HIV- Infected Adults and Adolescents,
US Department of Health and Human Services, March 2004.
(http://aidsinfo.nih.gov/guidelines)
7. Pereira CM, Nosbisch C, Baughman WL, Unadkat JD. Antimicrob. Agents Chemother.
1995; 39: 343-345.
8. Brown SD, Bartlett MG, White CA. Antimicrob. Agents Chemother. 2003; 47: 991-996.
9. Boike GM, Deppe, G, Young JD, Gove NL, Bottoms SF, Malone JM, Malviya VK and
Sokol RJ. Gynecol. Oncol. 1989; 34:187-190.
10. Boike GM, Deppe, G, Young JD, Malone JM, Malviya VK and Sokol RJ. Gynecol.
Oncol. 1989; 34:191-194.
11. Ibrahim SS and Boudinot FD. J. Pharm. Pharmacol. 1989; 41:829-834.
12. Rajagopalan P, Boudinot FD, Chu CK, Tennant BC, Baldwin BH, Schinazi RF.
Antimicrob. Agents Chemother. 1996; 40: 642-645.
13. Huang CS-H, Boudinot FD, Feldman S. J. Pharm. Sci. 1996; 85: 965-970.
14. Faber JJ, Thornburg KL. Structure and function of fetomaternal exchange, Raven,

110
New York, 1983, p. 1.
15. Knipp GT, Audus KL, Soares MJ. Advanced Drug Deliv. Reviews. 1999; 38: 41-58.
16. Fan B, Stewart JT. J Pharm. Biomed. Anal. 2002; 28: 903-908.
17. Kenney KB, Wring SA, Carr RM, Wells GN, Dunn JA. J. Pharm. Biomed. Anal. 2000;
22: 967-983.
18. Pereira AS, Kenney, KB, Cohen MS, Hall, JE, Eron, JJ, Tidwell, RR, Dunn JA. J.
Chromatogr B. 2000; 742: 173-183.
19. Odinecs A, Nosbisch C, Unadkat JD. Antimicrob. Agents Chemother. 1996; 40: 1569-
1571.
20. Tuntland T, Nosbisch C, Baughman WL, Massarella J, Unadkat JD. Am. J. Obstet.
Gynecol. 1996; 174: 856-863.
21. Williams LD, Tungeln LS, Beland FA, Doerge DR. J. Chromatogr B. 2003; 798: 55-62.
22. Jeong LS, Schinazi RF, Beach JW, Kim HO, Nampalli S, Shanmuganathan K, Alves AJ,
McMillan A, Chu CK and Mathis R. J. Med. Chem. 1993; 36:181-195.
23. King R, Bonfiglio R, Fernandez-Metzler C, Miller-Stein C, Olah T. J. Am. Soc. Mass
Spectrom. 2000; 11: 942-950.
24. Fridland A, Connelly MC, Robbins BL. Antiviral Therapy. 2000; 5: 181-185.

111
Table 4.1 Extraction recoveries of 3TC, AZT and FTC in rat plasma, amniotic fluid, placenta and fetus (n = 5). Concentration (µg/ml)
Analyte Plasma Amniotic Fluid
Fetal Tissue Placental Tissue
3TC 76 ± 3.4% 84 ± 4.2% 72 ± 3.9% 70 ± 7.2% 25 AZT 82 ± 5.3% 85 ± 4.6% 72 ± 5% 77 ± 3.2% 3TC 74 ± 6.6% 81 ± 2.4% 70 ± 10.3% 73 ± 11.1% 1 AZT 80 ± 6.5% 86 ± 3.6% 72 ± 9.7% 78 ± 8.8% 3TC 73 ± 5.9% 79 ± 4.3% 68 ± 8.1% 71 ± 6.1% 0.05 AZT 80 ± 5.0% 83 ± 5.7% 69 ± 4.9% 75 ± 9.8%
0.5 FTC 81 ± 7.7% 85 ± 2.3% 73 ± 6.7% 78 ± 8.5%
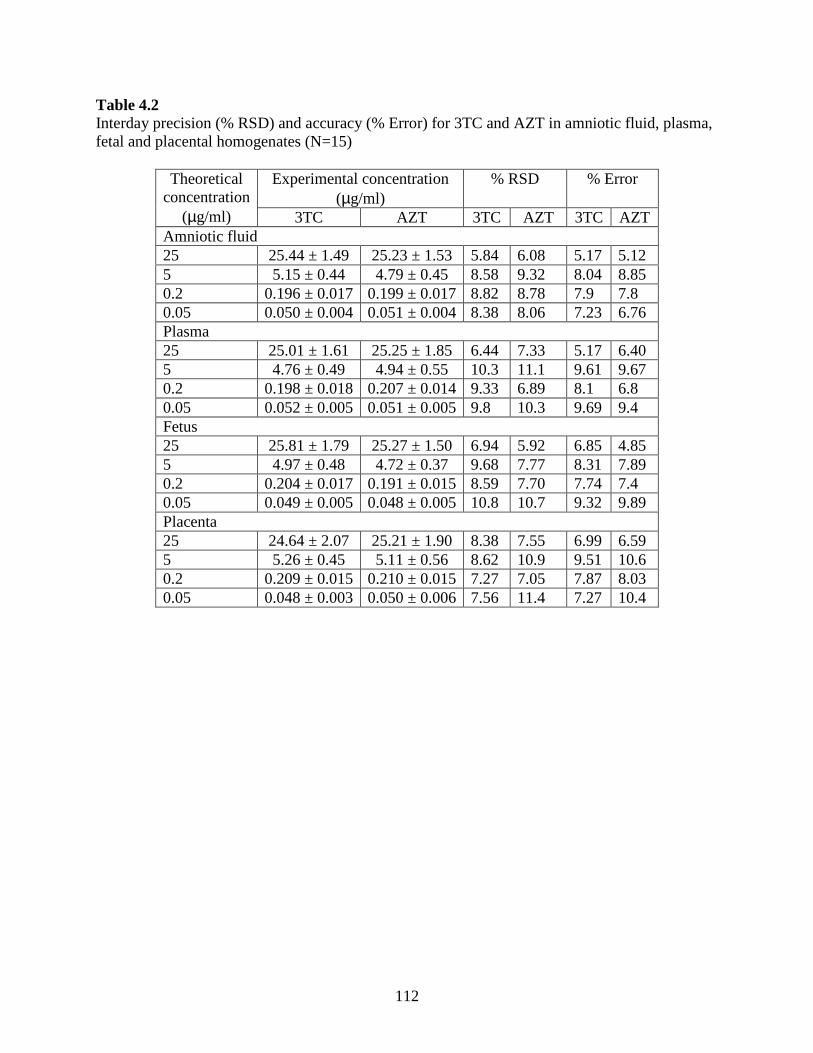
112
Table 4.2 Interday precision (% RSD) and accuracy (% Error) for 3TC and AZT in amniotic fluid, plasma, fetal and placental homogenates (N=15)
Experimental concentration (µg/ml)
% RSD
% Error Theoretical concentration
(µg/ml) 3TC AZT 3TC AZT 3TC AZT Amniotic fluid 25 25.44 ± 1.49 25.23 ± 1.53 5.84 6.08 5.17 5.12 5 5.15 ± 0.44 4.79 ± 0.45 8.58 9.32 8.04 8.85 0.2 0.196 ± 0.017 0.199 ± 0.017 8.82 8.78 7.9 7.8 0.05 0.050 ± 0.004 0.051 ± 0.004 8.38 8.06 7.23 6.76 Plasma 25 25.01 ± 1.61 25.25 ± 1.85 6.44 7.33 5.17 6.40 5 4.76 ± 0.49 4.94 ± 0.55 10.3 11.1 9.61 9.67 0.2 0.198 ± 0.018 0.207 ± 0.014 9.33 6.89 8.1 6.8 0.05 0.052 ± 0.005 0.051 ± 0.005 9.8 10.3 9.69 9.4 Fetus 25 25.81 ± 1.79 25.27 ± 1.50 6.94 5.92 6.85 4.85 5 4.97 ± 0.48 4.72 ± 0.37 9.68 7.77 8.31 7.89 0.2 0.204 ± 0.017 0.191 ± 0.015 8.59 7.70 7.74 7.4 0.05 0.049 ± 0.005 0.048 ± 0.005 10.8 10.7 9.32 9.89 Placenta 25 24.64 ± 2.07 25.21 ± 1.90 8.38 7.55 6.99 6.59 5 5.26 ± 0.45 5.11 ± 0.56 8.62 10.9 9.51 10.6 0.2 0.209 ± 0.015 0.210 ± 0.015 7.27 7.05 7.87 8.03 0.05 0.048 ± 0.003 0.050 ± 0.006 7.56 11.4 7.27 10.4

113
Table 4.3 Relative exposure (AUCtissue/AUCplasma) to 3TC for amniotic fluid, fetus and placenta tissues generated from rats treated with 3TC monotherapy and 3TC-AZT combination therapy
AUCtissue/AUCplasma Tissue 3TC 3TC-AZT
Amniotic fluid 0.22 0.33 Fetus 0.32 0.39 Placenta 0.54 0.76

114
Figure 4.1
Chemical structures of AZT, 3TC and FTC (internal standard).
NH
N
O
OO
N3
HO
AZT 3TC
FTC
NH
N
O
NH2
S
O
OH
NH
N
O
NH2
S
O
OH
F
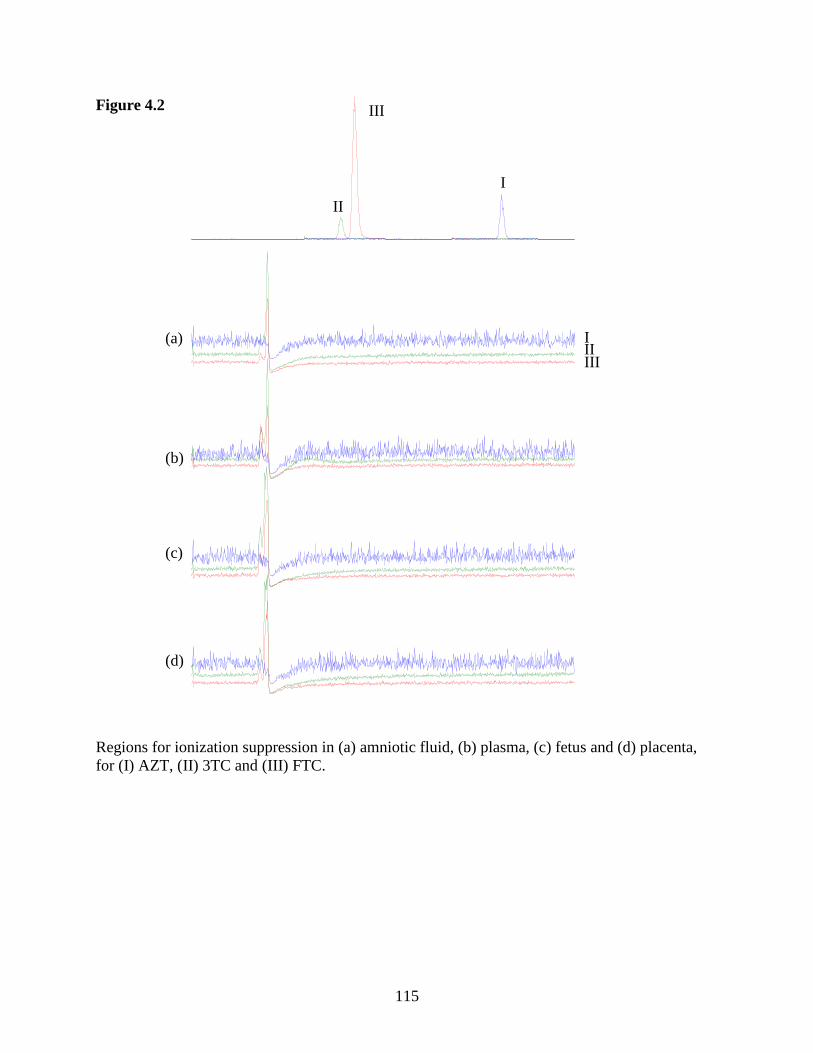
115
Figure 4.2 Regions for ionization suppression in (a) amniotic fluid, (b) plasma, (c) fetus and (d) placenta, for (I) AZT, (II) 3TC and (III) FTC.
II
III
I
I II III
(a)
(b)
(c)
(d)

116
Figure 4.3 Representative chromatograms of 3TC, AZT (0.05 µg/ml) and FTC (0.5 µg/ml) generated from extracted (a) amniotic fluid, (b) plasma, (c) placenta and (d) fetus.
(b)
Inte
nsit
y, c
ps
1.5e4
1.0e4
5000
2 4 6
3TC
FTC
AZT
(a) 1.5e4
1.0e4
2 6 4
Inte
nsit
y, c
ps
5000 3TC
FTC
AZT
2
Inte
nsit
y, c
ps
4 6
1.4e4
1.0e4
5000 3TC
FTC
AZT
Time, Min
(d)
5000 Inte
nsit
y, c
ps
2 4 6
1.3e4
1.0e4
FTC
AZT
3TC
(c)

117
Figure 4.4 Product ion scan spectrum for (a) AZT (Q1=268, Q3=127), (b) 3TC (Q1=231, Q3=113) and (C) FTC (Q1=248, Q3=113). The spectra represent 10 summed scans of a 5 µg/ml solution infused at 10 µl/min.
2.7e6
300 m/z
Inte
nsit
y, c
ps
127
268
m/z 300
Inte
nsit
y, c
ps
1.1e6 113
231
(a)
(b)
(c)
m/z 300
Inte
nsit
y, c
ps
1e6
248
113

118
Figure 4.5 (a)
(b)
Concentration-time profile of (a) AZT and (b) 3TC in pregnant rat plasma, amniotic fluid placenta and fetus
AZT
0.01
0.1
1
10
100
5 15 30 45 60 90 120 180 240 300 360
Time (min)
Co
nce
ntr
atio
n (
ug
/ml)
plasma
amniotic fluid
fetus
placenta
3TC
0.01
0.1
1
10
100
5 15 30 45 60 90 120
180
180
240
300
330
Time (min)
Co
nce
ntr
atio
n (u
g/m
l)
plasma
amniotic fluid
fetus
placenta

119
CHAPTER 5
CONCLUSION
Rugged, precise, accurate and valid analytical methods are essential for quantitative analysis.
The most popular application for these analytical methods is on the field of pharmacokinetics,
where precise and accurate data are needed to predict the pharmacokinetic behavior of
compounds of interests in a particular system.
The process of a bioanalytical method development includes 3 major steps, sample
preparation, chromatographic separation and spectrometric detection. Optimization of the
conditions of each of these steps is needed to eventually result in a successful method. A
successful method is a method with a reasonable run cycle, which passes the validation criteria.
The complexity of method development depends on the complexity of the matrix, where the
analyte is present and the selectivity of the detector. Complex matrices like body tissues impose
stricter sample preparation due to the presence of greater endogenous interferences, which
ultimately require chromatographic resolution. On the other hand, a more selective detection
like mass spectrometry will put less demand on selective sample preparation and
chromatography despite the presence of interferences that might not be chromatographically
resolved from the analyte.

120
In this dissertation, different sample preparation techniques were investigated. The
complexity of these techniques ranged from simple protein precipitation to more complex liquid-
liquid and solid phase extraction (SPE). Generally, SPE is the most selective technique and
results in extracts with the least amount of endogenous interferences. However, SPE is more
expensive and time consuming.
Capillary electrophoresis (CE) and HPLC were both successfully applied to provide
separation in the biological matrices. CE is more efficient in separation of charged analytes.
However, it is less sensitive and not easily compatible with biological matrices compared to
HPLC.
UV and mass spectrometer detectors were used in different methods. Mass spectrometry
is the more selective detection technique. Hyphenation of liquid chromatography and mass
spectrometry (LC-MS) is the most widely used analytical technique. Because of the MS
selectivity, generic sample preparation and chromatography procedures with minimum method
development and run cycle times can be achieved.
The animal studies have shown that the fetal exposure to 3TC was significantly increased
when co-administered with AZT. The mechanism of this drug-drug interaction has not been
found, but it might be due to AZT competitive inhibition of the 3TC efflux transporters in the
fetal-facing side of the placenta. These results suggest that the underlying mechanim behind the
3TC placental transport in rats is carrier mediated.

121
APPENDIX
COMPARISON OF LOCAL ANESTHETIC-CYCLODEXTRIN NON-COVALENT
COMPLEXES USING CAPILLARY ELECTROPHORESIS AND ELECTROSPRAY
IONIZATION MASS SPECTROMETRY1
1 Alnouti, Y. and M.G. Bartlett. 2002. Journal of The American Society for Mass Spectromerty. 13 (8)928-935. Reprinted here with permission of publisher.

122
Abstract
Non-covalent complexes between three derivitized cyclodextrins (CD’s) and six local
anesthetics were studied using capillary electrophoresis (CE) and electrospray ionization mass
spectrometry (ESI-MS). The CE study was performed using the complete filling technique
(CFT). A comparison between the migration data from CE and ESI-MS inclusion complex peak
abundances was made representing the association between local anesthetics and CD’s in the
solution and the gas phase, respectively. The results from this study showed comparable
behavior of the complexes in the CE and mass spectrometer, indicating similarity in the
parameters controlling the stability of these complexes. Therefore, the formation of specific
non-covalent complexes, as shown in this study, could be used to predict the behavior of a
complexing agent with a substrate in the solution phase by observing data obtained from ESI-
MS.

123
Introduction:
The formation of specific non-covalent complexes by association of guest compounds within the
cavity of host molecules is currently an area of great interest in the field of mass spectrometry.
Most cyclodextrins (CD’s) are made up of six, seven or eight glucose monomers bound together
by a 1,4 ether linkage. Cyclodextrins are gaining importance in asymmetric organic synthesis for
their catalytic properties and in the pharmaceutical, cosmetic, agriculture and food industries
where their ability to improve the hydrophilicity of lipophilic compounds is of great importance
[1]. Understanding the formation of these non-covalent complexes with CD’s would assist in
improving our understanding of this important interaction. Capillary electrophoresis (CE) and
electrospray ionization mass spectrometry (ESI-MS) are two techniques that can be used together
to give a comprehensive picture of the formation of these complexes.
Mass spectrometry has been a powerful tool in the study of non-covalent interactions.
Electrospray ionization is a soft ionization technique, which therefore allows for the transfer of
non-covalent complexes from the solution phase into the gas phase. The gas phase environment
of the mass spectrometer has the advantage of avoiding many interferences and allows for facile
identification and detection of host-guest complexes [2]. Numerous studies have reported the
observation of intact non-covalent complexes and this information was used to provide insight
into specific non-covalent associations in solution [1-6]. However, the production of non-
specific adducts have been reported too, leading to concerns over the ability of mass
spectrometry to be used to study non-covalent associations [7, 8].
If the ESI-MS is able to retain specific inclusion complexes in the same form as in the
solution state, then it could be a very effective tool to study the formation of these complexes [1,
8, 9]. Since ESI-MS can be applied to solution conditions close to those of physiological
124
interest, it can provide information on enzyme-substrate, receptor-ligand and antigen-antibody
interactions, as well as, host-guest complexes [2, 10].
The correlation between the behavior of solution and gas phase complexes has been
studied extensively over the past decade. Several approaches have been proposed to determine if
the gas phase complex in question is a non-specific adduct or representative of a specific non-
covalent interaction. The first approach was developed by Vouros et al. where substrates that
lack the structural features favoring association with a complexing agent are compared to
substrates that favor the formation of such complexes. In this case, the detection of any
complexes would indicate the formation of electrostatic adducts during the electrospray process
[7]. These weakly bound complexes would also decompose easily using low energy collision
induced dissociation studies (CID) [11]. Second, hydrogen/deuterium (H/D) exchange has been
used by comparing the average number of exchanges for the individual units comprising the
complex with the average number of exchanges for the complex itself. If a complex is formed
during the ionization process, the average number of (H/D) atoms exchanged in a complex
should equal the sum of H/D atoms exchanged in each of the components [12]. Third, applying
an on-line separation technique like gel permeation to remove the free guest and the free
complexing agent from the specific complex in solution. This technique guarantees that neither
the guest nor the host is found free in the solution to form non-specific adducts during ionization
[13]. The fourth approach involves masking or unfolding an active site that is known to bind
specifically to the complexing agent. If the detected complex still exists after the
deconformation of the active site then that indicates formation of non-specific aggregates [10].
A previous study performed in this lab showed the formation of specific non-covalent complexes
of a group of acidic hypnotic agents [3]. In this study, we extend this approach to a group of

125
basic local anesthetics in an attempt to determine whether the behavior previously observed was
limited to the acidic compounds or is more universal in its applicability. The six local
anesthetics under study have structural features that favor binding with the CD cavity in
ammonium formate buffer. Ammonium formate was chosen because of earlier reports that it
suppresses the formation of non-specific aggregates in positive ion electrospray [13]. To show
the correlation between the behavior of specific non-covalent complexes in the liquid and the gas
phase, this study is divided into two parts. First, the comparison of the order of association
constants of the different analytes with each CD as measured by CE, with the order of their peak
intensity ratios as measured by ESI-MS. Second, comparing the relative affinities of each
analyte to three different complexing agents (CD’s) as calculated by CE and ESI-MS. If the
behavior of the solution phase and the gas phase complexes are similar then there is evidence for
formation of specific non-covalent inclusions.
Experimental
Materials and Reagents
Proparacaine, meprilcaine, lidocaine, prilocaine, dibucaine, dyclonine, heptakis(2,3,6-tri-o-
methyl)-β-cyclodextrin, heptakis(2,6-di-o-methyl)-β-cyclodextrin and ammonium formate 97%
were obtained from Aldrich Chemical Company, Inc (Milwaukee, WI, USA). Formic acid
90.3% was obtained from J.T. Baker (Phillipsburg, NJ, USA). Nylon membrane syringe filters
(0.2 µm) were purchased from Fisher Scientific (Pittsburgh, PA, USA). Methyl-β-cyclodextrin
(MβCD), hydroxypropyl-β-cyclodextrin and γ-cyclodextrin were kindly supplied by Cerastar
USA, Inc (Indianapolis, IN, USA)

126
Mass spectrometry
A Quattro ΙΙ (Micromass, Inc, Beverly, MA, USA) triple quadrupole mass spectrometer
equipped with the Z-sprayTM electrospray ionization source was used for all the mass
spectrometry experiments. The mass spectrometer was set to the positive ion mode of operation,
with the source temperature at 150 °C. The cone and the ion source capillary voltages were
adjusted to maximize the signal/noise ratio of the analyte-CD complex, which were found to be
20 V and 3000V, respectively. The data were collected in the multi-channel analysis (MCA)
mode, and represent the summation of ten individual mass spectral scans. Direct flow injection
was carried out using a syringe infusion pump (KD Scientific, Boston, MA, USA) to deliver
sample at a flow rate of 15 µL/min into the ESI source.
Capillary electrophoresis
A P/ACE system 5000 CE (Beckman, Inc, Fullerton, CA, USA) equipped with an UV detector
was used for all CE experiments. The separation capillary was uncoated fused-silica tubing
(Polymicro Technologies, Phoenix, AZ, USA) of 75 µm ID. The total length of the capillary
was 57 cm with a 50 cm effective length, which represents the distance from the front of the
capillary to the detector. The capillary was thermostated at 25 °C and detection was carried out
using the UV detector at 254 nm. Samples were introduced into the capillary by pressure, 0.5 psi
(3.4 kPa), for 5 seconds. Separation was found to be optimum at 15 kV toward the cathodic
electrode. Electrolyte backgrounds (EBG) over the cyclodextrin concentration range from 14-60
mM were prepared in 100 mM ammonium formate buffer pH 2.
Preparation of stock and standard solutions
For the CE experiments the buffer system was prepared as 100 mM ammonium formate in water,
which was then adjusted to pH 2 using concentrated formic acid. The analytes were dissolved in

127
10-fold diluted ammonium formate buffer (10 mM) to prepare 1 mg/ml stock solutions. Fifty
µg/ml sample concentrations were then prepared from each respective stock to be injected into
the CE. Dissolving the analyte in a solvent of lower conductivity (lower concentration) will
cause them to be stacked in a narrower zone, producing sharper peaks and allowing for lower
limits of detection. Cyclodextrin (CD) stock solutions were prepared in the 100 mM ammonium
formate to give a final concentration range from 14-60 mM. All solutions were filtered prior to
use with a 0.2 µm Nylon filter syringe.
For the MS experiments, 20 mg/ml cyclodextrin stock solutions were prepared in 100
mM ammonium formate buffer. Analyte stock solutions were prepared in the same way as for
the CE. Appropriate volumes of the CD stock and the analyte stock solution were pipetted to
give 1:100 w/w ratio of the analyte to the CD.
Electrophoretic conditions:
Initially an uncoated fused silica capillary was rinsed with 1 M HCl for 2 hours, with water for 3
hours, with 0.1 M NaOH for 30 minutes, and finally with water for 30 minutes. The capillary
was flushed with water, running buffer, and with water again, 2 minutes each before the buffered
CD solution was introduced into the capillary. The buffer system was 100 mM ammonium
formate (pH 2). The buffer in the outlet and inlet vials was replaced after each run to avoid ion
depletion allowing better reproducibility of the analytes migration times. The ammonium
formate buffer was prepared fresh every morning and the capillary was stored dry overnight.
The principle of analyte stacking was applied to this study, by dissolving the analyte in a solvent
of lower conductivity than the run buffer. The electric current increases by decreasing the
solvent conductivity, which causes the analyte to move faster in the sample plug until
encountering the boundary of the higher concentration buffer [3, 14]. This approach causes the

128
analyte to be stacked in a narrow zone producing sharper peaks. Figure 1 shows a representative
electropherogram.
The complete filling technique (CFT)
For all CE experiments in this study the complete filling technique (CFT) was used. The CFT
was developed as a modification of the partial filling technique (PFT). The PTF was introduced
by Valtcheva et al. in 1993 [15], modified by Tanaka and Terabe, in 1995 [16] and applied by
Amini et al. in 1997 [17] and again in 1999 [18]. In the PFT, the capillary is filled with the
selector solution up to the detection window, the sample injection is then applied, and finally the
separation process is pursued by applying the voltage while the capillary ends are dipped into the
electrolyte background (EBG) containing no CD selector [14, 17-20]. The PFT was originally
developed to avoid detection interferences by a UV active selector by choosing separation
conditions that held the selector stationary or moving away from the detection window [19, 20].
Since the selector used in this study (cyclodextrin) has no UV interference or low UV
absorbtivity, the capillary can be entirely filled with the CD solution prior to sample
introduction. The separation was performed in the plain EBG [18]. The use of the CFT
significantly decreases the consumption of the cyclodextrin selector used (this whole study was
conducted using milligrams of CD), which is of great importance when expensive selectors are
used.
When using the PFT, a separation zone of a specific length is used by applying the CD
selector solution with a low pressure for a specific amount of time. This method is usually very
time consuming [18]. We chose to use CFT rather than PFT, since 1) previous studies indicate
that the longer the separation zone the better the resolution [18, 19], and 2) the CD selector is
UV-inert. The capillary was flushed with the CD solution using high pressure for 2 minutes,
129
which guarantees complete filling of the whole capillary length. The voltage was applied after
the sample was introduced into the capillary, and the capillary ends are dipped in the input and
the output vials filled with the EBG containing no CD selector.
Results and Discussion
Six local anesthetics have been studied; their structures and pKa values are shown in Figure 2.
Ammonium acetate, monobasic sodium phosphate and ammonium formate buffer systems were
investigated to separate the local anesthetics. Figure 1 illustrates a representative
electropherogram where the analytes were separated in formate buffer containing 33.3 mM
MβCD. Ammonium formate at pH 2 was found to provide the sharpest peaks with the best
chiral resolution of the single chiral analyte, prilocaine. Acidic pH was found to provide
improved CE separations because it was able to ionize the basic analytes. It was noticed that CE
resolution increased with decreasing pH. Some of the peaks were partially overlapped and base
line resolution of all the peaks was not achieved until we went down to pH 2. At pH 2, the
electroosmotic flow (EOF) is almost totally suppressed, the analytes are all positively charged
and the neutral CD’s are almost immobile. The uncomplexed positively charged analyte moves
toward the cathodic end (detector end) by its own native electrophoretic velocity. The greater the
interaction with the CD the longer the migration time of the analyte [21].
MβCD, heptakis-di-o-methyl and tri-o-methyl-β-CD were studied over the concentration
range of 10-80 mM. The relationship between the migration time and the CD concentration was
linear over the range from 15-65 mM. All three CD’s were able to separate the six analytes.
However, base line resolution of the enantiomers of prilocaine was achieved when using heptakis
di-o-methyl-β-CD and MβCD at concentrations greater than 50 mM.

130
Calculation of the local anesthetic-CD interaction by CE and ESI-MS
To determine the extent of complexation or association between the CD selector and the analyte
(local anesthetic) in the solution phase, the association constant (K) was determined. K values
were calculated using the general equation of micellar electrokinetic capillary chromatography
(MECC). This equation expresses the relationship between the apparent velocity of the complex
and the apparent velocity of the free analyte and the free CD: [22]
Vobs = Faq(Vapp.A) + Fmc(Vapp.mc) (1)
Where Vob is equal to the observed complex velocity, Vapp.A is equal to the apparent drug
velocity in the CD free buffer, Vapp.mc is equal to the apparent CD velocity in the drug free buffer
and Faq, Fmc are equal to the molar fraction factor of the free drug in solution (naq/ntotal) and drug
complexed with the CD (nmc/ntotal) respectively. The association constant (K) can be determined
using the following equation: [22]
K. C = nmc/naq (2)
Where C is the CD concentration and nmc/naq is the molar fraction of the complexed drug to the
uncomplexed drug. The following equation expresses the relationship between the net analyte
velocity (Vapp), the electrophoretic velocity (Vep), and the electroosmotic velocity (Veo): [22]
Vapp = Vep + Veo (3)
By substituting equation (2) and equation (3) into equation (1), we are able to express the
velocity of the analyte-CD complex in terms of the association constant, CD concentration and
electrophphoretic velocity of uncomplexed species: [22]
Vob = 1/1+K. C (Vep.A + Veo) + K. C/K. C + 1 (Vep.mc + Veo) (4)
Since pH 2 was used, which is low enough to suppress the electroosmotic flow by not allowing
enough deprotonation or ionization of the silinol groups that form the internal surface of the

131
capillary, the Veo term equals zero [21, 23, 24]. This condition was proven by using a neutral
marker that was not observed by the UV detector following 5 hours of analysis time. Vep.mc also
equals zero since all the CD’s used are neutral. Applying these conditions to equation (4), we
can simplify it to equation (5):
Vobs = 1/1 + K. C (Vapp.A) (5)
The relationship between the velocity and the migration time is: [22]
V = L/T (6)
Where L is the total capillary length and T is the apparent migration time. Substituting (6) into
(5) yields an equation, which relates observed migration times to CD concentration.
Tobs = Tapp.A. K. C + Tapp.A (7)
Where Tob is equal to the migration time observed in the presence of the CD, Tapp.A is equal to
the observed migration time in the absence of the CD.
By plotting the Tobs on the y-axis versus C in the x-axis and by dividing the slope by
Tapp.A we were able to calculate the association constant values (K) for all the local anesthetics
with the CD’s. The results are shown in Table 1. In ESI-MS the extent of complexation can be
determined by calculating the CD fraction complexed with the analyte by measuring the ratio of
CD-analyte complex peak height to the sum of the complexed and the free CD (Rms) [4, 5]:
Rms = CD-analyte complex peak height / CD-analyte complex peak height + free CD peak
height. Higher Rms values indicate stronger analyte-CD association, therefore Rm is a measure of
the strength of the association.
Mass Spectrometry Data
MβCD and heptakis di-methoxy-β-CD have a distribution of peaks in the mass spectrum
separated by 14 mass units difference representing different degrees of substitution of the methyl

132
groups. Each CD-analyte complex peak height was divided by the corresponding free CD peak
height and the average for each set was used to calculate Rms. The standard conditions to
compare complex intensities of different analytes would be to apply the same CD with all the
analytes in the same injection, thus creating a competitive environment for the different
substrates to compete for binding to the CD each according to its own relative affinity.
Unfortunately, lidocaine (235.5 Da) and meprylcaine (236.5 Da) have almost the same molecular
weight differing by one mass unit. Furthermore, prilocaine (221.5 Da) is 14 mass units lower
than lidocaine which is the exact mass difference between the peaks corresponding to the degree
of methylation of the CD. It was therefore, not possible to measure Rms values for the 6 analytes
in the same injection using our quadrupole instrument, due to the overlap of the peaks in the
mass spectra. In order to simulate a partial competitive environment as much as possible, 5
injections of each analyte with the CD were run. A representative mass spectrum is shown in
Figure 3. Each injection contained dibucaine, which has the highest molecular weight and
therefore, does not overlap with any other analyte peaks, and one other local anesthetic. By
normalizing each drug complex peak intensity to the peak intensity of the dibucaine complex, it
was possible to calculate relative Rms values normalized to the dibucaine peak intensity. Each
individual injection was repeated three times and the average was considered for the data in
Tables 2 -4. The Rms data have standard deviations of less than 11% indicating the high
reproducibility of the ESI-MS data. Proparacaine, however shows a high standard deviation for
its Rms values which is most likely due to the fact that it has a relatively low affinity to the CD’s.
It is also interesting to note that the measured Rms values do not differ due to the number of
methyl side chains in the CD’S.

133
The second part of the study was to compare the relative affinities of each analyte,
separately, between the three CD’s used. The standard conditions would normally be to apply
the analyte with the three CD’s together in a single injection again creating a competitive
environment between the analytes and the CD’s. Since the mass distributions of MβCD and
heptakis-di-methoxy-β-CD were overlapping, it was not possible to create such an environment.
Again the alternative was to create a partially competitive environment where, (MβCD and
heptakis-tri-methoxy-β-CD) and (heptakis-tri and di-methoxy-β-CD) were run as separate
injections with each analyte.
By normalizing the height of MβCD-drug complex peak to the heptakis-tri-methoxy-β-
CD and doing the same to heptakis-di-methoxy-β-CD, it was possible to calculate a relative Rms
for each CD normalized to heptakis-tri-methoxy-β-CD with the heptakis-tri-methoxy-β-CD
normalized K equal to one. These normalized values are shown in Table 5.
Formation of specific local anesthetic-CD non covalent complexes:
An interesting feature of the ESI-MS binding of the analytes with the cyclodextrins is the
reproducible loss of a water molecule. This water loss is presumed to arise from displacement of
water from the CD cavity. This water loss was not observed in our earlier studies with the
bindings of barbiturates with CD’s. However, that study did not use the same CD’s and was
conducted at a much higher pH. It is not known if this loss of water is involved in the solution
state interactions between the local anesthetics and the CD’s.
All the local anesthetics chosen have structural features that favor binding with the β-CD
cavity. Previously, the formation of true host-guest inclusion complexes with β-CD had been
reported [3, 25]. As observed in this study, the presence of an additional heterocyclic moiety in
the anesthetic structure enhances the binding with the β-CD. This pattern was observed from the

134
relatively high K values for dibucaine and dyclonine, which contain pyridine and piperidine rings
respectively. The correlation between the analyte-CD complex behavior in the solution and the
gas phases was studied in two steps. First, the relative affinities of the six compounds were
compared to each CD, separately. The decremental order of the values of association constants
as calculated from the CE were, dyclonine, dibucaine, meprilcaine, prilocaine, lidocaine and
proparacaine. The complexes intensities observed in the ESI-MS for the different analytes
decreased in the same order as seen in the CE, as can be noticed from Table 1. The second part
was to study the effect of different CD’s, by comparing the relative affinities of each analyte to
three different CD’s. The general trend was that the analytes have the greatest affinity for
MβCD and the lowest for the heptakis-tri-methoxy-β-CD except for meprilcaine and prilocaine,
which have lower affinities for MβCD relative to heptakis di-methoxy-β-CD. This trend,
including the different meprilcaine and prilocaine behavior, could be observed from both the CE
data, as shown in Table 1, as well as the ESI-MS data, as shown in Table 5. A cyclodextrin that
has stronger affinity to one analyte than to another, as expressed by having higher K values in the
CE experiments still gave a more intense signal with that analyte in the ESI-MS. Furthermore,
the ESI-MS data shows that the interaction of the analytes with the CD’s was not significantly
affected by the degree of substitutions on the CD’s. This indicates that the association was due
to interaction with the CD cavity and that the number of the side chains does not affect the access
of the analyte to the CD core. These correlations suggest that the complexes detected in the ESI-
MS experiments were passed intact from the solution phase. Therefore, these complexes are
believed to represent true specific inclusions rather than false electrostatic adducts formed during
the ionization process. Due to the similarity of the behavior of these complexes in the solution
and the gas phases, it may be possible to predict the CD selector that would produce the best

135
separation for a select set of compounds depending on preliminary data obtained from the ESI-
MS. This approach would be of great advantage as finding the correct CD as this is a time
intensive process and often requires a large quantity of expensive substituted CD’s.
Conclusion:
This study suggests the formation of specific host-guest inclusions between basic local
anesthetics and CD’s, as an extension to a former study done in this lab that suggested the
formation of specific complexes between acidic barbiturates and CD’s [3]. We have shown a
direct correlation between the association constants of 6 local anesthetics with 3 different CD’s
as calculated from CE and the complexed fractions of the CD’s as calculated from the ESI-MS,
which suggests that ESI-MS can be used to evaluate solution phase noncovalent complexes. The
correlation indicates the possibility of predicting the migration order and the behavior of analyte-
CD complexes based on the data obtained from the MS. This information would make it
possible to predict the proper CD to use for a separation based on quick screening of various
CD’s using ESI-MS. It is certain that ESI-MS could be used to eliminate CD’s that showed poor
affinity for an analyte and would therefore, make a poor choice for further development in a CE
assay.
Acknowledgement
The authors wish to thank Solvay Pharmaceuticals for their financial support of this research.

136
References:
1. Selva, A.; Redenti, E.; Ventura, P.; Zanol, M.; Casetta, B. Study of β-cyclodextrin-
Ketoconazole-Tartaric Acid Multicomponenet Non-covalent Association by Positive and
Negative Ionspray Mass Spectrometry. J. Mass Spectrom. 1998, 33, 729-734.
2. Smith, R. D.; Light-Wahl, K. J. The Observation of Non-Covalent Interactions in
Solution by Electrospray Ionization Mass Spectrometry; Promise, Pitfalls and Prognosis.
Biol. Mass Spectrom. 1993, 22, 493-501.
3. Srinivasan, K.; Bartlett, M. G. Comparison of cyclodextrin-barbiturate noncovalent
complexes using electrospray ionization mass spectrometry and capillary electrophoresis.
Rapid Comm. Mass Spectrom. 2000, 14, 624-632.
4. Penn, S. G.; Goodall, D. M.; Moning, C. A.; Loran, J. S. Noncovalent complexes
formation of cyclodextrins studied by Electro Spray Ionization Mass Spectrometry.
Proceedings of the 43rd ASMS Conference on Mass Spectrometry and Allied Topics;
Atlanta, GA, 1995; p 236.
5. Gallagher, R. T.; Ball, C. P.; Gatehouse, D. R.; Gates, P. J.; Lobell, M.; Derrick, P. J.
Cyclodextrin-piroxicam inclusion complexes: analysis by mass spectrometry and
molecular modeling. Anal. Chem. 1997, 165/166, 523- 531.
6. Lu, W.; Cole, R. B. Determination of chiral pharmaceutical compounds, terbutaline
ketamine and propranolol, by on-line capillary electrophoresis-electrospray ionization
mass spectrometry. J. Chromatogr. B. 1998, 714, 69-75.
7. Cunniff, J. B.; Vouros, P. False Positives in the Detection of Cyclodextrins Inclusion
Complexes by Electrospray Mass-Spectrometry. J. Am. Soc. Mass Spectrom. 1995, 6,
437-447.

137
8. Cunniff, J. B.; Vouros, P.; Kaplan, D. L.; Fossey, S. A. The Origin and Ion of
Noncovalent Peptide Dimers Observed in Liquid Secondary-Ion Mass-Spectometry
Explained Via First-Order Gas-Phase kinetics. Biol. Mass Spectrom. 1994, 23, 741-748.
9. Ramirez, J.; He, F.; Lebrilla, C. B. Gas-Phase Chiral Differentiation of Amino Acid
Guests Cyclodextrin Hosts. J. Am. Chem. Soc. 1998, 120, 7387-7388.
10. Li, Y. T.; Hsieh, Y. L.; Henion, J. D.; O’Cain, T. D.; Sciehser, G. A.; Ganem, B.
Analysis of the energetics of Gas-Phase Immunophilin-Ligand Complexes by Ion Spray
Mass Spectrometry. J. Am. Chem. Soc. 1994, 116, 7487-7493.
11. Ramanathan, R.; Prokai, L. Electrospray Ionization Mass Spectrometric Study of
Encapsulation of Amino Acids by Cyclodextrins. J. Am. Soc. Mass Spectrom. 1995, 6,
866-871.
12. Lorenz, S. A.; Maziarz ΙΙΙ, E. P.; Wood, T. D. Using Solution Phase Hydrogen/Duterium
(H/D) Exchange to Determine the Origin of Non-Covalent Complexes Observed by
Electrospray Ionization Mass Spectrometry; in Solution or in Vacuo. J. Am. Soc. Mass
Spectrom. 2001, 12, 795-804.
13. Sun, W.; Cui, M.; Liu, S.; Song, F.; Elkin, N. Electrospray Ionization Mass Spectrometry
of Incubated Solutions and in Eluates of Gel Permeation Chromatography. Rapid Comm.
Mass Spectrom. 1998, 12, 2016-2022.
14. Amini, A.; Javerfalk, E.; Bastami, S.; Westerlund, D. Simultaneous separation and
enantioresolution of racemic local anesthetic drugs by capillary zone electrophoresis with
Tween 20 and methyl-β-cyclodextrin as selectors, employing a double plug technique.
Electrophoresis. 1999, 20 ,204-211.

138
15. Valtcheva, L.; Mohammad, J.; Pettersson, G.; Hjerten, S. Chiral Separation of Beta-
Blockers by High-Performance Capillary Electrophoresis Based on Non-Immobilized
Cellulase as Enantioselective Protein. J. Chromatogr. 1993, 638, 263-267.
16. Tanaka, Y.; Terabe, S. Partial Separation Zone Technique For The Separation of
Enantiomers by Affinity Electrokinetic Chromatography With Proteins as Chiral Pseudo-
Stationary Phases. J. Chromatogr. A. 1995, 694, 277-284.
17. Amini, A.; Paulsen-Sorman, U. Enantioseparation of local anesthetic drugs by capillary
zone electrophoresis with cyclodextrins as chiral selector using a partial filling technique.
Electrophoresis. 1997, 18, 1019-1025.
18. Amini, A.; Wiserma, B.; Westerlund, D.; Paulsen-Sorman, U. Determination of the
enantiomeric purity of S-ropivacaine by capillary electrophoresis with methyl-beta-
cyclodextrin as chiral celector using conventional and complete filling techniques. Eur.
J. Pharm. Sci. 1999, 9, 17-24.
19. Amini, A.; Petterson, C.; Westerlund, D. Enantioresolution of disopyramide by capillary
affinity electrokinetic chromatography with human α1-acid glycoprotein (AGP) as chiral
selector applying a partial filling technique. Electrophoresis. 1997, 18, 950-957.
20. Timothy, J.; Dann ΙΙΙ, C.; Brown, A. P. Separation of Enantiomers Using Vancomycin in
a Countercurrent Process by Suppression of Electroosmosis. Chirality. 1996, 8, 77-83.
21. Kuhn, R.; Stoecklin, F.; Erni, F. Chiral separations by Host-Guest Complexation With
Cyclodextrin and Crown Ether in Capillary Zone Electrophoresis. Chromatographia.
1992, 33, 32-36.
22. Camilleri, Patrick, Ed. Capillary Electrophoresis Theory and Practice. London: CRC
Press, 1993.

139
23. Chang, T. T.; Lay, J. O.; Francel, R. J. Electrokinetic Separations with Miceller solutions
and Open-Tubular Capillaries. Anal. Chem. 1984, 56, 111-113.
24. Kaneta, K.; Tanaka, S.; Taga, M.; Yoshida, H. Migration Behavior of Inorganic Anions
in Micellar Electrokinetic Capillary Chromatography Using a Cationic Surfactant. Anal.
Chem. 1992, 64, 798-801.
25. Haskins, N. J.; Saunders, M. R.; Camilleri, P. The Complexation and Chiral Selectivity
of 2-Hydroxypropyl-β-cyclodextrin with Guest Molecules as Studied by Electrospray
Mass Spectrometry. Rapid Comm. Mass Spectrom. 1994, 8, 423-426.

140
Table 1 Association constant values (K) as calculated from CE data
MβCD Heptakis-di-o-methyl-β-CD
Heptakis-tri-o-methyl-β-CD
proparacaine 1.55 0.784 0.738 lidocaine 1.82 1.16 0.779 prilocaine 1.95 1.98 0.784 meprilcaine 2.28 2.83 0.816 dibucaine 4.23 4.20 1.50 dyclonine 4.26 4.23 1.88

141
Table 2 Normalized complex intensities values (n.Rms) of the analytes with MβCD as calculated from the ESI-MS data. Note: not all data points were available due to the overlap of the signal. This is indicated by (_). All complex intensities values were normalized to the responces from dibucaine. To calculate RSD values, all the data from the three trials were considered CD proparacaine lidocaine prilocaine meprilcaine dibucaine dyclonine m/z m/z n.Rms m/z n.Rms m/z n.Rms m/z n.Rms m/z n.Rms m/z n.Rms 1376 1653 0.806 1593 0.705 1579 0.773 1594 0.913 1702 1 1648 _
1390 1667 0.370 1607 0.763 1593 0.835 1608 0.901 1716 1 1662 2.624 1404 1681 0.545 1621 0.748 1607 0.877 1622 0.847 1730 1 1676 2.528 1418 1695 0.432 1635 0.713 1621 0.879 1636 0.974 1744 1 1690 _
avg 0.538 0.732 0.841 0.909 1 2.576 RSD 35.79 4.66 7.69 7.833 1 1.86
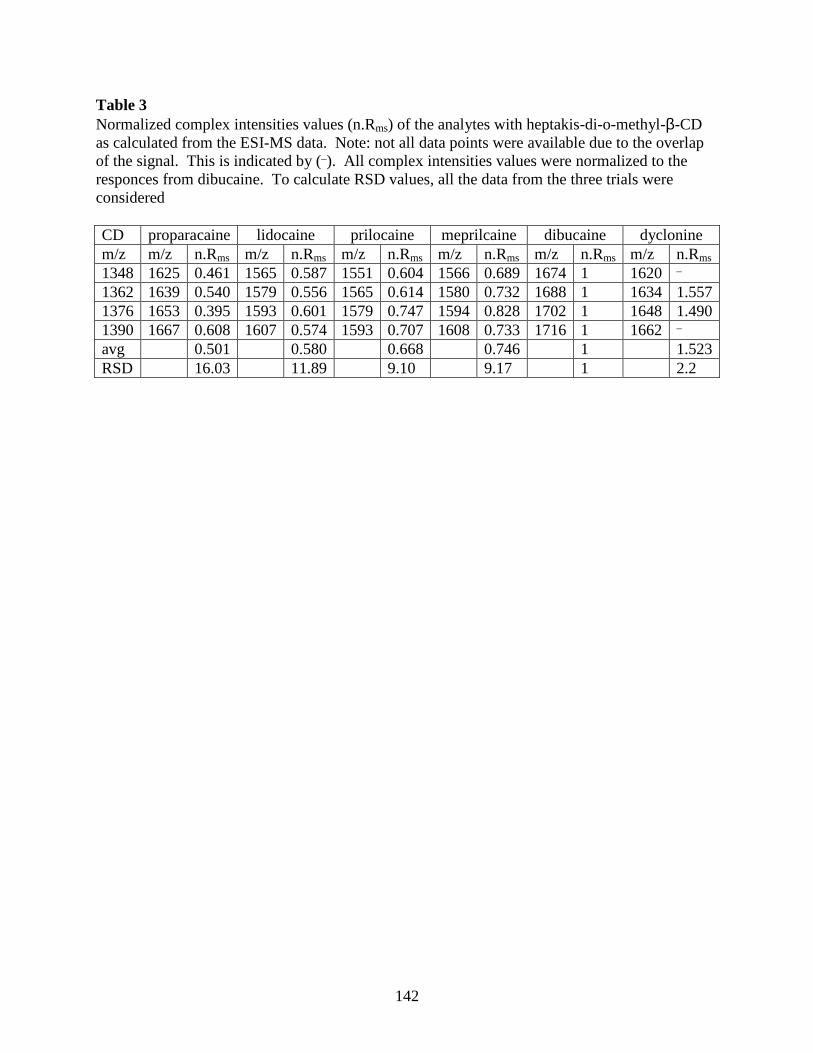
142
Table 3 Normalized complex intensities values (n.Rms) of the analytes with heptakis-di-o-methyl-β-CD as calculated from the ESI-MS data. Note: not all data points were available due to the overlap of the signal. This is indicated by (_). All complex intensities values were normalized to the responces from dibucaine. To calculate RSD values, all the data from the three trials were considered CD proparacaine lidocaine prilocaine meprilcaine dibucaine dyclonine m/z m/z n.Rms m/z n.Rms m/z n.Rms m/z n.Rms m/z n.Rms m/z n.Rms 1348 1625 0.461 1565 0.587 1551 0.604 1566 0.689 1674 1 1620 _
1362 1639 0.540 1579 0.556 1565 0.614 1580 0.732 1688 1 1634 1.557 1376 1653 0.395 1593 0.601 1579 0.747 1594 0.828 1702 1 1648 1.490 1390 1667 0.608 1607 0.574 1593 0.707 1608 0.733 1716 1 1662 _
avg 0.501 0.580 0.668 0.746 1 1.523 RSD 16.03 11.89 9.10 9.17 1 2.2

143
Table 4 Normalized complex intensities values (n.Rms) of the analytes with heptakis-tri-o-methyl-β-CD (m/z =1446) as calculated from the ESI-MS data. Note: All complex intensities values were normalized to the responces from dibucaine
proparacaine llidocaine prilocaine meprilcaine dibucaine dyclonine m/z 1723 1663 1649 1664 1772 1718 n.Rms 0.209 0.308 0.389 0.536 1 4.8

144
Table 5 Normalized association constant values of each analyte with the 3 CD’s. Note: All association constant values were normalized to the responses from heptakis-tri-o-methyl-β-CD.
MβCD Heptakis-di-o-methyl-β-CD
Heptakis-tri-o-methyl-β-CD
proparacaine 13.59 8.91 1 lidocaine 25.37 11.02 1 prilocaine 4.80 5.19 1 meprilcaine 8.83 9.16 1 dibucaine 9.27 7.64 1 dyclonine 2.86 2.69 1
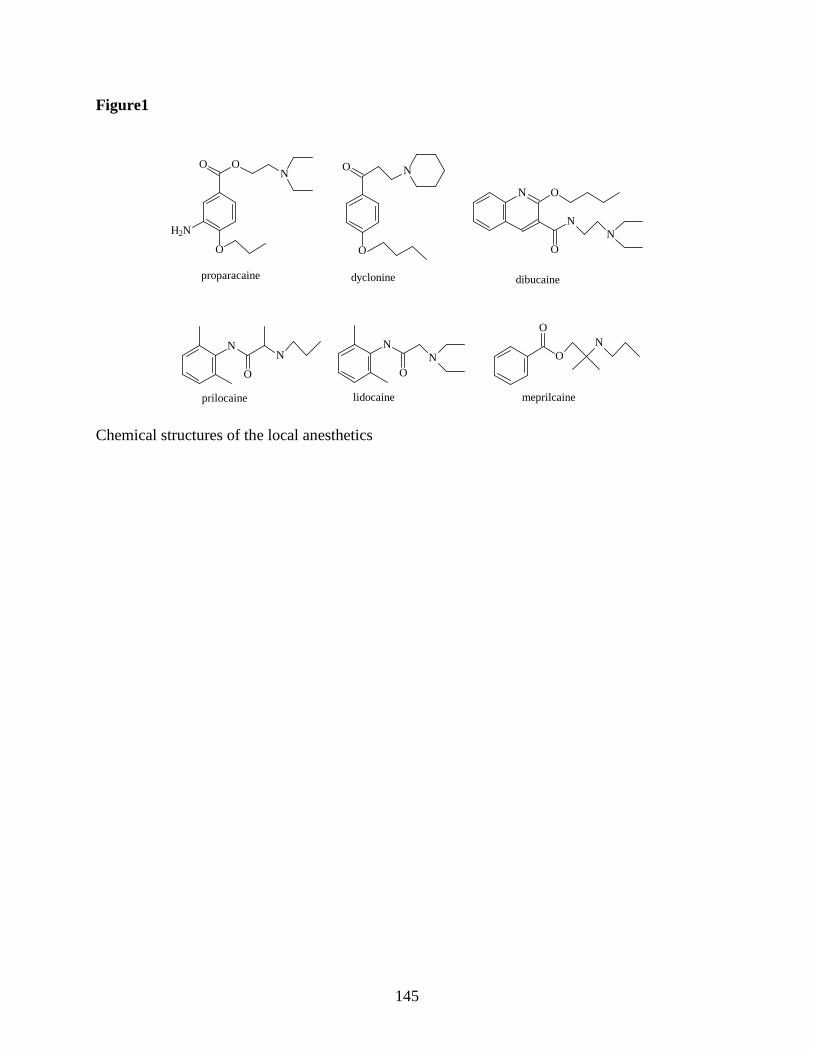
145
Figure1 Chemical structures of the local anesthetics
O ON
O
H2N
proparacaine
O N
O
dyclonine
N O
O
NN
dibucaine
N
O
N
prilocaine
N
ON
lidocaine
O
ON
meprilcaine

146
Figure 2
Typical electropherogram showing the resolution of the six local anesthetics, proparacaine (11.14), lidocaine (16.68), prilocaine (17.44), meprilcaine (18.62), lidocaine (20.20) and dyclonine (23.36), on a 50 cm, 75 µm uncoated silica capillary. The buffer contained 33.3 mM MβCD in 100 mM ammonium formate buffer (pH 2) with detection at 254 nm. The separation voltage was 15 kV.

147
Figure 3
Mass spectrum of a mixture of prilocaine, dibucaine and MβCD in 100 mM ammonium formate buffer (pH 2). The peaks marked “A” represent signals from free MβCD. The peaks marked “P” represent CD-prilocaine complexes and the peaks marked “D” represent various CD-dibucaine complexes.
1300 1350 1400 1450 1500 1550 1600 1650 1700 1750m/z0
100
%
D.4D
.3D.2
D.1
P.4P
.3P.2
P.1
A.4
A.3
A.2
A.1

148
Figure 4 The correlation between the association constant values (K) of the analytes with, A: heptakis-tri-o-methyl-β-CD, B: heptakis-di-o-methyl-β-CD, C: MβCD, as calculated from the CE and the ESI-MS data.
0
0.2
0.4
0.6
0.8
1
1.2
0 1 2 3MS
CE
(A)
0
0.2
0.4
0.6
0.8
1
1.2
1.4
0 2 4 6MS
CE
(C)
0
0.5
1
1.5
0 0.5 1 1.5 2
MS
CE
(B)

149
Figure 5 The correlation between the association constant values (K) of each CD with, A: proparacaine, B: lidocaine, C: prilocaine, D: meprilcaine, E: dibucaine, F: dyclonine, as calculated from the ESI-MS and the CE data.
00.5
11.5
22.5
0 1 2 3 4
MS
CE
(C)
0
1
2
3
0 2 4 6
MS
CE
(A)
(D)
0
1
2
3
0 2 4 6
MS
CE
0
1
2
3
4
0 2 4 6 8 10
MS
CE
(E)
00.5
11.5
22.5
0 1 2 3 4
MS
CE
(F)
0
1
2
3
4
0 2 4 6 8 10
MS
CE
(B)