the anatomy of starburst galaxies: sub-arcsecond mid-infrared observations
DESCRIPTION
The anatomy of starburst galaxies: sub-arcsecond mid-infrared observations. Lijiang August 15, 2005. SCUBA 850 µm. Understanding starforming galaxies. Can starbursts be scaled up? Clustered vs. extended star formation, dense vs. diffuse gas Use of “direct” diagnostics: - PowerPoint PPT PresentationTRANSCRIPT

Paul van derder Werf & Leonie Snijders
Leiden Observatory
The anatomy of starburst galaxies:The anatomy of starburst galaxies:sub-arcsecond mid-infrared observationssub-arcsecond mid-infrared observations
LijiangLijiang
August 15, August 15, 20052005

Sub-arcsecond mid-infrared observations of starburst galaxiesSub-arcsecond mid-infrared observations of starburst galaxies 2
Understanding starforming galaxiesUnderstanding starforming galaxies
(Webb & Van der Werf in preparation)(Webb & Van der Werf in preparation)
SCUBA 850 µmSCUBA 850 µm
Can starbursts be scaled up?Can starbursts be scaled up?
Clustered Clustered vs.vs. extended star extended star formation, formation, dense dense vs.vs. diffuse gas diffuse gas
Use of “direct” diagnostics: Use of “direct” diagnostics: hot dust continuum, hot dust continuum,
PAH emission, ionic linesPAH emission, ionic lines

Sub-arcsecond mid-infrared observations of starburst galaxiesSub-arcsecond mid-infrared observations of starburst galaxies 3
NGC 4038/4039
Orion (M42) 30 Doradus
NGC 4038/4039 detail
Superstarclusters:Superstarclusters:does size matter?does size matter?
NGC4038/4039 NGC4038/4039 cluster: ≈ 100 pccluster: ≈ 100 pc
Orion: ≈ 1.5 pc Orion: ≈ 1.5 pc

Sub-arcsecond mid-infrared observations of starburst galaxiesSub-arcsecond mid-infrared observations of starburst galaxies 4
Starformation efficiencyStarformation efficiency
Starbursts cannotStarbursts cannot be simply scaled be simply scaled up.up.
More intense More intense starbursts starbursts are also more are also more efficientefficient with their fuel.with their fuel.
(Gao & Solomon 2001)
LLIRIR SFR SFR
LLIRIR//LLCOCO
SFR/SFR/MMHH22
SFESFE
2
1FIR
H
1
1
1
ULIGs: 39
Milky Way: 4
Galactic GMCs: 7
Orion core: 40
LL M
M
L M
L M
L M
−
−
−
−
e e
e e
e e
e e
:
:
:
:

Sub-arcsecond mid-infrared observations of starburst galaxiesSub-arcsecond mid-infrared observations of starburst galaxies 5
SCUBASCUBA850 850 mm
Dense Dense vsvs. diffuse gas: the Antennae. diffuse gas: the Antennae
SPIFI/JCMTSPIFI/JCMT(Isaak, Papadopoulos, Van der Werf, Gao (Isaak, Papadopoulos, Van der Werf, Gao in prep.in prep.))
[C[CII] widespread, CO ] widespread, CO JJ=7=76 isolated!6 isolated!
[CI]
CO J=76
Sub-arcsecond mid-infrared observations of starburst galaxiesSub-arcsecond mid-infrared observations of starburst galaxies 6
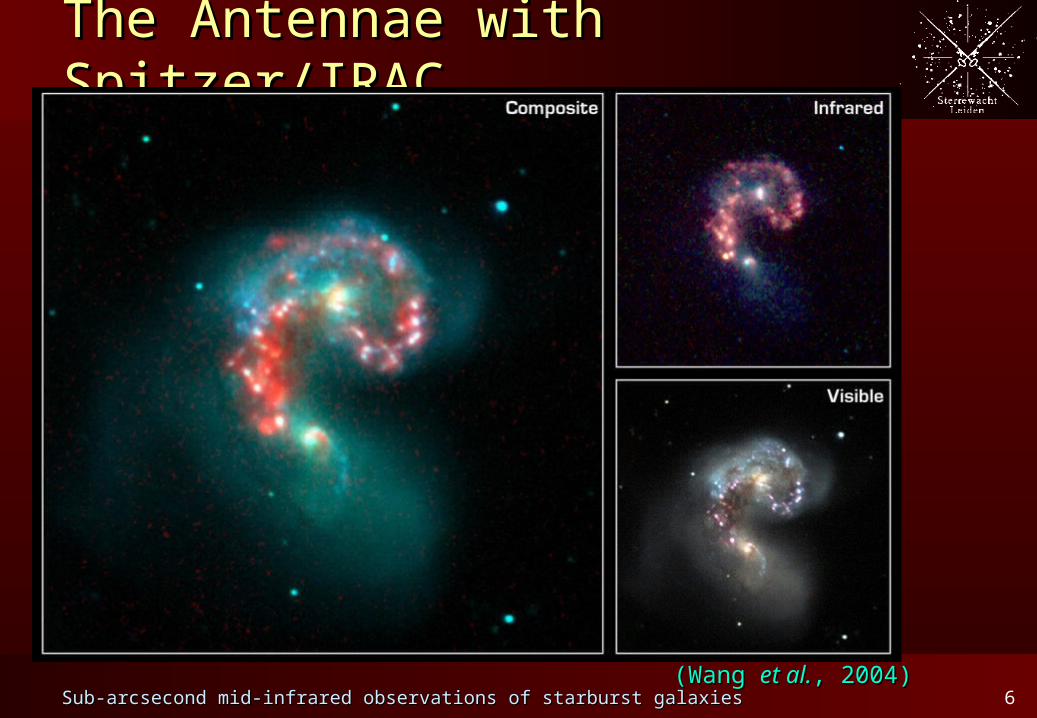
The Antennae with Spitzer/IRACThe Antennae with Spitzer/IRAC
(Wang (Wang et al.et al., 2004), 2004)

Sub-arcsecond mid-infrared observations of starburst galaxiesSub-arcsecond mid-infrared observations of starburst galaxies 7
Mid-infrared diagnosticsMid-infrared diagnostics fine-structure fine-structure
lines: lines: TTeffeff of of radiation field, radiation field, abundances, abundances, nnee
PAH features: PAH features: UV-irradiated UV-irradiated dustdust
hot dust hot dust continuumcontinuum
HH22 lines: warm lines: warm molecular gasmolecular gas
silicate features: silicate features: foreground foreground absorptionabsorption
Antennae Eastern clusterSpitzer/IRS 5 slit)(courtesy B. Brandl)
Ground-based N-band
Sub-arcsecond mid-infrared observations of starburst galaxiesSub-arcsecond mid-infrared observations of starburst galaxies 8
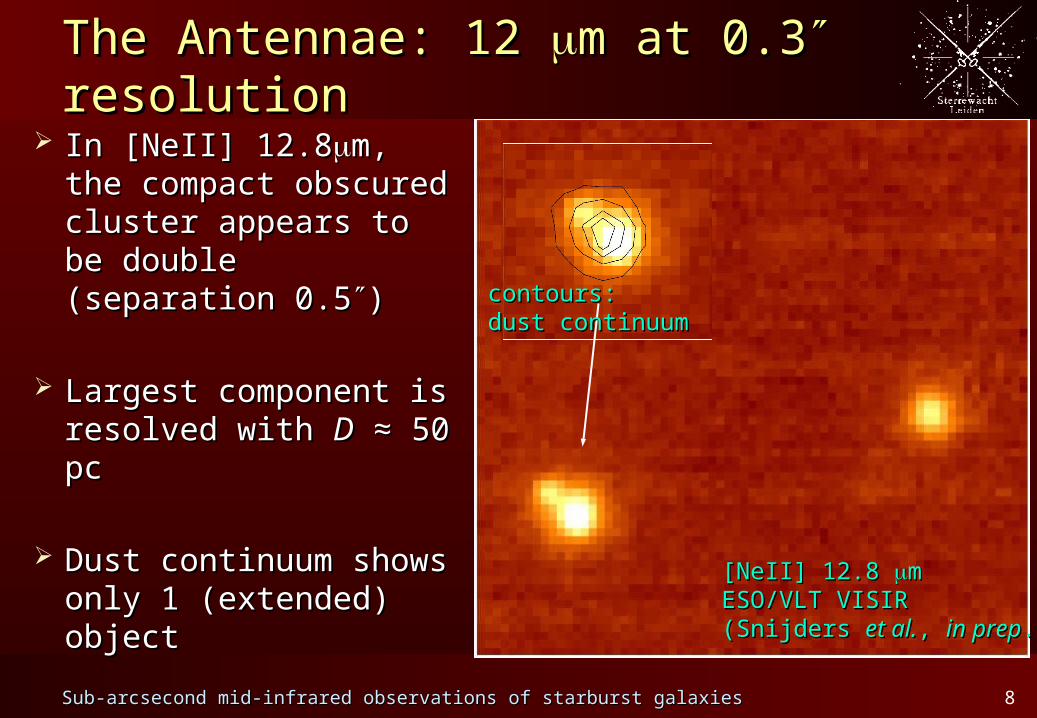
The Antennae: 12 The Antennae: 12 m at 0.3m at 0.3 resolution resolution
In [NeII] 12.8In [NeII] 12.8m, the m, the compact obscured compact obscured cluster appears to be cluster appears to be double (separation double (separation 0.50.5))
Largest component is Largest component is resolved with resolved with DD ≈ 50 ≈ 50 pcpc
Dust continuum shows Dust continuum shows only 1 (extended) only 1 (extended) objectobject
[NeII] 12.8 [NeII] 12.8 mmESO/VLT VISIRESO/VLT VISIR(Snijders (Snijders et al.et al., , in prepin prep.).)
contours: contours: dust continuumdust continuum

Sub-arcsecond mid-infrared observations of starburst galaxiesSub-arcsecond mid-infrared observations of starburst galaxies 9
Comparison with stellar lightComparison with stellar light
Ks-band (2.2 Ks-band (2.2 m) shows m) shows no evidence of no evidence of substructure or a 2substructure or a 2ndnd component:component:
strong and variable strong and variable obscurationobscuration
Ks-band, seeing 0.4Ks-band, seeing 0.4ESO/VLT ISAACESO/VLT ISAAC(Mengel (Mengel et al.et al., 2002), 2002)

Sub-arcsecond mid-infrared observations of starburst galaxiesSub-arcsecond mid-infrared observations of starburst galaxies 10
VISIR N-band spectra of the Antennae clustersVISIR N-band spectra of the Antennae clusters
Continuum is compactContinuum is compact: ≈ 50% : ≈ 50% of Spitzer/IRS continuum (5of Spitzer/IRS continuum (5 slit) detected in 0.6slit) detected in 0.6 VISIR slit VISIR slit
PAH emission is extendedPAH emission is extended: very : very low equivalent widths in VISIR low equivalent widths in VISIR slitslit
Line ratios [NeIII]/[NeII] and Line ratios [NeIII]/[NeII] and [SIV]/[NeII] increase in smaller [SIV]/[NeII] increase in smaller slits: sample compact high slits: sample compact high excitation regionsexcitation regions
[ArIII] [SIV]
[NeII]
PAH 11.3 m

Sub-arcsecond mid-infrared observations of starburst galaxiesSub-arcsecond mid-infrared observations of starburst galaxies 11
Photoionization analysisPhotoionization analysis Assuming abundances, Assuming abundances,
ionic lines with different ionic lines with different ionization potentials ionization potentials probe the probe the TTeffeff of the of the ionizing radiation fieldionizing radiation field
Complication: theoretical Complication: theoretical O-star spectra differ O-star spectra differ widely in EUVwidely in EUV
Also: density (pressure) Also: density (pressure) dependence because of dependence because of different critical densitiesdifferent critical densities
(Morisset (Morisset et al.et al., 2004), 2004)

Sub-arcsecond mid-infrared observations of starburst galaxiesSub-arcsecond mid-infrared observations of starburst galaxies 12
Diagnostic line ratios (Eastern cluster)Diagnostic line ratios (Eastern cluster)
Density estimates:Density estimates: lower limit from radio lower limit from radio
continuum (continuum (DD=70 pc =70 pc homogeneous sphere): homogeneous sphere): nnee=360 =360 cmcm–3–3
near-IR [FeIII] line ratios: near-IR [FeIII] line ratios: nnee=3000–10000 cm=3000–10000 cm–3–3
TTe e ≈ 10≈ 104 4 K K P/k P/k ≈ 3≈ 3··101077–10–1088 K cm K cm––
33
TTeffeff ≈ 46000 K ≈ 46000 KO3 stars (assuming Hillier & O3 stars (assuming Hillier &
Miller 1998, Pauldrach Miller 1998, Pauldrach et alet al., ., 2001 O-star spectra)2001 O-star spectra)
age ≈ 1 Myrage ≈ 1 Myr(Dopita (Dopita et alet al.,., in prep in prep.).)

Sub-arcsecond mid-infrared observations of starburst galaxiesSub-arcsecond mid-infrared observations of starburst galaxies 13
The role of dustThe role of dust Ionization parameter Ionization parameter
For solar abundances, log For solar abundances, log UU > –2.0 implies substantial (>50%) > –2.0 implies substantial (>50%) absorption of UV-photons by dust in stead of hydrogen (Dopita absorption of UV-photons by dust in stead of hydrogen (Dopita et alet al., 2003).., 2003).
In this case, log In this case, log U U > –2.0 if > –2.0 if RR < 20 pc: very likely < 20 pc: very likely
Confirmed by observed Confirmed by observed LLFIRFIR//LLBrBr
Dust-dominated HII regions Dust-dominated HII regions diagnostics like EW(Brdiagnostics like EW(Br) for age problematic) for age problematic
Calculate number of O3-stars from IR-luminosity: 1000 O3 starsCalculate number of O3-stars from IR-luminosity: 1000 O3 stars
24e
QU
n R cπ=

Sub-arcsecond mid-infrared observations of starburst galaxiesSub-arcsecond mid-infrared observations of starburst galaxies 14
Starformation efficiency revisitedStarformation efficiency revisited
Extreme Extreme starbursts are more starbursts are more efficient with their efficient with their fuel, with the entire fuel, with the entire molecular ISM molecular ISM forming stars.forming stars.
(Gao & Solomon 2001)
LLIRIR SFR SFR
LLIRIR//LLCOCO
SFR/SFR/MMHH22
SFESFE
2
1FIR
H
1
1
1
1
ULIGs: 39
Milky Way: 4
Galactic GMCs: 7
Orion core: 40
Antennae cluster: 3
LL M
M
L M
L M
L M
L M
−
−
−
−
−
e e
e e
e e
e e
e e
:
:
:
:
:Antennaecluster
Although the Antennae Although the Antennae clusters are extreme, an clusters are extreme, an extreme starburst is not simply extreme starburst is not simply a collection of 1000 of these.a collection of 1000 of these.

Sub-arcsecond mid-infrared observations of starburst galaxiesSub-arcsecond mid-infrared observations of starburst galaxies 15
Under pressure: extreme starburstsUnder pressure: extreme starbursts Star formation in the Antennae appears to occur in a two-phase Star formation in the Antennae appears to occur in a two-phase
medium, with the star formation occurring in the dense phase.medium, with the star formation occurring in the dense phase. In extreme starbursts such as ULIGs, the dense phase is In extreme starbursts such as ULIGs, the dense phase is
dominant (or the diffuse phase may be completely absent). dominant (or the diffuse phase may be completely absent). Pressure effect?Pressure effect?
Confirming observation 1: Confirming observation 1: CO 6–5/[CI] in Mrk 231 is high, CO 6–5/[CI] in Mrk 231 is high, comparable to the eastern cluster in the Antennae (Isaak, comparable to the eastern cluster in the Antennae (Isaak, Papadopoulos & Van der Werf, in preparation)Papadopoulos & Van der Werf, in preparation)..
Confirming observation 2: in ULIGs, recombination lines are Confirming observation 2: in ULIGs, recombination lines are always very faint compared to far-IR flux density; always very faint compared to far-IR flux density; LLFIRFIR//LLBrBr is high. is high.
star formation in ULIGs is dominated by compact HII regions.star formation in ULIGs is dominated by compact HII regions. dense phase is dominant (diffuse phase absent?). dense phase is dominant (diffuse phase absent?).
Extreme starbursts are characterized by high pressures!Extreme starbursts are characterized by high pressures!

Sub-arcsecond mid-infrared observations of starburst galaxiesSub-arcsecond mid-infrared observations of starburst galaxies 16
ConclusionsConclusions Hot dust continuum traces principally Hot dust continuum traces principally very recentvery recent star star
formation and is therefore a poor tracer of formation and is therefore a poor tracer of globalglobal star star formation.formation.
PAH emission is a better tracer of global star formation but its PAH emission is a better tracer of global star formation but its use as a quantitative diagnostic is not yet established.use as a quantitative diagnostic is not yet established.
Mid-infrared line ratios depend strongly on aperture, and Mid-infrared line ratios depend strongly on aperture, and hence need high spatial resolution.hence need high spatial resolution.
Extreme and compact starburst regions such as the Antennae Extreme and compact starburst regions such as the Antennae obscured superstarclusters are dust-dominated. Likely, this is obscured superstarclusters are dust-dominated. Likely, this is generally true in extreme starbursts such as ULIGs.generally true in extreme starbursts such as ULIGs.
At the young inferred ages, a At the young inferred ages, a -function starburst is probably -function starburst is probably a poor model; also, spatial substructure in the a poor model; also, spatial substructure in the superstarcluster must be taken into account.superstarcluster must be taken into account.
Extreme starbursts cannot be constructed by adding up Extreme starbursts cannot be constructed by adding up smaller starbursts; smaller starbursts; extreme starbursts are characterized by extreme starbursts are characterized by high pressureshigh pressures. .