the analysis of financial statementss3.amazonaws.com/f01.justanswer.com/modelmillie/... · the...
TRANSCRIPT

The Analysis ofFinancial Statements
6The Analysis of
Financial StatementsRatios are tools, and their value is limited when used alone. The more tools used, thebetter the analysis. For example, you can’t use the same golf club for every shot andexpect to be a good golfer. The more you practice with each club, however, the betterable you will be to gauge which club to use on one shot. So too, we need to be skilled
with the financial tools we use.—DIANNE MORRISON
Chief Executive Officer, R.E.C. Inc.
C H A P T E R
192
The preceding chapters have covered in detail the form and content of the four basicfinancial statements found in the annual reports of U.S. firms: the balance sheet, theincome statement, the statement of stockholders’ equity, and the statement of cashflows; and Chapter 5 presented an in-depth approach to evaluating the quality ofreported financial statement information. This chapter will develop tools and tech-niques for the interpretation of financial statement information.
Objectives of AnalysisBefore beginning the analysis of any firm’s financial statements, it is necessary to spec-ify the objectives of the analysis. The objectives will vary depending on the perspectiveof the financial statement user and the specific questions that are addressed by theanalysis of the financial statement data.
A creditor is ultimately concerned with the ability of an existing or prospectiveborrower to make interest and principal payments on borrowed funds. The questionsraised in a credit analysis should include:
• What is the borrowing cause? What do the financial statements reveal about thereason a firm has requested a loan or the purchase of goods on credit?
• What is the firm’s capital structure? How much debt is currently outstanding?How well has debt been serviced in the past?
Understanding Financial Statements,Eighth Edition, by Lyn M. Fraser and Aileen Ormiston. Published by Prentice Hall. Copyright © 2007 by Pearson Education, Inc.
ISB
N: 0-536-48044-3

CHAPTER 6 The Analysis of Financial Statements 193
• What will be the source of debt repayment? How well does the company manageworking capital? Is the firm generating cash from operations?
The credit analyst will use the historical record of the company, as presented in thefinancial statements, to answer such questions and to predict the potential of the firmto satisfy future demands for cash, including debt service.
The investor attempts to arrive at an estimation of a company’s future earningsstream in order to attach a value to the securities being considered for purchase orliquidation. The investment analyst poses such questions as:
• What is the company’s performance record, and what are the future expectations?What is its record with regard to growth and stability of earnings? Of cash flowfrom operations?
• How much risk is inherent in the firm’s existing capital structure? What are theexpected returns, given the firm’s current condition and future outlook?
• How successfully does the firm compete in its industry, and how well positioned isthe company to hold or improve its competitive position?
The investment analyst also uses historical financial statement data to forecast thefuture. In the case of the investor, the ultimate objective is to determine whether theinvestment is sound.
Financial statement analysis from the standpoint of management relates to all ofthe questions raised by creditors and investors because these user groups must be sat-isfied in order for the firm to obtain capital as needed. Management must also considerits employees, the general public, regulators, and the financial press. Managementlooks to financial statement data to determine:
• How well has the firm performed and why? What operating areas havecontributed to success and which have not?
• What are the strengths and weaknesses of the company’s financial position?• What changes should be implemented in order to improve future performance?
Financial statements provide insight into the company’s current status and leadto the development of policies and strategies for the future. It should be pointedout, however, that management also has responsibility for preparing the financialstatements. The analyst should be alert to the potential for management to influencethe outcome of financial statement reporting in order to appeal to creditors,investors, and other users. It is important that any analysis of financial statementsinclude a careful reading of the notes to the financial statements, and it may be help-ful to supplement the analysis with other material in the annual report and withother sources of information apart from the annual report.
Sources of InformationThe financial statement user has access to a wide range of data sources in the analysisof financial statements. The objective of the analysis will dictate to a considerabledegree not only the approach taken in the analysis but also the particular resourcesthat should be consulted in a given circumstance.The beginning point, however, should
Understanding Financial Statements,Eighth Edition, by Lyn M. Fraser and Aileen Ormiston. Published by Prentice Hall. Copyright © 2007 by Pearson Education, Inc.
ISB
N:
0-53
6-48
044-
3
194 CHAPTER 6 The Analysis of Financial Statements
always be the financial statements themselves and the notes to the financial state-ments. In addition, the analyst will want to consider the following resources.
Proxy StatementThe proxy statement, discussed in Chapter 1, contains useful information about theboard of directors, director and executive compensation, option grants, audit-relatedmatters, related party transactions, and proposals to be voted on by shareholders.
Auditor’s ReportThe report of the independent auditor contains the expression of opinion as to the fair-ness of the financial statement presentation. Most auditor’s reports are unqualified,which means that in the opinion of the auditor the financial statements present fairlythe financial position, the results of operations, and the cash flows for the periods cov-ered by the financial statements.A qualified report, an adverse opinion, or a disclaimerof opinion, is rare and therefore suggests that a careful evaluation of the firm be made.An unqualified opinion with explanatory language should be reviewed carefully by theanalyst. In addition, the analyst should read the report and certification regarding theeffectiveness of the internal controls over financial reporting.
Management Discussion and AnalysisThe Management Discussion and Analysis of the Financial Condition and Results ofOperations, discussed in Chapter 1, is a section of the annual report that is requiredand monitored by the Securities and Exchange Commission (SEC). In this section,management presents a detailed coverage of the firm’s liquidity, capital resources, andoperations. The material can be especially helpful to the financial analyst because itincludes facts and estimates not found elsewhere in the annual report. For example,this report is expected to cover forward-looking information such as projections ofcapital expenditures and how such investments will be financed. There is detail aboutthe mix of price relative to volume increases for products sold. Management must dis-close any favorable or unfavorable trends and any significant events or uncertaintiesthat relate to the firm’s historical or prospective financial condition and operations.
Supplementary SchedulesCertain supplementary schedules are required for inclusion in an annual report andare frequently helpful to the analysis. For example, companies that operate in severalunrelated lines of business provide a breakdown of key financial figures by operatingsegment. (The analysis of segmental data is covered in the appendix to this chapter.)
Form 10-K and Form 10-QForm 10-K is an annual document filed with the SEC by companies that sell securities tothe public and contains much of the same information as the annual report issued toshareholders. It also shows additional detail that may be of interest to the financial ana-lyst, such as schedules listing information about management, a description of materiallitigation and governmental actions, and elaborations of some financial statement disclo-sures. Form 10-Q, a less extensive document, provides quarterly financial information.
Understanding Financial Statements,Eighth Edition, by Lyn M. Fraser and Aileen Ormiston. Published by Prentice Hall. Copyright © 2007 by Pearson Education, Inc.
ISB
N: 0-536-48044-3

CHAPTER 6 The Analysis of Financial Statements 195
1One resource that is commonly available in both public and academic libraries is the Infotrak—GeneralBusiness Index. This CD-ROM database provides indexing to approximately 800 business, trade, andmanagement journals; it has company profiles, investment analyst reports, and a wide range of businessnews. To learn about the availability and use of this system or other search systems and databases, consultthe library’s reference librarian or the business reference librarian.
Both reports, as well as other SEC forms filed by companies, are available through theSEC Electronic Data Gathering,Analysis, and Retrieval (EDGAR) database.
Other SourcesThere is a considerable body of material outside of the corporate annual report thatcan contribute to an analysis of financial statements. Most academic libraries and manypublic libraries have available computerized search systems and computerized data-bases that can greatly facilitate financial analysis.1 Although not a replacement for thetechniques that are discussed in this chapter, these research materials supplement andenhance the analytical process as well as provide time-saving features. Computerizedfinancial statement analysis packages are also available that perform some of the ratiocalculations and other analytical tools described in this chapter. (See the financialstatement analysis template available at www.prenhall.com/fraser.)
Other general resources useful as aids in the analysis of financial statements can befound in the general reference section of public and university libraries. The followingsources provide comparative statistical ratios to help determine a company’s relativeposition within its industry:
1. Dun & Bradstreet Information Services, Industry Norms and Key Business Ratios.Murray Hill, NJ.
2. The Risk Management Association, Annual Statement Studies. Philadelphia, PA.3. Standard & Poor’s Corporation, Ratings Handbook and Industry Surveys. New
York, NY.4. Gale Research Inc., Manufacturing U.S.A. Industry Analyses. Detroit, MI.
When analyzing a company it is also important to review the annual reports ofsuppliers, customers, and competitors of that company. The bankruptcy of a suppliercould affect the firm’s supply of raw materials, while the bankruptcy of a customercould negatively impact the collection of accounts receivable and future sales.Knowing how one company compares financially to its competitors, and understandingother factors such as innovation and customer service provided by the competitionallows for a better analysis to predict the future prospects of the firm.
Additional resources for comparative and other information about companies canbe found on the following free Internet sites:2
1. Yahoo!, http://finance.yahoo.com/2. Market Watch, www.marketwatch.com3. Reuters, www.investor.reuters.com
Many other Internet sites charge subscription fees to access information, butpublic and university libraries often subscribe, making this information free to thepublic. Libraries are currently in the process of converting information from hard
2Internet sites are constantly changing; therefore, the content and Web addresses may change after publicationof this book.
Understanding Financial Statements,Eighth Edition, by Lyn M. Fraser and Aileen Ormiston. Published by Prentice Hall. Copyright © 2007 by Pearson Education, Inc.
ISB
N:
0-53
6-48
044-
3
196 CHAPTER 6 The Analysis of Financial Statements
copy format to online databases; the following useful references may be available ata local library:
1. Moody’s Investor Service, Mergent Manuals and Mergent Handbook. New York,NY. (Formerly Moody’s Manuals and Handbook. The online version is MergentFIS Online and Mergent Industry Surveys Disc.)
2. Standard & Poor’s Corporation, Corporation Records, The Outlook, StockReports, and Stock Guide. New York, NY. (The online version is Standard andPoor’s Net Advantage.)
3. Value Line, Inc., The Value Line Investment Survey. New York, NY (www.valueline.com).
4. Zack’s Investment Research Inc., Earnings Forecaster. Chicago, IL (www.zacks.com).
5. Gale Research Inc., Market Share Reporter. Detroit, MI.6. Dow Jones-Irwin, The Financial Analyst’s Handbook. Homewood, IL.7. For mutual funds: Morningstar, Morningstar Mutual Funds. Chicago, IL. (www.
morningstar.com).
The following Web sites contain useful investment and financial information includ-ing company profile and stock prices; some sites charge fees for certain information:
1. SEC EDGAR Database, www.sec.gov/edgarhp.htm2. Hoover’s Corporate Directory, www.hoovers.com/3. Dun & Bradstreet, www.dnb.com/4. Standard & Poor’s Ratings Services, www.standardpoor.com/ratings/5. CNN Financial Network, www.money.cnn/
Articles from current periodicals such as BusinessWeek, Forbes, Fortune, and theWall Street Journal can add insight into the management and operations of individualfirms as well as provide perspective on general economic and industry trends. Thefinancial analysis described in this chapter should be used in the context of the eco-nomic and political environment in which the company operates. Reading about theeconomy regularly in business publications allows the analyst to assess the impact ofunemployment, inflation, interest rates, gross domestic product, productivity, and othereconomic indicators on the future potential of particular firms and industries.
Tools and TechniquesVarious tools and techniques are used by the financial statement analyst in order toconvert financial statement data into formats that facilitate the evaluation of a firm’sfinancial condition and performance, both over time and in comparison with industrycompetitors. These include common-size financial statements, which express eachaccount on the balance sheet as a percentage of total assets and each account on theincome statement as a percentage of net sales; financial ratios, which standardize finan-cial data in terms of mathematical relationships expressed in the form of percentagesor times; trend analysis, which requires the evaluation of financial data over severalaccounting periods; structural analysis, which looks at the internal structure of a busi-ness enterprise; industry comparisons, which relate one firm with averages compiledfor the industry in which it operates; and most important of all, common sense and
Understanding Financial Statements,Eighth Edition, by Lyn M. Fraser and Aileen Ormiston. Published by Prentice Hall. Copyright © 2007 by Pearson Education, Inc.
ISB
N: 0-536-48044-3

CHAPTER 6 The Analysis of Financial Statements 197
judgment. These tools and techniques will be illustrated by walking through a financialstatement analysis of R.E.C. Inc. This first part will cover number crunching—thecalculation of key financial ratios. The second part will provide the integration of thesenumbers with other information—such as the statement of cash flows from Chapter 4and background on the economy and the environment in which the firm operates—inorder to perform an analysis of R.E.C. Inc. over a five-year period and to assess thefirm’s strengths, weaknesses, and future prospects.
Common-Size Financial StatementsCommon-size financial statements were covered in Chapters 2 and 3. Exhibits 2.2 (p. 47)and 3.3 (p. 90) present the common-size balance sheet and common-size income state-ment, respectively, for R.E.C. Inc. The information from these statements presented inprior chapters is summarized again, and will be used in the comprehensive analysis illus-trated in this chapter.
From the common-size balance sheet in Exhibit 2.2, it can be seen that inventorieshave become more dominant over the five-year period in the firm’s total asset struc-ture and in 2007 comprised almost half (49.4%) of total assets. Holdings of cash andmarketable securities have decreased from a 20% combined level in 2003 and 2004 toabout 10% in 2007. The company has elected to make this shift in order to accommo-date the inventory requirements of new store openings. The firm has opened 43 newstores in the past two years, and the effect of this market strategy is also reflected in theoverall asset structure. Buildings, leasehold improvements, equipment, and accumu-lated depreciation and amortization have increased as a percentage of total assets. Onthe liability side, the proportion of debt required to finance investments in assets hasrisen, primarily from long-term borrowing.
The common-size income statement shown in Exhibit 3.3 reveals the trends ofexpenses and profit margins. Cost of goods sold has increased slightly in percentageterms, resulting in a small decline in the gross profit percentage.To improve this margin,the firm will either have to raise its own retail prices, change the product mix, or figureways to reduce costs on goods purchased for resale. In the area of operating expenses,depreciation and amortization have increased relative to sales, again reflecting costsassociated with new store openings. Selling and administrative expenses rose in 2005,but the company controlled these costs more effectively in 2006 and 2007 relative tooverall sales. Operating and net profit percentages will be discussed more extensively inconnection with the five-year trends of financial ratios later in the chapter. It can beseen from the common-size income statements that both profit percentages deterio-rated through 2006 and rebounded in the most recent year as R.E.C. Inc. enjoyed thebenefits of an economic recovery and profits from expansion.
Key Financial RatiosThe R.E.C. Inc. financial statements will be used to compute a set of key financial ratiosfor the years 2007 and 2006. Later in the chapter, these ratios will be evaluated in thecontext of R.E.C. Inc.’s five-year historical record and in comparison with industry com-petitors.The four categories of ratios to be covered are (1) liquidity ratios, which measurea firm’s ability to meet cash needs as they arise; (2) activity ratios, which measure the liq-uidity of specific assets and the efficiency of managing assets; (3) leverage ratios, which
Understanding Financial Statements,Eighth Edition, by Lyn M. Fraser and Aileen Ormiston. Published by Prentice Hall. Copyright © 2007 by Pearson Education, Inc.
ISB
N:
0-53
6-48
044-
3
198 CHAPTER 6 The Analysis of Financial Statements
3Analysts sometimes use an average number in the denominator of ratios that have a balance sheet accountin the denominator. This is preferable when the company’s balance sheet accounts vary significantly fromone year to the next. The illustrations in this chapter do not use an average number in the denominator.
measure the extent of a firm’s financing with debt relative to equity and its ability tocover interest and other fixed charges; and (4) profitability ratios, which measure theoverall performance of a firm and its efficiency in managing assets, liabilities, and equity.
Before delving into the R.E.C. Inc. financial ratios, it is important to introduce a wordof caution in the use of financial ratios generally. Although extremely valuable as analyti-cal tools, financial ratios also have limitations.They can serve as screening devices, indicateareas of potential strength or weakness, and reveal matters that need further investigation.But financial ratios do not provide answers in and of themselves, and they are not predic-tive. Financial ratios should be used with caution and common sense, and they should beused in combination with other elements of financial analysis. It should also be noted thatthere is no one definitive set of key financial ratios, there is no uniform definition for allratios,and there is no standard that should be met for each ratio.Finally, there are no “rulesof thumb”that apply to the interpretation of financial ratios.Each situation should be eval-uated within the context of the particular firm, industry, and economic environment.3
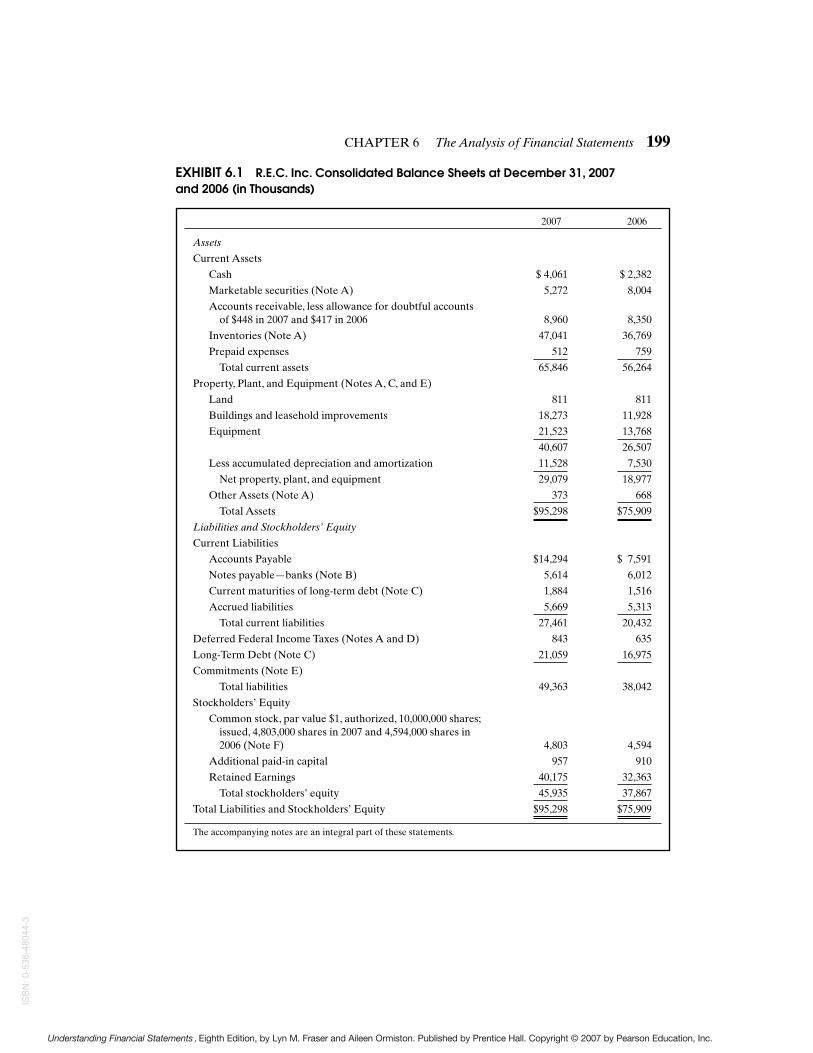
Figures from the R.E.C. Inc. Consolidated Balance Sheets, Statements of Earnings,and Statements of Cash Flows, Exhibits 6.1 (pp. 199–200) and 6.2 (p. 217), are used toillustrate the calculation of financial ratios for 2007 and 2006, and these financial ratioswill subsequently be incorporated into a five-year analysis of the firm.
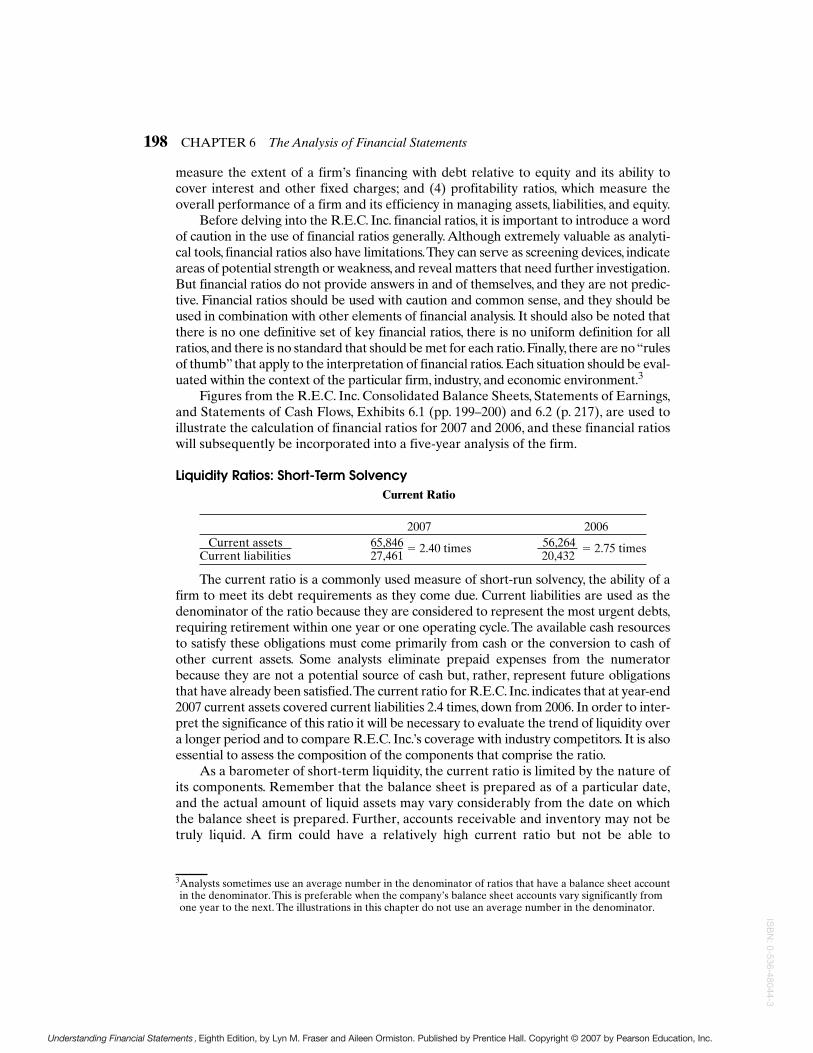
Liquidity Ratios: Short-Term SolvencyCurrent Ratio
2007 2006Current assets 65,846 � 2.40 times 56,264 � 2.75 times
Current liabilities 27,461 20,432
The current ratio is a commonly used measure of short-run solvency, the ability of afirm to meet its debt requirements as they come due. Current liabilities are used as thedenominator of the ratio because they are considered to represent the most urgent debts,requiring retirement within one year or one operating cycle.The available cash resourcesto satisfy these obligations must come primarily from cash or the conversion to cash ofother current assets. Some analysts eliminate prepaid expenses from the numeratorbecause they are not a potential source of cash but, rather, represent future obligationsthat have already been satisfied.The current ratio for R.E.C. Inc. indicates that at year-end2007 current assets covered current liabilities 2.4 times, down from 2006. In order to inter-pret the significance of this ratio it will be necessary to evaluate the trend of liquidity overa longer period and to compare R.E.C. Inc.’s coverage with industry competitors. It is alsoessential to assess the composition of the components that comprise the ratio.
As a barometer of short-term liquidity, the current ratio is limited by the nature ofits components. Remember that the balance sheet is prepared as of a particular date,and the actual amount of liquid assets may vary considerably from the date on whichthe balance sheet is prepared. Further, accounts receivable and inventory may not betruly liquid. A firm could have a relatively high current ratio but not be able to
Understanding Financial Statements,Eighth Edition, by Lyn M. Fraser and Aileen Ormiston. Published by Prentice Hall. Copyright © 2007 by Pearson Education, Inc.
ISB
N: 0-536-48044-3
CHAPTER 6 The Analysis of Financial Statements 199
EXHIBIT 6.1 R.E.C. Inc. Consolidated Balance Sheets at December 31, 2007and 2006 (in Thousands)
2007 2006
Assets
Current Assets
Cash $ 4,061 $ 2,382
Marketable securities (Note A) 5,272 8,004
Accounts receivable, less allowance for doubtful accounts of $448 in 2007 and $417 in 2006 8,960 8,350
Inventories (Note A) 47,041 36,769
Prepaid expenses 512 759
Total current assets 65,846 56,264
Property, Plant, and Equipment (Notes A, C, and E)
Land 811 811
Buildings and leasehold improvements 18,273 11,928
Equipment 21,523 13,768
40,607 26,507
Less accumulated depreciation and amortization 11,528 7,530
Net property, plant, and equipment 29,079 18,977
Other Assets (Note A) 373 668
Total Assets $95,298 $75,909
Liabilities and Stockholders’ Equity
Current Liabilities
Accounts Payable $14,294 $ 7,591
Notes payable—banks (Note B) 5,614 6,012
Current maturities of long-term debt (Note C) 1,884 1,516
Accrued liabilities 5,669 5,313
Total current liabilities 27,461 20,432
Deferred Federal Income Taxes (Notes A and D) 843 635
Long-Term Debt (Note C) 21,059 16,975
Commitments (Note E)
Total liabilities 49,363 38,042
Stockholders’ Equity
Common stock, par value $1, authorized, 10,000,000 shares;issued, 4,803,000 shares in 2007 and 4,594,000 shares in 2006 (Note F) 4,803 4,594
Additional paid-in capital 957 910
Retained Earnings 40,175 32,363
Total stockholders’ equity 45,935 37,867
Total Liabilities and Stockholders’ Equity $95,298 $75,909
The accompanying notes are an integral part of these statements.
Understanding Financial Statements,Eighth Edition, by Lyn M. Fraser and Aileen Ormiston. Published by Prentice Hall. Copyright © 2007 by Pearson Education, Inc.
ISB
N:
0-53
6-48
044-
3
200 CHAPTER 6 The Analysis of Financial Statements
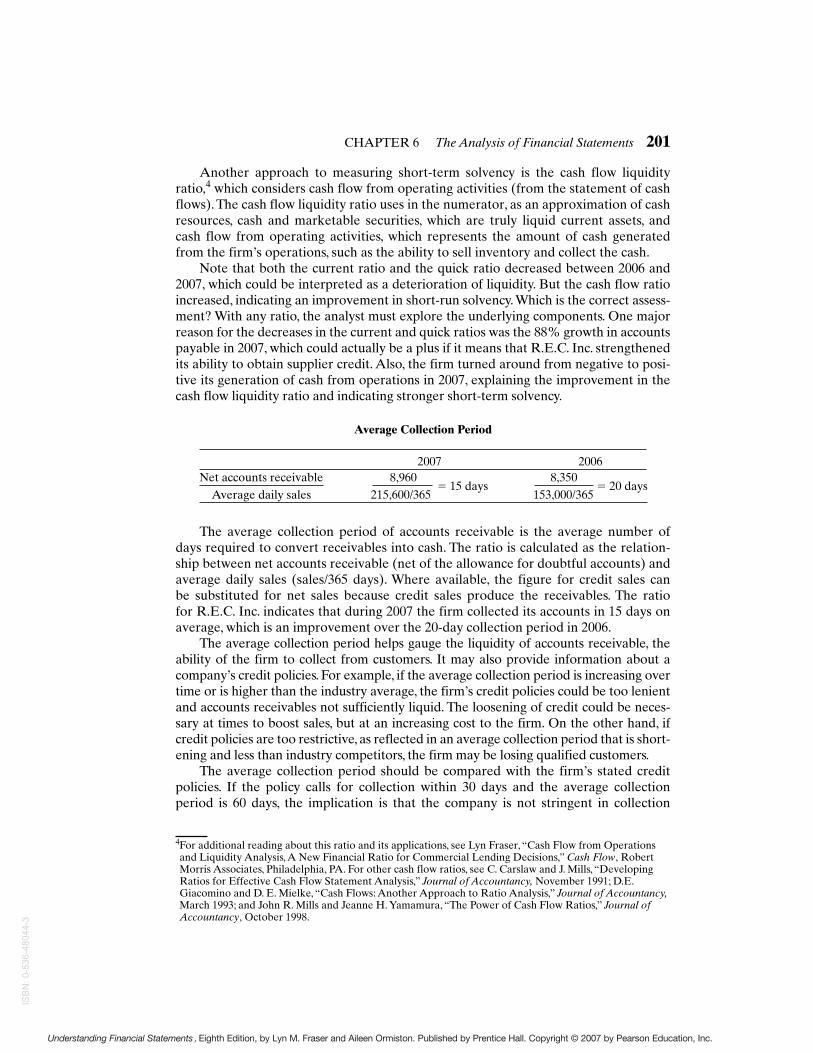
meet demands for cash because the accounts receivable are of inferior quality or theinventory is salable only at discounted prices. It is necessary to use other measures ofliquidity, including cash flow from operations and other financial ratios that rate theliquidity of specific assets, to supplement the current ratio.
Quick or Acid-Test Ratio
2007 2006Current assets � Inventory 65,846 � 47,041 � .68 times 56,264 � 36,769 � .95 times
Current liabilities 27,461 20,432
The quick or acid-test ratio is a more rigorous test of short-run solvency than the cur-rent ratio because the numerator eliminates inventory, considered the least liquid currentasset and the most likely source of losses. Like the current ratio and other ratios, there arealternative ways to calculate the quick ratio. Some analysts eliminate prepaid expensesand supplies (if carried as a separate item) from the numerator.The quick ratio for R.E.C.Inc. indicates some deterioration between 2006 and 2007; this ratio must also be examinedin relation to the firm’s own trends and to other firms operating in the same industry.
Cash Flow Liquidity Ratio
2007 2006Cash � Marketable securities � CFO* 4,061 � 5,272 � 10,024 � .70 times 2,382 � 8,004 � (3,767) � .32 timesCurrent liabilities 27,461 20,432
*Cash flow from operating activities.
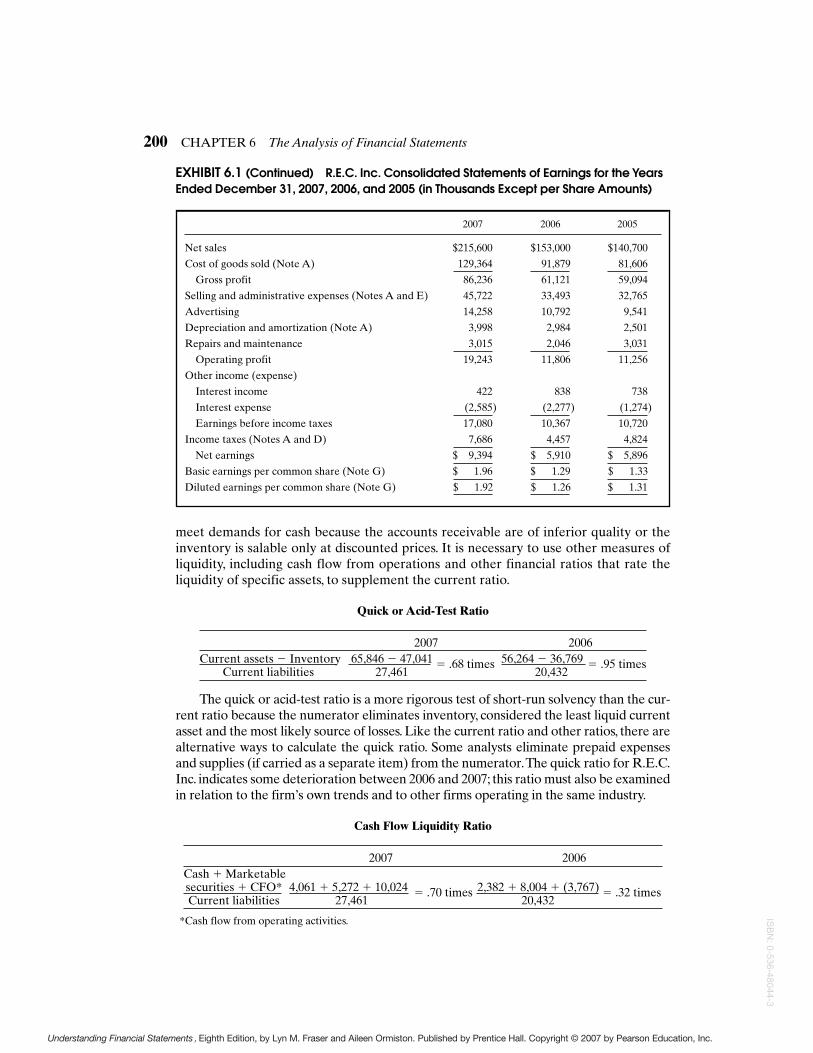
2007 2006 2005
Net sales $215,600 $153,000 $140,700
Cost of goods sold (Note A) 129,364 91,879 81,606
Gross profit 86,236 61,121 59,094
Selling and administrative expenses (Notes A and E) 45,722 33,493 32,765
Advertising 14,258 10,792 9,541
Depreciation and amortization (Note A) 3,998 2,984 2,501
Repairs and maintenance 3,015 2,046 3,031
Operating profit 19,243 11,806 11,256
Other income (expense)
Interest income 422 838 738
Interest expense (2,585) (2,277) (1,274)
Earnings before income taxes 17,080 10,367 10,720
Income taxes (Notes A and D) 7,686 4,457 4,824
Net earnings $ 9,394 $ 5,910 $ 5,896
Basic earnings per common share (Note G) $ 1.96 $ 1.29 $ 1.33
Diluted earnings per common share (Note G) $ 1.92 $ 1.26 $ 1.31
EXHIBIT 6.1 (Continued) R.E.C. Inc. Consolidated Statements of Earnings for the YearsEnded December 31, 2007, 2006, and 2005 (in Thousands Except per Share Amounts)
Understanding Financial Statements,Eighth Edition, by Lyn M. Fraser and Aileen Ormiston. Published by Prentice Hall. Copyright © 2007 by Pearson Education, Inc.
ISB
N: 0-536-48044-3
CHAPTER 6 The Analysis of Financial Statements 201
4For additional reading about this ratio and its applications, see Lyn Fraser, “Cash Flow from Operationsand Liquidity Analysis, A New Financial Ratio for Commercial Lending Decisions,” Cash Flow, RobertMorris Associates, Philadelphia, PA. For other cash flow ratios, see C. Carslaw and J. Mills, “DevelopingRatios for Effective Cash Flow Statement Analysis,” Journal of Accountancy, November 1991; D.E.Giacomino and D. E. Mielke, “Cash Flows: Another Approach to Ratio Analysis,” Journal of Accountancy,March 1993; and John R. Mills and Jeanne H. Yamamura, “The Power of Cash Flow Ratios,” Journal ofAccountancy, October 1998.
Another approach to measuring short-term solvency is the cash flow liquidityratio,4 which considers cash flow from operating activities (from the statement of cashflows). The cash flow liquidity ratio uses in the numerator, as an approximation of cashresources, cash and marketable securities, which are truly liquid current assets, andcash flow from operating activities, which represents the amount of cash generatedfrom the firm’s operations, such as the ability to sell inventory and collect the cash.
Note that both the current ratio and the quick ratio decreased between 2006 and2007, which could be interpreted as a deterioration of liquidity. But the cash flow ratioincreased, indicating an improvement in short-run solvency. Which is the correct assess-ment? With any ratio, the analyst must explore the underlying components. One majorreason for the decreases in the current and quick ratios was the 88% growth in accountspayable in 2007, which could actually be a plus if it means that R.E.C. Inc. strengthenedits ability to obtain supplier credit. Also, the firm turned around from negative to posi-tive its generation of cash from operations in 2007, explaining the improvement in thecash flow liquidity ratio and indicating stronger short-term solvency.
Average Collection Period
2007 2006Net accounts receivable 8,960 8,350
Average daily sales 215,600/365 � 15 days
153,000/365� 20 days
The average collection period of accounts receivable is the average number ofdays required to convert receivables into cash. The ratio is calculated as the relation-ship between net accounts receivable (net of the allowance for doubtful accounts) andaverage daily sales (sales/365 days). Where available, the figure for credit sales canbe substituted for net sales because credit sales produce the receivables. The ratiofor R.E.C. Inc. indicates that during 2007 the firm collected its accounts in 15 days onaverage, which is an improvement over the 20-day collection period in 2006.
The average collection period helps gauge the liquidity of accounts receivable, theability of the firm to collect from customers. It may also provide information about acompany’s credit policies. For example, if the average collection period is increasing overtime or is higher than the industry average, the firm’s credit policies could be too lenientand accounts receivables not sufficiently liquid. The loosening of credit could be neces-sary at times to boost sales, but at an increasing cost to the firm. On the other hand, ifcredit policies are too restrictive, as reflected in an average collection period that is short-ening and less than industry competitors, the firm may be losing qualified customers.
The average collection period should be compared with the firm’s stated creditpolicies. If the policy calls for collection within 30 days and the average collectionperiod is 60 days, the implication is that the company is not stringent in collection
Understanding Financial Statements,Eighth Edition, by Lyn M. Fraser and Aileen Ormiston. Published by Prentice Hall. Copyright © 2007 by Pearson Education, Inc.
ISB
N:
0-53
6-48
044-
3
202 CHAPTER 6 The Analysis of Financial Statements
efforts. There could be other explanations, however, such as temporary problems dueto a depressed economy. The analyst should attempt to determine the cause of a ratiothat is too long or too short.
Another factor for consideration is the strength of the firm within its industry.Thereare circumstances that would enable a company in a relatively strong financial positionwithin its industry to extend credit for longer periods than weaker competitors.
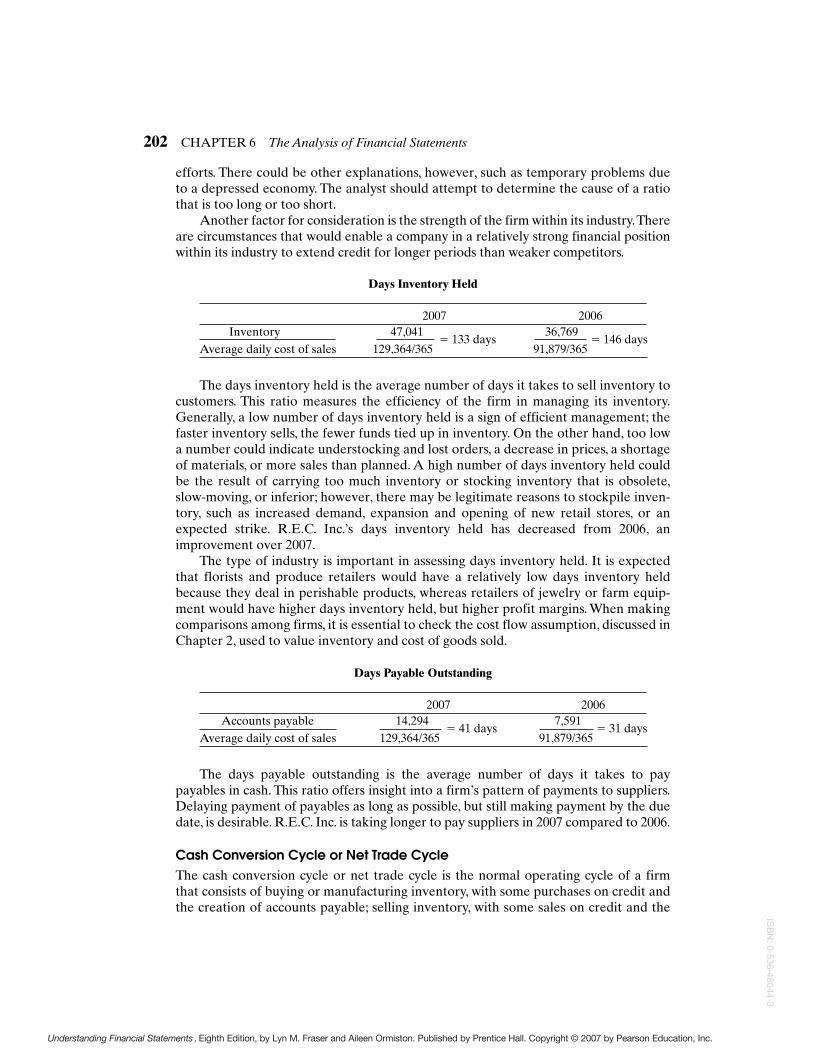
Days Inventory Held
2007 2006Inventory 47,041 36,769
Average daily cost of sales 129,364/365� 133 days
91,879/365� 146 days
The days inventory held is the average number of days it takes to sell inventory tocustomers. This ratio measures the efficiency of the firm in managing its inventory.Generally, a low number of days inventory held is a sign of efficient management; thefaster inventory sells, the fewer funds tied up in inventory. On the other hand, too lowa number could indicate understocking and lost orders, a decrease in prices, a shortageof materials, or more sales than planned. A high number of days inventory held couldbe the result of carrying too much inventory or stocking inventory that is obsolete,slow-moving, or inferior; however, there may be legitimate reasons to stockpile inven-tory, such as increased demand, expansion and opening of new retail stores, or anexpected strike. R.E.C. Inc.’s days inventory held has decreased from 2006, animprovement over 2007.
The type of industry is important in assessing days inventory held. It is expectedthat florists and produce retailers would have a relatively low days inventory heldbecause they deal in perishable products, whereas retailers of jewelry or farm equip-ment would have higher days inventory held, but higher profit margins. When makingcomparisons among firms, it is essential to check the cost flow assumption, discussed inChapter 2, used to value inventory and cost of goods sold.
Days Payable Outstanding
2007 2006Accounts payable 14,294 7,591
Average daily cost of sales 129,364/365� 41 days
91,879/365� 31 days
The days payable outstanding is the average number of days it takes to paypayables in cash. This ratio offers insight into a firm’s pattern of payments to suppliers.Delaying payment of payables as long as possible, but still making payment by the duedate, is desirable. R.E.C. Inc. is taking longer to pay suppliers in 2007 compared to 2006.
Cash Conversion Cycle or Net Trade CycleThe cash conversion cycle or net trade cycle is the normal operating cycle of a firmthat consists of buying or manufacturing inventory, with some purchases on credit andthe creation of accounts payable; selling inventory, with some sales on credit and the
Understanding Financial Statements,Eighth Edition, by Lyn M. Fraser and Aileen Ormiston. Published by Prentice Hall. Copyright © 2007 by Pearson Education, Inc.
ISB
N: 0-536-48044-3

CHAPTER 6 The Analysis of Financial Statements 203
creation of accounts receivable; and collecting the cash. The cash conversion cyclemeasures this process in number of days and is calculated as follows for R.E.C. Inc.:
2007 2006Average collection period 15 days 20 days
plusDays inventory held 133 days 146 days
minusDays payable outstanding (41 days) (33 days)
equalsCash conversion or net trade cycle 107 days 133 days
The cash conversion cycle helps the analyst understand why cash flow generation hasimproved or deteriorated by analyzing the key balance sheet accounts—accounts receiv-able, inventory, and accounts payable—that affect cash flow from operating activities.R.E.C. Inc. has improved its cash conversion cycle by improving collection of accountsreceivable, moving inventory faster, and taking longer to pay accounts payable. Despitethis improvement, the firm has a mismatching of cash inflows and outflows since it takes148 days to sell inventory and collect the cash, yet R.E.C. Inc.’s suppliers are being paid in41 days. As mentioned previously, the company opened 43 new stores, and that is mostlikely the cause of the high level of inventory. In the future, R.E.C. Inc. should be able toimprove further the days inventory held and the cash conversion cycle.
Activity Ratios: Asset Liquidity, Asset Management EfficiencyAccounts Receivable Turnover
2007 2006Net Sales 215,600
� 24.06 times153,000
� 18.32 timesNet accounts receivable 8,960 8,350
Inventory Turnover
2007 2006Cost of goods sold 129,364
� 2.75 times91, 879
� 2.50 timesInventory 47,041 36,769
Accounts Payable Turnover
2007 2006Cost of goods sold 129,364
� 9.05 times91,879
� 12.10 timesAccounts payable 14,294 7,591
The accounts receivable, inventory, and payables turnover ratios measure how manytimes, on average, accounts receivable are collected in cash, inventory is sold, and payablesare paid during the year. These three measures are mathematical complements to theratios that make up the cash conversion cycle, and therefore, measure exactly what the
Understanding Financial Statements,Eighth Edition, by Lyn M. Fraser and Aileen Ormiston. Published by Prentice Hall. Copyright © 2007 by Pearson Education, Inc.
ISB
N:
0-53
6-48
044-
3
204 CHAPTER 6 The Analysis of Financial Statements
average collection period, days inventory held, and days payable outstanding measure fora firm; they are merely an alternative way to look at the same information.
R.E.C. Inc. converted accounts receivable into cash 24 times in 2007, up from 18 timesin 2006. Inventory turned over 2.75 times in 2007 compared to 2.5 times in 2006, meaningthat inventory was selling slightly faster. The lower payables turnover indicates that thefirm is taking longer to repay payables.
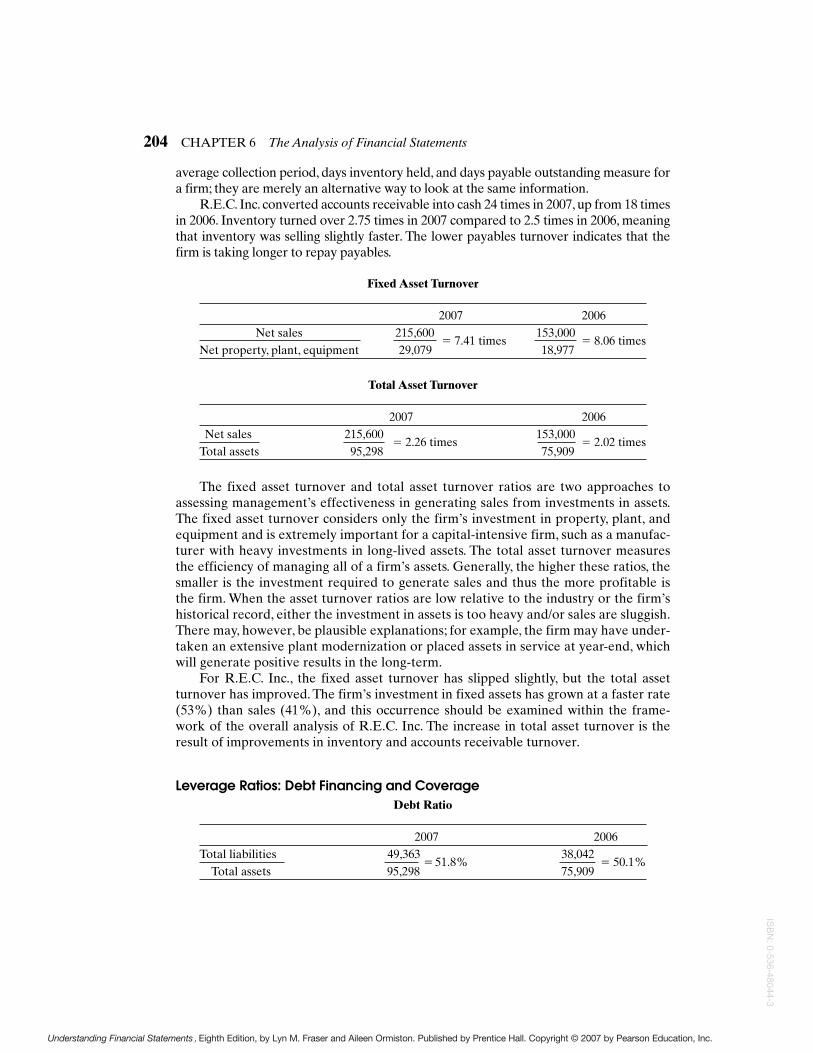
Fixed Asset Turnover
2007 2006Net sales 215,600
� 7.41 times153,000
� 8.06 timesNet property, plant, equipment 29,079 18,977
Total Asset Turnover
2007 2006Net sales 215,600
� 2.26 times153,000
� 2.02 timesTotal assets 95,298 75,909
The fixed asset turnover and total asset turnover ratios are two approaches toassessing management’s effectiveness in generating sales from investments in assets.The fixed asset turnover considers only the firm’s investment in property, plant, andequipment and is extremely important for a capital-intensive firm, such as a manufac-turer with heavy investments in long-lived assets. The total asset turnover measuresthe efficiency of managing all of a firm’s assets. Generally, the higher these ratios, thesmaller is the investment required to generate sales and thus the more profitable isthe firm. When the asset turnover ratios are low relative to the industry or the firm’shistorical record, either the investment in assets is too heavy and/or sales are sluggish.There may, however, be plausible explanations; for example, the firm may have under-taken an extensive plant modernization or placed assets in service at year-end, whichwill generate positive results in the long-term.
For R.E.C. Inc., the fixed asset turnover has slipped slightly, but the total assetturnover has improved. The firm’s investment in fixed assets has grown at a faster rate(53%) than sales (41%), and this occurrence should be examined within the frame-work of the overall analysis of R.E.C. Inc. The increase in total asset turnover is theresult of improvements in inventory and accounts receivable turnover.
Leverage Ratios: Debt Financing and CoverageDebt Ratio
2007 2006Total liabilities 49,363
� 51.8%38,042
� 50.1%Total assets 95,298 75,909
Understanding Financial Statements,Eighth Edition, by Lyn M. Fraser and Aileen Ormiston. Published by Prentice Hall. Copyright © 2007 by Pearson Education, Inc.
ISB
N: 0-536-48044-3
CHAPTER 6 The Analysis of Financial Statements 205
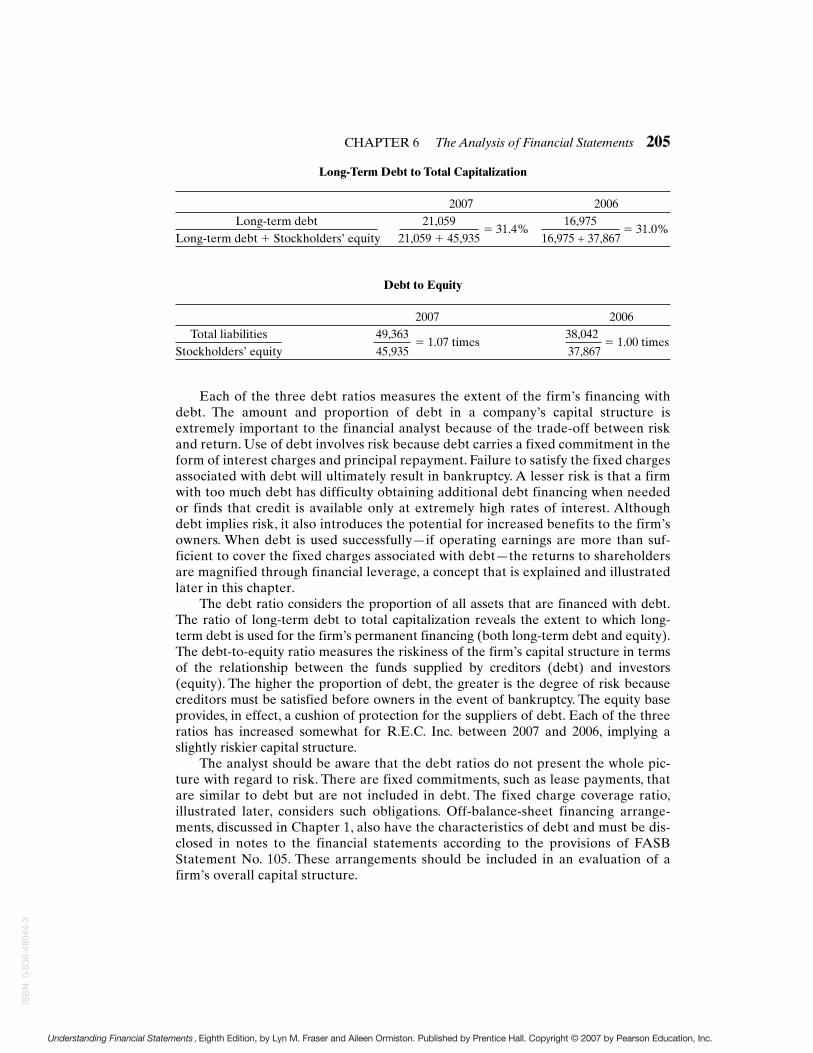
Long-Term Debt to Total Capitalization
2007 2006Long-term debt 21,059 16,975
Long-term debt � Stockholders’ equity 21,059 � 45,935� 31.4%
16,975 + 37,867� 31.0%
Debt to Equity
2007 2006Total liabilities 49,363
� 1.07 times38,042
� 1.00 timesStockholders’ equity 45,935 37,867
Each of the three debt ratios measures the extent of the firm’s financing withdebt. The amount and proportion of debt in a company’s capital structure isextremely important to the financial analyst because of the trade-off between riskand return. Use of debt involves risk because debt carries a fixed commitment in theform of interest charges and principal repayment. Failure to satisfy the fixed chargesassociated with debt will ultimately result in bankruptcy. A lesser risk is that a firmwith too much debt has difficulty obtaining additional debt financing when neededor finds that credit is available only at extremely high rates of interest. Althoughdebt implies risk, it also introduces the potential for increased benefits to the firm’sowners. When debt is used successfully—if operating earnings are more than suf-ficient to cover the fixed charges associated with debt—the returns to shareholdersare magnified through financial leverage, a concept that is explained and illustratedlater in this chapter.
The debt ratio considers the proportion of all assets that are financed with debt.The ratio of long-term debt to total capitalization reveals the extent to which long-term debt is used for the firm’s permanent financing (both long-term debt and equity).The debt-to-equity ratio measures the riskiness of the firm’s capital structure in termsof the relationship between the funds supplied by creditors (debt) and investors(equity). The higher the proportion of debt, the greater is the degree of risk becausecreditors must be satisfied before owners in the event of bankruptcy. The equity baseprovides, in effect, a cushion of protection for the suppliers of debt. Each of the threeratios has increased somewhat for R.E.C. Inc. between 2007 and 2006, implying aslightly riskier capital structure.
The analyst should be aware that the debt ratios do not present the whole pic-ture with regard to risk. There are fixed commitments, such as lease payments, thatare similar to debt but are not included in debt. The fixed charge coverage ratio,illustrated later, considers such obligations. Off-balance-sheet financing arrange-ments, discussed in Chapter 1, also have the characteristics of debt and must be dis-closed in notes to the financial statements according to the provisions of FASBStatement No. 105. These arrangements should be included in an evaluation of afirm’s overall capital structure.
Understanding Financial Statements,Eighth Edition, by Lyn M. Fraser and Aileen Ormiston. Published by Prentice Hall. Copyright © 2007 by Pearson Education, Inc.
ISB
N:
0-53
6-48
044-
3

206 CHAPTER 6 The Analysis of Financial Statements
5The amounts for interest and taxes paid are found in the supplemental disclosures on the statementof cash flows.
6The operating return, operating profit divided by assets, must exceed the cost of debt, interest expensedivided by liabilities.
Times Interest Earned
2007 2006Operating profit 19,243
� 7.4 times11,806
� 5.2 timesInterest expense 2,585 2,277
Cash Interest Coverage
2007 2006CFO � interest paid � taxes paid5 10,024 � 2,585 � 7,478
� 7.77 times(3,767)�2,277�4,321
� 1.24 timesInterest paid 2,585 2,277
In order for a firm to benefit from debt financing, the fixed interest payments thataccompany debt must be more than satisfied from operating earnings.6 The higher thetimes interest earned ratio the better; however, if a company is generating high profits,but no cash flow from operations, this ratio is misleading. It takes cash to make interestpayments! The cash interest coverage ratio measures how many times interest pay-ments can be covered by cash flow from operations before interest and taxes.AlthoughR.E.C. Inc. increased its use of debt in 2007, the company also improved its ability tocover interest payments from operating profits and cash from operations. Note thatin 2006, the firm could cover interest payments only 1.24 times due to the poor cashgenerated from operations before interest and taxes. The times interest earned ratio in2006 is somewhat misleading in this instance.
Fixed Charge Coverage
2007 2006Operating profit � Rent expense* 19,243 � 13,058
� 2.1 times11,806 � 7,111
� 2.0 timesInterest expense � Rent expense* 2,585 � 13,058 2,277 � 7,111
*Rent expense � operating lease payments
The fixed charge coverage ratio is a broader measure of coverage capability thanthe times interest earned ratio because it includes the fixed payments associated withleasing. Operating lease payments, generally referred to as rent expense in annualreports, are added back in the numerator because they were deducted as an operatingexpense to calculate operating profit. Operating lease payments are similar in natureto interest expense in that they both represent obligations that must be met on anannual basis. The fixed charge coverage ratio is important for firms that operate exten-sively with operating leases. R.E.C. Inc. experienced a significant increase in theamount of annual lease payments in 2007 but was still able to improve its fixed chargecoverage slightly.
Understanding Financial Statements,Eighth Edition, by Lyn M. Fraser and Aileen Ormiston. Published by Prentice Hall. Copyright © 2007 by Pearson Education, Inc.
ISB
N: 0-536-48044-3
CHAPTER 6 The Analysis of Financial Statements 207
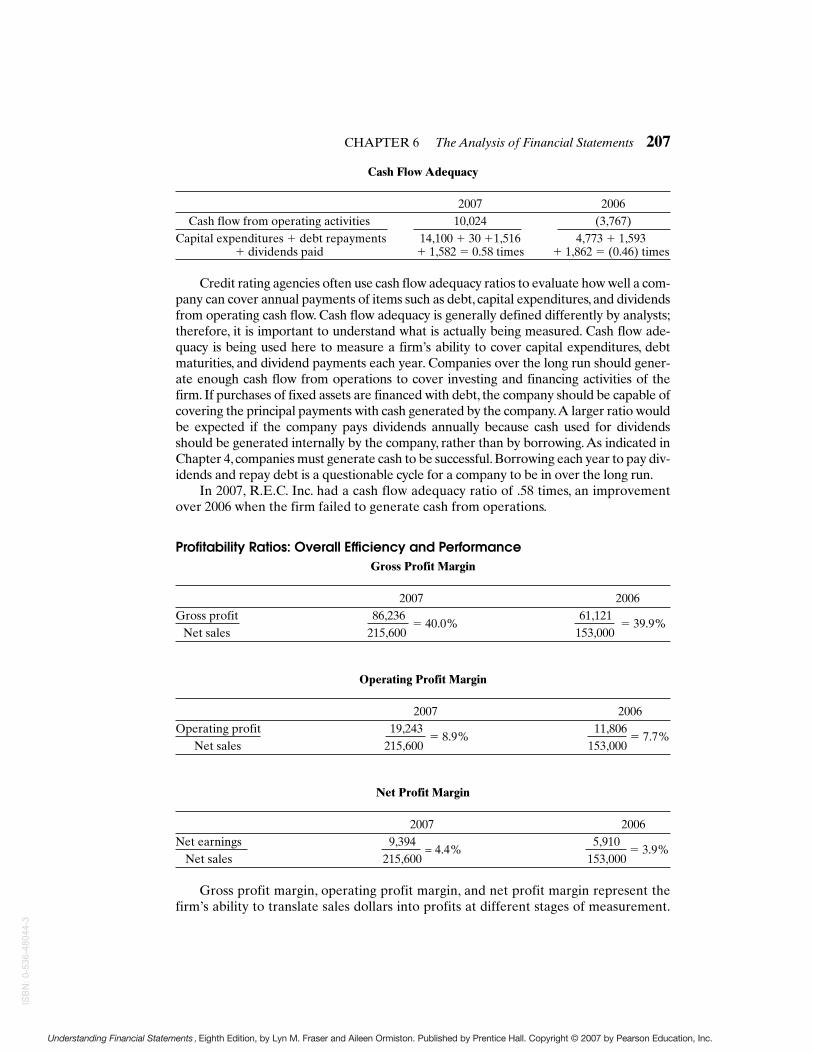
Cash Flow Adequacy
2007 2006Cash flow from operating activities 10,024 (3,767)
Capital expenditures � debt repayments 14,100 � 30 �1,516 4,773 � 1,593� dividends paid � 1,582 � 0.58 times � 1,862 � (0.46) times
Credit rating agencies often use cash flow adequacy ratios to evaluate how well a com-pany can cover annual payments of items such as debt, capital expenditures, and dividendsfrom operating cash flow. Cash flow adequacy is generally defined differently by analysts;therefore, it is important to understand what is actually being measured. Cash flow ade-quacy is being used here to measure a firm’s ability to cover capital expenditures, debtmaturities, and dividend payments each year. Companies over the long run should gener-ate enough cash flow from operations to cover investing and financing activities of thefirm. If purchases of fixed assets are financed with debt, the company should be capable ofcovering the principal payments with cash generated by the company.A larger ratio wouldbe expected if the company pays dividends annually because cash used for dividendsshould be generated internally by the company, rather than by borrowing.As indicated inChapter 4, companies must generate cash to be successful. Borrowing each year to pay div-idends and repay debt is a questionable cycle for a company to be in over the long run.
In 2007, R.E.C. Inc. had a cash flow adequacy ratio of .58 times, an improvementover 2006 when the firm failed to generate cash from operations.
Profitability Ratios: Overall Efficiency and PerformanceGross Profit Margin
2007 2006Gross profit 86,236 61,121
Net sales 215,600� 40.0%
153,000� 39.9%
Operating Profit Margin
2007 2006Operating profit 19,243 11,806
Net sales 215,600 � 8.9%
153,000 � 7.7%
Net Profit Margin
2007 2006Net earnings 9,394 5,910
Net sales 215,600= 4.4%
153,000� 3.9%
Gross profit margin, operating profit margin, and net profit margin represent thefirm’s ability to translate sales dollars into profits at different stages of measurement.
Understanding Financial Statements,Eighth Edition, by Lyn M. Fraser and Aileen Ormiston. Published by Prentice Hall. Copyright © 2007 by Pearson Education, Inc.
ISB
N:
0-53
6-48
044-
3

208 CHAPTER 6 The Analysis of Financial Statements
The gross profit margin, which shows the relationship between sales and the cost ofproducts sold, measures the ability of a company both to control costs of inventories ormanufacturing of products and to pass along price increases through sales tocustomers. The operating profit margin, a measure of overall operating efficiency,incorporates all of the expenses associated with ordinary business activities. The netprofit margin measures profitability after consideration of all revenue and expense,including interest, taxes, and nonoperating items.
There was little change in the R.E.C. Inc. gross profit margin, but the companyimproved its operating margin. Apparently, the firm was able to control the growth ofoperating expenses while sharply increasing sales. There was also a slight increase innet profit margin, a flow-through from operating margin, but it will be necessary tolook at these ratios over a longer term and in conjunction with other parts of the analy-sis to explain the changes.
Cash Flow Margin
2007 2006Cash flow from operating activities 10,024 (3,767)
Net sales 215,600� 4.6%
153,000� (2.5%)
Another important perspective on operating performance is the relationshipbetween cash generated from operations and sales. As pointed out in Chapter 4, it iscash, not accrual-measured earnings, that a firm needs to service debt, pay dividends,and invest in new capital assets. The cash flow margin measures the ability of the firmto translate sales into cash.
In 2007, R.E.C. Inc. had a cash flow margin that was greater than its net profitmargin, the result of a strongly positive generation of cash. The performance in 2007represents a solid improvement over 2006 when the firm failed to generate cash fromoperations and had a negative cash flow margin.
Return on Total Assets (ROA) or Return on Investment (ROI)
2007 2006Net earnings 9,394 5,910Total assets 95,298
� 9.9%75,909
� 7.8%
Return on Equity (ROE)
2007 2006Net earnings 9,394 5,910
Stockholders’ equity 45,935� 20.5%
37,867� 15.6%
Return on investment and return on equity are two ratios that measure the overallefficiency of the firm in managing its total investment in assets and in generating returnto shareholders. Return on investment or return on assets indicates the amount of
Understanding Financial Statements,Eighth Edition, by Lyn M. Fraser and Aileen Ormiston. Published by Prentice Hall. Copyright © 2007 by Pearson Education, Inc.
ISB
N: 0-536-48044-3

CHAPTER 6 The Analysis of Financial Statements 209
profit earned relative to the level of investment in total assets. Return on equitymeasures the return to common shareholders; this ratio is also calculated as return oncommon equity if a firm has preferred stock outstanding. R.E.C. Inc. registered a solidimprovement in 2004 of both return ratios.
Cash Return on Assets
2007 2006Cash flow from operating activities 10,024 (3,767)
Total assets 95,298 � 10.5%
75,909� (5.0%)
The cash return on assets offers a useful comparison to return on investment.Again, the relationship between cash generated from operations and an accrual-basednumber allows the analyst to measure the firm’s cash generating ability of assets. Cashwill be required for future investments.
Market RatiosFour market ratios of particular interest to the investor are earnings per commonshare, the price-to-earnings ratio, the dividend payout ratio, and dividend yield.Despite the accounting scandals, including Enron and WorldCom, that illustratedthe flaws in the earnings numbers presented to the public, investors continue toaccept and rely on the earnings per share and price-to-earnings ratios. A discussionof these ratios is included since the reporting of these numbers does, in fact, have asignificant impact on stock price changes in the marketplace. The authors hope,however, that readers of this book understand that a thorough analysis of the com-pany, its environment, and its financial information offers a much better gauge tothe future prospects of the company than looking exclusively at earnings per shareand price-to-earnings ratios. These two ratios are based on an earnings number thatcan be misleading at times due to the many accounting choices and techniques usedto calculate it.
Earnings per common share is net income for the period divided by the weightedaverage number of common shares outstanding. One million dollars in earnings willlook different to the investor if there are 1 million shares of stock outstanding or100,000 shares. The earnings per share ratio provides the investor with a commondenominator to gauge investment returns.
The basic earnings per share computations for R.E.C. Inc. are made as follows:
2007 2006 2005Net earnings 9,394,000 5,910,000 5,896,000
Average shares outstanding 4,792,857� 1.96
4,581,395� 1.29
4,433,083� 1.33
Earnings per share figures must be disclosed on the face of the income statementfor publicly held companies.
The price-to-earnings ratio (P/E ratio) relates earnings per common share to themarket price at which the stock trades, expressing the “multiple” that the stock market
Understanding Financial Statements,Eighth Edition, by Lyn M. Fraser and Aileen Ormiston. Published by Prentice Hall. Copyright © 2007 by Pearson Education, Inc.
ISB
N:
0-53
6-48
044-
3

210 CHAPTER 6 The Analysis of Financial Statements
FIGURE 6.1 Summary of Financial Ratios
7Using diluted earnings per share in market ratios offers a worst-case scenario figure that analysts mayfind useful.
CurrentRatio
AverageCollection
PeriodDebt/Assets
TimesInterestEarned
AccountsReceivableTurnover
GrossProfit
Margin
Returnon TotalAssets
Quick RatioDays
Inventory Held
Debt/Equity
FixedCharge
Coverage
InventoryTurnover
OperatingProfit
Margin
Returnon Equity
Cash FlowLiquidity
Ratio
Cash FlowAdequacy
Fixed AssetTurnover
Net ProfitMargin
Cash Returnon Assets
Price/Earnings
Total AssetTurnover
Cash FlowMargin
DividendPayout
DividendYield
FinancialLeverage
Index
Return onTotal Assets
Long-TermDebt
TotalCapitalization
Days Payable
Outstanding
CashConversion
Cycle
Accounts Payable Turnover
Short RunSolvency
Liquidityof Current
Assets
Amountof Debt
Coverageof Debt
OperatingEfficiency
Margins Returns
Cash Interest
Coverage
Earningsper Share
Liquidity Leverage
AssetManagement
ProfitabilityMarket
Measures
Summary of Financial Statement AnalysisHow to Use Financial Ratios
places on a firm’s earnings. For instance, if two competing firms had annual earnings of$2.00 per share, and Company 1 shares sold for $10.00 each and Company 2 shareswere selling at $20.00 each, the market is placing a different value on the same $2.00earnings: a multiple of 5 for Company 1 and 10 for Company 2. The P/E ratio is thefunction of a myriad of factors, which include the quality of earnings, future earningspotential, and the performance history of the company.7
Understanding Financial Statements,Eighth Edition, by Lyn M. Fraser and Aileen Ormiston. Published by Prentice Hall. Copyright © 2007 by Pearson Education, Inc.
ISB
N: 0-536-48044-3

CHAPTER 6 The Analysis of Financial Statements 211
The price-to-earnings ratio for R.E.C. Inc. would be determined as follows:
2007 2006 2005Market price of common stock 30.00
� 15.317.00
� 13.225.00
� 18.8Earnings per share 1.96 1.29 1.33
The P/E ratio is higher in 2007 than 2006 but below the 2005 level. This could be dueto developments in the market generally and/or because the market is reacting cautiouslyto the firm’s good year.Another factor could be the reduction of cash dividend payments.
The dividend payout ratio is determined by the formula cash dividends per sharedivided by earnings per share:
2007 2006 2005Dividends per share .33 .41 .41Earnings per share 1.96
� 16.8%1.29
� 31.8%1.33
� 30.8%
R.E.C. Inc. reduced its cash dividend payment in 2007. It is unusual for a companyto reduce cash dividends because this decision can be read as a negative signal regard-ing the future outlook. It is particularly uncommon for a firm to reduce dividends dur-ing a good year.The explanation provided by management is that the firm has adopteda new policy that will result in lower dividend payments in order to increase the avail-ability of internal funds for expansion; management expects the overall long-termimpact to be extremely favorable to shareholders and has committed to maintainingthe $.33 per share annual cash dividend.
The dividend yield shows the relationship between cash dividends and market price:
2007 2006 2005Dividends per share .33 .41 .41
Market price of common stock 30.00� 1.1%
17.00� 2.4%
25.00� 1.6%
The R.E.C. Inc. shares are yielding a 1.1% return based on the market price atyear-end 2007; an investor would likely choose R.E.C. Inc. as an investment more forits long-term capital appreciation than for its dividend yield.
Figure 6.1 shows in summary form the use of key financial ratios discussed in thechapter.
Analyzing the DataWould you as a bank loan officer extend $1.5 million in new credit to R.E.C. Inc.?Would you as an investor purchase R.E.C. Inc. common shares at the current marketprice of $30 per share? Would you as a wholesaler of running shoes sell your productson credit to R.E.C. Inc.? Would you as a recent college graduate accept a position asmanager-trainee with R.E.C. Inc.? Would you as the chief financial officer of R.E.C.Inc. authorize the opening of 25 new retail stores during the next two years?
In order to answer such questions, it is necessary to complete the analysis of R.E.C.Inc.’s financial statements, utilizing the common-size financial statements and key finan-cial ratios as well as other information presented throughout the book. Ordinarily, theanalysis would deal with only one of the above questions, and the perspective of the
Understanding Financial Statements,Eighth Edition, by Lyn M. Fraser and Aileen Ormiston. Published by Prentice Hall. Copyright © 2007 by Pearson Education, Inc.
ISB
N:
0-53
6-48
044-
3

212 CHAPTER 6 The Analysis of Financial Statements
8The background section of R.E.C. Inc. is based on an unpublished paper by Kimberly Ann Davis,“A Financial Analysis of Oshman’s Sporting Goods, Inc.”
FIGURE 6.2 Steps of a Financial Statement Analysis
1. Establish objectives of the analysis.2. Study the industry in which firm operates and relate industry climate to current and
projected economic developments.3. Develop knowledge of the firm and the quality of management.4. Evaluate financial statements.
• Tools: Common size financial statements, key financial ratios, trend analysis,structural analysis, and comparison with industry competitors.
• Major Areas: Short-term liquidity, operating efficiency, capital structure andlong-term solvency, profitability, market ratios, segmental analysis (when rele-vant), and quality of financial reporting.
5. Summarize findings based on analysis and reach conclusions about firm relevant tothe established objectives.
financial statement user would determine the focus of the analysis. Because the purposeof this chapter is to present a general approach to financial statement analysis, however,the evaluation will cover each of five broad areas that would typically constitute afundamental analysis of financial statements: (1) background on firm, industry, economy,and outlook; (2) short-term liquidity; (3) operating efficiency; (4) capital structure andlong-term solvency; and (5) profitability. From this general approach, each analyticalsituation can be tailored to meet specific user objectives.
Figure 6.2 shows the steps of a financial statement analysis.
Background: Economy, Industry, and FirmAn individual company does not operate in a vacuum. Economic developments andthe actions of competitors affect the ability of any business enterprise to perform suc-cessfully. It is therefore necessary to preface the analysis of a firm’s financial state-ments with an evaluation of the environment in which the firm conducts business. Thisprocess involves blending hard facts with guesses and estimates. Reference to thesection entitled “Other Sources” in this chapter may be beneficial for this part of theanalysis. A brief section discussing the business climate of R.E.C. Inc. follows.8
Recreational Equipment and Clothing Incorporated (R.E.C. Inc.) is the thirdlargest retailer of recreational products in the United States. The firm offers a broadline of sporting goods and equipment and active sports apparel in medium to higherprice ranges. R.E.C. Inc. sells equipment used in running, aerobics, walking, basketball,golf, tennis, skiing, football, scuba diving, and other sports; merchandise for camping,hiking, fishing, and hunting; men’s and women’s sporting apparel; gift items; games; andconsumer electronic products. The firm also sells sporting goods on a direct basis toinstitutional customers such as schools and athletic teams.
The general and executive offices of the company are located in Dime Box, Texas,and these facilities were expanded in 2007. Most of the retail stores occupy leased
Understanding Financial Statements,Eighth Edition, by Lyn M. Fraser and Aileen Ormiston. Published by Prentice Hall. Copyright © 2007 by Pearson Education, Inc.
ISB
N: 0-536-48044-3
CHAPTER 6 The Analysis of Financial Statements 213
spaces and are located in major regional or suburban shopping districts throughout thesouthwestern United States. Eighteen new retail outlets were added in late 2006, and25 new stores were opened in 2007. The firm owns distribution center warehouseslocated in Arizona, California, Colorado, Utah, and Texas.
The recreational products industry is affected by current trends in consumer pref-erences, a cyclical sales demand, and weather conditions.The running boom has shiftedto walking and aerobics; golf, once on the downswing, is increasing in popularity; withmultiple wins in the Tour de France, American Lance Armstrong invigorated thecycling industry in the United States. Recreational product retailers also rely heavilyon sales of sportswear for their profits, because the markup on sportswear is generallyhigher than on sports equipment, and these products are also affected by consumerpreference shifts. With regard to seasonality, most retail sales occur in November,December, May, and June. Sales to institutions are highest in August and September.Weather conditions also influence sales volume, especially of winter sports equip-ment—come on, Rocky Mountain snow!
Competition within the recreational products industry is based on price, quality,and variety of goods offered as well as the location of outlets and the quality of servicesoffered. R.E.C. Inc.’s two major competitors are also full-line sporting goods compa-nies. One operates in the northwest and the other primarily in the eastern and south-eastern United States, reducing direct competition among the three firms.
The current outlook for the sporting goods industry is promising, following a reces-sionary year in 2006.9 Americans have become increasingly aware of the importance ofphysical fitness and have become more actively involved in recreational activities. The25-to-44 age group is the most athletically active and is projected to be the largest agegroup in the United States during the next decade. The southwestern United States isexpected to provide a rapidly expanding market because of its population growth andexcellent weather conditions for year-round recreational participation.
Short-Term LiquidityShort-term liquidity analysis is especially important to creditors, suppliers, manage-ment, and others who are concerned with the ability of a firm to meet near-termdemands for cash. The evaluation of R.E.C. Inc.’s short-term liquidity position beganwith the preparation and interpretation of the firm’s common-size balance sheetearlier in the chapter. From that assessment, it was evident that inventories haveincreased relative to cash and marketable securities in the current asset section, andthere has been an increase in the proportion of debt, both short and long term. Thesedevelopments were traced primarily to policies and financing needs related to newstore openings. Additional evidence useful to short-term liquidity analysis is providedby a five-year trend of selected financial ratios and a comparison with industryaverages. Sources of comparative industry ratios include Dun & Bradstreet, IndustryNorms and Key Business Ratios, New York, NY; The Risk Management Association,Annual Statement Studies, Philadelphia, PA; and Standard & Poor’s Corporation,Industry Surveys, New York, NY.As a source of industry comparative ratios, the analystmay prefer to develop a set of financial ratios for one or more major competitors.
9The recession is assumed for purposes of writing this book and does not represent the authors’ forecast.
Understanding Financial Statements,Eighth Edition, by Lyn M. Fraser and Aileen Ormiston. Published by Prentice Hall. Copyright © 2007 by Pearson Education, Inc.
ISB
N:
0-53
6-48
044-
3

214 CHAPTER 6 The Analysis of Financial Statements
Industry Average
R.E.C. Inc. 2007 2006 2005 2004 2003 2007Current ratio 2.40 2.75 2.26 2.18 2.83 2.53Quick ratio .68 .95 .87 1.22 1.20 .97Cash flow liquidity .70 .32 .85 .78 .68 *Average collection period 15 days 20 days 13 days 11 days 10 days 17 daysDays inventory held 133 days 146 days 134 days 122 days 114 days 117 daysDays payable outstanding 41 days 33 days 37 days 34 days 35 days 32 daysCash conversion cycle 107 days 133 days 110 days 99 days 89 days 102 daysCash flow from operating
activities ($ thousands) 10,024 (3,767) 5,629 4,925 3,430 *
*Not available
Liquidity analysis involves the prediction of the future ability of the firm to meet pro-spective needs for cash.This prediction is made from the historical record of the firm, andno one financial ratio or set of financial ratios or other financial data can serve as a proxyfor future developments. For R.E.C. Inc., the financial ratios are somewhat contradictory.
The current and quick ratios have trended downward over the five-year period, indi-cating a deterioration of short-term liquidity. On the other hand, the cash flow liquidityratio improved strongly in 2007 after a year of negative cash generation in 2006.The aver-age collection period for accounts receivable and the days inventory held ratio—afterworsening between 2003 and 2006—also improved in 2007.These ratios measure the qual-ity or liquidity of accounts receivable and inventory. The average collection periodincreased to a high of 20 days in 2006, which was a recessionary year in the economy, thendecreased to a more acceptable 15-day level in 2007. Days payable outstanding has variedeach year, but has increased overall from 2003 to 2007.As long as the company is not latepaying bills, this should not be a significant problem. The net trade cycle worsened from2003 to 2006 due to an increasing collection period and longer number of days inventorywas held. In 2007, a significant improvement in management of current assets and liabili-ties has caused the cash conversion cycle to drop by 26 days from the high of 133 days in2006. It is now much closer to the industry average.
The common-size balance sheet for R.E.C. Inc. revealed that inventories nowcomprise about half of the firm’s total assets.The growth in inventories has been necessaryto satisfy the requirements associated with the opening of new retail outlets but has beenaccomplished by reducing holdings of cash and cash equivalents. This represents a trade-off of highly liquid assets for potentially less liquid assets. The efficient management ofinventories is a critical ingredient for the firm’s ongoing liquidity. In 2007, days inventoryheld improved in spite of the buildups necessary to stock new stores. Sales demand in 2007was more than adequate to absorb the 28% increase in inventories recorded for the year.
The major question in the outlook for liquidity is the ability of the firm toproduce cash from operations. Problems in 2006 resulted partly from the depressedstate of the economy and poor ski conditions, which reduced sales growth. Theeasing of sales demand hit the company in a year that marked the beginning of amajor market expansion. Inventories and receivables increased too fast for thelimited sales growth of a recessionary year, and R.E.C. also experienced somereduction of credit availability from suppliers that felt the economic pinch. The con-sequence was a cash crunch and negative cash flow from operations.
Understanding Financial Statements,Eighth Edition, by Lyn M. Fraser and Aileen Ormiston. Published by Prentice Hall. Copyright © 2007 by Pearson Education, Inc.
ISB
N: 0-536-48044-3

CHAPTER 6 The Analysis of Financial Statements 215
In 2007, R.E.C. Inc. enjoyed considerable improvement, generating more than $10million in cash from operations and progress in managing inventories and receivables.There appears to be no major problem with the firm’s short-term liquidity position atthe present time. Another poor year, however, might well cause problems similar tothose experienced in 2006. The timing of further expansion of retail outlets will be ofcritical importance to the ongoing success of the firm.
Operating Efficiency
Industry Average
R.E.C. Inc. 2007 2006 2005 2004 2003 2007Accounts receivable
turnover 24.06 18.32 28.08 33.18 36.50 21.47Inventory
turnover 2.75 2.50 2.74 2.99 3.20 3.12Accounts payable
turnover 9.05 12.10 9.90 10.74 10.43 11.40Fixed asset turnover 7.41 8.06 8.19 10.01 10.11 8.72Total asset turnover 2.26 2.02 2.13 2.87 2.95 2.43
The turnover ratios measure the operating efficiency of the firm. The efficiencyin managing the company’s accounts receivable, inventory, and accounts payable wasdiscussed in the short-term liquidity analysis. R.E.C. Inc.’s fixed asset turnover hasdecreased over the past five years and is now below the industry average. As notedearlier, R.E.C. Inc. has increased its investment in fixed assets as a result of home officeand store expansion. The asset turnover ratios reveal a downward trend in the efficiencywith which the firm is generating sales from investments in fixed and total assets.The total asset turnover rose in 2007, progress traceable to improved management ofinventories and receivables. The fixed asset turnover ratio is still declining, a result ofexpanding offices and retail outlets, but should improve if the expansion is successful.
Capital Structure and Long-Term SolvencyThe analytical process includes an evaluation of the amount and proportion of debt ina firm’s capital structure as well as the ability to service debt. Debt implies risk becausedebt involves the satisfaction of fixed financial obligations. The disadvantage of debtfinancing is that the fixed commitments must be met in order for the firm to continueoperations. The major advantage of debt financing is that, when used successfully,shareholder returns are magnified through financial leverage. The concept of financialleverage can best be illustrated with an example (Figure 6.3).
Industry Average
R.E.C. Inc. 2007 2006 2005 2004 2003 2007Debt to total assets 51.8% 50.1% 49.2% 40.8% 39.7% 48.7%Long-term debt to
total capitalization 31.4% 31.0% 24.1% 19.6% 19.8% 30.4%Debt to equity 1.07 1.00 .96 .68 .66 .98
Understanding Financial Statements,Eighth Edition, by Lyn M. Fraser and Aileen Ormiston. Published by Prentice Hall. Copyright © 2007 by Pearson Education, Inc.
ISB
N:
0-53
6-48
044-
3

216 CHAPTER 6 The Analysis of Financial Statements
FIGURE 6.3 Example of Financial Leverage
Sockee Sock Company has $100,000 in total assets, and the firm’s capital structureconsists of 50% debt and 50% equity:
Debt $ 50.000Equity 50.000Total assets $100.000
Cost of debt � 10%Average tax rate � 40%
If Sockee has $20,000 in operating earnings, the return to shareholders as measuredby the return on equity ratio would be 18%:
Operating earnings $20.000Interest expense 5.000Earnings before tax 15.000Tax expense 6.000Net earnings $ 9.000
Return on equity: 9,000/50,000 � 18%
If Sockee is able to double operating earnings from $20,000 to $40,000, the return onequity will more than double, increasing from 18% to 42%:
Operating earnings $40.000Interest expense 5.000Earnings before tax 35.000Tax expense 14.000Net earnings $21.000
Return on equity: 21.000/50.000 � 42%
The magnified return on equity results from financial leverage. Unfortunately,leverage has a double edge. If operating earnings are cut in half from $20,000 to$10,000, the return on equity is more than halved, declining from 18% to 6%:
Operating earnings $10.000Interest expense 5.000Earnings before tax 5.000Tax expense 2.000Net earnings $ 3.000
Return on equity: 3.000/50.000 � 6%
The amount of interest expense is fixed, regardless of the level of operating earnings.When operating earnings rise or fall, financial leverage produces positive or negativeeffects on shareholder returns. In evaluating a firm’s capital structure and solvency,the analyst must constantly weigh the potential benefits of debt against the risksinherent in its use.
Understanding Financial Statements,Eighth Edition, by Lyn M. Fraser and Aileen Ormiston. Published by Prentice Hall. Copyright © 2007 by Pearson Education, Inc.
ISB
N: 0-536-48044-3

CHAPTER 6 The Analysis of Financial Statements 217
The debt ratios for R.E.C. Inc. reveal a steady increase in the use of borrowedfunds. Total debt has risen relative to total assets, long-term debt has increased as aproportion of the firm’s permanent financing, and external or debt financing hasincreased relative to internal financing. Given the greater degree of risk implied byborrowing, it is important to determine (1) why debt has increased; (2) whether thefirm is employing debt successfully; and (3) how well the firm is covering its fixedcharges.
Why has debt increased? The Summary Statement of Cash Flows, discussed inChapter 4 and repeated here as Exhibit 6.2, provides an explanation of borrowingcause. Exhibit 6.2 shows the inflows and outflows of cash both in dollar amounts andpercentages.
Exhibit 6.2 shows that R.E.C. Inc. has substantially increased its investment incapital assets, particularly in 2007 when additions to property, plant, and equipmentaccounted for 82% of the total cash outflows. These investments have been financedlargely by borrowing, especially in 2006 when the firm had a sluggish operatingperformance and no internal cash generation. Operations supplied 73% of R.E.C.Inc.’s cash in 2005 and 62% in 2007, but the firm had to borrow heavily in2006 (98% of cash inflows). The impact of this borrowing is seen in the firm’sdebt ratios.
How effectively is R.E.C. Inc. using financial leverage? The answer is determinedby calculating the financial leverage index (FLI), as follows:
Return on equityAdjusted return on assets
� Finanacial leverage index
EXHIBIT 6.2 R.E.C. Inc. Summary Analysis Statement of Cash Flows (in Thousands)
2007 % 2006 % 2005 %
Inflows (thousands)
Operations $10,024 62.0 $ 0 0.0 $5,629 73.0
Sales of other assets 295 1.8 0 0.0 0 0.0
Sales of common stock 256 1.6 183 1.8 124 1.6
Additions of short-term debt 0 0.0 1,854 18.7 1,326 17.2
Additions of long-term debt 5,600 34.6 7,882 79.5 629 8.2
Total $16,175 100.0 $ 9,919 100.0 $7,708 100.0
Outflows (thousands)
Operations $ 0 0.0 $ 3,767 31.4 $ 0 0.0
Purchase of property,plant,and equipment 14,100 81.8 4,773 40.0 3,982 66.9
Reductions of short-term debt 30 0.2 0 0.0 0 0.0
Reductions of long-term debt 1,516 8.8 1,593 13.2 127 2.1
Dividends paid 1,582 9.2 1,862 15.4 1,841 31.0
Total $17,228 100.0 $11,995 100.0 $5,950 100.0
Change in cash and marketable securities ($ 1,053) ($2,076) $1,758
Understanding Financial Statements,Eighth Edition, by Lyn M. Fraser and Aileen Ormiston. Published by Prentice Hall. Copyright © 2007 by Pearson Education, Inc.
ISB
N:
0-53
6-48
044-
3

The adjusted return on assets in the denominator of this ratio is calculated asfollows:
Net earnings � interest expense (1�tax rate)10
Total assets
When the FLI is greater than 1, which indicates that return on equity exceedsreturn on assets, the firm is employing debt beneficially. An FLI of less than 1 meansthe firm is not using debt successfully. For R.E.C. Inc., the adjusted return on assets andFLI are calculated as follows:
2007 2006 2005Net earnings � interest expense (1 � tax rate) 9,394 � 2,585(1 � .45) 5,910 � 2,277(1�.43) 5,896 � 1,274(1�.45)
Total assets 95,298 75,909 66,146
2007 2006 2005Return on equity 20.45
� 1.815.61
� 1.617.53
� 1.8Adjusted return on assets 11.35 9.50 9.97
The FLI for R.E.C. Inc. of 1.8 in 2007, 1.6 in 2006, and 1.8 in 2005 indicates a suc-cessful use of financial leverage for the three-year period when borrowing hasincreased. The firm has generated sufficient operating returns to more than cover theinterest payments on borrowed funds.
How well is R.E.C. Inc. covering fixed charges? The answer requires a review ofthe coverage ratios.
Industry Average
R.E.C. Inc. 2007 2006 2005 2004 2003 2007Times interest earned 7.44 5.18 8.84 13.34 12.60 7.2Cash interest coverage 7.77 1.24 9.11 11.21 11.90 *Fixed charge coverage 2.09 2.01 2.27 2.98 3.07 2.5Cash flow adequacy 0.58 (0.46) 0.95 1.03 1.24 *
* Not available
Given the increased level of borrowing, the times interest earned and cash inter-est coverage ratios have declined over the five-year period but times interest earnedremains above the industry average. Cash interest coverage indicates that R.E.C. Inc.is generating enough cash to actually make the cash payments. R.E.C. Inc. leases themajority of its retail outlets so the fixed charge coverage ratio, which considers leasepayments as well as interest expense, is a more relevant ratio than times interestearned. This ratio has also decreased, as a result of store expansion and higherpayments for leases and interest. Although below the industry average, the firm is still
218 CHAPTER 6 The Analysis of Financial Statements
10The effective tax rate to be used in this ratio was calculated in Chapter 3.
Understanding Financial Statements,Eighth Edition, by Lyn M. Fraser and Aileen Ormiston. Published by Prentice Hall. Copyright © 2007 by Pearson Education, Inc.
ISB
N: 0-536-48044-3
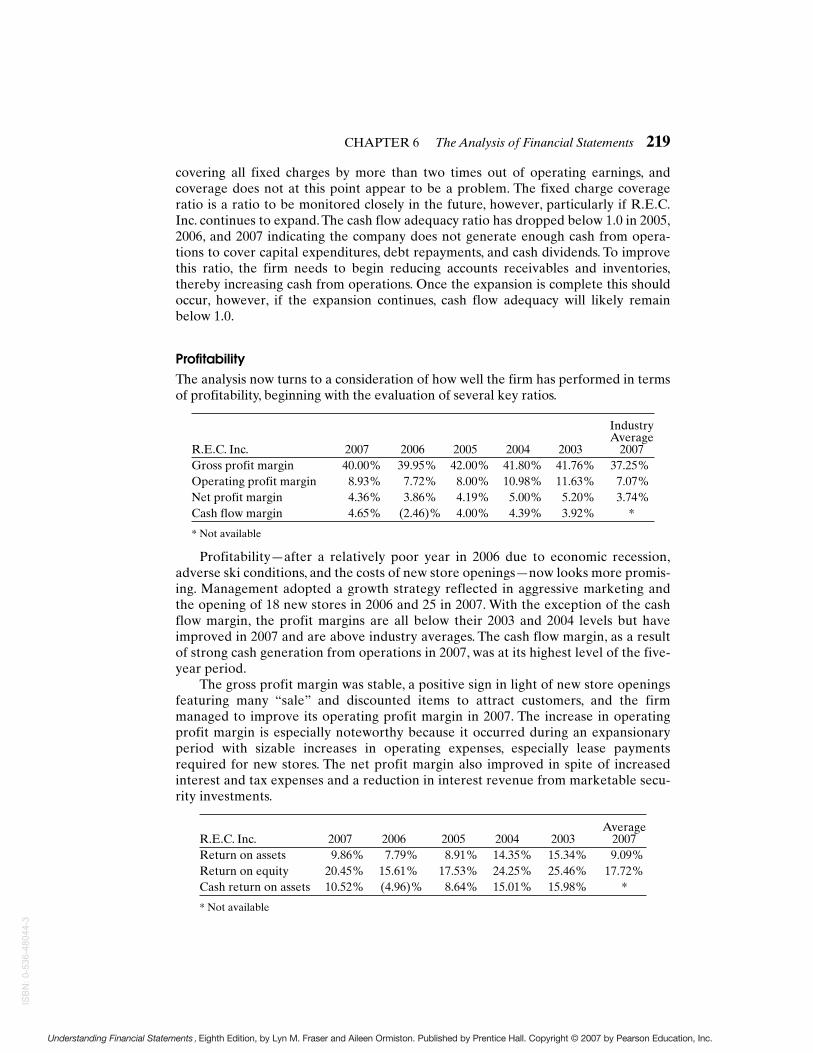
CHAPTER 6 The Analysis of Financial Statements 219
covering all fixed charges by more than two times out of operating earnings, andcoverage does not at this point appear to be a problem. The fixed charge coverageratio is a ratio to be monitored closely in the future, however, particularly if R.E.C.Inc. continues to expand. The cash flow adequacy ratio has dropped below 1.0 in 2005,2006, and 2007 indicating the company does not generate enough cash from opera-tions to cover capital expenditures, debt repayments, and cash dividends. To improvethis ratio, the firm needs to begin reducing accounts receivables and inventories,thereby increasing cash from operations. Once the expansion is complete this shouldoccur, however, if the expansion continues, cash flow adequacy will likely remainbelow 1.0.
ProfitabilityThe analysis now turns to a consideration of how well the firm has performed in termsof profitability, beginning with the evaluation of several key ratios.
Industry Average
R.E.C. Inc. 2007 2006 2005 2004 2003 2007Gross profit margin 40.00% 39.95% 42.00% 41.80% 41.76% 37.25%Operating profit margin 8.93% 7.72% 8.00% 10.98% 11.63% 7.07%Net profit margin 4.36% 3.86% 4.19% 5.00% 5.20% 3.74%Cash flow margin 4.65% (2.46)% 4.00% 4.39% 3.92% *
* Not available
Profitability—after a relatively poor year in 2006 due to economic recession,adverse ski conditions, and the costs of new store openings—now looks more promis-ing. Management adopted a growth strategy reflected in aggressive marketing andthe opening of 18 new stores in 2006 and 25 in 2007. With the exception of the cashflow margin, the profit margins are all below their 2003 and 2004 levels but haveimproved in 2007 and are above industry averages. The cash flow margin, as a resultof strong cash generation from operations in 2007, was at its highest level of the five-year period.
The gross profit margin was stable, a positive sign in light of new store openingsfeaturing many “sale” and discounted items to attract customers, and the firmmanaged to improve its operating profit margin in 2007. The increase in operatingprofit margin is especially noteworthy because it occurred during an expansionaryperiod with sizable increases in operating expenses, especially lease paymentsrequired for new stores. The net profit margin also improved in spite of increasedinterest and tax expenses and a reduction in interest revenue from marketable secu-rity investments.
Average R.E.C. Inc. 2007 2006 2005 2004 2003 2007Return on assets 9.86% 7.79% 8.91% 14.35% 15.34% 9.09%Return on equity 20.45% 15.61% 17.53% 24.25% 25.46% 17.72%Cash return on assets 10.52% (4.96)% 8.64% 15.01% 15.98% *
* Not available
Understanding Financial Statements,Eighth Edition, by Lyn M. Fraser and Aileen Ormiston. Published by Prentice Hall. Copyright © 2007 by Pearson Education, Inc.
ISB
N:
0-53
6-48
044-
3
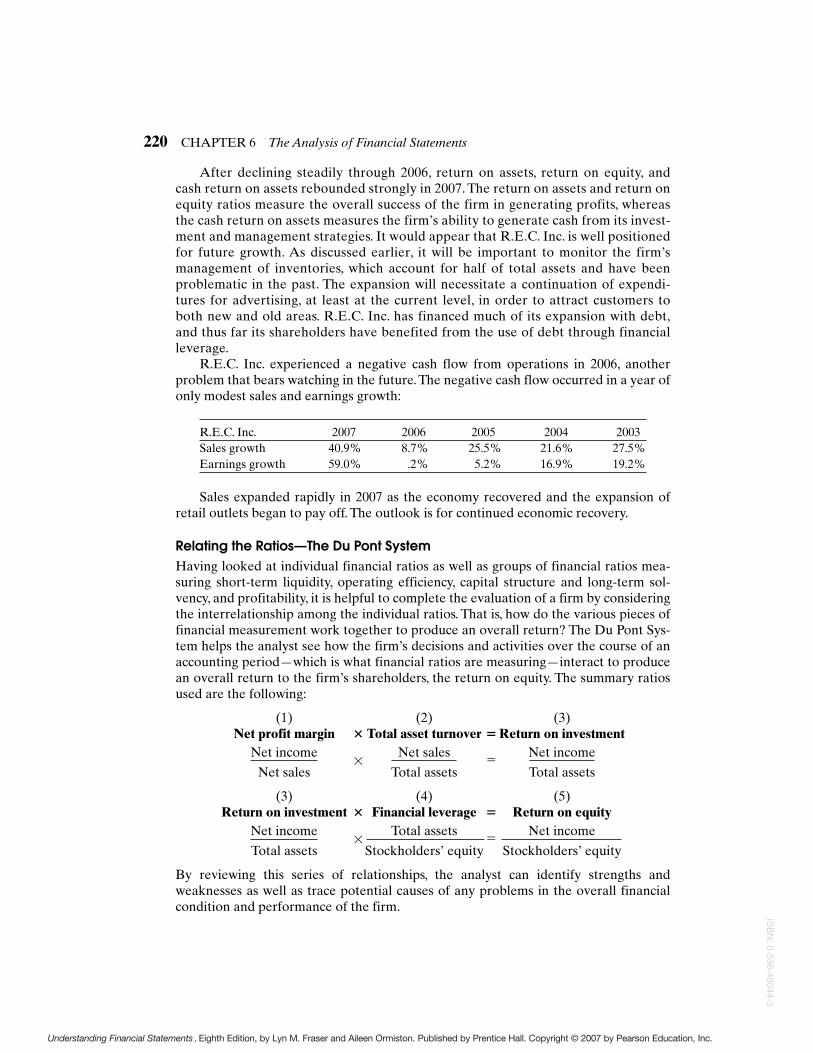
220 CHAPTER 6 The Analysis of Financial Statements
After declining steadily through 2006, return on assets, return on equity, andcash return on assets rebounded strongly in 2007. The return on assets and return onequity ratios measure the overall success of the firm in generating profits, whereasthe cash return on assets measures the firm’s ability to generate cash from its invest-ment and management strategies. It would appear that R.E.C. Inc. is well positionedfor future growth. As discussed earlier, it will be important to monitor the firm’smanagement of inventories, which account for half of total assets and have beenproblematic in the past. The expansion will necessitate a continuation of expendi-tures for advertising, at least at the current level, in order to attract customers toboth new and old areas. R.E.C. Inc. has financed much of its expansion with debt,and thus far its shareholders have benefited from the use of debt through financialleverage.
R.E.C. Inc. experienced a negative cash flow from operations in 2006, anotherproblem that bears watching in the future. The negative cash flow occurred in a year ofonly modest sales and earnings growth:
R.E.C. Inc. 2007 2006 2005 2004 2003Sales growth 40.9% 8.7% 25.5% 21.6% 27.5%Earnings growth 59.0% .2% 5.2% 16.9% 19.2%
Sales expanded rapidly in 2007 as the economy recovered and the expansion ofretail outlets began to pay off. The outlook is for continued economic recovery.
Relating the Ratios—The Du Pont SystemHaving looked at individual financial ratios as well as groups of financial ratios mea-suring short-term liquidity, operating efficiency, capital structure and long-term sol-vency, and profitability, it is helpful to complete the evaluation of a firm by consideringthe interrelationship among the individual ratios. That is, how do the various pieces offinancial measurement work together to produce an overall return? The Du Pont Sys-tem helps the analyst see how the firm’s decisions and activities over the course of anaccounting period—which is what financial ratios are measuring—interact to producean overall return to the firm’s shareholders, the return on equity. The summary ratiosused are the following:
(1) (2) (3)Net profit margin � Total asset turnover � Return on investment
Net income�
Net sales�
Net income
Net sales Total assets Total assets
(3) (4) (5)Return on investment � Financial leverage � Return on equity
Net income�
Total assets�
Net income
Total assets Stockholders’ equity Stockholders’ equity
By reviewing this series of relationships, the analyst can identify strengths andweaknesses as well as trace potential causes of any problems in the overall financialcondition and performance of the firm.
Understanding Financial Statements,Eighth Edition, by Lyn M. Fraser and Aileen Ormiston. Published by Prentice Hall. Copyright © 2007 by Pearson Education, Inc.
ISB
N: 0-536-48044-3

CHAPTER 6 The Analysis of Financial Statements 221
The first three ratios reveal that the (3) return on investment (profit generatedfrom the overall investment in assets) is a product of the (1) net profit margin (profitgenerated from sales) and the (2) total asset turnover (the firm’s ability to producesales from its assets). Extending the analysis, the remaining three ratios show how the(5) return on equity (overall return to shareholders, the firm’s owners) is derived fromthe product of (3) return on investment and (4) financial leverage (proportion of debtin the capital structure). Using this system, the analyst can evaluate changes in thefirm’s condition and performance, whether they are indicative of improvement ordeterioration or some combination. The evaluation can then focus on specific areascontributing to the changes.
Evaluating R.E.C. Inc. using the Du Pont System over the five-year period 2003 to2007 would show the following relationships:
Du Pont System applied to R.E.C. Inc.(1) (2) (3) (4) (5)
NPM × TAT � ROI × FL � ROE2003 5.20 × 2.95 � 15.34 × 1.66 � 25.462004 5.00 × 2.87 � 14.35 × 1.69 � 24.252005 4.19 × 2.13 � 8.92 × 1.97 � 17.572006 3.86 × 2.02 � 7.80 × 2.00 � 15.602007 4.36 × 2.26 � 9.85 × 2.07 � 20.39
As discussed earlier in the chapter, return on equity is below earlier year levels buthas improved since its low point in 2006. The Du Pont System helps provide clues as towhy these changes have occurred. Both the profit margin and the asset turnover arelower in 2007 than in 2003 and 2004. The combination of increased debt (financialleverage) and the improvement in profitability and asset utilization has produced animproved overall return in 2007 relative to the two previous years. Specifically, the firmhas added debt to finance capital asset expansion and has used its debt effectively.Although debt carries risk and added cost in the form of interest expense, debt has thepositive benefit of financial leverage when debt is employed successfully, which isthe case for R.E.C. Inc.The 2007 improvement in inventory management has impactedthe firm favorably, showing up in the improved total asset turnover ratio. The firm’sability to control operating costs while increasing sales during expansion has improvedthe net profit margin. The overall return on investment is now improving as a result ofthese combined factors.
Projections and Pro Forma StatementsSome additional analytical tools and financial ratios are relevant to financial statementanalysis, particularly for investment decisions and long-range planning. Although anin-depth discussion of these tools is beyond the scope of this chapter, we provide anintroductory treatment of projections, pro forma financial statements, and severalinvestment-related financial ratios.
The investment analyst, in valuing securities for investment decisions, must projectthe future earnings stream of a business enterprise. References that provide earningsforecasts are found in the “Other Sources” section earlier in the chapter.
Understanding Financial Statements,Eighth Edition, by Lyn M. Fraser and Aileen Ormiston. Published by Prentice Hall. Copyright © 2007 by Pearson Education, Inc.
ISB
N:
0-53
6-48
044-
3
222 CHAPTER 6 The Analysis of Financial Statements
Pro forma financial statements are projections of financial statements based on aset of assumptions regarding future revenues, expenses, level of investment in assets,financing methods and costs, and working capital management. Pro forma financialstatements are utilized primarily for long-range planning and long-term creditdecisions. A bank considering the extension of $1.5 million in new credit to R.E.C. Inc.would want to look at the firm’s pro forma statements, assuming the loan is granted,and determine—using different scenarios regarding the firm’s performance—whethercash flow from operations would be sufficient to service the debt. R.E.C. Inc.’s CEO,who is making a decision about new store expansion, would develop pro forma state-ments based on varying estimates of performance outcomes and financing alternatives.
It is important that the above described pro forma financial statements not beconfused with “pro forma” earnings or “pro forma” financial statements that manyfirms now report in their annual reports and financial press releases. Many companiesin recent years have made up their own definition of pro forma in order to presentmore favorable financial information than the generally accepted accounting princi-ples (GAAP)-based number required to be reported. By eliminating items such asdepreciation, amortization, interest, and tax expense from earnings, for example, somefirms have tried to convince users of their annual reports to focus on the “pro forma”amount that is usually a profit, instead of the GAAP-based amount that is usually aloss. (This topic was discussed in Chapter 5.)
Summary of AnalysisThe analysis of any firm’s financial statements consists of a mixture of steps andpieces that interrelate and affect each other. No one part of the analysis should beinterpreted in isolation. Short-term liquidity impacts profitability; profitabilitybegins with sales, which relate to the liquidity of assets. The efficiency of assetmanagement influences the cost and availability of credit, which shapes the capitalstructure. Every aspect of a firm’s financial condition, performance, and outlookaffects the share price. The last step of financial statement analysis is to integratethe separate pieces into a whole, leading to conclusions about the business enter-prise. The specific conclusions drawn will be affected by the original objectivesestablished at the initiation of the analytical process.
The major findings from the analysis of R.E.C. Inc.’s financial statements can besummarized by the following strengths and weaknesses.
Strengths
1. Favorable economic and industry outlook; firm well-positioned geographically tobenefit from expected economic and industry growth
2. Aggressive marketing and expansion strategies3. Recent improvement in management of accounts receivable and inventory4. Successful use of financial leverage and solid coverage of debt service requirements5. Effective control of operating costs6. Substantial sales growth, partially resulting from market expansion and reflective
of future performance potential7. Increased profitability in 2007 and strong, positive generation of cash flow from
operations
Understanding Financial Statements,Eighth Edition, by Lyn M. Fraser and Aileen Ormiston. Published by Prentice Hall. Copyright © 2007 by Pearson Education, Inc.
ISB
N: 0-536-48044-3

CHAPTER 6 The Analysis of Financial Statements 223
Weaknesses
1. Highly sensitive to economic fluctuations and weather conditions2. Negative cash flow from operating activities in 20063. Historical problems with inventory management and some weakness in overall
asset management efficiency4. Increased risk associated with debt financing
The answers to specific questions regarding R.E.C. Inc. are determined by the valuesplaced on each of the strengths and weaknesses. In general, the outlook for the firm ispromising. R.E.C. Inc. appears to be a sound credit risk with attractive investment poten-tial.The management of inventories, a continuation of effective cost controls, and carefultiming of further expansion will be critically important to the firm’s future success.
This book began with the notion that financial statements should serve as a map tosuccessful business decision making, even though the user of financial statement datawould confront mazelike challenges in seeking to find and interpret the necessary infor-mation. The chapters have covered the enormous volume of material found in corporatefinancial reporting, the complexities and confusions created by accounting rules andchoices, the potential for management manipulations of financial statement results, andthe difficulty in finding necessary information.The exploration of financial statements hasrequired a close examination of the form and content of each financial statement pre-sented in corporate annual reporting as well as the development of tools and techniquesfor analyzing the data. It is the hope of the authors that readers of this book will find thatfinancial statements are a map, leading to sound and profitable business decisions.
FIGURE 6.4 The Maze Becomes a Map
Auditor's report
Financial reportingquality
Financialstatements
Analyticaltools and
techniques
Commonsense andjudgment
Success onWall Street
Notes
Understanding Financial Statements,Eighth Edition, by Lyn M. Fraser and Aileen Ormiston. Published by Prentice Hall. Copyright © 2007 by Pearson Education, Inc.
ISB
N:
0-53
6-48
044-
3

224 CHAPTER 6 The Analysis of Financial Statements
SELF-TEST
Solutions are provided in Appendix B.1. What is the first step in an analysis of financial statements?
(a) Check the auditor’s report.(b) Check references containing financial information.(c) Specify the objectives of the analysis.(d) Do a common size analysis.
2. What is a creditor’s objective in performing an analysis of financialstatements?(a) To decide whether the borrower has the ability to repay interest and
principal on borrowed funds.(b) To determine the firm’s capital structure.(c) To determine the company’s future earnings stream.(d) To decide whether the firm has operated profitably in the past.
3. What is an investor’s objective in financial statement analysis?(a) To determine if the firm is risky.(b) To determine the stability of earnings.(c) To determine changes necessary to improve future performance.(d) To determine whether an investment is warranted by estimating a
company’s future earnings stream.4. What information does the auditor’s report contain?
(a) The results of operations.(b) An unqualified opinion.(c) An opinion as to the fairness of the financial statements.(d) A detailed coverage of the firm’s liquidity, capital resources, and
operations.5. Which of the following would be helpful to an analyst evaluating the
performance of a firm?(a) Understanding the economic and political environment in which the
company operates.(b) Reviewing the annual reports of a company’s suppliers, customers,
and competitors.(c) Preparing common-size financial statements and calculating key
financial ratios for the company being evaluated.(d) All of the above.
6. Which of the following is not required to be discussed in the ManagementDiscussion and Analysis of the Financial Condition and Results ofOperations?(a) Liquidity.(b) Capital resources.(c) Operations.(d) Earnings projections.
7. What type of information found in supplementary schedules is requiredfor inclusion in an annual report?(a) Segmental data.(b) Inflation data.
Understanding Financial Statements,Eighth Edition, by Lyn M. Fraser and Aileen Ormiston. Published by Prentice Hall. Copyright © 2007 by Pearson Education, Inc.
ISB
N: 0-536-48044-3
CHAPTER 6 The Analysis of Financial Statements 225
(c) Material litigation and management photographs.(d) Management remuneration and segmental data.
8. What is Form 10-K?(a) A document filed with the American Institute of Certified Public
Accountants (AICPA) containing supplementary schedules showingmanagement remuneration and elaborations of financial statementdisclosures.
(b) A document filed with the SEC by companies selling securities to thepublic, containing much of the same information as the annual reportas well as additional detail.
(c) A document filed with the SEC containing key business ratios andforecasts of earnings.
(d) A document filed with the SEC containing nonpublic information.9. What information can be gained from sources such as Industry Norms and
Key Business Ratios,Annual Statement Studies,Analyst’s Handbook, andIndustry Surveys?(a) The general economic condition.(b) Forecasts of earnings.(c) Elaborations of financial statement disclosures.(d) A company’s relative position within its industry.
10. Which of the following is not a tool or technique used by a financialstatement analyst?(a) Common-size financial statements.(b) Trend analysis.(c) Random sampling analysis.(d) Industry comparisons.
11. What do liquidity ratios measure?(a) A firm’s ability to meet cash needs as they arise.(b) The liquidity of fixed assets.(c) The overall performance of a firm.(d) The extent of a firm’s financing with debt relative to equity.
12. Which category of ratios is useful in assessing the capital structure andlong-term solvency of a firm?(a) Liquidity ratios.(b) Activity ratios.(c) Leverage ratios.(d) Profitability ratios.
13. What is a serious limitation of financial ratios?(a) Ratios are screening devices.(b) Ratios can be used only by themselves.(c) Ratios indicate weaknesses only.(d) Ratios are not predictive.
14. What is the most widely used liquidity ratio?(a) Quick ratio.(b) Current ratio.(c) Inventory turnover.(d) Debt ratio.
Understanding Financial Statements,Eighth Edition, by Lyn M. Fraser and Aileen Ormiston. Published by Prentice Hall. Copyright © 2007 by Pearson Education, Inc.
ISB
N:
0-53
6-48
044-
3
226 CHAPTER 6 The Analysis of Financial Statements
15. What is a limitation common to both the current and the quick ratio?(a) Accounts receivable may not be truly liquid.(b) Inventories may not be truly liquid.(c) Marketable securities are not liquid.(d) Prepaid expenses are potential sources of cash.
16. Why is the quick ratio a more rigorous test of short-run solvency than thecurrent ratio?(a) The quick ratio considers only cash and marketable securities as
current assets.(b) The quick ratio eliminates prepaid expenses for the numerator.(c) The quick ratio eliminates prepaid expenses for the denominator.(d) The quick ratio eliminates inventories from the numerator.
17. What does an increasing collection period for accounts receivable suggestabout a firm’s credit policy?(a) The credit policy is too restrictive.(b) The firm is probably losing qualified customers.(c) The credit policy may be too lenient.(d) The collection period has no relationship to a firm’s credit policy.
18. Which of the following statements about inventory turnover is false?(a) Inventory turnover measures the efficiency of the firm in managing
and selling inventory.(b) Inventory turnover is a gauge of the liquidity of a firm’s inventory.(c) Inventory turnover is calculated with cost of goods sold in the
numerator.(d) A low inventory turnover is generally a sign of efficient inventory
management.19. Which of the following items would cause the cash conversion cycle to
decrease?(a) Increasing days payable outstanding.(b) Increasing the average collection period.(c) Increasing the days inventory held.(d) None of the above.
20. What do the asset turnover ratios measure?(a) The liquidity of the firm’s current assets.(b) Management’s effectiveness in generating sales from investments
in assets.(c) The overall efficiency and profitability of the firm.(d) The distribution of assets in which funds are invested.
21. Which of the following ratios would not be used to measure the extent ofa firm’s debt financing?(a) Debt ratio.(b) Debt to equity.(c) Times interest earned.(d) Long-term debt to total capitalization.
22. Why is the amount of debt in a company’s capital structure important tothe financial analyst?(a) Debt implies risk.
Understanding Financial Statements,Eighth Edition, by Lyn M. Fraser and Aileen Ormiston. Published by Prentice Hall. Copyright © 2007 by Pearson Education, Inc.
ISB
N: 0-536-48044-3
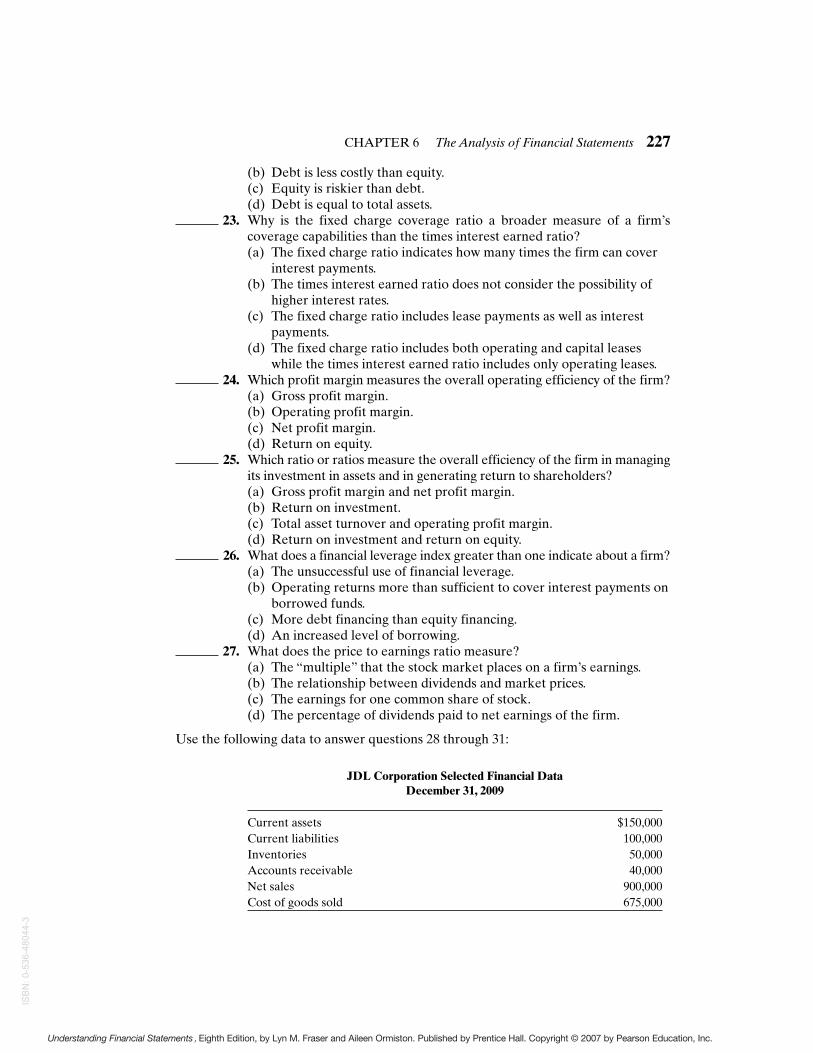
CHAPTER 6 The Analysis of Financial Statements 227
(b) Debt is less costly than equity.(c) Equity is riskier than debt.(d) Debt is equal to total assets.
23. Why is the fixed charge coverage ratio a broader measure of a firm’scoverage capabilities than the times interest earned ratio?(a) The fixed charge ratio indicates how many times the firm can cover
interest payments.(b) The times interest earned ratio does not consider the possibility of
higher interest rates.(c) The fixed charge ratio includes lease payments as well as interest
payments.(d) The fixed charge ratio includes both operating and capital leases
while the times interest earned ratio includes only operating leases.24. Which profit margin measures the overall operating efficiency of the firm?
(a) Gross profit margin.(b) Operating profit margin.(c) Net profit margin.(d) Return on equity.
25. Which ratio or ratios measure the overall efficiency of the firm in managingits investment in assets and in generating return to shareholders?(a) Gross profit margin and net profit margin.(b) Return on investment.(c) Total asset turnover and operating profit margin.(d) Return on investment and return on equity.
26. What does a financial leverage index greater than one indicate about a firm?(a) The unsuccessful use of financial leverage.(b) Operating returns more than sufficient to cover interest payments on
borrowed funds.(c) More debt financing than equity financing.(d) An increased level of borrowing.
27. What does the price to earnings ratio measure?(a) The “multiple” that the stock market places on a firm’s earnings.(b) The relationship between dividends and market prices.(c) The earnings for one common share of stock.(d) The percentage of dividends paid to net earnings of the firm.
Use the following data to answer questions 28 through 31:
JDL Corporation Selected Financial DataDecember 31, 2009
Current assets $150,000Current liabilities 100,000Inventories 50,000Accounts receivable 40,000Net sales 900,000Cost of goods sold 675,000
Understanding Financial Statements,Eighth Edition, by Lyn M. Fraser and Aileen Ormiston. Published by Prentice Hall. Copyright © 2007 by Pearson Education, Inc.
ISB
N:
0-53
6-48
044-
3
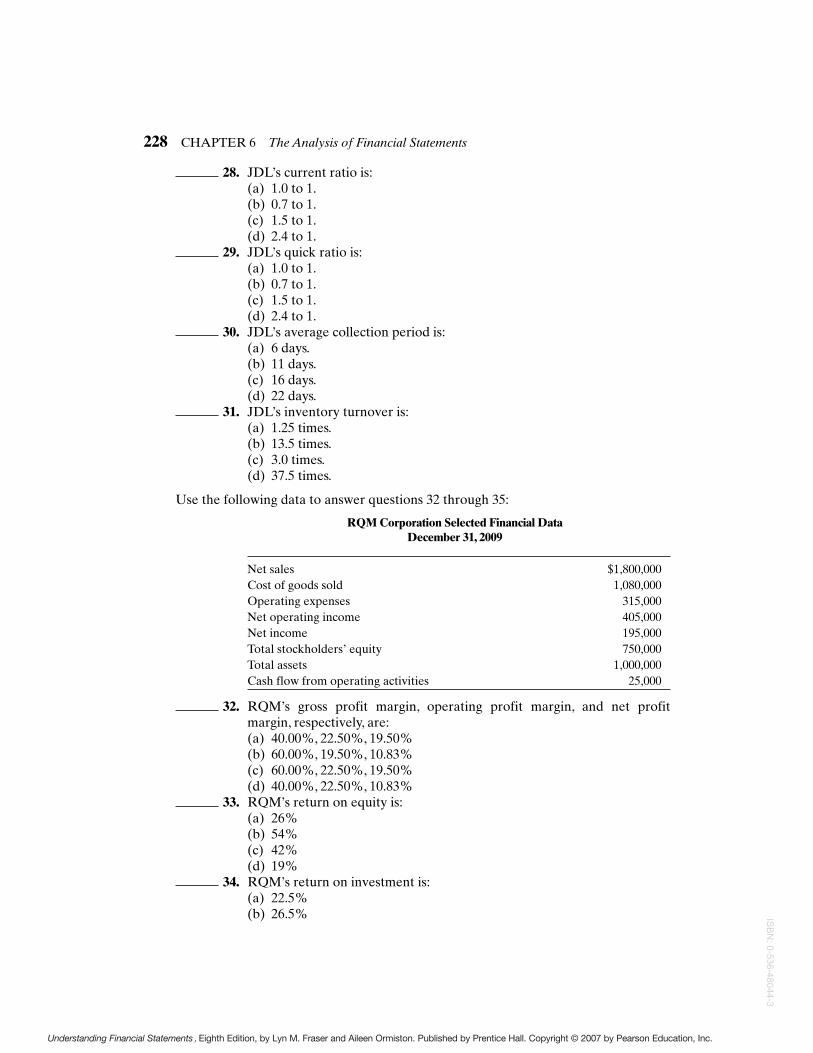
228 CHAPTER 6 The Analysis of Financial Statements
28. JDL’s current ratio is:(a) 1.0 to 1.(b) 0.7 to 1.(c) 1.5 to 1.(d) 2.4 to 1.
29. JDL’s quick ratio is:(a) 1.0 to 1.(b) 0.7 to 1.(c) 1.5 to 1.(d) 2.4 to 1.
30. JDL’s average collection period is:(a) 6 days.(b) 11 days.(c) 16 days.(d) 22 days.
31. JDL’s inventory turnover is:(a) 1.25 times.(b) 13.5 times.(c) 3.0 times.(d) 37.5 times.
Use the following data to answer questions 32 through 35:
RQM Corporation Selected Financial DataDecember 31, 2009
Net sales $1,800,000Cost of goods sold 1,080,000Operating expenses 315,000Net operating income 405,000Net income 195,000Total stockholders’ equity 750,000Total assets 1,000,000Cash flow from operating activities 25,000
32. RQM’s gross profit margin, operating profit margin, and net profitmargin, respectively, are:(a) 40.00%, 22.50%, 19.50%(b) 60.00%, 19.50%, 10.83%(c) 60.00%, 22.50%, 19.50%(d) 40.00%, 22.50%, 10.83%
33. RQM’s return on equity is:(a) 26%(b) 54%(c) 42%(d) 19%
34. RQM’s return on investment is:(a) 22.5%(b) 26.5%
Understanding Financial Statements,Eighth Edition, by Lyn M. Fraser and Aileen Ormiston. Published by Prentice Hall. Copyright © 2007 by Pearson Education, Inc.
ISB
N: 0-536-48044-3

CHAPTER 6 The Analysis of Financial Statements 229
(c) 19.5%(d) 40.5%
35. RQM’s cash flow margin is:(a) 1.4%(b) 2.5%(c) 10.8%(d) 12.8%
STUDY QUESTIONS AND PROBLEMS
6.1. Eleanor’s Computers is a retailer of computer products. Using the financial data provided,complete the financial ratio calculations for 2007. Advise management of any ratios thatindicate potential problems and provide an explanation of possible causes of the problems.
Industry Averages
Financial Ratios 2005 2006 2007 2007
Current ratio 1.71X 1.65X 1.70XQuick ratio .92X .89X .95XAverage collection period 60 days 60 days 65 daysInventory turnover 4.20X 3.90X 4.50XFixed asset turnover 3.20X 3.33X 3.00XTotal asset turnover 1.40X 1.35X 1.37XDebt ratio 59.20% 61.00% 60.00%Times interest earned 4.20X 3.70X 4.75XGross profit margin 25.00% 23.00% 22.50%Operating profit margin 12.50% 12.70% 12.50%Net profit margin 6.10% 6.00% 6.50%Return on total assets 8.54% 8.10% 8.91%Return on equity 20.93% 20.74% 22.28%Income Statement for Balance Sheet
Year Ended 12/31/07 at 12/31/07Sales $1,500,000 Cash $ 125,000Cost of goods sold 1,200,000 Accounts receivable 275,000Gross profit $ 300,000 Inventory 325,000Operating expenses 100,000 Current assets $ 725,000Operating profit $ 200,000 Fixed assets (net) $ 420,000Interest expense 72,000 Total Assets $1,145,000Earnings before tax 128,000 Accounts payable $ 150,000Income tax (0.4) 51,200 Notes payable 225,000Net Income $ 76,800 Accrued liabilities 100,000
Current liabilities 475,000Long-term debt 400,000
Total liabilities $ 875,000Equity 270,000Total liabilities
and equity $1,145,000
Understanding Financial Statements,Eighth Edition, by Lyn M. Fraser and Aileen Ormiston. Published by Prentice Hall. Copyright © 2007 by Pearson Education, Inc.
ISB
N:
0-53
6-48
044-
3

230 CHAPTER 6 The Analysis of Financial Statements
6.2. Luna Lighting, a retail firm, has experienced modest sales growth over the past three yearsbut has had difficulty translating the expansion of sales into improved profitability. Usingthree years’ financial statements, you have developed the following ratio calculations andindustry comparisons. Based on this information, suggest possible reasons for Luna’s prof-itability problems.
Industry 2009 2008 2007 2009
Current 2.3X 2.3X 2.2X 2.1XAverage collection period 45 days 46 days 47 days 50 daysInventory turnover 8.3X 8.2X 8.1X 8.3XFixed asset turnover 2.7X 3.0X 3.3X 3.5XTotal asset turnover 1.1X 1.2X 1.3X 1.5XDebt ratio 50% 50% 50% 54%Times interest earned 8.1X 8.2X 8.1X 7.2XFixed charge coverage 4.0X 4.5X 5.5X 5.1XGross profit margin 43% 43% 43% 40%Operating profit margin 6.3% 7.2% 8.0% 7.5%Net profit margin 3.5% 4.0% 4.3% 4.2%Return on assets 3.7% 5.0% 5.7% 6.4%Return on equity 7.4% 9.9% 11.4% 11.8%
6.3. RareMetals, Inc. sells a rare metal found only in underdeveloped countries overseas.As a result of unstable governments in these countries and the rarity of the metal, theprice fluctuates significantly. Financial information is given assuming the use of the first-in, first-out (FIFO) method of inventory valuation and also the last-in, first-out (LIFO)method of inventory valuation. Current assets other than inventory total $1,230 andcurrent liabilities total $1,600. The ending inventory balances are $1,350 for FIFOand $525 for LIFO.
Raremetals, Inc. Income Statements (in Thousands)
FIFO LIFONet sales $3,000 $3,000
Cost of goods sold 1,400 2,225Gross profit 1,600 775Selling, general and administrative 600 600
Operating profit 1,000 175Interest expense 80 80Earnings before taxes 920 95Provision for income taxes 322 33Net earnings $ 598 $ 62
Required
a. Calculate the following ratios assuming RareMetals, Inc. uses the FIFO method ofinventory valuation: gross profit margin, operating profit margin, net profit margin,current ratio, and quick ratio.
Understanding Financial Statements,Eighth Edition, by Lyn M. Fraser and Aileen Ormiston. Published by Prentice Hall. Copyright © 2007 by Pearson Education, Inc.
ISB
N: 0-536-48044-3

CHAPTER 6 The Analysis of Financial Statements 231
b. Calculate the ratios listed in (a) assuming RareMetals, Inc. uses the LIFO methodof inventory valuation.
c. Evaluate and explain the differences in the ratios calculated in (a) and (b).d. Will cash flow from operating activities differ depending on the inventory valuation
method used? If so, estimate the difference and explain your answer.
6.4. Eastman Kodak Company and Canon, Inc. are competitors in the camera manufacturingindustry. The following ratios and financial information have been compiled for these twocompanies:
Financial ratios (2000) Kodak CanonLiquidityCurrent (times) .88 1.71Quick (times) .61 1.21Cash flow liquidity (times) .20 .87Cash flow from operations (millions of $) 982 2,610ActivityAccounts receivable turnover (times) 5.27 5.80Inventory turnover (times) 4.67 3.21Payables turnover (times) 2.45 3.55Fixed asset turnover (times) 2.36 3.60Total asset turnover (times) .98 .98LeverageDebt ratio (%) 75.88 54.13Times interest earned (times) 12.44 16.39Cash interest coverage (times) 9.84 30.39Cash flow adequacy (times) .40 1.29ProfitabilityGross profit margin (%) 42.70 43.28Operating profit margin (%) 15.82 8.84Net profit margin (%) 10.05 4.82Cash flow margin (%) 7.02 12.46Return on assets (%) 9.90 4.73Return on equity (%) 41.04 10.33Cash return on assets (%) 6.91 12.24Earnings per share 4.62 1.16Closing stock price $39 per share $34 per share
Required
a. Compare and evaluate the strengths and weaknesses of Eastman Kodak and Canon.b. Calculate the price-to-earnings (PE) ratios for both firms. Explain what a PE ratio
tells an analyst. What could be the cause of the difference between Eastman Kodak’sand Canon’s PE ratios?
6.5. Determine the effect on the current ratio, the quick ratio, net working capital (current assetsless current liabilities), and the debt ratio (total liabilities to total assets) of each of the follow-ing transactions. Consider each transaction separately and assume that prior to each transac-tion the current ratio is 2X, the quick ratio is 1X, and the debt ratio is 50%.The company usesan allowance for doubtful accounts.
Understanding Financial Statements,Eighth Edition, by Lyn M. Fraser and Aileen Ormiston. Published by Prentice Hall. Copyright © 2007 by Pearson Education, Inc.
ISB
N:
0-53
6-48
044-
3
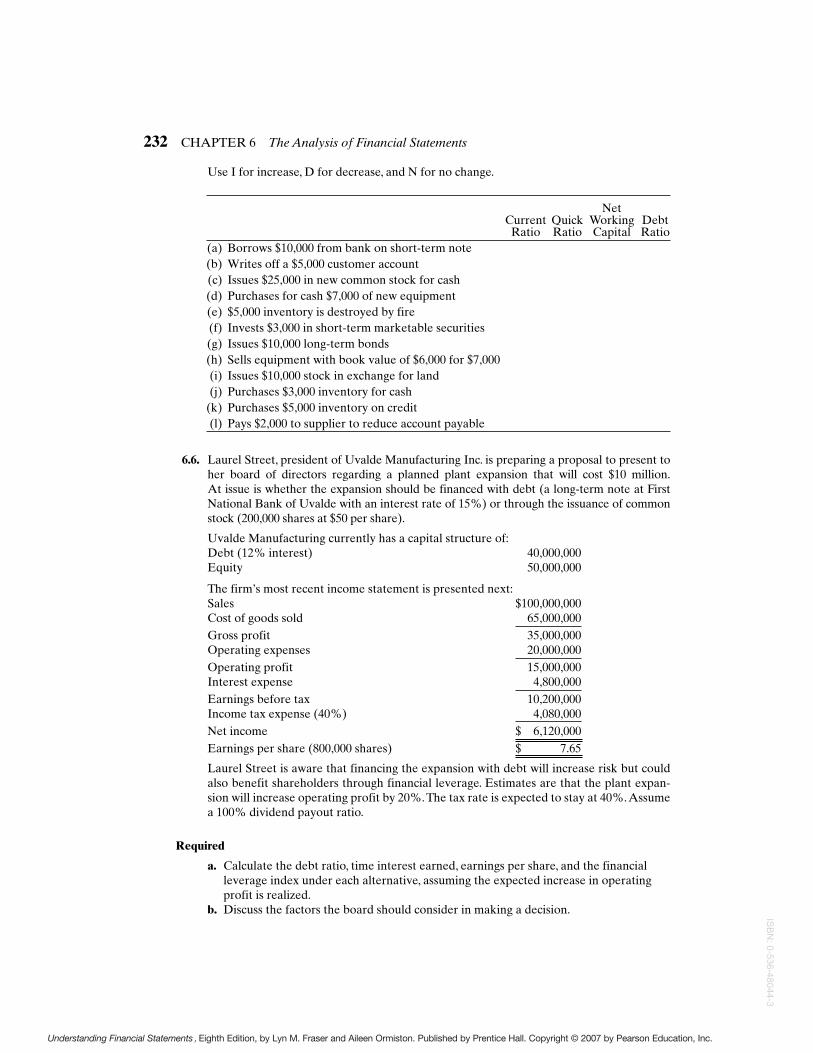
232 CHAPTER 6 The Analysis of Financial Statements
Use I for increase, D for decrease, and N for no change.
Net Current Quick Working Debt
Ratio Ratio Capital Ratio(a) Borrows $10,000 from bank on short-term note(b) Writes off a $5,000 customer account(c) Issues $25,000 in new common stock for cash(d) Purchases for cash $7,000 of new equipment(e) $5,000 inventory is destroyed by fire(f) Invests $3,000 in short-term marketable securities(g) Issues $10,000 long-term bonds(h) Sells equipment with book value of $6,000 for $7,000(i) Issues $10,000 stock in exchange for land(j) Purchases $3,000 inventory for cash
(k) Purchases $5,000 inventory on credit(l) Pays $2,000 to supplier to reduce account payable
6.6. Laurel Street, president of Uvalde Manufacturing Inc. is preparing a proposal to present toher board of directors regarding a planned plant expansion that will cost $10 million.At issue is whether the expansion should be financed with debt (a long-term note at FirstNational Bank of Uvalde with an interest rate of 15%) or through the issuance of commonstock (200,000 shares at $50 per share).
Uvalde Manufacturing currently has a capital structure of:Debt (12% interest) 40,000,000Equity 50,000,000
The firm’s most recent income statement is presented next:Sales $100,000,000Cost of goods sold 65,000,000Gross profit 35,000,000Operating expenses 20,000,000Operating profit 15,000,000Interest expense 4,800,000Earnings before tax 10,200,000Income tax expense (40%) 4,080,000Net income $ 6,120,000Earnings per share (800,000 shares) $ 7.65
Laurel Street is aware that financing the expansion with debt will increase risk but couldalso benefit shareholders through financial leverage. Estimates are that the plant expan-sion will increase operating profit by 20%.The tax rate is expected to stay at 40%.Assumea 100% dividend payout ratio.
Required
a. Calculate the debt ratio, time interest earned, earnings per share, and the financialleverage index under each alternative, assuming the expected increase in operatingprofit is realized.
b. Discuss the factors the board should consider in making a decision.
Understanding Financial Statements,Eighth Edition, by Lyn M. Fraser and Aileen Ormiston. Published by Prentice Hall. Copyright © 2007 by Pearson Education, Inc.
ISB
N: 0-536-48044-3

CHAPTER 6 The Analysis of Financial Statements 233
6.7. Using the ratios and information given for Amazon.com, an Internet retailer, analyze theshort-term liquidity and operating efficiency of the firm as of 2004.
Financial ratios 2004 2003LiquidityCurrent (times) 1.57 1.45Quick (times) 1.27 1.22Cash flow liquidity (times) 1.45 1.43Average collection period 11 days 9 daysDays inventory held 33 days 27 daysDays payable outstanding 79 days 75 daysCash conversion cycle (35 days) (39 days)ActivityAccounts receivable turnover (times) 34.76 40.04Inventory turnover (times) 11.09 13.63Payables turnover (times) 4.66 4.89Fixed asset turnover (times) 28.12 23.47Total asset turnover (times) 2.13 2.43Other informationCash flow from operations (millions of $) 567 392Revenues (millions of $) 6,921 5,264
6.8. The following ratios have been calculated for AMC Entertainment Inc., owner and operatorof movie theaters.Analyze the capital structure, long-term solvency, and profitability of AMC.
Financial ratios 2004 2003LeverageDebt ratio (%) 81.4 81.1Long-term debt to total capital (%) 72.6 72.2Debt to equity (times) 4.4 4.3Times interest earned (times) 1.2 0.7Cash interest coverage (times) 3.4 2.5Fixed charge coverage (times) 1.0 0.9Cash flow adequacy (times) 0.5 1.2ProfitabilityGross profit margin (%) 34.5 32.4Operating profit margin (%) 5.2 3.1Net profit margin (%) (0.6) (1.7)Cash flow margin (%) 10.3 7.2Return on assets (%) (0.7) (2.0)Return on equity (%) (3.8) (10.6)Cash return on assets (%) 12.2 8.7
Understanding Financial Statements,Eighth Edition, by Lyn M. Fraser and Aileen Ormiston. Published by Prentice Hall. Copyright © 2007 by Pearson Education, Inc.
ISB
N:
0-53
6-48
044-
3
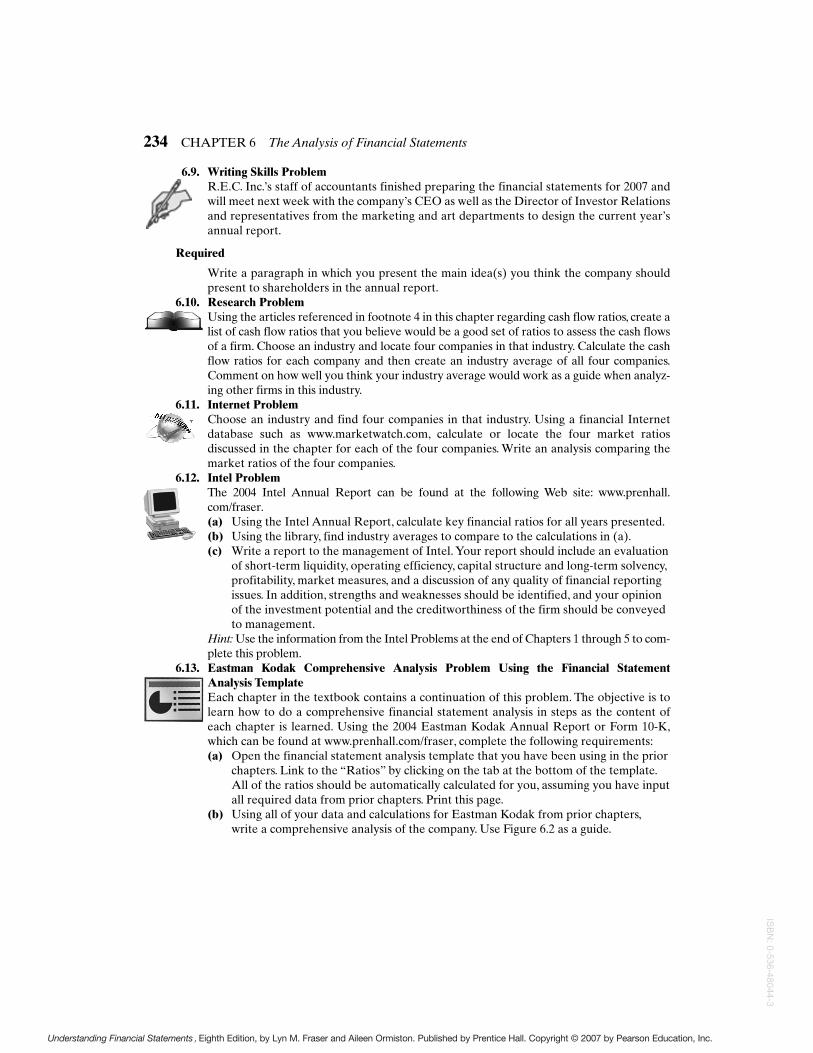
234 CHAPTER 6 The Analysis of Financial Statements
6.9. Writing Skills ProblemR.E.C. Inc.’s staff of accountants finished preparing the financial statements for 2007 andwill meet next week with the company’s CEO as well as the Director of Investor Relationsand representatives from the marketing and art departments to design the current year’sannual report.
Required
Write a paragraph in which you present the main idea(s) you think the company shouldpresent to shareholders in the annual report.
6.10. Research ProblemUsing the articles referenced in footnote 4 in this chapter regarding cash flow ratios, create alist of cash flow ratios that you believe would be a good set of ratios to assess the cash flowsof a firm. Choose an industry and locate four companies in that industry. Calculate the cashflow ratios for each company and then create an industry average of all four companies.Comment on how well you think your industry average would work as a guide when analyz-ing other firms in this industry.
6.11. Internet ProblemChoose an industry and find four companies in that industry. Using a financial Internetdatabase such as www.marketwatch.com, calculate or locate the four market ratiosdiscussed in the chapter for each of the four companies. Write an analysis comparing themarket ratios of the four companies.
6.12. Intel ProblemThe 2004 Intel Annual Report can be found at the following Web site: www.prenhall.com/fraser.(a) Using the Intel Annual Report, calculate key financial ratios for all years presented.(b) Using the library, find industry averages to compare to the calculations in (a).(c) Write a report to the management of Intel. Your report should include an evaluation
of short-term liquidity, operating efficiency, capital structure and long-term solvency,profitability, market measures, and a discussion of any quality of financial reportingissues. In addition, strengths and weaknesses should be identified, and your opinionof the investment potential and the creditworthiness of the firm should be conveyedto management.
Hint: Use the information from the Intel Problems at the end of Chapters 1 through 5 to com-plete this problem.
6.13. Eastman Kodak Comprehensive Analysis Problem Using the Financial StatementAnalysis TemplateEach chapter in the textbook contains a continuation of this problem. The objective is tolearn how to do a comprehensive financial statement analysis in steps as the content ofeach chapter is learned. Using the 2004 Eastman Kodak Annual Report or Form 10-K,which can be found at www.prenhall.com/fraser, complete the following requirements:(a) Open the financial statement analysis template that you have been using in the prior
chapters. Link to the “Ratios” by clicking on the tab at the bottom of the template.All of the ratios should be automatically calculated for you, assuming you have inputall required data from prior chapters. Print this page.
(b) Using all of your data and calculations for Eastman Kodak from prior chapters,write a comprehensive analysis of the company. Use Figure 6.2 as a guide.
Understanding Financial Statements,Eighth Edition, by Lyn M. Fraser and Aileen Ormiston. Published by Prentice Hall. Copyright © 2007 by Pearson Education, Inc.
ISB
N: 0-536-48044-3
Case 6.1 Action PerformanceCompanies, Inc.
Action Performance Companies, Inc.designs and sells licensed motorsportscollectible and consumer products. In theUnited States the company is a licenseeof among others, NASCAR, Indy RacingLeague, World of Outlaws, and NationalHot Rod Association. In Germany, thefirm merchandises Formula One and high-end auto manufacturer die-cast replicavehicles. The company outsources most ofthe production, but retains ownership ofthe designs and tooling. Products aremarketed through distributors, tracksidestores, mass-merchant retailers and collec-tors’ catalog club, television program-ming, and Internet sites managed byQVC.
In September 2003, Funline MerchandiseCo., Inc. (Funline) was acquired by ActionPerformance Companies, Inc. Funline distrib-utes non-NASCAR die-cast vehicles. Selectedinformation from the 2004 Form 10-K of
Action Performance Companies, Inc. is onpages 236–241.*
Required1. Analyze the firm’s financial statements
and supplementary information.Youranalysis should include the preparationof common-size financial statements,key financial ratios, and an evaluationof short-term liquidity, operating effi-ciency, capital structure and long-termsolvency, profitability, and market mea-sures. (The financial statement analysistemplate can be accessed and used atwww.prenhall.com/fraser.)
2. Identify the strengths and weaknessesof the company.
3. What is your opinion of the invest-ment potential and the creditworthi-ness of Action PerformanceCompanies, Inc.?
C A S E S
Case 6.1 Action PerformanceCompanies, Inc.
CHAPTER 6 The Analysis of Financial Statements 235
*Source: Action Performance Companies, Inc. 2004 Form 10-K.
Understanding Financial Statements,Eighth Edition, by Lyn M. Fraser and Aileen Ormiston. Published by Prentice Hall. Copyright © 2007 by Pearson Education, Inc.
ISB
N:
0-53
6-48
044-
3
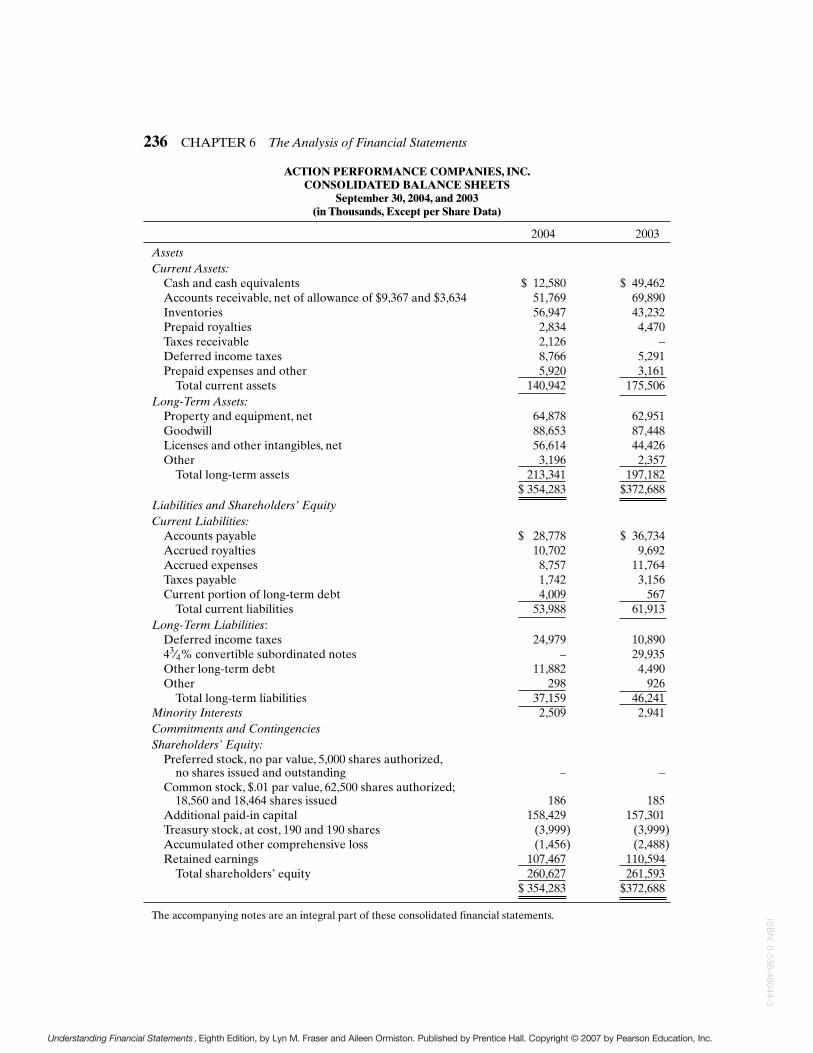
236 CHAPTER 6 The Analysis of Financial Statements
ACTION PERFORMANCE COMPANIES, INC.CONSOLIDATED BALANCE SHEETS
September 30, 2004, and 2003(in Thousands, Except per Share Data)
2004 2003
AssetsCurrent Assets:
Cash and cash equivalents $ 12,580 $ 49,462Accounts receivable, net of allowance of $9,367 and $3,634 51,769 69,890Inventories 56,947 43,232Prepaid royalties 2,834 4,470Taxes receivable 2,126 –Deferred income taxes 8,766 5,291Prepaid expenses and other 5,920 3,161
Total current assets 140,942 175,506Long-Term Assets:
Property and equipment, net 64,878 62,951Goodwill 88,653 87,448Licenses and other intangibles, net 56,614 44,426Other 3,196 2,357
Total long-term assets 213,341 197,182$ 354,283 $372,688
Liabilities and Shareholders’ EquityCurrent Liabilities:
Accounts payable $ 28,778 $ 36,734Accrued royalties 10,702 9,692Accrued expenses 8,757 11,764Taxes payable 1,742 3,156Current portion of long-term debt 4,009 567
Total current liabilities 53,988 61,913Long-Term Liabilities:
Deferred income taxes 24,979 10,89043⁄4% convertible subordinated notes – 29,935Other long-term debt 11,882 4,490Other 298 926
Total long-term liabilities 37,159 46,241Minority Interests 2,509 2,941Commitments and ContingenciesShareholders’ Equity:
Preferred stock, no par value, 5,000 shares authorized,no shares issued and outstanding – –
Common stock, $.01 par value, 62,500 shares authorized;18,560 and 18,464 shares issued 186 185
Additional paid-in capital 158,429 157,301Treasury stock, at cost, 190 and 190 shares (3,999) (3,999)Accumulated other comprehensive loss (1,456) (2,488)Retained earnings 107,467 110,594
Total shareholders’ equity 260,627 261,593$ 354,283 $372,688
The accompanying notes are an integral part of these consolidated financial statements.
Understanding Financial Statements,Eighth Edition, by Lyn M. Fraser and Aileen Ormiston. Published by Prentice Hall. Copyright © 2007 by Pearson Education, Inc.
ISB
N: 0-536-48044-3

CHAPTER 6 The Analysis of Financial Statements 237
ACTION PERFORMANCE COMPANIES, INC.CONSOLIDATED STATEMENTS OF OPERATIONS AND COMPREHENSIVE INCOME
Years Ended September 30, 2004, 2003, and 2002 (in Thousands, Except per Share Data)
2004 2003 2002Net sales $ 344,330 $ 369,458 $ 406,558Cost of sales 247,959 245,879 250,810Gross profit 96,371 123,579 155,748Operating expenses:
Selling, general, and administrative 90,713 82,598 76,870Amortization of licenses and other intangibles 3,802 3,416 2,797
Total operating expenses 94,515 86,014 79,667Income from operations 1,856 37,565 76,081Interest expense (1,832) (2,085) (3,029)Gain (loss) on extinguishment of debt (322) 34 (1,361)Foreign exchange gains 1,545 3,574 1,500Earnings from joint venture 1,370 62 –Other income 204 485 773Other expense (1,215) (1,909) (1,411)Income before income taxes 1,606 37,726 72,553Income taxes 1,066 13,499 27,606Net income 540 24,227 44,947Currency translation 1,032 2,118 1,019Comprehensive income $ 1,572 $ 26,345 $ 45,966
Earnings Per Common Share:Basic $ 0.03 $ 1.36 $ 2.56Diluted $ 0.03 $ 1.33 $ 2.41
The accompanying notes are an integral part of these consolidated financial statements.
Debt and FinancingOther long-term debt consists of the following at September 30 (in thousands):
2004 2003Term Loan A due June 30, 2008, variable rate $ 1,644 $ –Term Loan B due June 30, 2007, variable rate 9,444 –Notes payable, secured by property and equipment, 6.0% to 8.4% 4,803 5,057Less current portion (4,009) (567)
$ 11,882 $ 4,490
On August 2, 2004, we redeemed $29.9 mil-lion of 43⁄4% convertible subordinated notesat a price of 100.68% for cash of $30.1 million.We funded the redemption with cash onhand, revolving credit facility borrowings, andthe term loans under the loan and security
agreement.The subordinated notes were con-vertible, at the option of the holders, intoshares of common stock at the initial conver-sion price of $48.20 per share, subject toadjustments in certain events and would havematured on April 1, 2005.
Understanding Financial Statements,Eighth Edition, by Lyn M. Fraser and Aileen Ormiston. Published by Prentice Hall. Copyright © 2007 by Pearson Education, Inc.
ISB
N:
0-53
6-48
044-
3

238 CHAPTER 6 The Analysis of Financial Statements
ACTION PERFORMANCE COMPANIES, INC.CONSOLIDATED STATEMENTS OF CASH FLOWS
Years Ended September 30, 2004, 2003, and 2002(in Thousands)
2004 2003 2002Cash Flows From Operating Activities:Net income $ 540 $ 24,227 $ 44,947Adjustments to reconcile net income to net cash
provided by operating activities-Deferred income taxes (885) 3,354 (133)Depreciation and amortization 30,184 26,153 23,722(Gain) loss on extinguishment of debt 322 (34) 1,361Stock option tax benefits 142 623 2,864Undistributed earnings from joint venture (1,370) (62) –Other 1,149 982 1,976
Change in assets and liabilities, net of businesses acquired and disposed:
Accounts receivable, net of allowance 18,456 (1,865) (18,518)Inventories (13,077) (363) (4,522)Prepaid royalties 3,706 15 3,285Other assets (2,785) 2,890 (2,116)Accounts payable and accrued expenses (9,469) (6,117) 5,869Accrued royalties (1,167) (4,241) (1,655)Taxes payable and receivable, net (3,660) (1,851) (3,366)Other liabilities (2,273) (4,285) (989)
Net cash provided by operating activities 19,813 39,426 52,725
Cash Flows From Investing Activities:Property and equipment purchases (24,940) (33,366) (25,800)Property and equipment sales proceeds 84 245 261Acquisitions of businesses and intangibles, net of costs (8,142) (15,733) (19,006)Other 615 – (238)
Net cash used in investing activities (32,383) (48,854) (44,783)
Cash Flow From Finanving Activities:Long-term debt borrowings 11,700 3,001 –Long-term debt repayments (31,303) (9,429) (6,397)Stock option and other exercise proceeds 330 871 6,618Common stock purchases for treasury – (2,024) (1,975)Dividends paid - common shareholders (3,663) (2,497) –Dividends paid - minority interest shareholders (1,609) (1,256) (1,353)
Net cash used in financing activities (24,545) (11,334) (3,107)Effect of exchange rate changes on cash and cash
equivalents 233 639 236Net change in cash and cash equivalents (36,882) (20,123) 5,071Cash and cash equivalents, beginning of year 49,462 69,585 64,514Cash and cash equivalents, end of year $ 12,580 $ 49,462 $ 69,585
The accompanying notes are an integral part of these consolidated financial statements.
Understanding Financial Statements,Eighth Edition, by Lyn M. Fraser and Aileen Ormiston. Published by Prentice Hall. Copyright © 2007 by Pearson Education, Inc.
ISB
N: 0-536-48044-3

CHAPTER 6 The Analysis of Financial Statements 239
Income TaxesA reconciliation of the federal income tax rate to the Company’s effective rate follows:
2004 2003 2002Statutory federal rate 34% 35% 35%State taxes, net of federal benefit (2) 2 2Foreign incremental rate 28 2 1Valuation allowances and other 6 (3) –
66% 36% 38%
Supplemental Cash Flow InformationThe supplemental cash flow disclosures follow (in thousands):
2004 2003 2002Supplemental disclosures:
Interest paid $ 2,252 $ 2,199 $ 2,705Income taxes paid 5,070 11,420 27,815
Commitments and ContingenciesRent expense recognized for noncan-cellable operating leases, net of sublease
income, totaled $3.9 million, $4.1 million,and $2.1 million for 2004, 2003 and 2002.
Contractual Obligations andCommercial CommitmentsAggregate future minimum payments duecontractually under royalty agreement guar-
antees, personal service agreements, long-term debt, noncancellable operating leases,commercial letters of credit, and other uncon-ditional purchase obligations are as follows asof September 30, 2004 (in thousands):
Royalty Personal Long- Unconditional Agreement Service term Interest Lease Purchase
Year Guarantees Agreements Debt Payments Payments Obligations Total2005 $ 19,145 $ 1,514 $ 4,009 $ 260 $ 5,681 $ 12,600 $ 43,2092006 17,938 843 4,036 238 5,189 – 28,2442007 15,996 379 3,504 213 4,923 – 25,0152008 14,514 135 1,036 188 4,092 – 19,9652009 14,491 135 254 163 3,650 – 18,693Thereafter 39,695 68 3,052 1,084 10,004 – 53,903Total $ 121,779 $ 3,074 $ 15,891 $ 2,146 $ 33,539 $ 12,600 $189,029
Year Ended September 30, 2004Compared with Year EndedSeptember 30, 2003Net sales decreased to $344.3 million for2004, compared to $369.5 million in 2003, a
decline of $25.1 million, or 6.8%, fromthe 2003 fiscal year. Revenues for theyear included $42.1 million from Funline,which was acquired in 2003 and con-tributed $0.5 million in that year.Excluding the impact of the Funline
Understanding Financial Statements,Eighth Edition, by Lyn M. Fraser and Aileen Ormiston. Published by Prentice Hall. Copyright © 2007 by Pearson Education, Inc.
ISB
N:
0-53
6-48
044-
3
240 CHAPTER 6 The Analysis of Financial Statements
acquisition, revenues were down $66.8 mil-lion, or 18.1% from 2003.
Domestic die-cast sales decreased $6.2million, or 4.2%, from the prior year whileforeign die-cast sales increased $2.3million, or 6.6%. The domestic die-castsegment sales decrease of $6.2 million iscomprised of a $38.3 million decrease inour wholesale distribution and promotionrevenues, a $4.9 million decrease in ourdie-cast retail collectors’ catalog clubrevenues, and an offsetting $37.0 millionincrease in domestic die-cast wholesalesales to mass-merchant retailers. Domesticdie-cast wholesale distribution and promo-tion revenues and collector’s catalog clubrevenues were down as a result of prob-lems in our wholesale distribution networkand from a weak NASCAR collectordie-cast market. In 2004, approximatelyone-third of our distributors experiencedfinancial hardships of varying degrees,which impacted both their ordering pat-terns as well as their ability to pay ourinvoices on a timely basis. The NASCARcollector die-cast market in 2004 sufferedfrom over production of both the numberof units in a given production run andthe varieties of product offerings. Theincrease in the variety of production runsmade our approval and production processdifficult to manage, resulting in a failure toship product into the market on a timelybasis thereby negatively impacting sales.We expect comparable sales from ourdomestic die-cast wholesale distributionand promotion revenues and collectors’catalog club revenues in 2005 as wecontinue to work to improve our die-cast distribution model and focus ourproduct offerings. Domestic die-castwholesale sales to mass-merchant retailersincreased $37.0 million as a result of the$41.7 million impact of increased revenuesfrom Funline, acquired in September 2003,offset by the $4.7 million decrease in
NASCAR die-cast sales to mass-merchantretailers. NASCAR die-cast sales to mass-merchant retailers have been trending upyear-over-year in the last two quarters of2004. We expect double-digit growth inFunline sales in 2005 and single digitgrowth in NASCAR die-cast sales to mass-merchant retailers, based on merchantfeedback.
Year Ended September 30, 2003Compared with Year EndedSeptember 30, 2002Net sales decreased 9.1% to $369.5 millionfor 2003, from $406.6 million in 2002.Domestic die-cast sales decreased $60.6million, or 29.0%, from the prior year whileforeign die-cast sales increased $5.2million, or 17.7%. Domestic wholesale dis-tribution and promotion die-cast revenueswere down in part due to the four-monthdelay in producing Monte Carlo andPontiac products arising from the retoolingof those products, and in part due toreduced “special paint scheme” productvolumes resulting from the lack of high-impact specials and the economic envi-ronment. Mass-merchant retail domesticdie-cast revenues were down because ourlargest customer ordered virtually no prod-uct for delivery in the second half of 2003.The 17.7% increase in foreign die-castsales approximated the change in theaverage euro-to-U.S. dollar exchange ratebetween 2003 and 2002. The increasein domestic apparel and memorabiliasegment sales, exclusive of trackside was$23.3 million, or 21.7% from the prior year,and included a $22.5 million increase frombusinesses acquired in 2002. Trackside salesdecreased 8.4% to $52.5 million fromrevenues of $57.3 million in the prior year.Trackside revenues were impacted byadverse weather conditions and a weakeconomy.
Understanding Financial Statements,Eighth Edition, by Lyn M. Fraser and Aileen Ormiston. Published by Prentice Hall. Copyright © 2007 by Pearson Education, Inc.
ISB
N: 0-536-48044-3

CHAPTER 6 The Analysis of Financial Statements 241
ITEM 5. MARKET FOR THE REGISTRANT’S COMMON EQUITY, RELATED STOCKHOLDERMATTERS, AND ISSUER PURCHASES OF EQUITY SECURITIES
Common Stock Fiscal YearHigh Low Closing Price
2004:First Quarter $ 19.89 $ 12.58Second Quarter 18.13 13.57Third Quarter 15.49 9.74Fourth Quarter (through December 10, 2004) 11.20 8.37 $ 10.13
2003:First Quarter $ 21.60 $ 14.65Second Quarter 24.56 16.50Third Quarter 26.99 18.15Fourth Quarter 27.71 16.74 $ 24.44
2002:First Quarter $ 50.27 $ 30.03Second Quarter 51.99 27.75Third Quarter 34.30 20.68Fourth Quarter 26.71 15.80 $ 25.70
(A) Amounts indicated as deductions are for amounts charged against these reserves inthe ordinary course of business.
(B) Amounts indicated as charged to other accounts represent recoveries of $0.5 millionand a reclassification of $1.9 million from allowance for doubtful accounts, long term(Other Assets).
(C) Amounts indicated as charged to other accounts represent a reclassification of ($0.9)million to allowance for doubtful accounts, long term (Other Assets), and ($0.1) millionto other liabilities.
(D) Amounts indicated as charged to other accounts represent recoveries of $0.4 million,a reclassification of $(1.0) million to allowance for doubtful accounts, long term(Other Assets), and $0.1 million acquired in the acquisition of Jeff HamiltonCollection, Inc.
ACTION PERFORMANCE COMPANIES, INC.VALUATION AND QUALIFYING ACCOUNTS
Years Ended September 30, 2004, 2003, and 2002(in Thousands)
Additions— (Charged to) Balance at Charged to or credited
beginning of costs and from other Deductions Balance at Description year expenses accounts (A) end of yearAllowance for
doubtful accounts:2004 $ 3,634 $ 6,768 $ 2,440 (B) $ (3,475) $ 9,3672003 2,127 3,121 (1,009) (C) (605) 3,6342002 2,141 1,589 (548) (D) (1,055) 2,127
Understanding Financial Statements,Eighth Edition, by Lyn M. Fraser and Aileen Ormiston. Published by Prentice Hall. Copyright © 2007 by Pearson Education, Inc.
ISB
N:
0-53
6-48
044-
3
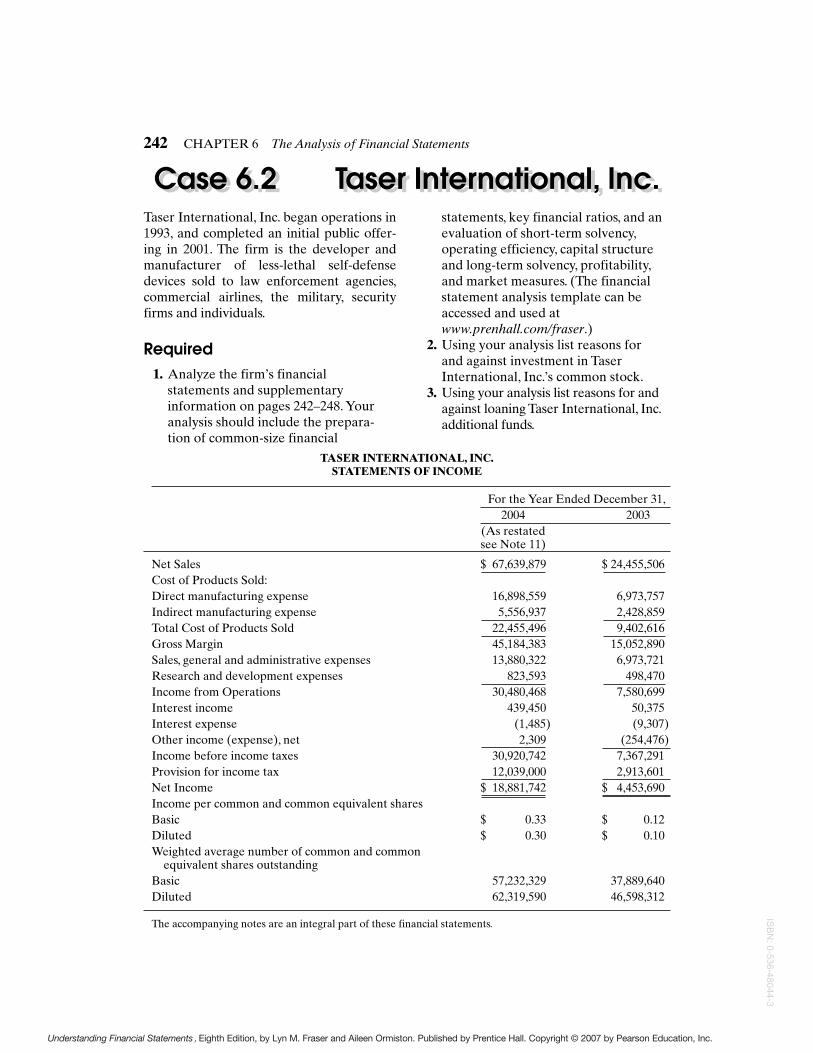
Case 6.2 Taser International, Inc.Taser International, Inc. began operations in1993, and completed an initial public offer-ing in 2001. The firm is the developer andmanufacturer of less-lethal self-defensedevices sold to law enforcement agencies,commercial airlines, the military, securityfirms and individuals.
Required1. Analyze the firm’s financial
statements and supplementaryinformation on pages 242–248. Youranalysis should include the prepara-tion of common-size financial
statements, key financial ratios, and anevaluation of short-term solvency,operating efficiency, capital structureand long-term solvency, profitability,and market measures. (The financialstatement analysis template can beaccessed and used atwww.prenhall.com/fraser.)
2. Using your analysis list reasons forand against investment in TaserInternational, Inc.’s common stock.
3. Using your analysis list reasons for andagainst loaning Taser International, Inc.additional funds.
Case 6.2 Taser International, Inc.242 CHAPTER 6 The Analysis of Financial Statements
TASER INTERNATIONAL, INC.STATEMENTS OF INCOME
For the Year Ended December 31,2004 2003
(As restatedsee Note 11)
Net Sales $ 67,639,879 $ 24,455,506Cost of Products Sold:Direct manufacturing expense 16,898,559 6,973,757Indirect manufacturing expense 5,556,937 2,428,859Total Cost of Products Sold 22,455,496 9,402,616Gross Margin 45,184,383 15,052,890Sales, general and administrative expenses 13,880,322 6,973,721Research and development expenses 823,593 498,470Income from Operations 30,480,468 7,580,699Interest income 439,450 50,375Interest expense (1,485) (9,307)Other income (expense), net 2,309 (254,476)Income before income taxes 30,920,742 7,367,291Provision for income tax 12,039,000 2,913,601Net Income $ 18,881,742 $ 4,453,690Income per common and common equivalent sharesBasic $ 0.33 $ 0.12Diluted $ 0.30 $ 0.10Weighted average number of common and common
equivalent shares outstandingBasic 57,232,329 37,889,640Diluted 62,319,590 46,598,312
The accompanying notes are an integral part of these financial statements.
Understanding Financial Statements,Eighth Edition, by Lyn M. Fraser and Aileen Ormiston. Published by Prentice Hall. Copyright © 2007 by Pearson Education, Inc.
ISB
N: 0-536-48044-3

CHAPTER 6 The Analysis of Financial Statements 243
TASER INTERNATIONAL, INC.BALANCE SHEETS
December 31,2004 2003
(As restated see Note 11)
AssetsCurrent AssetsCash and cash equivalents $ 14,757,159 $ 15,878,326Short-term investments 17,201,477 —Accounts receivable, net 8,460,112 5,404,333Inventory 6,840,051 3,125,974Prepaids and other assets 1,639,734 536,815Income tax receivable 52,973 292,321Deferred income tax asset 11,083,422 1,137,196Total Current Assets 60,034,928 26,374,965Long-term investments 18,071,815 —Property and Equipment, net 14,756,512 3,946,881Deferred Income Tax Asset 15,310,207 —Intangible Assets, net 1,279,116 1,122,844Total Assets $109,452,578 $31,444,690
Liabilities and Stockholders’ EquityCurrent LiabilitiesNotes payable $ — $ 250,000Current portion of capital lease obligations 4,642 15,223Accounts payable and accrued liabilities 8,827,132 3,444,346Customer deposits 102,165 185,802Total Current Liabilities 8,933,939 3,895,371Capital Lease Obligations — 3,655Deferred Revenue 607,856 78,093Deferred Income Tax Liability — 40,121Total Liabilities 9,541,795 4,017,240Commitments and ContingenciesStockholders’ EquityPreferred Stock, $0.00001 par value per share;
25 million shares authorized; 0 shares issued and outstanding at December 31, 2004 and 2003 — —
Common Stock, $0.00001 par value per share;200 million shares authorized; 60,992,156 and 50,698,824 shares issued and outstanding at December 31, 2004 and 2003 609 507
Additional Paid-in Capital 75,850,810 22,249,321Retained Earnings 24,059,364 5,177,622Total Stockholders’ Equity 99,910,783 27,427,450Total Liabilities and Stockholders’ Equity $ 109,452,578 $ 31,444,690
The accompanying notes are an integral part of these financial statements.
Understanding Financial Statements,Eighth Edition, by Lyn M. Fraser and Aileen Ormiston. Published by Prentice Hall. Copyright © 2007 by Pearson Education, Inc.
ISB
N:
0-53
6-48
044-
3
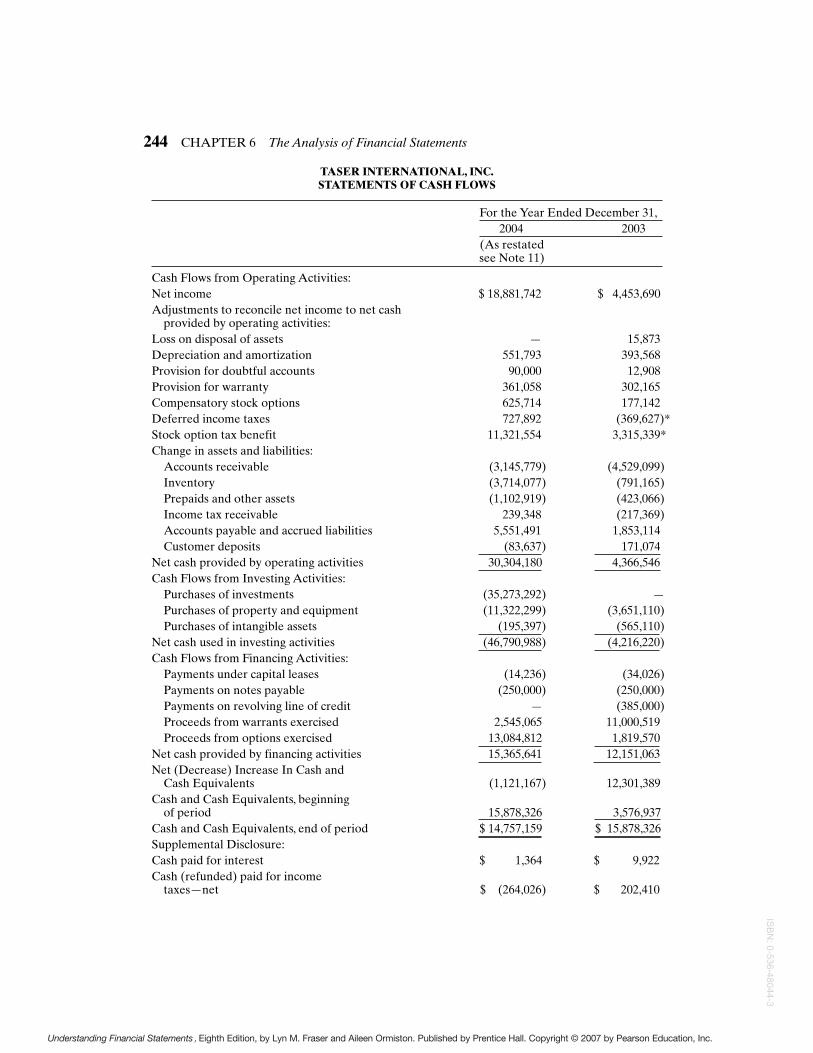
244 CHAPTER 6 The Analysis of Financial Statements
TASER INTERNATIONAL, INC.STATEMENTS OF CASH FLOWS
For the Year Ended December 31,2004 2003
(As restatedsee Note 11)
Cash Flows from Operating Activities:Net income $ 18,881,742 $ 4,453,690Adjustments to reconcile net income to net cash
provided by operating activities:Loss on disposal of assets — 15,873Depreciation and amortization 551,793 393,568Provision for doubtful accounts 90,000 12,908Provision for warranty 361,058 302,165Compensatory stock options 625,714 177,142Deferred income taxes 727,892 (369,627)*Stock option tax benefit 11,321,554 3,315,339*Change in assets and liabilities:
Accounts receivable (3,145,779) (4,529,099)Inventory (3,714,077) (791,165)Prepaids and other assets (1,102,919) (423,066)Income tax receivable 239,348 (217,369)Accounts payable and accrued liabilities 5,551,491 1,853,114Customer deposits (83,637) 171,074
Net cash provided by operating activities 30,304,180 4,366,546Cash Flows from Investing Activities:
Purchases of investments (35,273,292) —Purchases of property and equipment (11,322,299) (3,651,110)Purchases of intangible assets (195,397) (565,110)
Net cash used in investing activities (46,790,988) (4,216,220)Cash Flows from Financing Activities:
Payments under capital leases (14,236) (34,026)Payments on notes payable (250,000) (250,000)Payments on revolving line of credit — (385,000)Proceeds from warrants exercised 2,545,065 11,000,519Proceeds from options exercised 13,084,812 1,819,570
Net cash provided by financing activities 15,365,641 12,151,063Net (Decrease) Increase In Cash and
Cash Equivalents (1,121,167) 12,301,389Cash and Cash Equivalents, beginning
of period 15,878,326 3,576,937Cash and Cash Equivalents, end of period $ 14,757,159 $ 15,878,326Supplemental Disclosure:Cash paid for interest $ 1,364 $ 9,922Cash (refunded) paid for income
taxes—net $ (264,026) $ 202,410
Understanding Financial Statements,Eighth Edition, by Lyn M. Fraser and Aileen Ormiston. Published by Prentice Hall. Copyright © 2007 by Pearson Education, Inc.
ISB
N: 0-536-48044-3

CHAPTER 6 The Analysis of Financial Statements 245
Results of OperationsSales and marketing expenses were alsoreduced by 31%, to 11% of sales for 2004compared to 16% for 2003 due to betterleverage of the fixed expenses. In total, theCompany spent $7.2 million in promotingnew sales and servicing existing customers in2004, compared to $3.8 million for 2003. Themost significant increases were in the areasof public relations activities, law enforcementtraining programs, and travel and salariesexpenses. The increase in public relationsactivities is associated with the Company’scontinuing efforts to educate the public inregard to the safety and efficacy of its prod-ucts. In addition, the training programspresented cost the Company $1.1 million for2004 compared to $482,000 for 2003.
n. Concentration of Credit Riskand Major Customers
Financial instruments that potentially sub-ject the Company to concentrations ofcredit risk consist of accounts receivable.Sales are typically made on credit and theCompany generally does not require collat-eral. The Company performs ongoing creditevaluations of its customers’ financialcondition and maintains an allowance forestimated potential losses. Accounts receiv-able are presented net of an allowance fordoubtful accounts. The allowance for baddebts totaled $120,000 and $30,000 as ofDecember 31, 2004 and 2003, respectively.
The Company sells primarily through anetwork of unaffiliated distributors. TheCompany also reserves the right to selldirectly to the end user to secure its creditinterests. In 2004, the Company had three dis-tributors that met or exceeded 10% of totalsales; one of which represented 14% of sales,and two of which individually represented10% of sales. No other customer exceeded10% of product sales in 2004. Sales to oneU.S. customer represented 15% of total prod-uct sales for 2003. No other customerexceeded 10% of total product sales in 2003.
At December 31, 2004, the Companyhad receivables from two customers com-prising 21% and 16% of the aggregateaccounts receivable balance. These cus-tomers are unaffiliated distributors of theCompany’s products.At December 31, 2003,the Company had a receivable from onecustomer comprising 19% of the aggregateaccounts receivable balance. This customerwas one of the ten largest U.S. police forces.
The Company currently purchases fin-ished circuit boards and injection-moldedplastic components from suppliers locatedin the Phoenix area.Although the Companycurrently obtains these components fromsingle source suppliers, the Companyowns the injection molded component tool-ing used in their production. As a result,the Company believes it could obtainalternative suppliers in most cases withoutincurring significant production delays. The
Non Cash TransactionsIncrease to deferred tax asset related to tax benefits
realized from the exercise of stock options(with a related increase to additional paidin capital of $37,346,000 and 3,961,928) $ 26,024,446 $ 646,589
Note Payable issued for purchase of intangible assets $ — $ 500,000
The accompanying notes are an integral part of these financial statements.
*Due to the 2004 restatement,Taser International filed this statement with the SEC, but these two numbers wererestated from the 2003 Annual Report.As a result the column for 2003 does not add correctly. For mathematicalpurposes it is suggested that the numbers originally filed in 2003 be used, which are as follows: Deferred incometaxes, (1,014,217) and Stock option tax benefit 3,961,928.
Understanding Financial Statements,Eighth Edition, by Lyn M. Fraser and Aileen Ormiston. Published by Prentice Hall. Copyright © 2007 by Pearson Education, Inc.
ISB
N:
0-53
6-48
044-
3
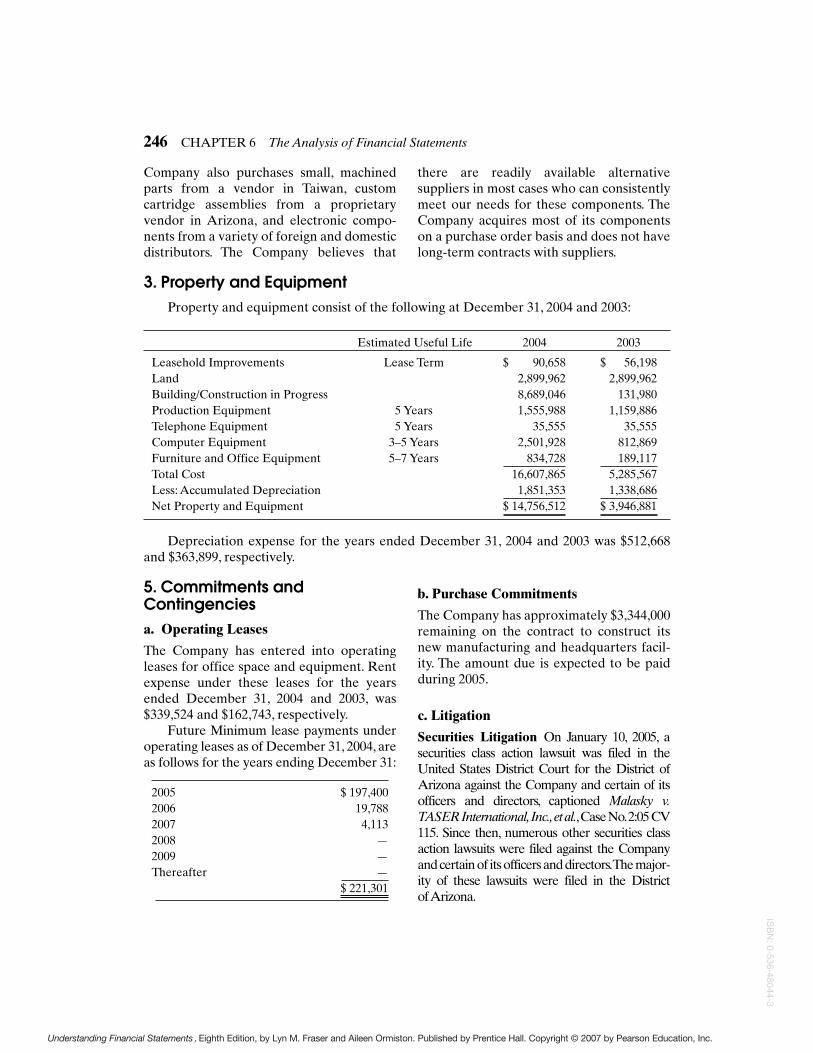
246 CHAPTER 6 The Analysis of Financial Statements
Company also purchases small, machinedparts from a vendor in Taiwan, customcartridge assemblies from a proprietaryvendor in Arizona, and electronic compo-nents from a variety of foreign and domesticdistributors. The Company believes that
there are readily available alternativesuppliers in most cases who can consistentlymeet our needs for these components. TheCompany acquires most of its componentson a purchase order basis and does not havelong-term contracts with suppliers.
3. Property and EquipmentProperty and equipment consist of the following at December 31, 2004 and 2003:
Estimated Useful Life 2004 2003
Leasehold Improvements Lease Term $ 90,658 $ 56,198Land 2,899,962 2,899,962Building/Construction in Progress 8,689,046 131,980Production Equipment 5 Years 1,555,988 1,159,886Telephone Equipment 5 Years 35,555 35,555Computer Equipment 3–5 Years 2,501,928 812,869Furniture and Office Equipment 5–7 Years 834,728 189,117Total Cost 16,607,865 5,285,567Less: Accumulated Depreciation 1,851,353 1,338,686Net Property and Equipment $ 14,756,512 $ 3,946,881
Depreciation expense for the years ended December 31, 2004 and 2003 was $512,668and $363,899, respectively.
b. Purchase Commitments
The Company has approximately $3,344,000remaining on the contract to construct itsnew manufacturing and headquarters facil-ity. The amount due is expected to be paidduring 2005.
c. Litigation
Securities Litigation On January 10, 2005, asecurities class action lawsuit was filed in theUnited States District Court for the District ofArizona against the Company and certain of itsofficers and directors, captioned Malasky v.TASER International,Inc.,et al.,Case No.2:05 CV115. Since then, numerous other securities classaction lawsuits were filed against the Companyand certain of its officers and directors.The major-ity of these lawsuits were filed in the DistrictofArizona.
5. Commitments andContingenciesa. Operating Leases
The Company has entered into operatingleases for office space and equipment. Rentexpense under these leases for the yearsended December 31, 2004 and 2003, was$339,524 and $162,743, respectively.
Future Minimum lease payments underoperating leases as of December 31, 2004, areas follows for the years ending December 31:
2005 $ 197,4002006 19,7882007 4,1132008 —2009 —Thereafter —
$ 221,301
Understanding Financial Statements,Eighth Edition, by Lyn M. Fraser and Aileen Ormiston. Published by Prentice Hall. Copyright © 2007 by Pearson Education, Inc.
ISB
N: 0-536-48044-3

CHAPTER 6 The Analysis of Financial Statements 247
Shareholder Derivative Litigation
On January 11, 2005, a shareholder derivativelawsuit was filed in the United States DistrictCourt for the District of Arizona purportedlyon behalf of the Company and against cer-tain of its officers and directors, captionedGoldfine v. Culver, et al., Case No. 2:05 CV123. Since then, five other shareholder deriv-ative lawsuits were filed in the Districtof Arizona, two shareholder derivative law-suits were filed in the Arizona SuperiorCourt, Maricopa County, and one share-holder derivative lawsuit was filed in theDelaware Chancery Court. On February 9,2005, the shareholder derivative actionspending in federal court were consolidatedinto a single action under the caption, In reTASER International Shareholder DerivativeLitigation, Case No. 2:05 CV 123. Pursuant tothe consolidating order, defendants will notrespond to any of the complaints originally inthese actions. Instead, defendants willrespond to plaintiffs’ consolidated amendedcomplaint. Defendants have not respondedto the cases filed in the Arizona SuperiorCourt or in Delaware Chancery Court.
The complaints in the shareholderderivative lawsuits generally allege that thedefendants breached the fiduciary dutiesowed to the Company and its shareholdersby reason of their positions as officersand/or directors of the Company. The com-plaints claim that such duties were breachedby defendants’ disclosure of allegedly falseor misleading statements about the safetyand effectiveness of Company products andthe Company’s financial prospects. Thecomplaints also claim that fiduciary dutieswere breached by defendants’ alleged use ofnon-public information regarding the safetyof Company products and the Company’sfinancial condition and future businessprospects for personal gain through the saleof the Company’s stock. The Company isnamed solely as a nominal defendantagainst which no recovery is sought.
Securities and Exchange CommissionInformal Inquiry
The Securities and Exchange Commissionhas initiated an informal inquiry into Taserwith respect to the basis for the Company’spublic statements concerning the safety andperformance of the Company’s products,disclosure issues and the accounting for cer-tain transactions. The inquiry is ongoing.
Product Liability Litigation
From April 2003 to March 2005, theCompany was named as a defendant in 18lawsuits in which the plaintiffs alleged eitherwrongful death or personal injury in situa-tions in which the TASER device was usedby law enforcement officers or during train-ing exercises. One case has been dismissedwith prejudice, another case has been dis-missed without prejudice and the balance ofthe cases are pending.We have submitted thedefense of each of these lawsuits to our insur-ance carriers as we maintained during theseperiods and continue to maintain product lia-bility insurance coverage with varying limitsand deductibles. The Company’s product lia-bility insurance coverage during these peri-ods ranged from $5,000,000 to $10,000,000 incoverage limits and from $10,000 to $250,000in deductibles. The Company is defendingeach of these lawsuits vigorously.
11. RestatementIn April 2005, subsequent to the issuance ofour financial statements for the year endedDecember 31, 2004, we discovered an errorin that certain stock option grants weretreated as incentive stock options whenthe grants should have been classified asnon-statutory stock options because of theannual limitation on incentive stock optionsunder applicable tax regulations. Foremployees who exercised stock optiongrants and held the underlying stock, to theextent such option grants should have been
Understanding Financial Statements,Eighth Edition, by Lyn M. Fraser and Aileen Ormiston. Published by Prentice Hall. Copyright © 2007 by Pearson Education, Inc.
ISB
N:
0-53
6-48
044-
3

248 CHAPTER 6 The Analysis of Financial Statements
classified as non-statutory stock options (asopposed to incentive stock options), theemployee’s taxable compensation wasunderstated and we were entitled to adeduction from our taxable income equal tothe amount of additional compensationattributable to the exercise of non-statutorystock options. This resulted in an increase inour previously reported deferred tax assetsat December 31, 2004 by approximately $3.0million, with a corresponding increase toour additional paid in capital. In addition,while incentive stock options are not subjectto payroll tax withholding, non-statutorystock options that result in ordinary incomewhen exercised are subject to payroll taxwithholding for the employee and an equalamount to be paid by the employer. Theimpact to us in the year ended December31, 2004 of the additional payroll taxwithholding was approximately $395,000,
which was recorded as an increase to ourselling, general and administrative expensesover amounts previously reported. As aresult, our provision for income taxdecreased by approximately $152,000,which resulted in a corresponding increasein our deferred tax assets. This adjustmentimpacted our previously reported netincome for the year ended December 31,2004 by approximately $243,000 whichreduced our diluted earnings per share forsuch period by $0.01 to $0.30. The change innet income was not significant enough toaffect basic earnings per share for the yearended December 31, 2004.
Closing Stock Price (adjustedfor stock splits)
12-31-04 $31.6512-31-03 $ 6.86
Understanding Financial Statements,Eighth Edition, by Lyn M. Fraser and Aileen Ormiston. Published by Prentice Hall. Copyright © 2007 by Pearson Education, Inc.
ISB
N: 0-536-48044-3
CHAPTER 6 The Analysis of Financial Statements 249
A p p e n d i x 6 A
The Analysis of Segmental Data
Beginning in calendar year 1998, com-panies were required by the provisionsof FASB Statement No. 131, “Disclosuresabout Segments of an Enterprise andRelated Information,” to disclose supple-mentary financial data for each reportablesegment. FASB Statement No. 131 alsocovers reporting requirements for foreignoperations, sales to major customers, anddisclosures required for enterprises thathave only one reportable segment. Seg-mental disclosures are valuable to thefinancial analyst in identifying areas ofstrength and weakness within a company,proportionate contribution to revenue andprofit by each division, the relationshipbetween capital expenditures and ratesof return for operating areas, and seg-ments that should be deemphasized oreliminated. The information on segmentsis presented as a supplementary sectionin the notes to the financial statements,as part of the basic financial statements,or in a separate schedule that is refer-enced and incorporated into the financialstatements.
An operating segment is defined byFASB Statement No. 131 as a component ofa business enterprise:
1. That engages in business activitiesfrom which it may earn revenues andincur expenses,
2. Whose operating results are regularlyreviewed by the company’s chiefoperating decision maker to makedecisions about resources allocated tothe segment and assesses its perfor-mance, and
3. For which discrete financial informa-tion is available.
A segment is considered to be reportableif any one of three criteria is met:
1. Revenue is 10% or more of com-bined revenue, including intersegmentrevenue.
2. Operating profit or loss is 10% ormore of the greater of combined profitof all segments with profit or com-bined loss of all segments with loss.
3. Segment assets exceed 10% or moreof combined assets of all segments.
The following information must be dis-closed according to FASB Statement No. 131:
1. General Information. The “manage-ment approach” is used to identifyoperating segments in the enterprise.The management approach is basedon the way that management organizesthe segments within the company formaking operating decisions and assess-ing performance. A company mustidentify how it is organized and whatfactors were used to identify operatingsegments and describe the types ofproducts and services from which eachoperating segment derives its revenues.
2. Information About Profit or Loss. Acompany must report a measure ofprofit or loss for each reportable seg-ment. In addition, certain amountsmust be disclosed if the specifiedamounts are included in informationreviewed by the chief operating deci-sion maker. For companies basingprofit or loss on pretax income from
Understanding Financial Statements,Eighth Edition, by Lyn M. Fraser and Aileen Ormiston. Published by Prentice Hall. Copyright © 2007 by Pearson Education, Inc.
ISB
N:
0-53
6-48
044-
3

250 CHAPTER 6 The Analysis of Financial Statements
continuing operations, the followingamounts must be disclosed1:
• Revenues (separated intosales to external customersand intersegment sales)
• Interest revenue• Interest expense• Depreciation, depletion, and
amortization expense
3. Information About Assets. A companymust report a measure of the totaloperating segments’ assets. Only assetsincluded in reports to the chief operat-ing decision maker should be included.The total capital expenditures thathave been added to long-lived assetsmust also be reported for each operat-ing segment.
The total of the operating segments’revenues, profit or loss, assets, and any otheritems reported shall be reconciled to thecompany’s total consolidated amounts foreach of these items.
The following analysis of Motorola’ssegment disclosures provides an illustrationof how to interpret segmental data.
Exhibit 6A.1 illustrates an excerptfrom the general information and thegeographic area information disclosed byMotorola, Inc. in the Company’s 2004annual report. Exhibit 6A.2 illustratesthe revenue, profit (loss), assets, capitalexpenditures, and depreciation expensefor Motorola’s six reportable segments:Personal Communications; Global TelecomSolutions; Commercial, Government, andIndustrial Solutions; Integrated ElectronicSystems; Broadband Communications; andOther Products. Segmental reporting doesnot include complete financial statements,
but it is feasible to perform an analysis ofthe key financial data presented.
Refer first to Exhibit 6A.1. The majorityof Motorola’s sales are from the UnitedStates. With the exception of China, saleshave increased each year in all geographicregions.
Referring to Exhibit 6A.2, notice thattotal revenue for Motorola declined in 2003,but rebounded in 2004. The company is nowgenerating overall operating profits in 2004compared to operating losses in 2002. Inorder to analyze the performance for eachsegment, six tables have been preparedfrom computations based on the figuresprovided in Exhibit 6A.2.
Table 6A.1 shows the percentage ofcontribution to total revenue by segment.Note the change in trends over the three-year period. Personal Communications notonly continues to be the largest revenueproducer, but also is contributing more in2004 to total revenues. All other segmentsare contributing less to revenue in 2004compared to 2002.
Table 6A.2 reveals the contribution bysegment to operating profit or loss andprovides a basis for assessing the ability ofa segment to translate revenue into profit.Personal Communications was the leadingcontributor to operating profit in 2004.Global Telecom Solutions contributedpositively to operating profits in 2004 andhas improved significantly since operatingat a loss in 2002. Commercial, Government,and Industrial Solutions and IntegratedElectronic Systems have continued togenerate operating profits but havedeclined significantly from 2002 to 2004 inthe percentage of profit generated overall.Broadband Communications and OtherProducts generated operating losses in 2002and 2003, but Broadband Communicationsis now generating a profit in 2004 and OtherProducts has generated less of a losscompared to 2002.
1If more complex profit measures are used, the com-pany must also disclose any unusual items, equityincome, income tax expense, extraordinary items,and other significant noncash items.
Understanding Financial Statements,Eighth Edition, by Lyn M. Fraser and Aileen Ormiston. Published by Prentice Hall. Copyright © 2007 by Pearson Education, Inc.
ISB
N: 0-536-48044-3
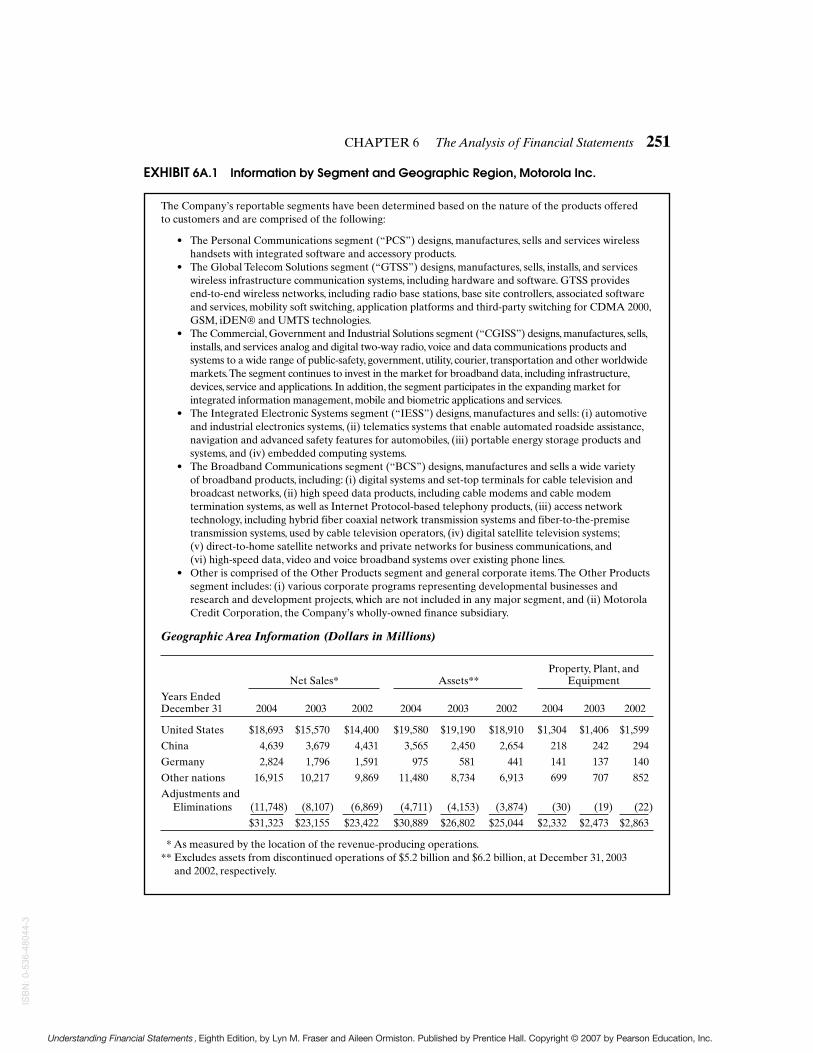
CHAPTER 6 The Analysis of Financial Statements 251
EXHIBIT 6A.1 Information by Segment and Geographic Region, Motorola Inc.
The Company’s reportable segments have been determined based on the nature of the products offeredto customers and are comprised of the following:
• The Personal Communications segment (“PCS”) designs, manufactures, sells and services wirelesshandsets with integrated software and accessory products.
• The Global Telecom Solutions segment (“GTSS”) designs, manufactures, sells, installs, and serviceswireless infrastructure communication systems, including hardware and software. GTSS provides end-to-end wireless networks, including radio base stations, base site controllers, associated softwareand services, mobility soft switching, application platforms and third-party switching for CDMA 2000,GSM, iDEN® and UMTS technologies.
• The Commercial, Government and Industrial Solutions segment (“CGISS”) designs, manufactures, sells,installs, and services analog and digital two-way radio, voice and data communications products andsystems to a wide range of public-safety, government, utility, courier, transportation and other worldwidemarkets.The segment continues to invest in the market for broadband data, including infrastructure,devices, service and applications. In addition, the segment participates in the expanding market forintegrated information management, mobile and biometric applications and services.
• The Integrated Electronic Systems segment (“IESS”) designs, manufactures and sells: (i) automotiveand industrial electronics systems, (ii) telematics systems that enable automated roadside assistance,navigation and advanced safety features for automobiles, (iii) portable energy storage products andsystems, and (iv) embedded computing systems.
• The Broadband Communications segment (“BCS”) designs, manufactures and sells a wide varietyof broadband products, including: (i) digital systems and set-top terminals for cable television andbroadcast networks, (ii) high speed data products, including cable modems and cable modemtermination systems, as well as Internet Protocol-based telephony products, (iii) access networktechnology, including hybrid fiber coaxial network transmission systems and fiber-to-the-premisetransmission systems, used by cable television operators, (iv) digital satellite television systems;(v) direct-to-home satellite networks and private networks for business communications, and(vi) high-speed data, video and voice broadband systems over existing phone lines.
• Other is comprised of the Other Products segment and general corporate items. The Other Productssegment includes: (i) various corporate programs representing developmental businesses andresearch and development projects, which are not included in any major segment, and (ii) MotorolaCredit Corporation, the Company’s wholly-owned finance subsidiary.
Geographic Area Information (Dollars in Millions)
Property, Plant, andNet Sales* Assets** Equipment
Years EndedDecember 31 2004 2003 2002 2004 2003 2002 2004 2003 2002
United States $18,693 $15,570 $14,400 $19,580 $19,190 $18,910 $1,304 $1,406 $1,599
China 4,639 3,679 4,431 3,565 2,450 2,654 218 242 294
Germany 2,824 1,796 1,591 975 581 441 141 137 140
Other nations 16,915 10,217 9,869 11,480 8,734 6,913 699 707 852
Adjustments andEliminations (11,748) (8,107) (6,869) (4,711) (4,153) (3,874) (30) (19) (22)
$31,323 $23,155 $23,422 $30,889 $26,802 $25,044 $2,332 $2,473 $2,863
* As measured by the location of the revenue-producing operations.** Excludes assets from discontinued operations of $5.2 billion and $6.2 billion, at December 31, 2003
and 2002, respectively.
Understanding Financial Statements,Eighth Edition, by Lyn M. Fraser and Aileen Ormiston. Published by Prentice Hall. Copyright © 2007 by Pearson Education, Inc.
ISB
N:
0-53
6-48
044-
3

252 CHAPTER 6 The Analysis of Financial Statements
EXHIBIT 6A.2 Motorola Inc. and Subsidiaries Segment Information (Dollars in Millions)
OperatingNet Sales Earnings (Loss)
Years Ended December 31 2004 2003 2002 2004 2003 2002
Personal Communications Segment $16,823 $10,978 $11,174 $1,708 $479 $503
Global Telecom Solutions Segment 5,457 4,417 4,611 759 247 (621)
Commercial, Government and Industrial Solutions Segment 4,588 4,131 3,749 753 562 313
Integrated Electronic Systems Segment 2,696 2,265 2,189 142 161 52
Broadband Communications Segment 2,335 1,857 2,143 116 (38) (216)
Other Products Segment 387 323 430 (229) (44) (214)
Adjustments and Eliminations (963) (816) (874) 47 3 13
$31,323 $23,155 $23,422 3,296 1,370 (170)
General Corporate (164) (97) (273)
Operating earnings (loss) 3,132 1,273 (443)
Total other income (expense) 120 103 (1,628)
Earnings (loss) from continuing operations before income taxes $3,252 $1,376 $(2,071)
General Corporate Operating Earnings (Loss) consists of expenses which are not identifiable with segmentactivity. Such items primarily consist of legal expenses, restructuring costs related to corporate employees andfacilities, Iridium-related costs (recoveries), and corporate costs that were not allocated to FreescaleSemiconductor in accordance with the discontinued operations presentation.
Capital DepreciationAssets Expenditures Expense
Years Ended December 31 2004 2003 2002 2004 2003 2002 2004 2003 2002
Personal Communications Segment $ 5,292 $ 3,783 $ 3,733 $ 91 $ 74 $ 101 $ 128 $ 159 $ 203
Global Telecom Solutions Segment 2,616 2,746 3,630 91 67 84 129 155 218
Commercial, Government and Industrial Solutions Segment 2,215 1,938 1,961 149 76 83 90 96 115
Integrated Electronic Systems Segment 1,368 1,102 1,032 99 44 55 77 74 75
Broadband Communications Segment 2,314 2,354 2,480 27 23 20 59 66 77
Other Products Segment 391 611 444 — — — 11 9 21
Adjustments and Eliminations (66) (124) (138) — — — 2 — —
14,130 12,410 13,142 457 284 343 496 559 709
General Corporate 16,759 14,392 11,902 37 60 44 65 104 194
Discontinued Operations — 5,244 6,189
$ 30,889 $ 32,046 $ 31,233 $ 494 $ 344 $ 387 $ 561 $ 663 $ 903
General corporate assets include primarily cash and cash equivalents, marketable securities, property,plant and equipment, cost-based investments, deferred income taxes and the administrative headquarters ofthe Company.
Understanding Financial Statements,Eighth Edition, by Lyn M. Fraser and Aileen Ormiston. Published by Prentice Hall. Copyright © 2007 by Pearson Education, Inc.
ISB
N: 0-536-48044-3
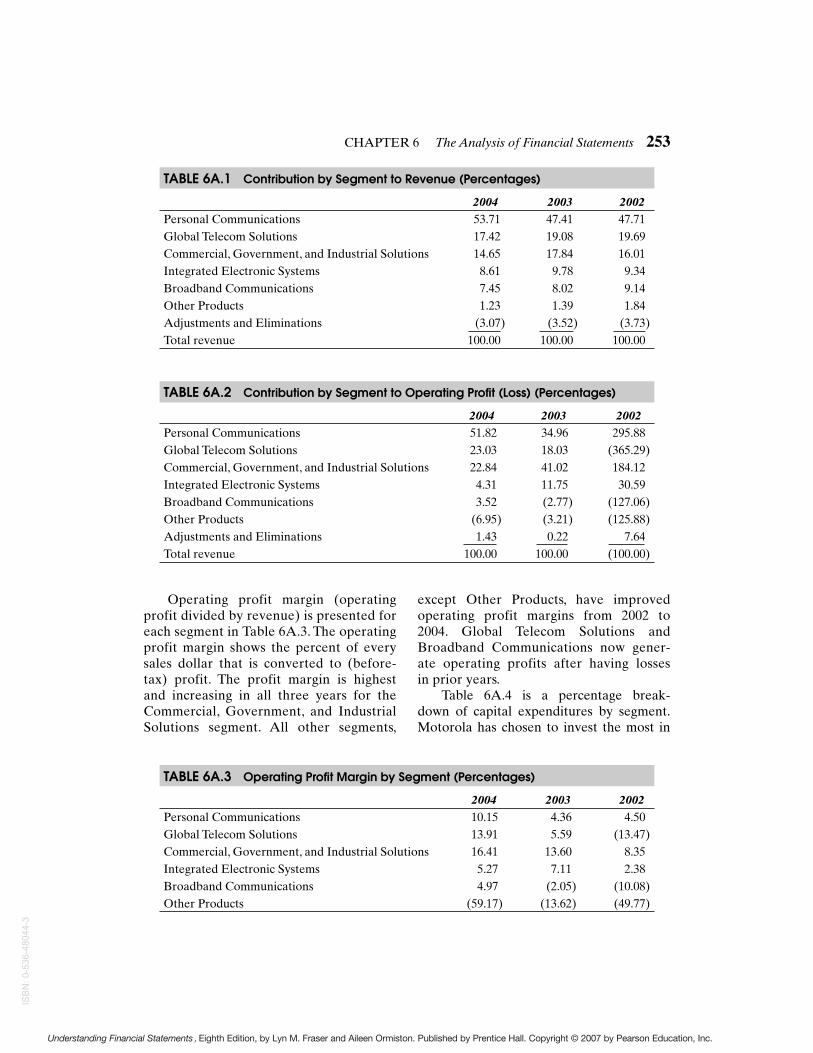
CHAPTER 6 The Analysis of Financial Statements 253
Operating profit margin (operatingprofit divided by revenue) is presented foreach segment in Table 6A.3. The operatingprofit margin shows the percent of everysales dollar that is converted to (before-tax) profit. The profit margin is highestand increasing in all three years for theCommercial, Government, and IndustrialSolutions segment. All other segments,
except Other Products, have improvedoperating profit margins from 2002 to2004. Global Telecom Solutions andBroadband Communications now gener-ate operating profits after having lossesin prior years.
Table 6A.4 is a percentage break-down of capital expenditures by segment.Motorola has chosen to invest the most in
TABLE 6A.1 Contribution by Segment to Revenue (Percentages)
2004 2003 2002
Personal Communications 53.71 47.41 47.71Global Telecom Solutions 17.42 19.08 19.69Commercial, Government, and Industrial Solutions 14.65 17.84 16.01Integrated Electronic Systems 8.61 9.78 9.34Broadband Communications 7.45 8.02 9.14Other Products 1.23 1.39 1.84Adjustments and Eliminations (3.07) (3.52) (3.73)Total revenue 100.00 100.00 100.00
TABLE 6A.2 Contribution by Segment to Operating Profit (Loss) (Percentages)
2004 2003 2002
Personal Communications 51.82 34.96 295.88Global Telecom Solutions 23.03 18.03 (365.29)Commercial, Government, and Industrial Solutions 22.84 41.02 184.12Integrated Electronic Systems 4.31 11.75 30.59Broadband Communications 3.52 (2.77) (127.06)Other Products (6.95) (3.21) (125.88)Adjustments and Eliminations 1.43 0.22 7.64Total revenue 100.00 100.00 (100.00)
TABLE 6A.3 Operating Profit Margin by Segment (Percentages)
2004 2003 2002
Personal Communications 10.15 4.36 4.50Global Telecom Solutions 13.91 5.59 (13.47)Commercial, Government, and Industrial Solutions 16.41 13.60 8.35Integrated Electronic Systems 5.27 7.11 2.38Broadband Communications 4.97 (2.05) (10.08)Other Products (59.17) (13.62) (49.77)
Understanding Financial Statements,Eighth Edition, by Lyn M. Fraser and Aileen Ormiston. Published by Prentice Hall. Copyright © 2007 by Pearson Education, Inc.
ISB
N:
0-53
6-48
044-
3
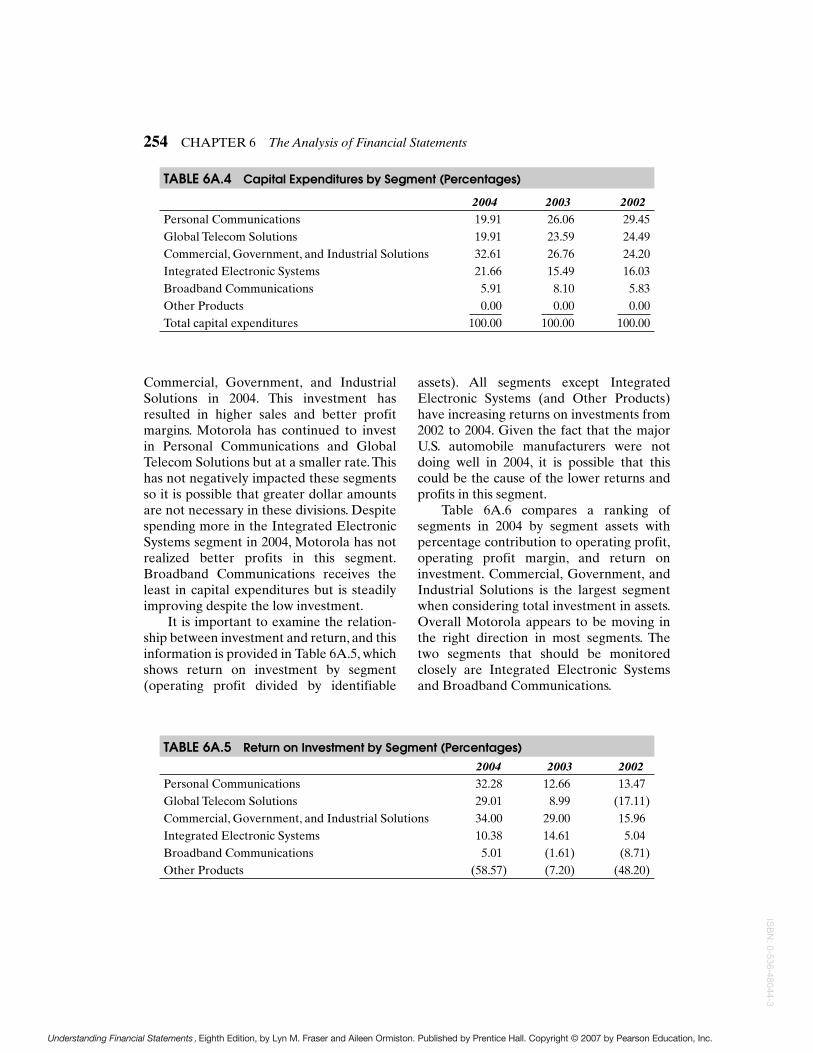
254 CHAPTER 6 The Analysis of Financial Statements
Commercial, Government, and IndustrialSolutions in 2004. This investment hasresulted in higher sales and better profitmargins. Motorola has continued to investin Personal Communications and GlobalTelecom Solutions but at a smaller rate. Thishas not negatively impacted these segmentsso it is possible that greater dollar amountsare not necessary in these divisions. Despitespending more in the Integrated ElectronicSystems segment in 2004, Motorola has notrealized better profits in this segment.Broadband Communications receives theleast in capital expenditures but is steadilyimproving despite the low investment.
It is important to examine the relation-ship between investment and return, and thisinformation is provided in Table 6A.5, whichshows return on investment by segment(operating profit divided by identifiable
TABLE 6A.5 Return on Investment by Segment (Percentages)2004 2003 2002
Personal Communications 32.28 12.66 13.47Global Telecom Solutions 29.01 8.99 (17.11)Commercial, Government, and Industrial Solutions 34.00 29.00 15.96Integrated Electronic Systems 10.38 14.61 5.04Broadband Communications 5.01 (1.61) (8.71)Other Products (58.57) (7.20) (48.20)
TABLE 6A.4 Capital Expenditures by Segment (Percentages)
2004 2003 2002
Personal Communications 19.91 26.06 29.45Global Telecom Solutions 19.91 23.59 24.49Commercial, Government, and Industrial Solutions 32.61 26.76 24.20Integrated Electronic Systems 21.66 15.49 16.03Broadband Communications 5.91 8.10 5.83Other Products 0.00 0.00 0.00Total capital expenditures 100.00 100.00 100.00
assets). All segments except IntegratedElectronic Systems (and Other Products)have increasing returns on investments from2002 to 2004. Given the fact that the majorU.S. automobile manufacturers were notdoing well in 2004, it is possible that thiscould be the cause of the lower returns andprofits in this segment.
Table 6A.6 compares a ranking ofsegments in 2004 by segment assets withpercentage contribution to operating profit,operating profit margin, and return oninvestment. Commercial, Government, andIndustrial Solutions is the largest segmentwhen considering total investment in assets.Overall Motorola appears to be moving inthe right direction in most segments. Thetwo segments that should be monitoredclosely are Integrated Electronic Systemsand Broadband Communications.
Understanding Financial Statements,Eighth Edition, by Lyn M. Fraser and Aileen Ormiston. Published by Prentice Hall. Copyright © 2007 by Pearson Education, Inc.
ISB
N: 0-536-48044-3

CHAPTER 6 The Analysis of Financial Statements 255
STUDY PROBLEM
TABLE 6A.6 Ranking of Segments in 2004
Percentage of Percent Operating Total Segment Contribution to Profit Return on
Segment Assets Operating Profit Margin Investment
Commercial, Government,and Industrial Solutions 32.61 22.84 16.41 34.00
Integrated Electronic Systems 21.66 4.31 5.27 10.38Personal Communications 19.91 51.82 10.15 32.28Global Telecom Solutions 19.91 23.03 13.91 29.01Broadband Communications 5.91 3.52 4.97 5.01Other Products 0.00 (6.95) (59.17) (58.57)
6A.1. The 2004 Eastman Kodak segment information from the annual report can be found atthe following Web site: www.prenhall.com/fraser. Using the segment information fromthe 2004 Eastman Kodak annual report, analyze all segments. Be sure to prepare tablescomparable to Tables 6A.1 through 6A.6 illustrated in the appendix to the chapter.
Understanding Financial Statements,Eighth Edition, by Lyn M. Fraser and Aileen Ormiston. Published by Prentice Hall. Copyright © 2007 by Pearson Education, Inc.
ISB
N:
0-53
6-48
044-
3