the amur river border. once a symbol of conflict, …...from the growing water scarcity in northern...
TRANSCRIPT
Cybergeo : European journal of Geography, N°242, 31/07/2003
The Amur River border.
Once a symbol of conflict, could it turn into a water resource stake ?1
Le fleuve Amour :
symbole de conflit passé, futur enjeu de ressource hydraulique ?
Frédéric Lasserre Professeur adjoint, département de géographie
Université Laval, Québec
Chercheur régulier Institut québécois des hautes études internationales (IQHEI)
Abstract : the relations between Russia and China have become much warmer since
the beginning of the 1990s ; they put an end to severe tensions between the two
countries. Now trade is expanding, and investment from China in the border area is
stimulating growth along the Amur River. But with growth also come water
withdrawals : sortages have already appeared in the basin. Prospects are all the more
problematic as northern China is facing severe water shortages that could partly be
solved, in the medium term, by a derivation from the Amur/Heilongjiang Basin.
Would such a project be considered given the still volatile state of relations between
Moscow and Beijing ?
Keywords : border, water management, water scarcity, China, Russia, Amur,
Heilongjiang, development.
Résumé : les relations entre la Chine et la Russie se sont considérablement détendues
depuis une dizaine d’années. Ce réchauffement diplomatique met un terme à la forte
tension qui régnait entre les deux pays. Le commerce croît, et les investissements
chinois dans la zone frontière stimulent la croissance le long du fleuve Amour. Mais
avec la croissance viennent les prélèvements en eau : des cas de manque d’eau sont
déjà apparus dans le bassin. Les perspectives sont d’autant plus problématiques que la
1 This research has been made possible thanks to a grant from the FQRSC.

Cybergeo : European journal of Geography, N°242, 31/07/2003
plaine de Chine du Nord est confrontée à de graves pénuries d’eau, lesquelles
pourraient être en partie résolues, à moyen terme, par un canal en provenance du
bassin de l’Amour/Heilongjiang. Une telle perspective pourrait-elle être envisageable,
compte tenu de la volatilité des relations entre Moscou et Beijing ?
Mots-clés : frontière, gestion de l’eau, rareté de l’eau, Chine, Russie, Amour,
Heilongjiang, développement.
On March 2nd, 14th and 15th, 1969, near Damanski/Chenpao Island on the
Ussuri River, Soviet and Chinese forces clashed severely (about 1 000 soldiers were
killed). With this confrontation that involved several hundred troops, the air force and
heavy mechanized equipment on both sides – the tensions between Moscow and
Beijing had escalated beyond the mere border clash. This heavy battle took place not
far from the site of the first battle between Chinese and Russian troops, in 1650… In
1969, China and the Soviet Union seemed on the brink of war. After tension receded
somewhat, the Amur River remained a tense area, heavily patrolled, a closed border.
With the warming of relations between the two countries, trade expanded and
economic growth began to alter the economic geography of the region. The then
Russian side slipped into recession, the Chinese side witnessed an unprecedented
economic boom. The Amur River border had become a trade gate between the two
neighbours; most political and border issues were settled peacefully through a series
of treaties.
It seems, however, that the new era of sino-russian relations is also tainted
with suspicion and long-term fears. Growth and trade opportunities in the Amur area
have attracted migrants to the area. Chinese immigration to the region is fuelling local
Russian fears of a “creeping invasion” aimed at claiming the former Chinese
territories back. At the government levels, relations are normalized and both sides
have engaged in trade and security cooperation, but the relationship remains uneasy
and tainted with long-term mistrust.
2
Cybergeo : European journal of Geography, N°242, 31/07/2003
Could water sharing become an issue between Russia and China ? Growth,
population expansion and agricultural development, especially on the Chinese side,
have also brought about the expansion of water withdrawals, at a time when the water
situation is worsening in the North China plain. Slow expansion, both industrial and
agricultural, is unlikely to create water scarcity in the Russian Far East, but water
demand on the Chinese side, coupled with a precipitation pattern that makes the
region vulnerable to droughts, is becoming an issue. In the Amur Basin, a region
where the water resource was considered infinite, scarcity is also becoming a
problem, both locally and because the Amur Basin water is becoming coveted in other
Chinese regions. Derivation projects have surfaced, conflicting uses of the Amur’s
water have emerged. A plan to rationalize the use of the Ussuri water has been set up,
but seems to be failing to reach its objectives because of poor coordination between
authorities.
The water issue in the border area between Russia and China stems mainly
from the growing water scarcity in Northern China, a scarcity that has reached the
point where officials openly mention water as a limitating factor to growth. At the
same time, agriculture is still expanding in the Northeast, in particular with crops that
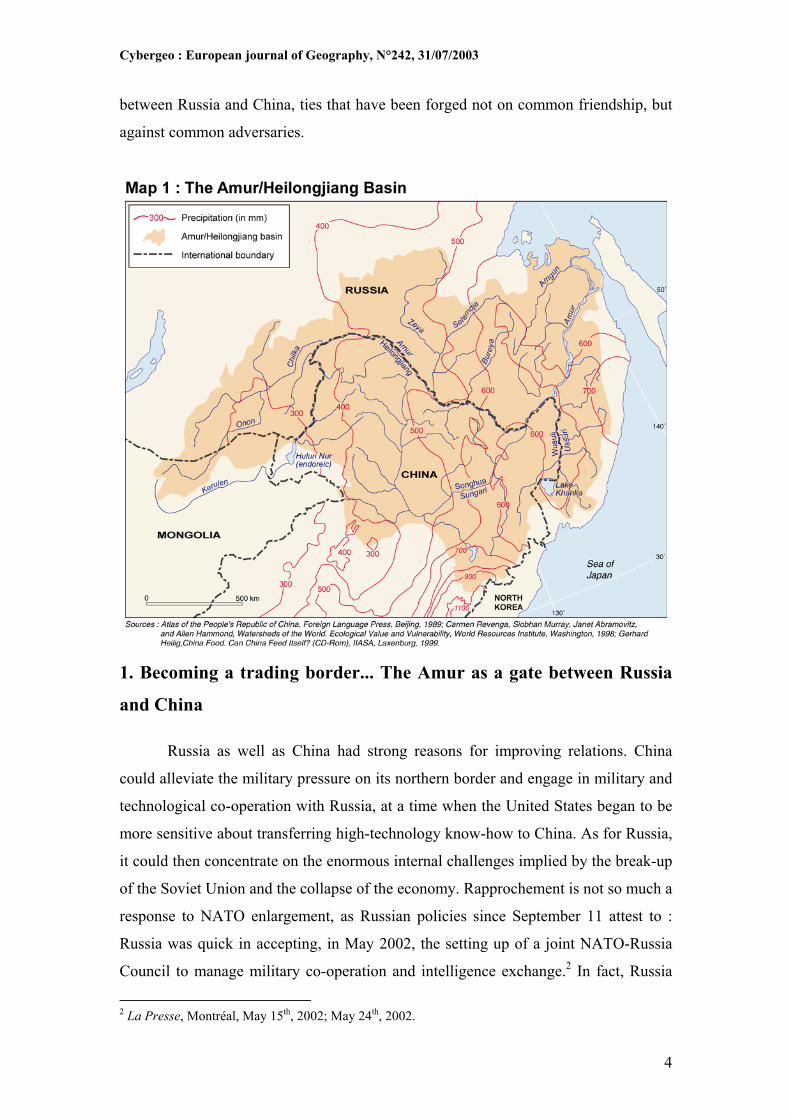
require large amounts of water. Water from the Chinese side of the Amur basin
(Map 1) is becoming caught between conflicting demands, local needs to expand
agriculture so as to feed China, and demand from the North China plain where the
rivers are running dry and water tables dropping fast.
Russian authorities have not published detailed hydrologic reports as to how
water resource sharing could become a political issue with China. The scarcity of
Russian figures does not mean, however, that authorities are not wary. They have
already expressed their concern over low levels of water in the Amur river basinWith
Chinese plans for increased consumption in the Northeast, locally first, and with
potential water exports in the longer term to quench an ever thirsty North China plain,
are local water resources on the Chinese side sufficient to satisfy demand ? To what
extent are growing water needs in Northeastern China going to affect the uneasy
China-Russia relationship ? Although it is of course too soon to answer, it is
nevertheless relevant to wonder if the fast increasing Chinese water demand, and the
probable ensuing water sharing issue, could alter the present mutually beneficial ties
3
Cybergeo : European journal of Geography, N°242, 31/07/2003
between Russia and China, ties that have been forged not on common friendship, but
against common adversaries.
1. Becoming a trading border... The Amur as a gate between Russia
and China
Russia as well as China had strong reasons for improving relations. China
could alleviate the military pressure on its northern border and engage in military and
technological co-operation with Russia, at a time when the United States began to be
more sensitive about transferring high-technology know-how to China. As for Russia,
it could then concentrate on the enormous internal challenges implied by the break-up
of the Soviet Union and the collapse of the economy. Rapprochement is not so much a
response to NATO enlargement, as Russian policies since September 11 attest to :
Russia was quick in accepting, in May 2002, the setting up of a joint NATO-Russia
Council to manage military co-operation and intelligence exchange.2 In fact, Russia
2 La Presse, Montréal, May 15th, 2002; May 24th, 2002.
4
Cybergeo : European journal of Geography, N°242, 31/07/2003
recognised its most urgent task was to deal with domestic economic security; to do so
effectively, good relations with the West as well as with China were needed.3 But, to
be sure, cooperation with China on the security front of islamic militant group is
developing fast.
In November 1997, Russian and Chinese officials signed a joint statement
indicating near-resolution of all border issues, after broad agreements were signed in
1991 and 1994. The leaders also set the target of bilateral trade at $20 billion for
2000, a figure that already seemed unrealistic at the time.4 Old contentious issues,
especially disputes about borders, have largely been eliminated, with the few
continuing problems managed by diplomatic compromise, the two governments
agreeing notably to disagree for 50 more years about the sovereignty over islands near
Khabarovsk.5 In 1992, Gorbachev’s promised withdrawal of Soviet forces from
Mongolia was completed under Russian President Eltsin. Confidence-building
measures have regularly been discussed since 1994, with agreements in 1994, 1996,
1997 and 1999. The last border agreement, signed in December 1999, settled the
dispute about Lake Khanka, specifically calls for the development of the Amur River
region. Several ports along the Amur, on both sides of the river, have been declared
open to trade for shipping companies of both countries.6
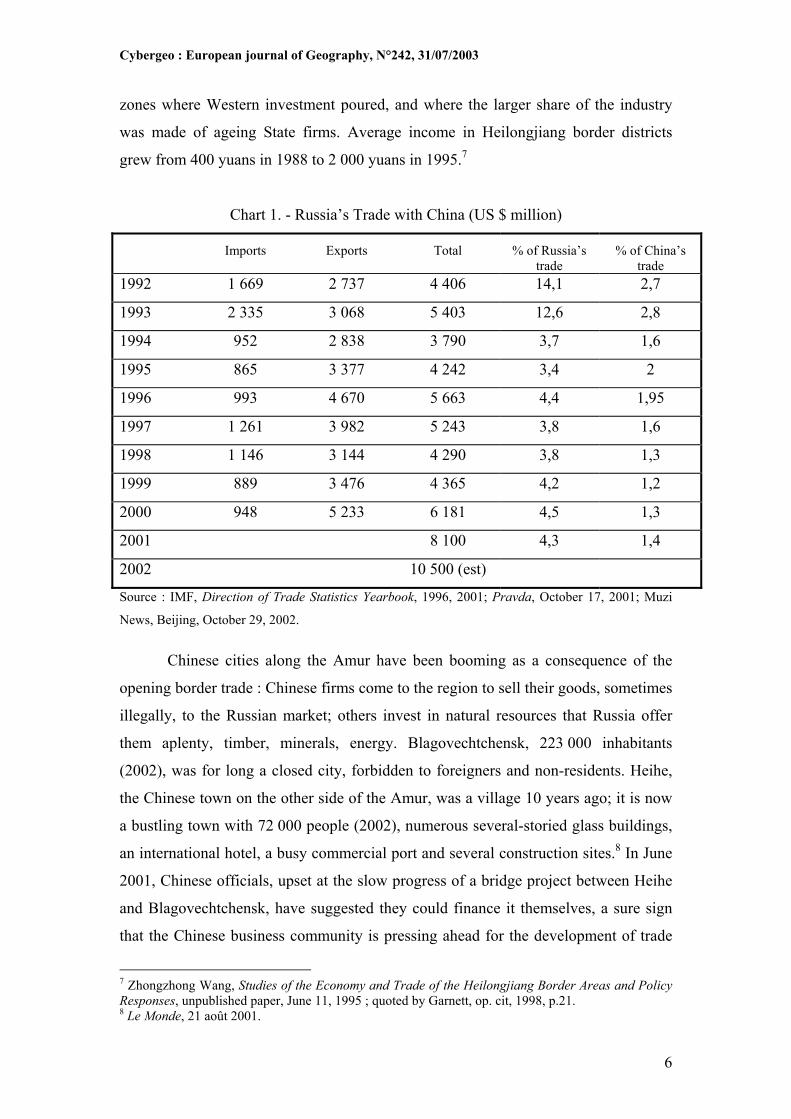
Russian-Chinese trade has expanded fast, from negligible levels of mainly
barter trade in 1989, to about 9,8 billion $ in 2001. Local trade is completely free
since 1995. This, in itself, dramatically alters the border landscape, for the previously
sealed border has turned into a border teeming with trade as well as construction and
investment projects, mostly from the Chinese side. Indeed, Russia-China trade
remains negligible among each country’s global trade, and is largely owing to arms
sales and nuclear power technology transfers from Russia.
But the impact of this border trade was very significant, especially for
Northeast China, a disadvantaged region, far from sea ports and special economic
3 Peggy Falkenheim Meyer, Sino-Russian Relations under Putin, CANCAPS Papier nº24, Toronto, March 2000, p.1. 4 BBC News, November 10, 1997. 5 Sherman Garnett, Limited Partnership. Russia-China Relations in a Changing Asia, Russian and Eurasian Program, Carnegie Endowment for International Peace, Washington, 1998, p.17. 6 BBC News, December 9, 1999 ; Jean Radvanyi, La Nouvelle Russie, Armand Colin, Paris, 2000, p.391 ; Sébastien Colin, « Confins sino-russes », in Michel Foucher (dir.), Asies Nouvelles, Belin, Paris, 2002, pp.331.
5
Cybergeo : European journal of Geography, N°242, 31/07/2003
zones where Western investment poured, and where the larger share of the industry
was made of ageing State firms. Average income in Heilongjiang border districts
grew from 400 yuans in 1988 to 2 000 yuans in 1995.7
Chart 1. - Russia’s Trade with China (US $ million)
Imports Exports Total % of Russia’s trade
% of China’s trade
1992 1 669 2 737 4 406 14,1 2,7
1993 2 335 3 068 5 403 12,6 2,8
1994 952 2 838 3 790 3,7 1,6
1995 865 3 377 4 242 3,4 2
1996 993 4 670 5 663 4,4 1,95
1997 1 261 3 982 5 243 3,8 1,6
1998 1 146 3 144 4 290 3,8 1,3
1999 889 3 476 4 365 4,2 1,2
2000 948 5 233 6 181 4,5 1,3
2001 8 100 4,3 1,4
2002 10 500 (est)
Source : IMF, Direction of Trade Statistics Yearbook, 1996, 2001; Pravda, October 17, 2001; Muzi
News, Beijing, October 29, 2002.
Chinese cities along the Amur have been booming as a consequence of the
opening border trade : Chinese firms come to the region to sell their goods, sometimes
illegally, to the Russian market; others invest in natural resources that Russia offer
them aplenty, timber, minerals, energy. Blagovechtchensk, 223 000 inhabitants
(2002), was for long a closed city, forbidden to foreigners and non-residents. Heihe,
the Chinese town on the other side of the Amur, was a village 10 years ago; it is now
a bustling town with 72 000 people (2002), numerous several-storied glass buildings,
an international hotel, a busy commercial port and several construction sites.8 In June
2001, Chinese officials, upset at the slow progress of a bridge project between Heihe
and Blagovechtchensk, have suggested they could finance it themselves, a sure sign
that the Chinese business community is pressing ahead for the development of trade
7 Zhongzhong Wang, Studies of the Economy and Trade of the Heilongjiang Border Areas and Policy Responses, unpublished paper, June 11, 1995 ; quoted by Garnett, op. cit, 1998, p.21. 8 Le Monde, 21 août 2001.
6
Cybergeo : European journal of Geography, N°242, 31/07/2003
and investment in the border area. Chinese officials also hint that they are interested in
giving a new impetus to agriculture in the Amur valley, for cereals and soybean
production notably.9
2. Demographic Imbalances, or the “Yellow Peril” revisited.
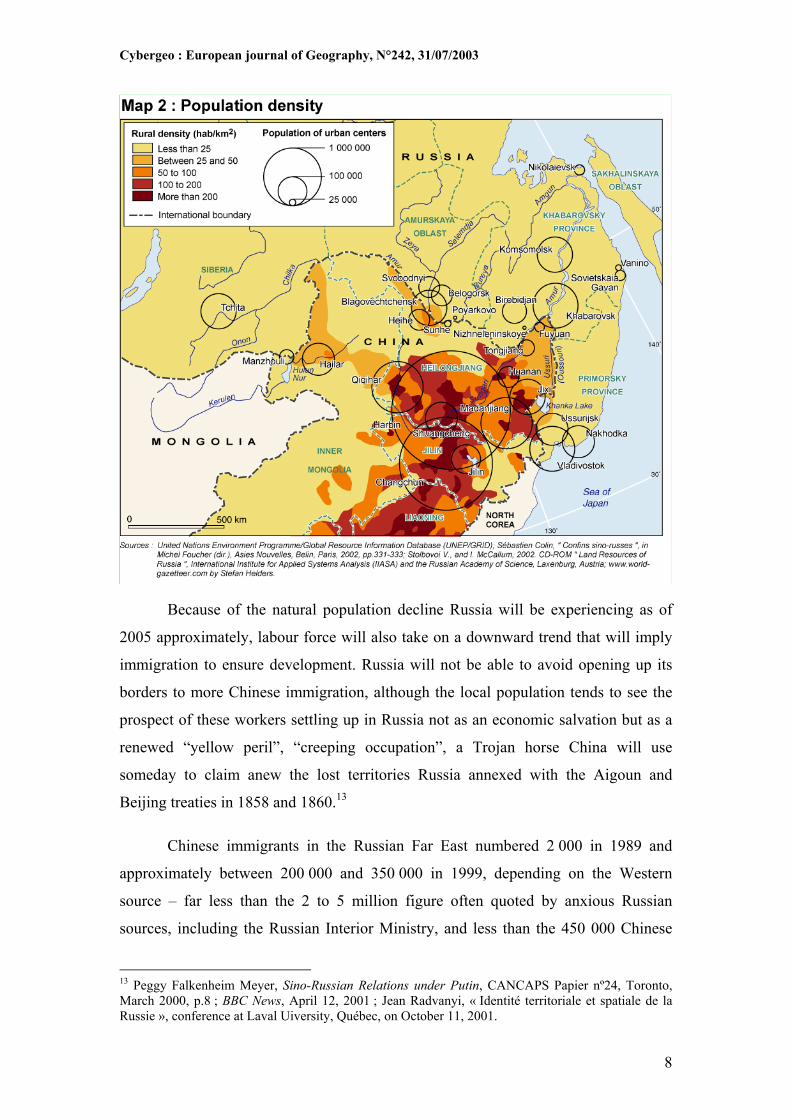
Only 7,5 million people live in the Russian Far East (and 2 million in the
Amur and Tchita regions) compared to 106,6 million in the three Northeast China
provinces (Heilongjiang, Jilin, Liaoning)10 in 2000. This implies average densities of
2,6 people/sq. km in Russia compared to 133 people/sq. km in Northeastern China
and 79,6 people/sq. km in the border province of Heilongjiang. This imbalance is all
the more worrying for Russian authorities as the natural growth rate is already
negative (-1,9 ‰ in 1994, -2,4 ‰ in 1996) and the demographic trend is clearly
toward a rapid population decrease since 1992 because of a massive negative
migration balance. It appeared for the first time around 1990-92. The rate of
outmigration grew from 12 per 10 000 in 1990 to 56 per 10 000 in 1992 and remained
high ever since. A 1994 study stated that “the demographic potential... of the Far East
is clearly insufficient for the development of the natural resources located there...”11,
especially in districts along the Amur region. Between 1992 and 1996, Khabarovskii
krai and Amur oblast lost 3,3% of their population, and Primorskii krai, 1,5%12
(Map 2).
9 Libération, 15 août 2001 ; Le Monde, 21 août 2001. 10 Heilongjiang, 37 million ; Jilin, 27 million ; Liaoning, 42 million. 11 A. G. Visnevskiy, The Population of Russia [Naseleniye Rossii], Moscow, Yevraziya, 1994 ; quoted by Garnett, op. cit., 1998, p.34 ; Peggy Falkenheim Meyer, Sino-Russian Relations under Putin, CANCAPS Papier nº24, op. cit., p.8. 12 Galina Vitkovskaya, Zhanna Zayonchkovskaya, Kathleen Newland, “Chinese Migration into Russia”, in Sherman Garrett (ed.), Rapprochement or Rivalry ? Russia-China Relations in a Changing Asia, Carnegie Endowment for International Peace, Washington, DC, 2000, p.351.
7
Cybergeo : European journal of Geography, N°242, 31/07/2003
Because of the natural population decline Russia will be experiencing as of
2005 approximately, labour force will also take on a downward trend that will imply
immigration to ensure development. Russia will not be able to avoid opening up its
borders to more Chinese immigration, although the local population tends to see the
prospect of these workers settling up in Russia not as an economic salvation but as a
renewed “yellow peril”, “creeping occupation”, a Trojan horse China will use
someday to claim anew the lost territories Russia annexed with the Aigoun and
Beijing treaties in 1858 and 1860.13
Chinese immigrants in the Russian Far East numbered 2 000 in 1989 and
approximately between 200 000 and 350 000 in 1999, depending on the Western
source – far less than the 2 to 5 million figure often quoted by anxious Russian
sources, including the Russian Interior Ministry, and less than the 450 000 Chinese
13 Peggy Falkenheim Meyer, Sino-Russian Relations under Putin, CANCAPS Papier nº24, Toronto, March 2000, p.8 ; BBC News, April 12, 2001 ; Jean Radvanyi, « Identité territoriale et spatiale de la Russie », conference at Laval Uiversity, Québec, on October 11, 2001.
8
Cybergeo : European journal of Geography, N°242, 31/07/2003
living in the region in 1897.14 Russian local politicians often considerably exaggerate
the scope of Chinese immigration to the area since it gives them a tool to capitalise on
resentment against economic decline, unemployment and fear for their future.15 They
always fail to mention that, although the Chinese provinces are much more populated
overall, the Chinese border areas have been relatively empty for a long time, because
of a lack of investment from Chinese authorities.
China does not nurture plans to retake the lost territories at the end of the
XIXth century. The rhetoric about the “unequal treaties” was more symbolic – Beijing
wanted Moscow to renegotiate a treaty that would, likely, bring about only minor
changes to the border. China carried on this policy to renegotiate all borders
agreements during the 1960s with its neighbours, so as to erase the memories of
border agreements that were inherited from the colonial era.16 However, the migration
pressure might become too strong for China to control, especially as agricultural
production faces severe challenges in North China, as will be seen below : fertile
farmland and available water, the crisis of agricultural production on the Russian side
of the Amur that sends foodstuff prices skyrocketing, the need for labour force, ample
timber, gold deposits make the region attractive for settlers from China.
Opening new agriculture fronts is already a priority in Chinese plans, because
of the severe water problem in Northern China.17 In the medium-term, it could also be
that China could seriously consider the derivation of water from the
Amur/Heilongjiang basin to Northern China. Far from being marked by a mere
problem of border communities, relations between China and Russia could prove
complicated by new resource stakes : water and irrigated lands.
14 Garnett, op. cit, 1998, p.37 ; Jean Radvanyi, La Nouvelle Russie, Armand Colin, 2000, p.392 ; ABC News, « Russian Border Worries », 14 July 2000 ; Galina Vitkovskaya, Zhanna Zayonchkovskaya, Kathleen Newland, “Chinese Migration into Russia”, in Sherman Garrett (ed.), Rapprochement or Rivalry ? Russia-China Relations in a Changing Asia, op. cit., 2000, p.349. 15 Garnett, op. cit, 1998, p.38 ; Le Monde, 21 août 2001 ; Philippe Bourbeau, La Chine et la diaspora chinoise, L’Harmattan/Chaire Raoul Dandurand, Paris, 2002, pp.35-45. 16 Frédéric Lasserre, Le Dragon et la Mer. Stratégies géopolitiques chinoises en mer de Chine du Sud. L’Harmattan/Chaire Raoul Dandurand, Paris et Montréal, 1996, pp.243-250. 17 Frédéric Lasserre, « La Chine importera de l’eau de ses lointaines montagnes », dans Frédéric Lasserre et Luc Descroix, Eaux et territoires: tensions, coopérations et géopolitique de l'eau, Presses Universitaires du Québec et l’Harmattan, Québec et Paris, à paraître, octobre 2002, pp.150-162.
9

Cybergeo : European journal of Geography, N°242, 31/07/2003
3. At the heart of the problem : the sheer size of irrigation use in
Northern China.
With 51 million hectares of irrigated land, China has more than any other
country. This compares with some 46 million hectares in India and 20 million in the
United States, the countries ranking second and third in irrigated area. Irrigated
surfaces grew by 34 million ha from the 17 million ha since 1950.18 Far more
important to China than to those two nations, irrigation covers roughly half of the total
cropland area and accounts for nearly four-fifths of the all-important grain harvest.
Located in the Northern China plain, the basins of the rivers Huang, Hai and Huai (3H
basin) account for about 44% of corn, 67% of wheat, 72% of millet, 40% of cotton
and 24% of vegetable oil productions.19 Irrigation in the 3H basin is relying on a
growing number of deeper and deeper tube wells, so as to pump into aquifers. The
global level of the water table fell by 1,5 meter per year between 1993 and 1998,
according to a study by the Agriculture University of Beijing.20 With most aquifers
being depleted, China is now reconsidering its options for reestablishing a balance
between water use and supply, since the destruction of these very aquifers would
bring a severe blow to agriculture in this region, given its dependence on
groundwater.
The Chinese Ministry of Water estimates show that expanding resource
exploitation in the North China plain is not an option : even with increased aquifer
pumping, total supply would, under a 95% probability, increase from 122 billion m³ in
1997 to 133,3 billion m³ in 2050, an increase of 9,1%. On the other hand, demand
change, taking into account a 10% efficiency improvement in agriculture and
industry, a strong price increase and the development of water reuse, would, in the
95% probability scenario, jump from 190,6 billion m³ in 1997 to 207,8 billion m³, also
a 9% increase : thus, envisioned measures would merely slow down the demand
18 MWR, Reform and Development in Water Sector in China, Beijing, 1997, unpaginated. 19 Wu, Kai, Tang, Deug-Yin and Xie, Xian-Qun, “Effects of Water Fluctuation on Agricultural Production in the Huang-Hai-Hai Plain, China”, The Journal of Geography, 9, 3, 1999, p.314; US Water News Online, www.uswaternews.com/archives/arcglobal/1worban6.html, June 2001. 20 Brown, Lester and Halweil, Brian. « China’s Water Shortage Could Shake World Food Security », WorldWatch Magazine, July-August 1998, p.12; South China Morning Post, December 10, 1998; Wiberg, 1999.
10
Cybergeo : European journal of Geography, N°242, 31/07/2003
increase to a similar pace as water supply, without closing a widening gap of 68,6
billion m³ in 1997 and 74,5 billion m³ in 2050.21
This is why irrigated agriculture really is at a crossroads in Northern China :
although more efficient techniques are slowly spreading, accounting for the
stabilization of water withdrawals, the level of water pumped underground and
withdrawn from surface streams is often not sustainable in the long run. Moreover,
poor drainage spread salinization that affected 20% of the 3H basin cultivated land in
1982 and about 25% in 1996.22 Only reclamation could make up for these soil losses,
since soil washing would require too large amounts of water, but reclamation has so
far aggravated desertification in Northern China and has often given poor results
because of the lack of water23; excess water use upstream also accelerate
desertification downstream, as it causes the degradation of the riparian tougai forests,
the drying of grasslands and the dispersion of fine silt.24 Thus, relative water scarcity
is really becoming the one factor that is limiting agriculture growth in Northern
China.
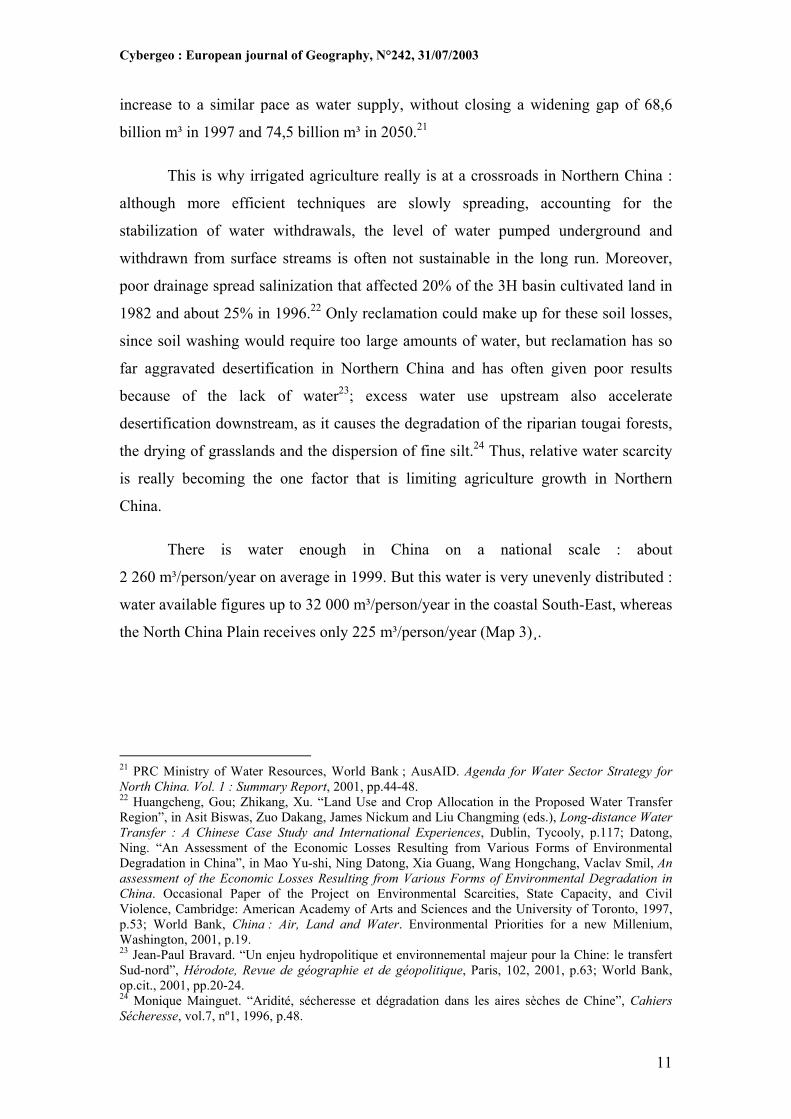
There is water enough in China on a national scale : about
2 260 m³/person/year on average in 1999. But this water is very unevenly distributed :
water available figures up to 32 000 m³/person/year in the coastal South-East, whereas
the North China Plain receives only 225 m³/person/year (Map 3)¸.
21 PRC Ministry of Water Resources, World Bank ; AusAID. Agenda for Water Sector Strategy for North China. Vol. 1 : Summary Report, 2001, pp.44-48. 22 Huangcheng, Gou; Zhikang, Xu. “Land Use and Crop Allocation in the Proposed Water Transfer Region”, in Asit Biswas, Zuo Dakang, James Nickum and Liu Changming (eds.), Long-distance Water Transfer : A Chinese Case Study and International Experiences, Dublin, Tycooly, p.117; Datong, Ning. “An Assessment of the Economic Losses Resulting from Various Forms of Environmental Degradation in China”, in Mao Yu-shi, Ning Datong, Xia Guang, Wang Hongchang, Vaclav Smil, An assessment of the Economic Losses Resulting from Various Forms of Environmental Degradation in China. Occasional Paper of the Project on Environmental Scarcities, State Capacity, and Civil Violence, Cambridge: American Academy of Arts and Sciences and the University of Toronto, 1997, p.53; World Bank, China : Air, Land and Water. Environmental Priorities for a new Millenium, Washington, 2001, p.19. 23 Jean-Paul Bravard. “Un enjeu hydropolitique et environnemental majeur pour la Chine: le transfert Sud-nord”, Hérodote, Revue de géographie et de géopolitique, Paris, 102, 2001, p.63; World Bank, op.cit., 2001, pp.20-24. 24 Monique Mainguet. “Aridité, sécheresse et dégradation dans les aires sèches de Chine”, Cahiers Sécheresse, vol.7, nº1, 1996, p.48.
11
Cybergeo : European journal of Geography, N°242, 31/07/2003
3.1 Water transfers within China
The only solution, according to Chinese planners, apart from drastic measures
to cut down on rural water use, or massive and costly investment in water-efficient
irrigation techniques, is diversion of water from elsewhere. The diversion of the
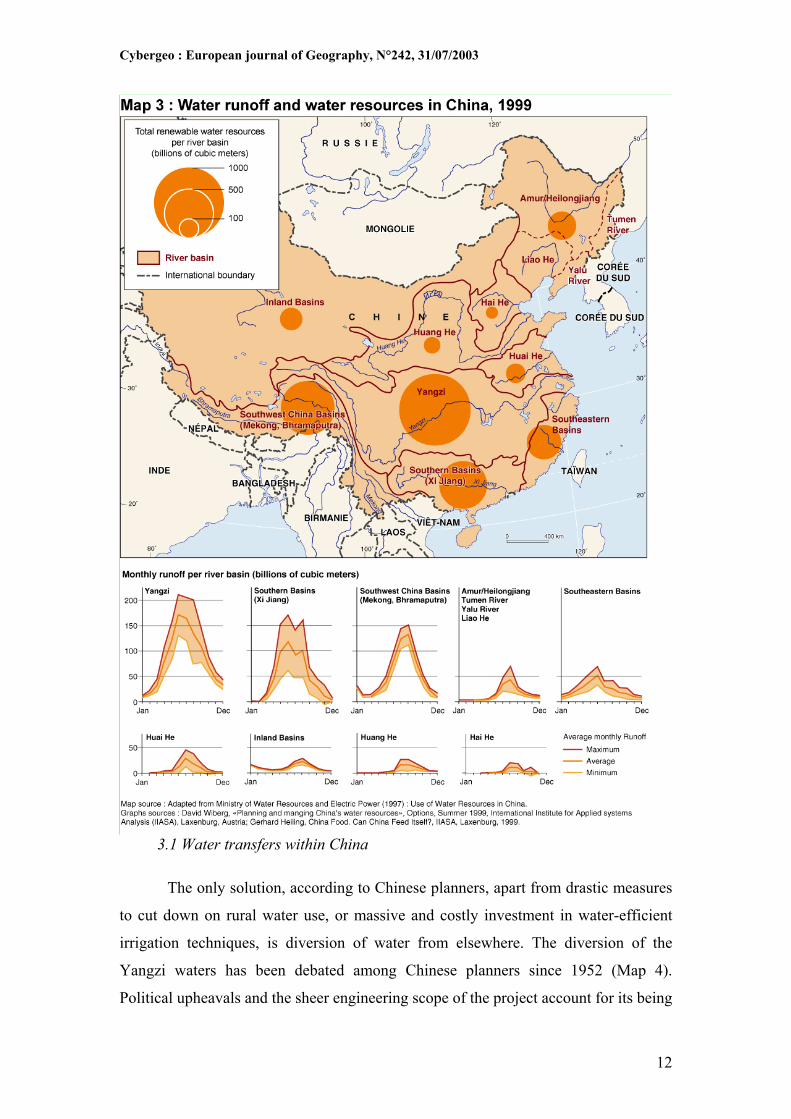
Yangzi waters has been debated among Chinese planners since 1952 (Map 4).
Political upheavals and the sheer engineering scope of the project account for its being
12

Cybergeo : European journal of Geography, N°242, 31/07/2003
delayed several times and the government reluctance to go ahead with it.25 There were
strong debates within China among political circles as to whether the derivation
project should really be approved; its approval by the Communist Party Congress in
1992, by a mere two thirds majority attests to the controversy even within the Chinese
government.26 This debate explains why, for instance, as the first eastern route
sequence was due to be completed in 1990, with a diversion volume of 2,1 billion m³,
works never began in earnest.27 The severe drought that struck China for the past
5 years has lent urgency to the 50-year-old plan to bring water to northern China from
the Yangzi River. But government planners are also all too well aware of the fact that
improved water management techniques, pricing and recycling, besides being costly,
are also slow in showing large-scale effects.
Government planners have selected three routes; most were envisioned as
early as the 1950s. The eastern route, first approved as early as 1983, implies the
widening and deepening of the Grand Canal from the Shanghai region up north to
Beijing. This route would transfer between 19 and 21 billion m³ per year “in the long
term”.28
The middle route, given present priority, would transfer water from the
Danjiangkou reservoir on the Han River to supply Hubei, Henan, Hebei, and then go
on to Beijing and Tianjin with a tunnel under the Huanghe. Long term projects also
include the derivation of water from the Three Gorges Reservoir into the
Danjiangkou, raising the derivation capacity from 13,8 to 23 billion m³.29
The western route imply gigantic work such as 410-meter high dams, tunnels
between 30 and 210 km, 2 pumping stations lifting water by 495 m and 485 m for a
total derivation that would not exceed 20 billion m³.30 Some authors strongly assert
25 Lasserre, op. cit., 2002, p.251. 26 Bravard, op. cit., 2001, p.61. 27 Vaclav Smil, The Bad Earth, Environmental Degradation in China, ME Sharpe and Zed books, New York and London, 1984, p.91. 28 Liu Changming, and Shen Dajun. « The most vital strategy. An overview of areal reallocation of China’s water resources », Chinese Environment & Development, vol.5, nº2, 1995, p.8. 29 Chen Chunhuai, « Major characteristics and problems of the south-to-north water-transfer project in China », Chinese Environment & Development, vol.5, nº2, 1995, pp.23-25 ; Bangyi, Yao and Qinglian, Chen. “South-to-North Water Transfer project Plans”, in Asit Biswas, Zuo Dakang, James Nickum and Liu Changming (eds.), Long-distance Water Transfer : A Chinese Case Study and International Experiences, Dublin, Tycooly, 1983, pp.127-150. 30 Changming and Dajun, op. cit., 1995, pp.5-7 ; Chen Xiande, « Water transfer along the Western route », Chinese Environment & Development, op. cit., vol.5, nº2, 1995, pp.78-82.
13
Cybergeo : European journal of Geography, N°242, 31/07/2003
that the western route is utterly unrealistic,31 while other insist China cannot do
without it in the medium to longer term, given the water deficit that will develop in
Northern China (Map 4)
The gigantic engineering project diverting water from upper, middle and lower
reaches of the Yangzi, would alleviate to a certain extent water scarcity in the north,
especially in the short term. However, some officials have hinted at the idea it is the
acuteness of the drought crisis that had the government give the green light, in
November 2001, to a costly ($22 billion, 1999 estimates)32 and controversial project :
it remains to be seen what extent of real derivation work the government will opt for
and to what extent it will not prove a heavy burden for government finances. The
government decision seems irreversible nevertheless, if only because almost all
forecasts show water deficits would be unbearable in Northern China without the
water transfer scheme. In fact, the very structure of the Three Gorges project and the
dam planning on the Han river (Gezhouba and Danjiangkou) attest to the long-term
31 Smil, 1984, op. cit., p.90 ; Far Eastern Economic Review, 3 February 2000. 32 BBC News, November 15, 2001; South China Morning Post, November 15, 2001.
14
Cybergeo : European journal of Geography, N°242, 31/07/2003
planning by Chinese authorities of the eventual likelihood of a transfer scheme from
the Three Gorges reservoir.33
The South-North Water Transfer Project (SNWTP) may appear to be
unavoidable given the widening water deficit in the Huanghe, Huai and Hai basins,
but they will not solve the water scarcity issues in the region. A study by Sandia
National Laboratories show that, should the consumptive patterns in Northern China
remain the same, water deficits should return to 2002 levels in 2025 in the Hai basin,
even with the Yangzi derivation34. According to an other study - assuming, as the
ministry of Water Resources does, that water transfers from the Yangzi would amount
to 12 billion m³ in 2010 and 19,4 billion m³ in 2020 - the global water deficit, under a
75% probability, would still be 33,6 billion m³ in 2010 and 30 billion m³ in 2050.35
3.2 International watercourses derivation
The sheer scope of the western route envisioned for the Yangzi derivation had
Chinese scientists underline its poor feasibility or economic rationality, pointing to
more practical derivation scheme in Northeastern China, especially in the
Amur/Heilongjiang basin. Projects of damming Heilongjiang tributaries have already
surfaced both within Russia and within China as droughts and fast economic
development, especially on the Chinese side, imply a rapidly growing water demand.
The Amur River rises in Mongolia, and then flows in the Russian Far East
(Amurskaya oblast, Jewish Autonomous oblast, Khabarovsky krai, see Map 5). Its
tributary, the Ussuri, makes the border between China and Primorsky krai. The length
of the Amur watercourse is 4 440 km, of which 2 800 km pass on the Russian Far
East’s territory, its basin covers an area of 1 855 000 sq. km (of which 933 000 sq. km
lie on the Russian territory), and its mean annual flow is 346 cu. km. In terms of
volume of water, the Amur River ranks fourth in Russia and follows the Yenisei, the
Lena and the Ob. The main tributaries of the Amur on the Russian Far East territory
are the Zeya (1 242 km), the Ussuri (897 km), the Amgun (723 km), the Selemdja
33 Bravard, op. cit., 2001, p.65. 34 Assuming a transfer of 12 billion m³. Sandia National Laboratories, « Model Results – Water Resources », China Infrastructure Initiative, Albuquerque, 1999. 35 Scenario including a 10% increase in efficiency, a 15% reuse and price increases. MWR, World Bank ; AusAID, 2001, op. cit., pp.48-49.
15
Cybergeo : European journal of Geography, N°242, 31/07/2003
(647 km), the Bureya (623 km); on the Chinese side, the Songhua (Sungari) drains
most of the Songnen plain in the Northeast.
Projects of derivation from the Amur/Heilongjiang Basin, in Northeastern
China, include derivation from tributaries of the Songhua (Sunggari) River, a major
tributary of the Heilongjiang.36 Chinese officials also nurture projects to use water
from the Yalu River (marking the border between China and North Korea)37; from the
Ili and Ertix (Irtych) in northern Xinjiang, rivers that flow into Kazakhstan and drain
into Lake Balkash and the Ob respectively.38 These projects have so far reportedly
remained on paper, mainly because Chinese officials know all to well these issues are
very sensitive and difficult to manage; Russian sources, however, do mention a canal
diverting water from the Black Irtych that drains into Ulungur Lake; the canal would
presently divert 15% of the river flow, but Chinese authorities reportedly plan to
increase the diversion rate to 50%.39 A formal note of protest has been sent by the
Kazakh government to Beijing.
But, besides being a potentially explosive issue with Kazakhstan and a China-
wary Russia, water issues are becoming sensitive in Northeastern China and the
Russian Far East as well, with rivers running less and less water, reservoirs drying
up40, and the resource being increasingly tapped into.41 It is not sure the Heilongjiang
basin provinces would agree to let their water go when themselves begin to feel the
pinch of water scarcity : precipitations are low (see Map 1) and shortages were severe
enough in Heilongjiang for the Chinese government to ask for the help of the Asian
Development Bank. The Heilongjiang Water Supply Project, drafted in 1999, will
reduce water shortages and improve water quality in Harbin and Mudanjiang through
the building of two multipurpose dams.42
36 Yu Tianxin, and Jia Kang. « An inquiry into the resolution of China’s water resource crisis », Chinese Environment & Development, vol. 7, nº4, 1997, p.36. 37 James Nickum, . « Is China Living on the Water Margin ? », The China Quarterly, 4, 1998, p.893. 38 Beijing Information nº37, September 12, 2000, p.27. 39 This water would be used for irrigation and oil production in the Karamai oilfields. The derivation canal would be 300 km long and 22 meters wide. Project 635 is reported to cost about one billion dollars and to have been implemented in 2000. Ecostan News, vol. 7, nº7, July 2000. www.ecoline.ru/news/Jun00/00062904.txt 40 China Daily, September 20, 2001; Pravda, June 7, 2001. 41 Asian Development Bank, ADB prepares water projects for People’s Republic of China, communiqué, July 28, 1999; World Wildlife Fund, Biodiversity Conservation of the Amur River Freshwater Ecoregion, Living Waters Programme – Europe, 2000. www.panda.org/europe/freshwater/regional/russia-amur.html, 2000, pp.3-4. 42 Asian Development Bank, op. cit, July 28, 1999.
16

Cybergeo : European journal of Geography, N°242, 31/07/2003
In general terms, the Russian Far East has enough water resources for
economic activity. There are 5 times more water reserves per capita here than Russia's
average. But this figure is misleading. The least per capita index is registered on
Sakhalin and in Primorsky krai, the two most densely populated areas of the region.
There already is a real shortage of drinking fresh water in areas where the bulk of the
region's population lives - in the south of Primorsky and Khabarovsky krais and in
some areas of Sakha. This shortage is caused naturally by the freezing of rivers,
during the winter time, and by usually dry springs and falls,43 but is compounded by
the growing demand on both sides of the river.
4. Water consumption in the Amur Basin
Although the economic activity has fallen down on the Russian side, the
economic boom on the Chinese side of the border has more than made up for it;
efforts are made by the Russian government to revitalize the economy of the region,
and the Chinese government as well is implementing plans to boost growth in the
Northeast region for domestic political reasons : Beijing is growingly under pressure
from the population of inner China to make sure the new wealth witnessed on coastal
provinces is spreading into Interior China.44
Extending agriculture and developing new industrial activities imply accrued
water use. The region is already experiencing drought that could mean new and
significant problems local authorities will have to solve in cross-border talks.
4.1 Transportation
While railway and road infrastructure are deficient, river transportation in the
Russian Far East is quite developed compared to other regions of Russia : it has three
times more navigable inland waterways than Russia’s average – 31 km per
10 000 sq.km. In many regions, the riverway is the only means of transportation
linking the area with other places. The total lenght of navigable waterways in the
43 Национальной Службой Новостей (НСН)/ National News Service (NNS), 2001. 44 Frédéric Lasserre, « Alleviating Water Scarcity in Northern China : Balancing Options and Policies Among Chinese Decision-makers », Proceedings of the 12th Stockholm Water Symposium (11-15 August 2002), Stockholm, 2002, to be published.
17
Cybergeo : European journal of Geography, N°242, 31/07/2003
Amur basin reaches 6 000 km, with a navigation season lasting about 5 to 6 months.
The water depth allows the use of ships or barges with a cargo capacity between 500
and 3 000 tons, and up to 5 000 tons in the lower reaches of the river, between
Komsomolsk and Nikolaevsk on the Sea of Okhotsk. The main river ports on the
Russian side are Komsomolsk, Khabarovsk and Blagoveshtchensk, but several other
smaller ports dot the Russian river side, with a total traffic totaling about 6 million
tons (1997)45.
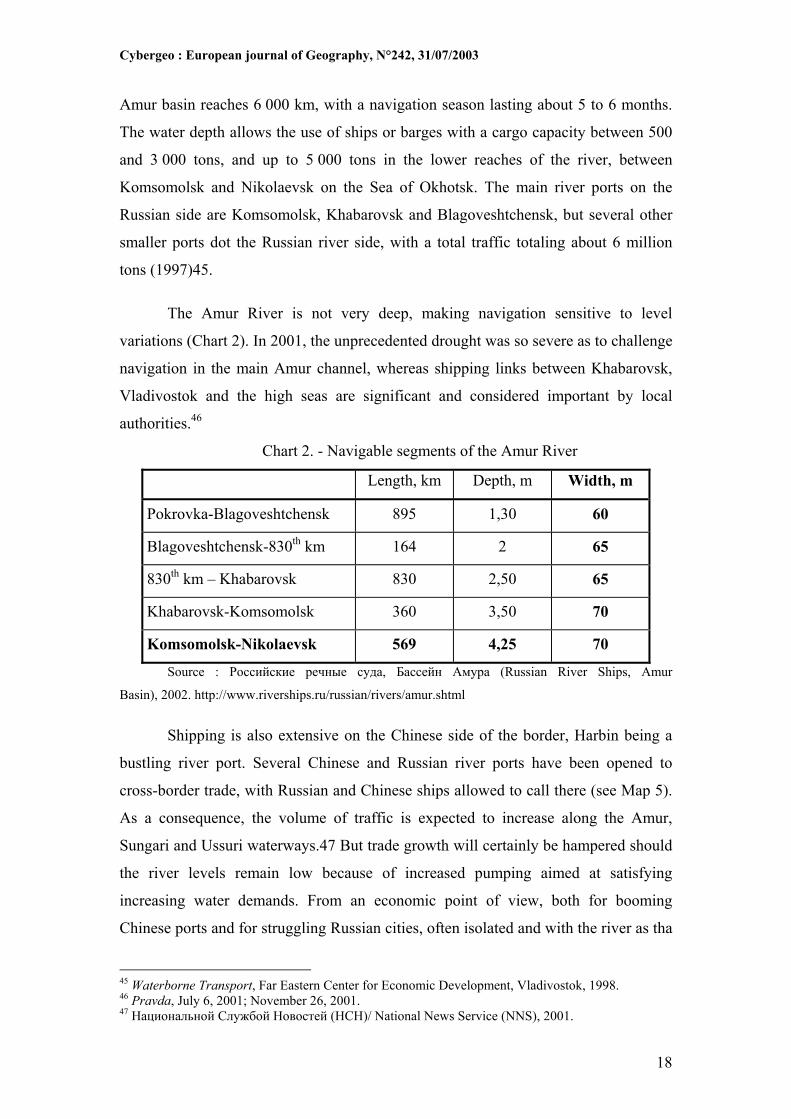
The Amur River is not very deep, making navigation sensitive to level
variations (Chart 2). In 2001, the unprecedented drought was so severe as to challenge
navigation in the main Amur channel, whereas shipping links between Khabarovsk,
Vladivostok and the high seas are significant and considered important by local
authorities.46
Chart 2. - Navigable segments of the Amur River
Length, km Depth, m Width, m
Pokrovka-Blagoveshtchensk 895 1,30 60
Blagoveshtchensk-830th km 164 2 65
830th km – Khabarovsk 830 2,50 65
Khabarovsk-Komsomolsk 360 3,50 70
Komsomolsk-Nikolaevsk 569 4,25 70
Source : Российские речные суда, Бассейн Амура (Russian River Ships, Amur
Basin), 2002. http://www.riverships.ru/russian/rivers/amur.shtml
Shipping is also extensive on the Chinese side of the border, Harbin being a
bustling river port. Several Chinese and Russian river ports have been opened to
cross-border trade, with Russian and Chinese ships allowed to call there (see Map 5).
As a consequence, the volume of traffic is expected to increase along the Amur,
Sungari and Ussuri waterways.47 But trade growth will certainly be hampered should
the river levels remain low because of increased pumping aimed at satisfying
increasing water demands. From an economic point of view, both for booming
Chinese ports and for struggling Russian cities, often isolated and with the river as tha
45 Waterborne Transport, Far Eastern Center for Economic Development, Vladivostok, 1998. 46 Pravda, July 6, 2001; November 26, 2001. 47 Национальной Службой Новостей (НСН)/ National News Service (NNS), 2001.
18
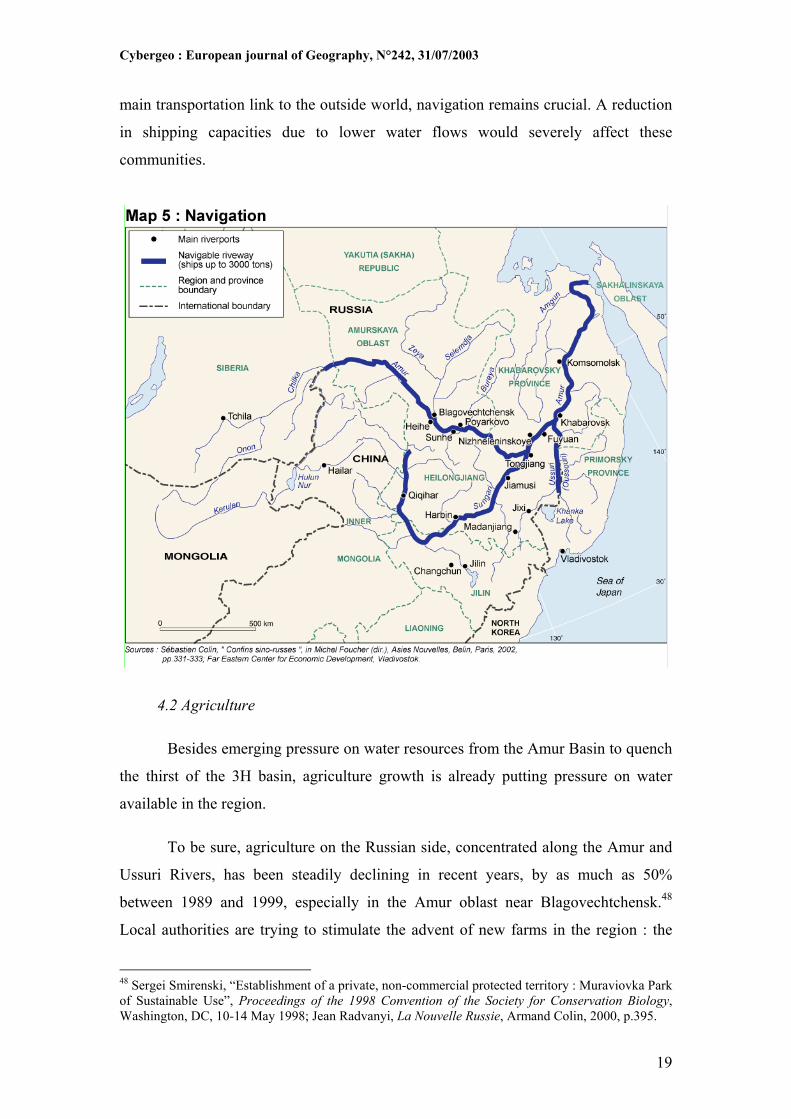
Cybergeo : European journal of Geography, N°242, 31/07/2003
main transportation link to the outside world, navigation remains crucial. A reduction
in shipping capacities due to lower water flows would severely affect these
communities.
4.2 Agriculture
Besides emerging pressure on water resources from the Amur Basin to quench
the thirst of the 3H basin, agriculture growth is already putting pressure on water
available in the region.
To be sure, agriculture on the Russian side, concentrated along the Amur and
Ussuri Rivers, has been steadily declining in recent years, by as much as 50%
between 1989 and 1999, especially in the Amur oblast near Blagovechtchensk.48
Local authorities are trying to stimulate the advent of new farms in the region : the
48 Sergei Smirenski, “Establishment of a private, non-commercial protected territory : Muraviovka Park of Sustainable Use”, Proceedings of the 1998 Convention of the Society for Conservation Biology, Washington, DC, 10-14 May 1998; Jean Radvanyi, La Nouvelle Russie, Armand Colin, 2000, p.395.
19
Cybergeo : European journal of Geography, N°242, 31/07/2003
climate enables the production of wheat, rice, potatoes, vegetables, soybeans, as well
as an important animal husbandry activity that accounted for 70% of agricultural
revenues and 40% of surfaces in 1999. More important, local productions represent
only 30 to 45% of food consumption, forcing the import of expensive products to
satisfy the demand. The south of the Amur oblast and Birobidjian, the Jewish
Autonomous Region, are targeted as the main producing regions: there are the best
land, and reservoirs from the Zeia and Boureia dams will help extend arable land.49
Irrigation will prove necessary for the diversification of production: although the
image of the region as a wet place is commonplace, in fact rains are concentrated in
the summer time, with dry springs and falls, and are often not very plentiful, between
400 and 600 mm per year.50
Trying both to fill the gap in agrifood demand on the Russian side, Chinese
farmers have begun to take over land on the Russian side to produce more; but their
activity is still marginal as only 3% of Chinese immigrants to the Russian Far East are
farmers.51 Production on the Chinese border area is also increasing fast, pulled by
demand on the Russia side, by demand induced by the local Chinese population
expansion and by reclamation efforts by local authorities in the frame of a national
government policy to develop agriculture in Northeast China.
In Northeastern China, agriculture is expanding extensively, acting as a
pioneering front designed to increase farmland area to boost production and create
employment in a depressed region. After a decline in relative terms during the 1960s,
the Chinese government and provincial authorities have designed a plan to transform
the Northeast into a vast granary, where farmland expansion could guarantee food
production increase. Rice, corn, soybeans, sugarbeets are the main crops, and animal
husbandry is also expanding fast. In 1983, the objectives of government officials were
to increase the cultivated area by 50%. In 1996, 200 000 ha were in the process of
49 Jean Radvanyi, La Nouvelle Russie, op. cit., pp.394-395. 50 Jean-Pierre Larivière and Pierre Sigwalt, La Chine, Armand Colin, Paris, 1996, p.108 ; Taikan Oki et al, « Global Atmospheric Water Balance and Runoff from Large River Basins », in Hydrological Processes, 9, 655-678, 1995, http://hydro.iis.u-tokyo.ac.jp/Ftp/IISgrdc.html 51 Galina Vitkovskaya, Zhanna Zayonchkovskaya, Kathleen Newland, “Chinese Migration into Russia”, in Sherman Garrett (ed.), Rapprochement or Rivalry ? Russia-China Relations in a Changing Asia, op. cit., 2000, p.356.
20
Cybergeo : European journal of Geography, N°242, 31/07/2003
being put to production, with grants from the World Bank; plans were being drafted
for 800 000 more.52
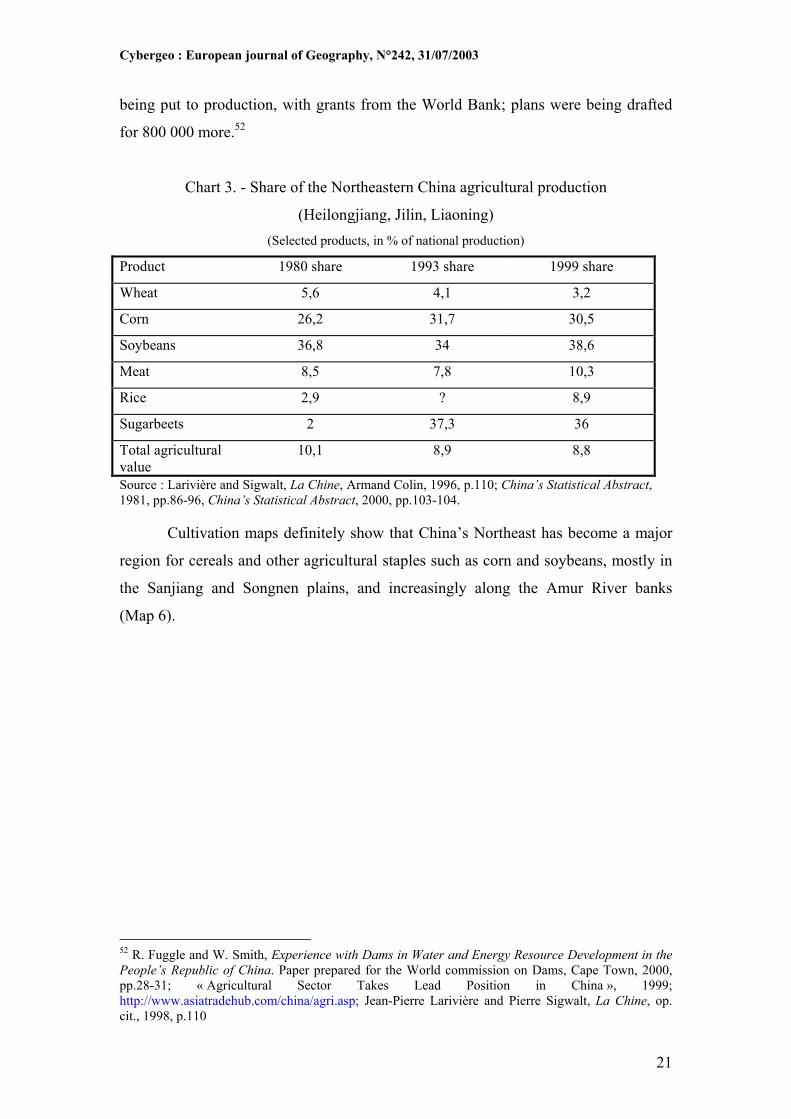
Chart 3. - Share of the Northeastern China agricultural production
(Heilongjiang, Jilin, Liaoning) (Selected products, in % of national production)
Product 1980 share 1993 share 1999 share
Wheat 5,6 4,1 3,2
Corn 26,2 31,7 30,5
Soybeans 36,8 34 38,6
Meat 8,5 7,8 10,3
Rice 2,9 ? 8,9
Sugarbeets 2 37,3 36
Total agricultural value
10,1 8,9 8,8
Source : Larivière and Sigwalt, La Chine, Armand Colin, 1996, p.110; China’s Statistical Abstract, 1981, pp.86-96, China’s Statistical Abstract, 2000, pp.103-104.
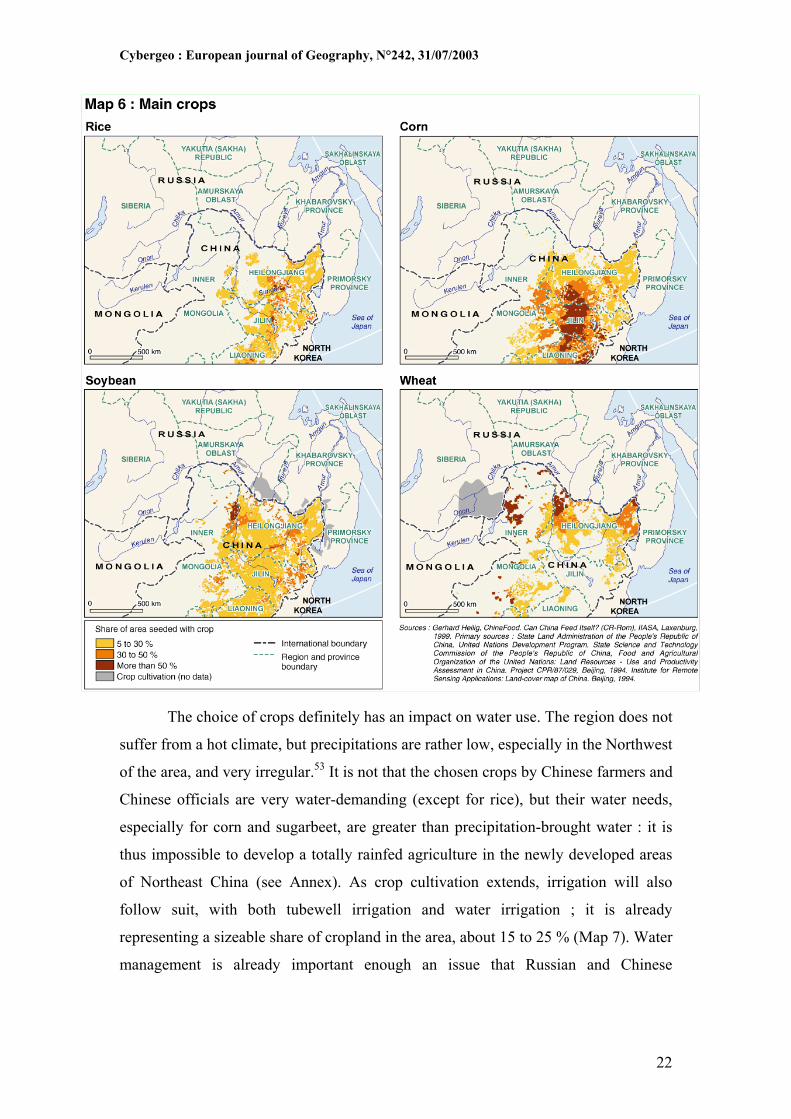
Cultivation maps definitely show that China’s Northeast has become a major
region for cereals and other agricultural staples such as corn and soybeans, mostly in
the Sanjiang and Songnen plains, and increasingly along the Amur River banks
(Map 6).
52 R. Fuggle and W. Smith, Experience with Dams in Water and Energy Resource Development in the People’s Republic of China. Paper prepared for the World commission on Dams, Cape Town, 2000, pp.28-31; « Agricultural Sector Takes Lead Position in China », 1999; http://www.asiatradehub.com/china/agri.asp; Jean-Pierre Larivière and Pierre Sigwalt, La Chine, op. cit., 1998, p.110
21
Cybergeo : European journal of Geography, N°242, 31/07/2003
The choice of crops definitely has an impact on water use. The region does not
suffer from a hot climate, but precipitations are rather low, especially in the Northwest
of the area, and very irregular.53 It is not that the chosen crops by Chinese farmers and
Chinese officials are very water-demanding (except for rice), but their water needs,
especially for corn and sugarbeet, are greater than precipitation-brought water : it is
thus impossible to develop a totally rainfed agriculture in the newly developed areas
of Northeast China (see Annex). As crop cultivation extends, irrigation will also
follow suit, with both tubewell irrigation and water irrigation ; it is already
representing a sizeable share of cropland in the area, about 15 to 25 % (Map 7). Water
management is already important enough an issue that Russian and Chinese
22
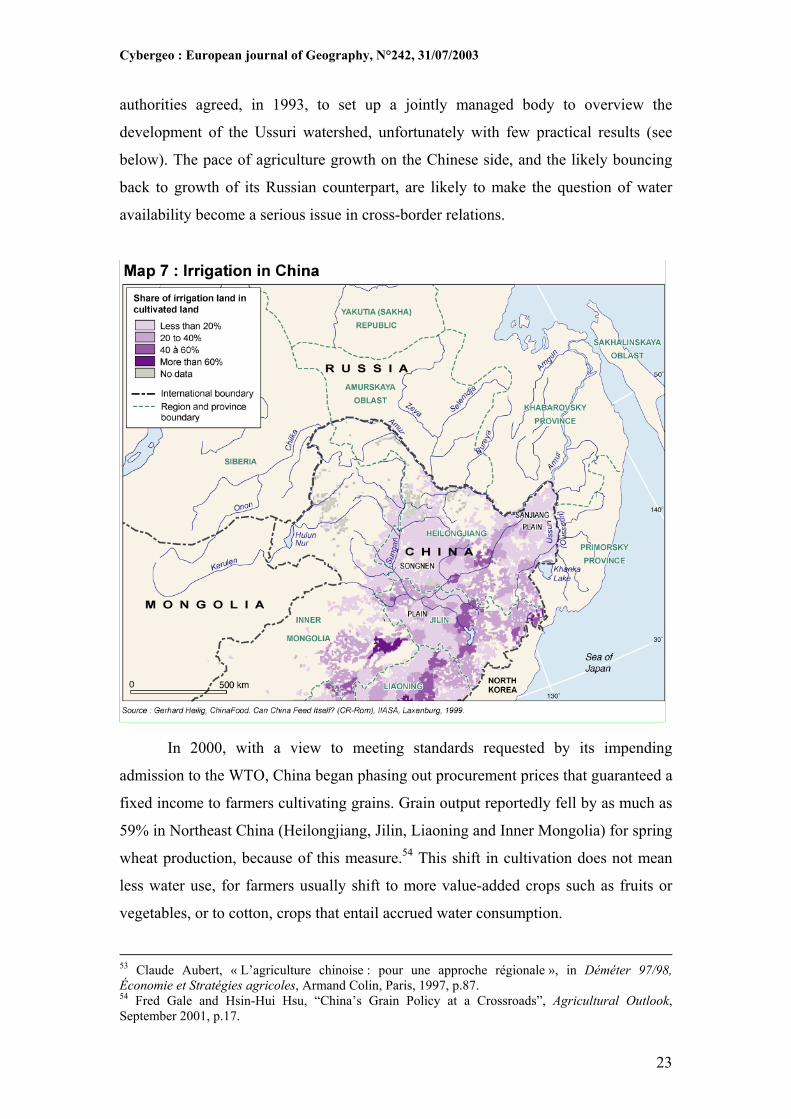
Cybergeo : European journal of Geography, N°242, 31/07/2003
authorities agreed, in 1993, to set up a jointly managed body to overview the
development of the Ussuri watershed, unfortunately with few practical results (see
below). The pace of agriculture growth on the Chinese side, and the likely bouncing
back to growth of its Russian counterpart, are likely to make the question of water
availability become a serious issue in cross-border relations.
In 2000, with a view to meeting standards requested by its impending
admission to the WTO, China began phasing out procurement prices that guaranteed a
fixed income to farmers cultivating grains. Grain output reportedly fell by as much as
59% in Northeast China (Heilongjiang, Jilin, Liaoning and Inner Mongolia) for spring
wheat production, because of this measure.54 This shift in cultivation does not mean
less water use, for farmers usually shift to more value-added crops such as fruits or
vegetables, or to cotton, crops that entail accrued water consumption.
53 Claude Aubert, « L’agriculture chinoise : pour une approche régionale », in Déméter 97/98, Économie et Stratégies agricoles, Armand Colin, Paris, 1997, p.87. 54 Fred Gale and Hsin-Hui Hsu, “China’s Grain Policy at a Crossroads”, Agricultural Outlook, September 2001, p.17.
23
Cybergeo : European journal of Geography, N°242, 31/07/2003
4.3 Industry
Development of border areas with Chinese capital will, in turn, lead to new
industries setting up in boom town and increasing their withdrawals, along with urban
population in these centers. This trend is gradually unfolding, but it is not so much
industrial use that could pose a problem in as much as Heilongjiang province,
especially along the Amur and Ussuri rivers, had long being neglected, in part because
it was on the front line against a long-time hostile USSR, also because urban centers
and capital were located more to the south. The industrial base in Heilongjiang has
remained stagnant because of the province’s continued dependence on noncompetitive
resource-based industries.55
Pollution, rather than direct water use, is increasingly a problem in the Amur
basin, to the point where water can no longer be used for drinking water and fish
cannot be consumed. Indigenous populations, like the Nanais, for instance, have seen
their traditional way of life disrupted as their main diet, based on fish, was no longer
available because of water pollution. Concentrations of toxic chemicals are six times
the norm in the Troistkoe region, north of Khabarovsk, where Nanais live, and can
reach 24 times the norm downstream.56 Authorities have been asked to account for
such a heavy pollution in so long and powerful a river (4 400 km; 10 900 cu.m/sec on
average, with a great variability : 374 cu.m/sec at its lowest and 33 100 cu.m/sec at its
peak in Khabarovsk57). No single explanation could credibly explain it. However, a
whole set of factors probably concurred to such a high pollution level. The fast
expansion of Chinese cities and industries, often without water treatment at all58; the
shoddy controls of old Russian factories in Khabarovsk; major forest fires that could
have altered runoff patterns and redirect old pollution into streams : all these factors
are probably a part of the general evolution that, in a few years, made long stretches
of the Amur and its tributaries heavily polluted.
55 Elizabeth Wishnick, « Chinese Perspectives on Cross-border Relations », in Sherman Garrett (ed.), Rapprochement or Rivalry ? Russia-China Relations in a Changing Asia, Carnegie Endowment for International Peace, Washington, DC, 2000, p.230. 56 Le Monde, 23 août 2001. 57 Khabarovsk Station, http://www.grdc.sr.unh.edu/html/Polygons/P2906900.html 58 Beijing Information nº48, November 29, 1999, p.26; nº46, November 14, 2000, p.17.
24
Cybergeo : European journal of Geography, N°242, 31/07/2003
5. A joint management of the Amur Basin Waters ?
There are only two treaties dealing specifically with the Amur River water
management, signed in June 1915 and in August 1956. The latter was aimed at
determining the real potential for hydropower generation; the former, interestingly,
was primarily concerned with border demarcation but included important
specifications about water supply and made provisions for the equal sharing of water
to be mobilized after 1915.59
The two countries never considered a binding trinational authority (China,
Russia and Mongolia) so as to regulate water use and management in the Amur basin;
nor is the concept of integrated and sustainable management well developed among
the region : although the need to rationalize water use is increasingly understood in
China, its implementation is slow, and its rationale lies not on the goal of finding an
equilibrium so as to reach sustainable development, but so as to maximize the use of
water so as to maximize its economic use.
It would be inaccurate, however, to state that cooperation over water
management is inexistent between Russia and China. The Ussuri Watershed
Sustainable Land Use Program was undertaken to bring Russia and China into close
co-operation in environmental and land use planning, with an important water
management dimension. The Ussuri/Wusuli River joins two remote regions of the two
countries, partly forming the border between them. On the western side of the river,
comprising roughly one third of the Ussuri watershed, is the province of Heilongjiang.
On the eastern side of the river, rest of the watershed lies within two territories of
Russia’s maritime Far East: Khabarovsk Krai and Primorskii Krai, about twice the
size but with barely a tenth of the population of Heilongjiang. Initiated in 1993, the
program was coordinated by the National Committee on U.S.-China Relations
(NCUSCR) and Ecologically Sustainable Development (ESD). While the program
was undertaken to provide a sustainable land use plan for an ecologically sensitive
and rapidly developing area, it was more about international relations than water or
sustainability. Most important thing in the program was bringing two countries
59 Jukka Ilomäki, “China”, in Institutional Challenge of Developing Transboundary Water Resources, Helsinki University of Technology, Water Resource Laboratory, 2000, www.water.hut.fi/wr/research/glob/pubications/Ilomaki
25
Cybergeo : European journal of Geography, N°242, 31/07/2003
together around a common cause - a shared natural resource, with a view to reducing
pollution and creating wildlife reservations. Bilateral talks have kept going, but,
however, few results have so far been achieved.
A similar agreement has been signed about the Tumen River basin, in the
frame of the United Nations Development Program (UNDP) on the Tumen River
Area Development Program (TRADP). Water management implies talks between
Russia, China and North Korea. Stakes were important here because of irrigation
activities in Russia, of fishing activites in Peter the Great Bay, of environmental
concerns about the Tumer River delta. Water pollution has increased extremely fast
during the past 10 years, mainly because of industrialzation and urbanization in Jilin
province in China, where treatment facilities are as weak as in the rest of China.
Russian farmers, relying on irrigation in the Peter the Great Bay area, have already
bitterly complained about pollution coming from China, to no avail so far. Besides,
forest exploitation in North Korea, Russia and China have caused deterioration of
mountain catchment areas, leading to sedimentation and water shortages in the
summer. Difficulties stem from the fact environmental preoccupations are still low on
Jilin Proince officials’ agenda, and because the agreement provided for a very weak
coordination structure. The experiment on the Tumen River does not augure very well
for the Ussuri program either, inasmuch as transboundary coordination remains so
flexible that hardly any progress on many issues has been regsitered so far.60
Conclusion
There still is underlying mistrust between China and Russia.61, despite the
warming of relations and the development of significant trade relations.
Once a political tool against the Soviet Union during the 1970s, when Chinese
propaganda showed maps with derivation projects or the inclusion of the Amur basin
into China, the idea of tapping into Siberia’s water resources could resurface in China,
60 Wen Bo, “Chinese Transboundary Water Issues”, Meeting of the Working Group on Environment in US-China Relations, January 7, 1998, Washington, DC. 61 Peggy Falkenheim Meyer, Sino-Russian Relations under Putin, op. cit., March 2000, p.7; Alexei Voskressenski, “Russia’s Evolving Grand Strategy toward China”, in Sherman Garrett (ed.), Rapprochement or Rivalry ? Russia-China Relations in a Changing Asia, Carnegie Endowment for International Peace, Washington, DC, 2000, pp.118-123; Vladivostok News, November 10, 2000.
26
Cybergeo : European journal of Geography, N°242, 31/07/2003
fear some government official in Russia.62 China is also perceived as a threat to
Russia’s environment and to the sustainability of Russian resources. Poaching and
overfishing by fishermen from Russia, but for a large share from Japan, Korea and
China is depleting fishery resources, especially as Russia’s ability to control fishing
has been undermined by inadequate funding for its border guards who lack fuel and
modern ships.63 Also fueling this perception of China as an environmental threat is the
large-scale exploitation of forest resources by Chinese, Japanese and Korean firms.
This evolution of the bilateral relation between China and Russia, on both
sides of a once heavily guarded border river, takes place at a time when water
resources are increasingly a limiting factor in Chinese development, especially in the
North China plain. Agriculture is using water resources there at an unsustainable rate;
industries and cities are competing for a scarcer resource given the increased demand.
The government has so far opted for the derivation of Yangzi water up north. But it is
also aware that, if withdrawals levels remain as they are, other derivations will prove
necessary because of the depletion of aquifers. Projects already exist, from the Yalu,
the Irtish, or the Amur/Heilongjiang basin.
If given the government approval, these projects are likely to trigger a heated
debate between riparian countries. As for the Amur, such a derivation project would
take place in a region where growth is already straining resources, and where
suspicion remains present between the two main riparians, China and Russia.
62 de Villiers, 2000, pp.313-314. 63 Peggy Falkenheim Meyer, Sino-Russian Relations under Putin, op. cit., March 2000, p.9.
27
Cybergeo : European journal of Geography, N°242, 31/07/2003
Annex
Crops, evapotranspiration and water needs in North-eastern China
A tentative assessment of the rainfed agriculture prospects
There might be data processed by Chinese authorities or academics on crop
evapotranspiration in Northeastern China, but it remained not to be found – so far.
Ministry of Agriculture officials would not answer letters asking for such data.
So as to assess water needs for crop development and agricultural activities in
the studied area, in the absence of official data, approximate evaluations can be drawn
from commonly used formulas established by agronomists. This data can help assess
the trends in water needs given the expansion of agricultural activities in Northeastern
China, both in terms of seeded surface and chosen crops.
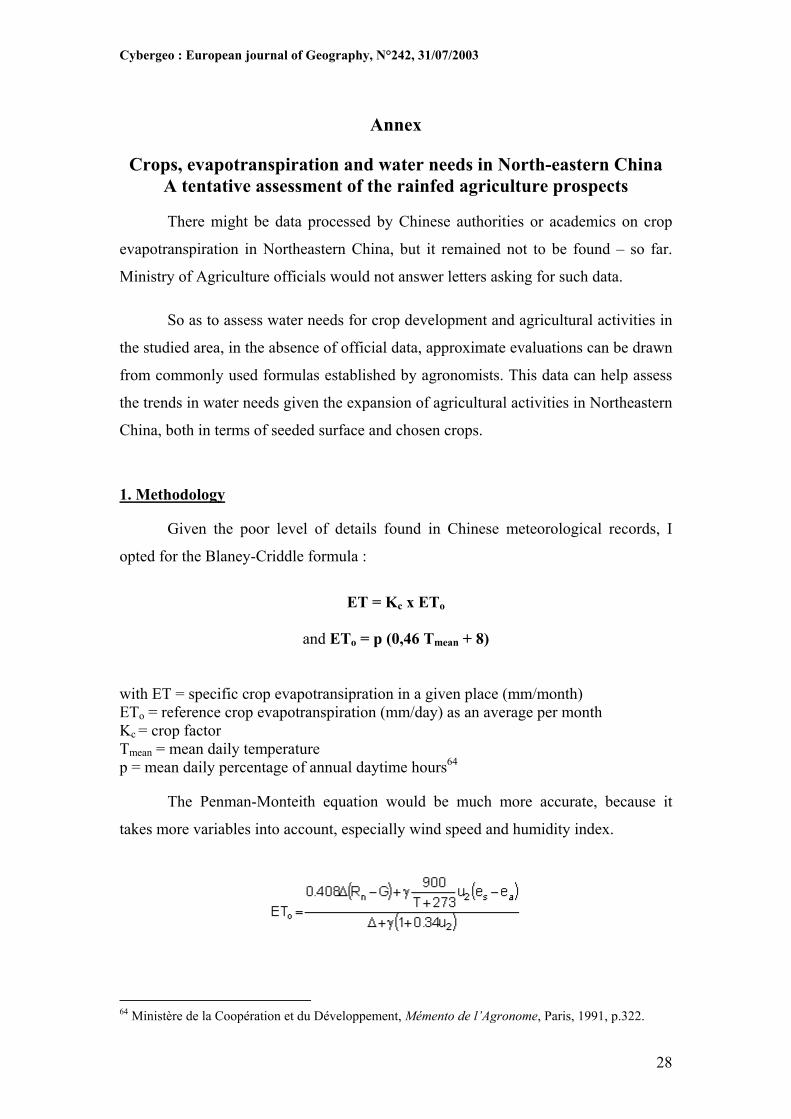
1. Methodology
Given the poor level of details found in Chinese meteorological records, I
opted for the Blaney-Criddle formula :
ET = Kc x ETo
and ETo = p (0,46 Tmean + 8)
with ET = specific crop evapotransipration in a given place (mm/month) ETo = reference crop evapotranspiration (mm/day) as an average per month Kc = crop factor Tmean = mean daily temperature p = mean daily percentage of annual daytime hours64
The Penman-Monteith equation would be much more accurate, because it
takes more variables into account, especially wind speed and humidity index.
28
64 Ministère de la Coopération et du Développement, Mémento de l’Agronome, Paris, 1991, p.322.
Cybergeo : European journal of Geography, N°242, 31/07/2003
where
Rn : net radiation at the crop surface [MJ m-2 day-1], G : soil heat flux density [MJ m-2 day-1], T : mean daily air temperature at 2 m height [°C], u2 : wind speed at 2 m height [m s-1], es : saturation vapour pressure [kPa], ea : actual vapour pressure [kPa], es - ea : saturation vapour pressure deficit [kPa], ∆ : slope vapour pressure curve [kPa °C-1], γ : psychrometric constant [kPa °C-1].
However, this formula implies elaborate calculation for which data was
lacking. The formula was therefore not used for the present set of calculation.
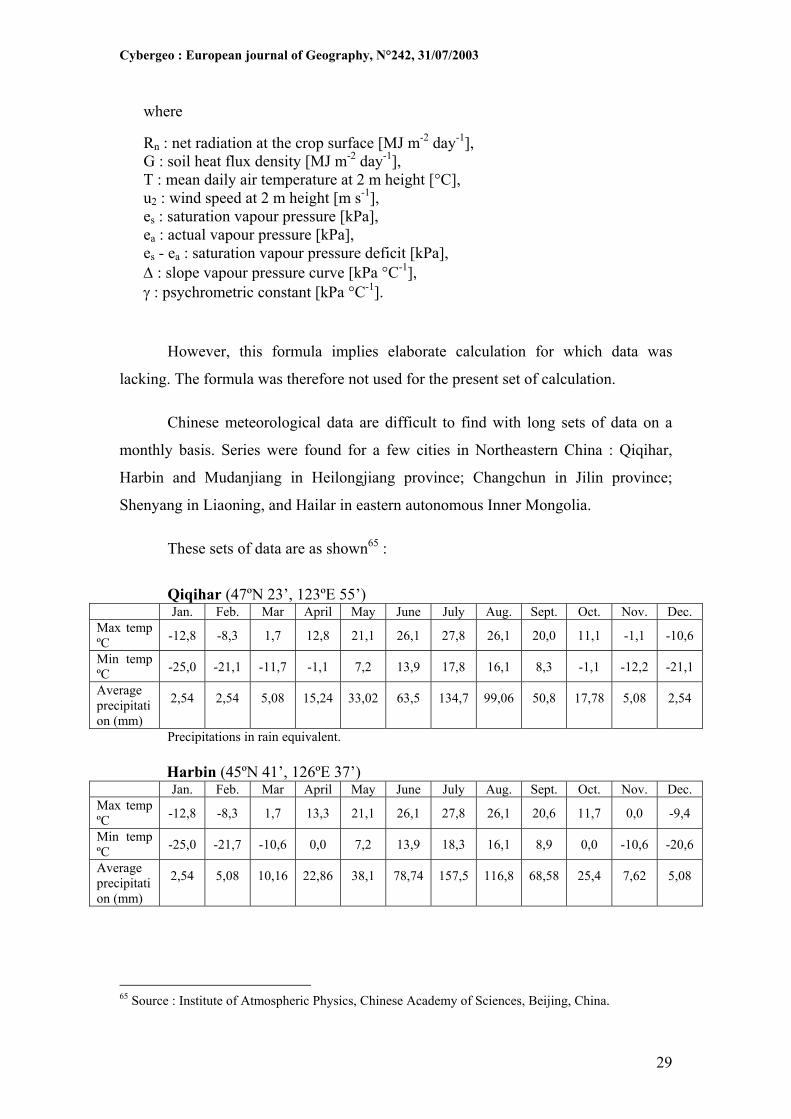
Chinese meteorological data are difficult to find with long sets of data on a
monthly basis. Series were found for a few cities in Northeastern China : Qiqihar,
Harbin and Mudanjiang in Heilongjiang province; Changchun in Jilin province;
Shenyang in Liaoning, and Hailar in eastern autonomous Inner Mongolia.
These sets of data are as shown65 :
Qiqihar (47ºN 23’, 123ºE 55’)
Jan. Feb. Mar April May June July Aug. Sept. Oct. Nov. Dec. Max temp ºC -12,8 -8,3 1,7 12,8 21,1 26,1 27,8 26,1 20,0 11,1 -1,1 -10,6
Min temp ºC -25,0 -21,1 -11,7 -1,1 7,2 13,9 17,8 16,1 8,3 -1,1 -12,2 -21,1
Average precipitation (mm)
2,54 2,54 5,08 15,24 33,02 63,5 134,7 99,06 50,8 17,78 5,08 2,54
Precipitations in rain equivalent.
Harbin (45ºN 41’, 126ºE 37’) Jan. Feb. Mar April May June July Aug. Sept. Oct. Nov. Dec.
Max temp ºC -12,8 -8,3 1,7 13,3 21,1 26,1 27,8 26,1 20,6 11,7 0,0 -9,4
Min temp ºC -25,0 -21,7 -10,6 0,0 7,2 13,9 18,3 16,1 8,9 0,0 -10,6 -20,6
Average precipitation (mm)
2,54 5,08 10,16 22,86 38,1 78,74 157,5 116,8 68,58 25,4 7,62 5,08
65 Source : Institute of Atmospheric Physics, Chinese Academy of Sciences, Beijing, China.
29
Cybergeo : European journal of Geography, N°242, 31/07/2003
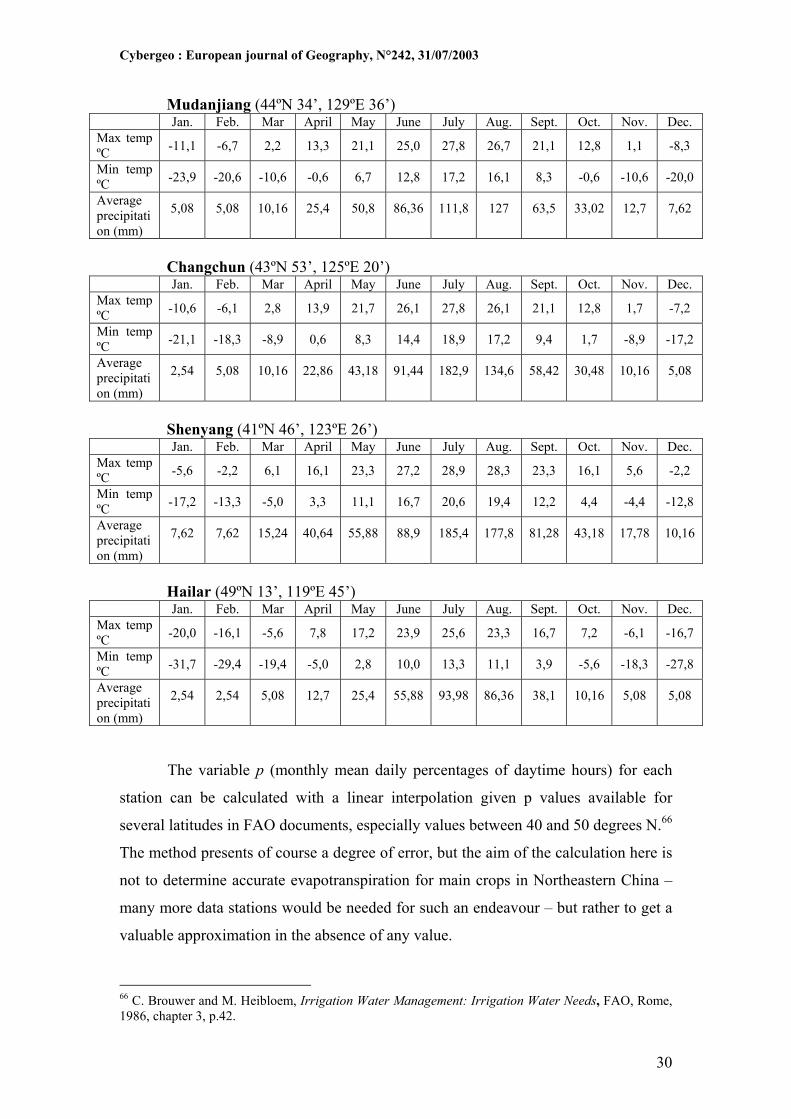
Mudanjiang (44ºN 34’, 129ºE 36’) Jan. Feb. Mar April May June July Aug. Sept. Oct. Nov. Dec.
Max temp ºC -11,1 -6,7 2,2 13,3 21,1 25,0 27,8 26,7 21,1 12,8 1,1 -8,3
Min temp ºC -23,9 -20,6 -10,6 -0,6 6,7 12,8 17,2 16,1 8,3 -0,6 -10,6 -20,0
Average precipitation (mm)
5,08 5,08 10,16 25,4 50,8 86,36 111,8 127 63,5 33,02 12,7 7,62
Changchun (43ºN 53’, 125ºE 20’)
Jan. Feb. Mar April May June July Aug. Sept. Oct. Nov. Dec. Max temp ºC -10,6 -6,1 2,8 13,9 21,7 26,1 27,8 26,1 21,1 12,8 1,7 -7,2
Min temp ºC -21,1 -18,3 -8,9 0,6 8,3 14,4 18,9 17,2 9,4 1,7 -8,9 -17,2
Average precipitation (mm)
2,54 5,08 10,16 22,86 43,18 91,44 182,9 134,6 58,42 30,48 10,16 5,08
Shenyang (41ºN 46’, 123ºE 26’)
Jan. Feb. Mar April May June July Aug. Sept. Oct. Nov. Dec. Max temp ºC -5,6 -2,2 6,1 16,1 23,3 27,2 28,9 28,3 23,3 16,1 5,6 -2,2
Min temp ºC -17,2 -13,3 -5,0 3,3 11,1 16,7 20,6 19,4 12,2 4,4 -4,4 -12,8
Average precipitation (mm)
7,62 7,62 15,24 40,64 55,88 88,9 185,4 177,8 81,28 43,18 17,78 10,16
Hailar (49ºN 13’, 119ºE 45’)
Jan. Feb. Mar April May June July Aug. Sept. Oct. Nov. Dec. Max temp ºC -20,0 -16,1 -5,6 7,8 17,2 23,9 25,6 23,3 16,7 7,2 -6,1 -16,7
Min temp ºC -31,7 -29,4 -19,4 -5,0 2,8 10,0 13,3 11,1 3,9 -5,6 -18,3 -27,8
Average precipitation (mm)
2,54 2,54 5,08 12,7 25,4 55,88 93,98 86,36 38,1 10,16 5,08 5,08
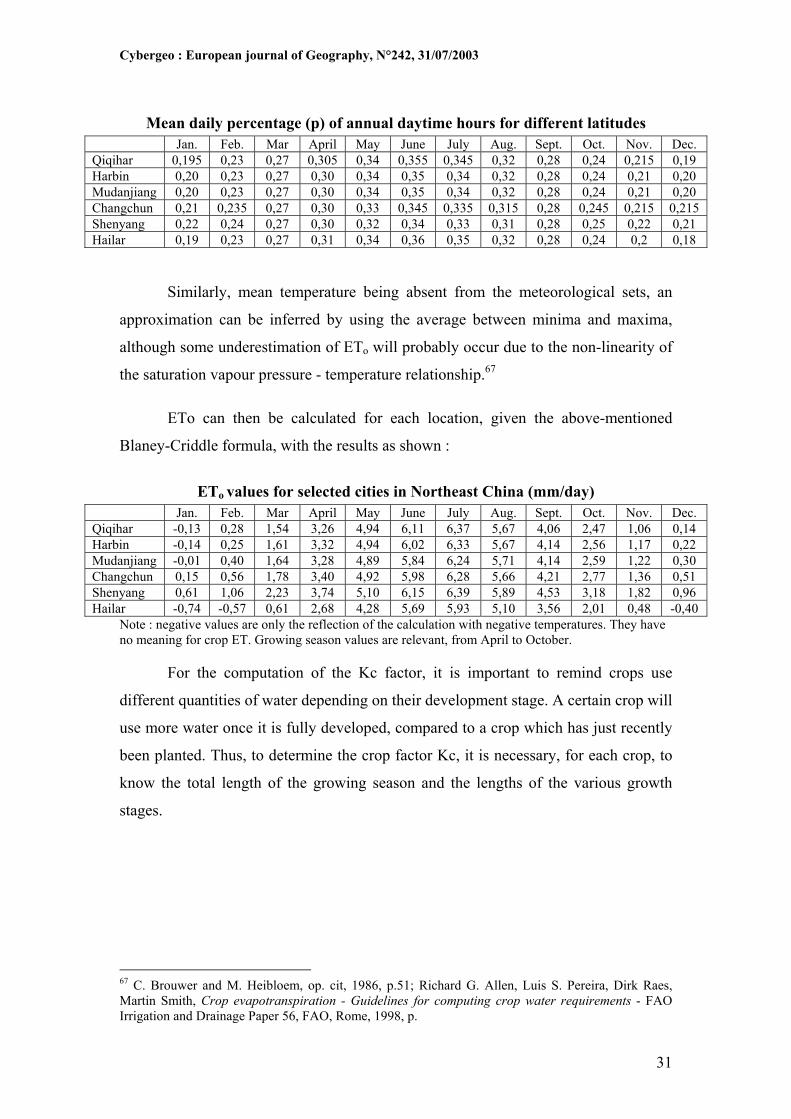
The variable p (monthly mean daily percentages of daytime hours) for each
station can be calculated with a linear interpolation given p values available for
several latitudes in FAO documents, especially values between 40 and 50 degrees N.66
The method presents of course a degree of error, but the aim of the calculation here is
not to determine accurate evapotranspiration for main crops in Northeastern China –
many more data stations would be needed for such an endeavour – but rather to get a
valuable approximation in the absence of any value.
66 C. Brouwer and M. Heibloem, Irrigation Water Management: Irrigation Water Needs, FAO, Rome, 1986, chapter 3, p.42.
30
Cybergeo : European journal of Geography, N°242, 31/07/2003
Mean daily percentage (p) of annual daytime hours for different latitudes
Jan. Feb. Mar April May June July Aug. Sept. Oct. Nov. Dec. Qiqihar 0,195 0,23 0,27 0,305 0,34 0,355 0,345 0,32 0,28 0,24 0,215 0,19 Harbin 0,20 0,23 0,27 0,30 0,34 0,35 0,34 0,32 0,28 0,24 0,21 0,20 Mudanjiang 0,20 0,23 0,27 0,30 0,34 0,35 0,34 0,32 0,28 0,24 0,21 0,20 Changchun 0,21 0,235 0,27 0,30 0,33 0,345 0,335 0,315 0,28 0,245 0,215 0,215 Shenyang 0,22 0,24 0,27 0,30 0,32 0,34 0,33 0,31 0,28 0,25 0,22 0,21 Hailar 0,19 0,23 0,27 0,31 0,34 0,36 0,35 0,32 0,28 0,24 0,2 0,18
Similarly, mean temperature being absent from the meteorological sets, an
approximation can be inferred by using the average between minima and maxima,
although some underestimation of ETo will probably occur due to the non-linearity of
the saturation vapour pressure - temperature relationship.67
ETo can then be calculated for each location, given the above-mentioned
Blaney-Criddle formula, with the results as shown :
ETo values for selected cities in Northeast China (mm/day)
Jan. Feb. Mar April May June July Aug. Sept. Oct. Nov. Dec. Qiqihar -0,13 0,28 1,54 3,26 4,94 6,11 6,37 5,67 4,06 2,47 1,06 0,14 Harbin -0,14 0,25 1,61 3,32 4,94 6,02 6,33 5,67 4,14 2,56 1,17 0,22 Mudanjiang -0,01 0,40 1,64 3,28 4,89 5,84 6,24 5,71 4,14 2,59 1,22 0,30 Changchun 0,15 0,56 1,78 3,40 4,92 5,98 6,28 5,66 4,21 2,77 1,36 0,51 Shenyang 0,61 1,06 2,23 3,74 5,10 6,15 6,39 5,89 4,53 3,18 1,82 0,96 Hailar -0,74 -0,57 0,61 2,68 4,28 5,69 5,93 5,10 3,56 2,01 0,48 -0,40
Note : negative values are only the reflection of the calculation with negative temperatures. They have no meaning for crop ET. Growing season values are relevant, from April to October.
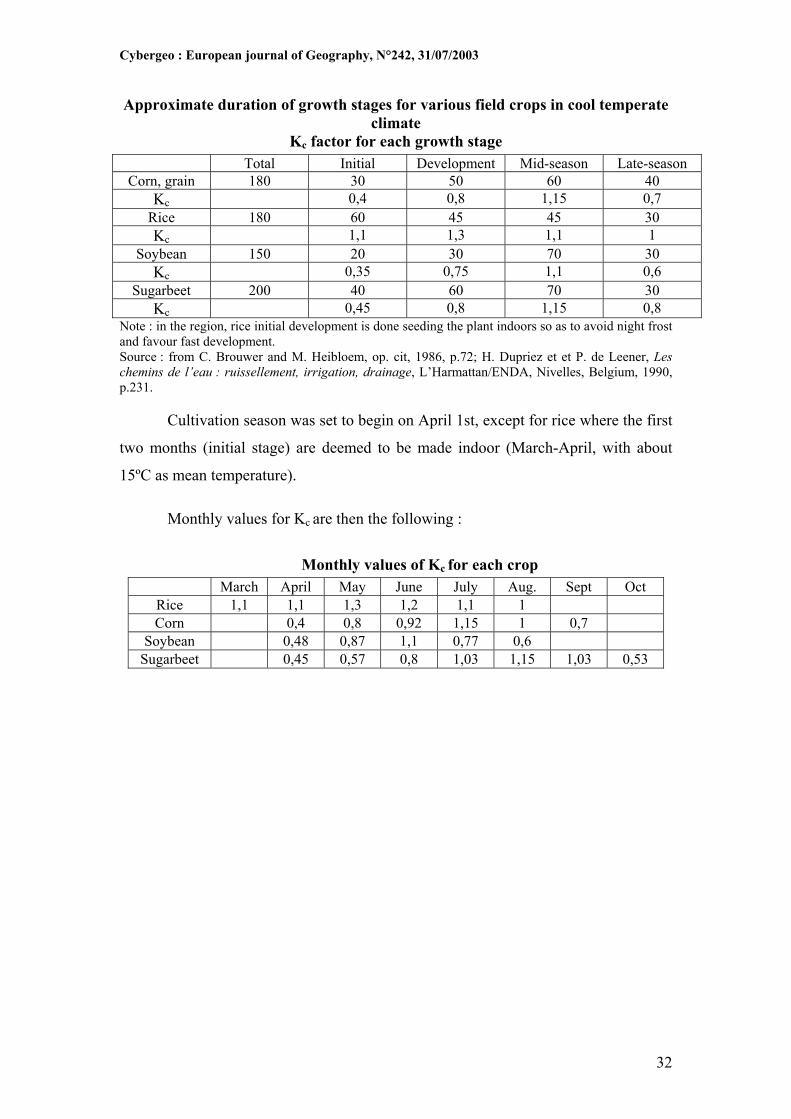
For the computation of the Kc factor, it is important to remind crops use
different quantities of water depending on their development stage. A certain crop will
use more water once it is fully developed, compared to a crop which has just recently
been planted. Thus, to determine the crop factor Kc, it is necessary, for each crop, to
know the total length of the growing season and the lengths of the various growth
stages.
67 C. Brouwer and M. Heibloem, op. cit, 1986, p.51; Richard G. Allen, Luis S. Pereira, Dirk Raes, Martin Smith, Crop evapotranspiration - Guidelines for computing crop water requirements - FAO Irrigation and Drainage Paper 56, FAO, Rome, 1998, p.
31
Cybergeo : European journal of Geography, N°242, 31/07/2003
Approximate duration of growth stages for various field crops in cool temperate climate
Kc factor for each growth stage Total Initial Development Mid-season Late-season
Corn, grain 180 30 50 60 40 Kc 0,4 0,8 1,15 0,7
Rice 180 60 45 45 30 Kc 1,1 1,3 1,1 1
Soybean 150 20 30 70 30 Kc 0,35 0,75 1,1 0,6
Sugarbeet 200 40 60 70 30 Kc 0,45 0,8 1,15 0,8
Note : in the region, rice initial development is done seeding the plant indoors so as to avoid night frost and favour fast development. Source : from C. Brouwer and M. Heibloem, op. cit, 1986, p.72; H. Dupriez et et P. de Leener, Les chemins de l’eau : ruissellement, irrigation, drainage, L’Harmattan/ENDA, Nivelles, Belgium, 1990, p.231.
Cultivation season was set to begin on April 1st, except for rice where the first
two months (initial stage) are deemed to be made indoor (March-April, with about
15ºC as mean temperature).
Monthly values for Kc are then the following :
Monthly values of Kc for each crop
March April May June July Aug. Sept Oct Rice 1,1 1,1 1,3 1,2 1,1 1 Corn 0,4 0,8 0,92 1,15 1 0,7
Soybean 0,48 0,87 1,1 0,77 0,6 Sugarbeet 0,45 0,57 0,8 1,03 1,15 1,03 0,53
32
Cybergeo : European journal of Geography, N°242, 31/07/2003
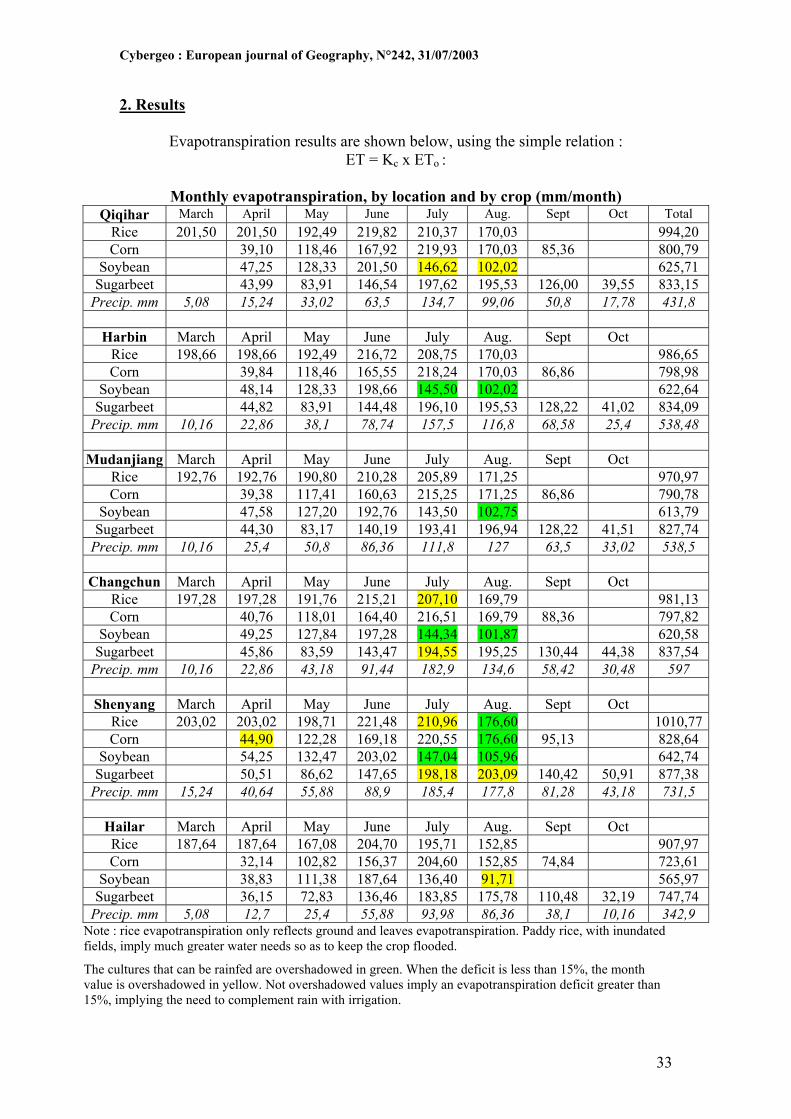
2. Results Evapotranspiration results are shown below, using the simple relation :
ET = Kc x ETo : Monthly evapotranspiration, by location and by crop (mm/month)
Qiqihar March April May June July Aug. Sept Oct Total Rice 201,50 201,50 192,49 219,82 210,37 170,03 994,20 Corn 39,10 118,46 167,92 219,93 170,03 85,36 800,79
Soybean 47,25 128,33 201,50 146,62 102,02 625,71 Sugarbeet 43,99 83,91 146,54 197,62 195,53 126,00 39,55 833,15
Precip. mm 5,08 15,24 33,02 63,5 134,7 99,06 50,8 17,78 431,8
Harbin March April May June July Aug. Sept Oct Rice 198,66 198,66 192,49 216,72 208,75 170,03 986,65 Corn 39,84 118,46 165,55 218,24 170,03 86,86 798,98
Soybean 48,14 128,33 198,66 145,50 102,02 622,64 Sugarbeet 44,82 83,91 144,48 196,10 195,53 128,22 41,02 834,09
Precip. mm 10,16 22,86 38,1 78,74 157,5 116,8 68,58 25,4 538,48
Mudanjiang March April May June July Aug. Sept Oct Rice 192,76 192,76 190,80 210,28 205,89 171,25 970,97 Corn 39,38 117,41 160,63 215,25 171,25 86,86 790,78
Soybean 47,58 127,20 192,76 143,50 102,75 613,79 Sugarbeet 44,30 83,17 140,19 193,41 196,94 128,22 41,51 827,74
Precip. mm 10,16 25,4 50,8 86,36 111,8 127 63,5 33,02 538,5
Changchun March April May June July Aug. Sept Oct Rice 197,28 197,28 191,76 215,21 207,10 169,79 981,13 Corn 40,76 118,01 164,40 216,51 169,79 88,36 797,82
Soybean 49,25 127,84 197,28 144,34 101,87 620,58 Sugarbeet 45,86 83,59 143,47 194,55 195,25 130,44 44,38 837,54
Precip. mm 10,16 22,86 43,18 91,44 182,9 134,6 58,42 30,48 597
Shenyang March April May June July Aug. Sept Oct Rice 203,02 203,02 198,71 221,48 210,96 176,60 1010,77Corn 44,90 122,28 169,18 220,55 176,60 95,13 828,64
Soybean 54,25 132,47 203,02 147,04 105,96 642,74 Sugarbeet 50,51 86,62 147,65 198,18 203,09 140,42 50,91 877,38
Precip. mm 15,24 40,64 55,88 88,9 185,4 177,8 81,28 43,18 731,5
Hailar March April May June July Aug. Sept Oct Rice 187,64 187,64 167,08 204,70 195,71 152,85 907,97 Corn 32,14 102,82 156,37 204,60 152,85 74,84 723,61
Soybean 38,83 111,38 187,64 136,40 91,71 565,97 Sugarbeet 36,15 72,83 136,46 183,85 175,78 110,48 32,19 747,74
Precip. mm 5,08 12,7 25,4 55,88 93,98 86,36 38,1 10,16 342,9 Note : rice evapotranspiration only reflects ground and leaves evapotranspiration. Paddy rice, with inundated fields, imply much greater water needs so as to keep the crop flooded.
The cultures that can be rainfed are overshadowed in green. When the deficit is less than 15%, the month value is overshadowed in yellow. Not overshadowed values imply an evapotranspiration deficit greater than 15%, implying the need to complement rain with irrigation.
33
Cybergeo : European journal of Geography, N°242, 31/07/2003
3. Data analysis :
Rice is for sure a water-demanding crop; so is corn, to a lesser extent.
Although its water needs are spread over a longer growing season, sugarbeet is also
demanding similar amounts to corn.
To the contrary, soybean is not very demanding and would seem more adapted
to dryer latitudes. Wheat, not calculated in this study, is also a crop that does not
require large amounts of water per surface unit – as much as 30% less.68
It then may seem a curious choice to have opted for rice, corn and sugarbeet in
rather dry regions.
But the amount of water needed by these crops, given the low temperatures, is
not enormous : relative water scarcity for agricultural activities in the Northeast
region will not really stem from the development of water-hungry crops such as
cotton or tomato, but rather from the sheer extension of cultivated fields. Data shows
precipitation levels are so low that irrigation is quite often needed to complement,
sometimes heavily, crop cultivation in the area, the more so as cultivation is
expanding up north and west. Results do show relying only on rain to grow crops is
nearly impossible in Qiqihar and Hailar, but more so in Shenyang, underlining the
decreasing precipitation gradient from the Southeast to the Northwest. There will be a
clear correlation between crop extension and water need, which can be satisfied either
with river irrigation or aquifer pumping. Given the low level of precipitation, it is
doubtful replenishment of aquifers is fast : pumping will thus alter aquifer levels and
encourage irrigation with water pumped from rivers in the Ussuri and Sungari
watersheds.
Water flows are large in the Amur basin; but growing needs in Northeastern
China may soon begin to alter basin-wide water availability.
68 R. Bouillot, Hydraulique agricole et urbaine, Institut National Polytechnique de Grenoble, tome 1, 1976, p.97.
34
Cybergeo : European journal of Geography, N°242, 31/07/2003
Bibliography
WORLD BANK, China : Air, Land and Water. Environmental Priorities for a New Millenium, Washington, DC, 2001.
BANGYI, Yao et QINGLIAN, Chen. « South-to-North Water Transfer project Plans », dans Asit Biswas, Zuo Dakang, James Nickum and Liu Changming (eds.), Long-distance Water Transfer : A Chinese Case Study and International Experiences, Dublin, Tycooly, 1983.
BETHEMONT, Jacques. Les grands fleuves. Armand Colin, Paris, 1999. BISWAS, Asit; DAKANG, Zuo; NICKUM, James et CHANGMING, Liu (eds.), Long-
distance Water Transfer: A Chinese Case Study and International Experiences, Dublin, Tycooly, 1983.
BRAVARD, Jean-Paul. « Un enjeu hydropolitique et environnemental majeur pour la Chine: le transfert Sud-Nord », Hérodote, Revue de géographie et de géopolitique, Paris, 102, 2001.
BROWN, Lester. Who will feed China ? WW Norton, New York, 1995. BROWN, Lester and HALWEIL, Brian. « China’s Water Shortage Could Shake World
Food Security », WorldWatch Magazine, July-August 1998. CHANGMING, Liu. « Environmental Issues and the South-North Water Transfer
Scheme », The China Quarterly, 4, 1998. CHANGMING, Liu et DAJUN, Shen. « The most vital strategy. An overview of areal
reallocation of China’s water resources », Chinese Environment & Development, vol.5, nº2, 1995.
CHUNHUAI, Chen. “South to North Water Transfer – an important strategic measure of water resource exploitation in China”, Science and Technology Review, 1991.
COLIN, Sébastien. « Confins sino-russes : les nouvelles dynamiques frontalières en Asie du Nord-est », in Asies Nouvelles, Atlas de l’Asie, Michel Foucher editor, Belin, Paris, 2002.
CROOK, Frederick et DIAO, Xinshen. « Water Pressure in China : Growth Strains Resources », Agricultural Outlook, Jan.- Feb. 2000.
CUTTER, Susan et RENWICK, William. Exploitation Conservation Preservation: A Geographic Perspective on Natural Resource Use. John Wiley, Washington, 1985.
DE VILLIERS. Water, Stoddart, Toronto, 1999. DADAO, Lu. « An important solution to the problem of water shortage in North
China », Chinese Environment & Development, vol. 4, nº3, 1993. ECONOMY, Elizabeth. The Case study of China. Reforms and resources: the
implication for State capacity in the PRC. Occasional Paper of the Project on Environmental Scarcities, State Capacity, and Civil Violence, Cambridge: American Academy of Arts and Sciences and University of Toronto, 1997.
FALKENHEIM Meyer, Peggy. Sino-Russian Relations under Putin, CANCAPS Papers nº24, Toronto, 2000.
FUGGLE, R. et SMITH, W. Experience with Dams in Water and Energy Resource Development in the People’s Republic of China. Document prepared for the World Commission on Dams, Cape Town, 2000.
GALE, Fred et HSU, Hsin-Hui. « China’s Grain Policy at a Crossroads », Agricultural Outlook, Sept. 2001.
35
Cybergeo : European journal of Geography, N°242, 31/07/2003
GARNETT, Sherman. Limited Partnership. Russia-China Relations in a Changing Asia, Russian and Eurasian Program, Carnegie Endowment for International Peace, Washington, 1998.
GLANTZ, Michael, YE, Qian et GE, Quansheng. « China's western region development strategy and the urgent need to address creeping environmental problems », Arid Land Newsletter, 49, 2001.
HART, Thomas. « Natural Limits Will Constrain China’s future », in Derek da Cunha, (dir.), The Evolving Pacific Power Structure, ISEAS, Singapore, 1996.
HEILIG, Gerhard. China Food. Can China Feed Itself ? IIASA, Laxenburg, 1999. HOMER-DIXON, Thomas. Environment, Scarcity and Violence, Princeton University
Press, 1999. ILOMÄKI, Jukka. « China », in Institutional Challenge of Developing Transboundary
Water Resources, Helsinki University of Technology, Water Resource Laboratory, 2000.
KENDY, Eloise. « Hydrologic impacts of socio-economic development of the North China plain: case study of Luancheng County, Hebei Province ». 12e Stockholm Water Symposium, Stockholm, August 2002.
KIM, Jih-Un. « Drifting on the drying water pool : China’s Water scarcity and its political foreboding ». Asian Perspective, vol.25, 1, 2001.
LASSERRE, Frédéric. « Le prochain siècle sera-t-il celui des guerres de l’eau? ». Revue Internationale et Stratégique (Paris), n° 33, 1999.
LASSERRE, Frédéric. « Alleviating Water Scarcity in Northern China : Balancing Options and Policies among Chinese Decision-makers ». 12e Stockholm Water Symposium, Stockholm, August 12-15 2002. Forthcoming in the Conference Proceedings, 2003.
LASSERRE, Frédéric et GONON, Emmanuel, Espaces et enjeux: méthodes d’une géopolitique critique, L’Harmattan, Montréal et Paris, 2002.
LASSERRE, Frédéric et DESCROIX, Luc. Eaux et territoires: tensions, coopérations et géopolitique de l'eau. Presses de l’Université du Québec/L’Harmattan, Québec/Paris, 500 p., 2002.
MAINGUET, Monique. « Aridité, sécheresse et dégradation dans les aires sèches de Chine », Cahiers Sécheresse, vol.7, nº1, 1996.
MAO Yu-shi; DATONG, Ning; GUANG, Xia; WANG, Hongchang; SMIL, Vaclav. An assessment of the Economic Losses Resulting from Various Forms of Environmental Degradation in China. Occasional Paper of the Project on Environmental Scarcities, State Capacity, and Civil Violence, Cambridge: American Academy of Arts and Sciences and University of Toronto, 1997.
MWR, MINISTRY OF WATER RESOURCES, People’s Republic of China ; World Bank ; AusAID. China : Agenda for Water Sector Strategy for North China. Beijing. Vol. 1 : Summary Report, April 2, 2001.
NICKUM, James. « Is China Living on the Water Margin ? », The China Quarterly, 4, 1998.
POSTEL, Sandra. Pillar of Sand: Can the Irrigation Miracle Last?, Worldwatch Institute, New York, 1999.
SMIL, Vaclav. The Bad Earth, Environmental Degradation in China, ME Sharpe et Zed Books, New York and London, 1984.
SMIL, Vaclav. China’s Environmental Crisis, An Inquiry into the Limits of National Development, ME Sharpe, New York and London, 1993.
SMIL, Vaclav. Environmental Problems in China: Estimates of Economic Costs, East-West Center Special Report No. 5, East-West Center, Honolulu, 1996.
36
Cybergeo : European journal of Geography, N°242, 31/07/2003
TIANXIN, Yu et KANG, Jia. « An inquiry into the resolution of China’s water resource crisis », Chinese Environment & Development, vol. 7, nº4, 1997.
WEN, Bo. Chinese Transboundary Water Issues, Meeting of the Working Group on Environment in US-China Relations, January 7, 1998, Washington, DC.
WISHNICK, Elizabeth. « Chinese Perspectives on Cross-border Relations », in Sherman Garrett (ed.), Rapprochement or Rivalry ? Russia-China Relations in a Changing Asia, Carnegie Endowment for International Peace, Washington, DC, 2000.
WU, Kai; TANG, Deug-Yin et XIE, Xian-Qun, « Effects of Water Fluctuation on Agricultural Production in the Huang-Hai-Hai Plain, China », The Journal of Geography, 9, 3, 1999.
XIANDE, Chen. « Water transfer along the western route », Chinese Environment & Development, vol.5, nº2, 1995.
YANG, Hong et ZEHNDER, Alexander. « China’s regional water scarcity and implications for grain supply and trade », Environment and Planning A, vol. 33, 2001.
ZHENDA, Chu. Desertification and rehabilitation in China. Science Publishers, Beijing, 1989.
CYBERGEO 2003
F. LASSERRE, CYBERGEO, No. 242, 30 july 2003
37