the american mineralogist, vol 52, march … · the american mineralogist, vol 52, march_april. ......
TRANSCRIPT

THE AMERICAN MINERALOGIST, VOL 52, MARCH_APRIL. 196?
ELECTRON PROBE MICROANALYSIS OF SPHALERITE
K. L. Wrnre.ws, Department oJ Geology, Awstrali,on I{ational [./nitersity,Canberra, A.C.T.
Agstne.cr
Sources of error inherent in the use of pure element standards for the electron probemicroanalysis of sphalerites are reviewed, and comparisons made between methods avail-able for their correction. Combination of these methods yields simple matrix correctionparameters which can be applied to observed intensity ratios, after the latter have been cor-rected for instrumental errors (dead time, drift and background), to yield refined valuescompensated for absorption, fluorescence and atomic number effects.
Electron probe microanalysis has been suggested (Williams, 1965) tobe a useful technique for the major-element analysis of sphalerite samples,an essential part of geochemical studies of many sulfide deposits. Use ofthe electron probe offers definite advantages over other commonly em-ployed techniques if the samples are chemically inhomogeneous or con-tain inseparable inclusions of other mineralsl in fact it is particularlysuitable for the study of small scale inhomogeneities, from which valuabledata concerning delicate equilibrium adjustments can be derived (Bar-ton, Bethke and Toulmin, 1963).
The principal sources of error in electron probe analysis are by nowclearly defined, but satisfactory universal correction techniques have notyet been developed. This contribution reviews the particular problemsencountered in sphalerite analysis, compares some of the methods whichmight be employed to overcome them, and outlines the basis for a simplecorrection procedure. Similar procedures can be readily developed formany other sulfide systems, although the factors discussed below willhave to be carefully reviewed in each case in view of certain obviouslimitations.
Quantitative electron probe analysis can be performed in either of twoways: (1) by comparing the intensities of characteristic X-radiations de-rived from the sample with those derived, under similar conditions, fromcalibration standards of similar, known compositions; or (2) by compar-ing the sample intensities with those derived from standards of ac-curately known but significantly different compositions (usually pureelements or simple, stoichiometric compounds of the elements concerned).
The first method is simpler in some respects and is generally favouredwhere it is applicable. However, it requires a "l ibrary" of standardswhich must be accurately analysed and homogeneous to the submicronlevel, and which must cover the full range of compositions expected inthe samples to be analysed. If calibration standards are too widelyspaced in composition, it may be necessary to develop formulae for inter-
475
476 K. L. WILLIAMS
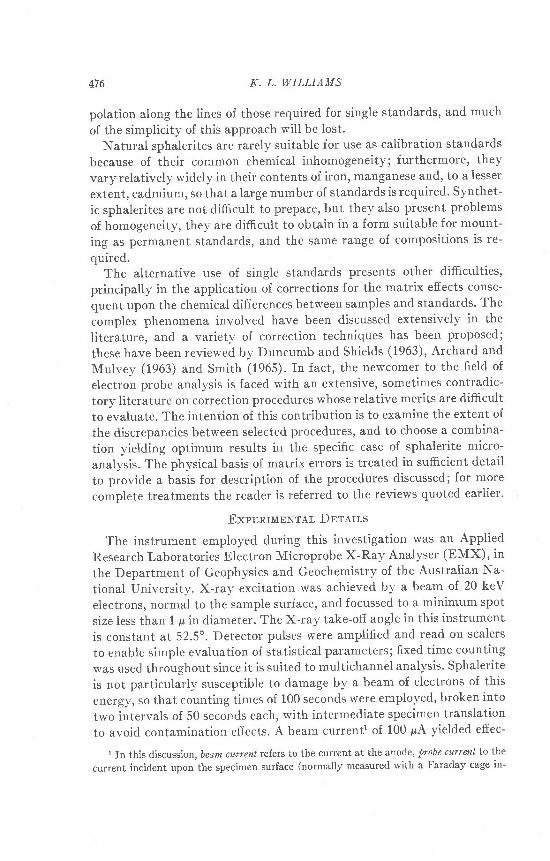
polation along the lines of those required for single standards, and much
of the simplicity of this approach will be lost.
Natural sphalerites are rarely suitable for use as calibration standards
because of their common chemical inhomogeneity; furthermore, they
vary relatively widely in their contents of iron, manganese and, to a lesser
extent, cadmium, so that a large number of standards is required. Synthet-
ic sphalerites are not difficult to prepare, but they also present problems
of homogeneity, they are diffi.cult to obtain in a form suitable for mount-
ing as permanent standards, and the same range of compositions is re-
quired.The alternative use of single standards presents other difficulties,
principally in the application of corrections for the matrix effects conse-
quent upon the chemical differences between samples and standards. The
complex phenomena involved have been discussed extensively in the
Iiterature, and a variety of correction techniques has been proposed;
these have been reviewed by Duncumb and Shields (1963), Archard and
Mulvey (1963) and Smith (1965). In fact, the newcomer to the field of
electron probe analysis is faced with an extensive, sometimes contradic-
tory literature on correction procedures whose relative merits are difficult
to evaluate. The intention of this contribution is to examine the extent of
the discrepancies between selected procedures, and to choose a combina-
tion yielding optimum results in the specific case of sphalerite micro-
analysis. The physical basis of matrix errors is treated in suffi,cient detail
to provide a basis for description of the procedures discussed; for more
complete treatments the reader is referred to the reviews quoted earlier'
ExpBnrlrBNrAr DETATLS
The instrument employed during this investigation was an Applied
Research Laboratories Electron Microprobe X-Ray Analyser (EMX)' in
the Department of Geophysics and Geochemistry of the Australian Na-
tional University. X-ray excitation was achieved by a beam of 20 keV
electrons, normal to the sample surface, and focussed to a minimum spot
size less than 1 p in diameter. The X-ray take-off angle in this instrument
is constant at 52.5o. Detector pulses were amplif ied and read on scalers
to enable simple evaluation of statistical parameters; fixed time counting
was used throughout since it is suited to multichannel analysis. Sphalerite
is not particularly susceptible to damage by a beam of electrons of this
energy, so that counting times of 100 seconds were employed, broken into
two intervals of 50 seconds each, with intermediate specimen translation
to avoid contamination effects. A beam currentl of 100 pA yielded effec-
r In this discussion, beam currenl refers to the current at the anode, probe currml t:o the
current incident upon the specimen surface (normally measured with a Faraday cage in-

L,LECTRON PROBE ANALYSIS OF SPIIALERITE 477
tive specimen currents of approximately 0.05 pA; the latter were inte-grated over each counting interval and used as the basis for instrumentaldrift corrections.
Standards employed were fragments of ,,spectrographically pure" iron,manganese and zinc, mounted in epoxy resin and polished by conven-tional methods. Most of the analyses were made, in connection with an-other project, on sphalerites from the Zeehan Iead-zincfield in Tasmania;these usually contain less than 0.3 percent cadmium, which has thereforebeen neglected in the following discussion. Extension of the principles in-volved to relatively high-cd sphalerites presents little difficulty. Thethree channels of the A.R.L. instrument were employed for the simul-taneous determination of Fe, Mn and Zn, using the characteristic Karadiations in each casel in the absence of afourth channel, sulfur was notseparately determined, but reliance was placed on the stoichiometry ofFeS, Mns and ZnS in the sphalerite structure.
Both samples and standards were sputtered with a carbon coat. Thecarbon thicknesses employed were somewhat less than those recom-mended by Smith (1965), but were kept as uniform as possible.
Analytical runs were begun by counting on each of the three standards,including counts on either side of the Ka peaks to establish backgroundrates. under normal conditions of stability, up to ten sphalerites couldthen be analyzed before returning the standards to check the extent ofdrift and provide a basis for its correction.
ConnpcrtoN Pnocolunos
All observed X-ray intensities were first corrected for dead time, speci-men current drift and background. Dead time and background correc-tions were made by standard proceduresl the drift correction, to whichIittle reference is made in the literature, compensates for electronic in-stability, and is performed by plotting the total integrated specimen cur-rent (i,) for each analysis as a function of time. It is necessary only if noprovision is available for monitoring the probe current (and adjusting itif necessary to maintain a constant value) during an analytical run.Since specimen current is a function of mean atomic number of the tar-get, it varies from standards to samples and from one sample to another;however, a "drift curve" can readily be plotted from measurements madeon the periodically returned standards, with intervening sample mea-surements being used to define the general form of the curve. Application
serted in place of the specimen) and specimen current to the actual current collected by thespecimen (i.e. the "effective electron current" of Poole and rhomas (1962), ot the probecurrent minus the back-scattered electrons).
478 K. L. WILLIAMS
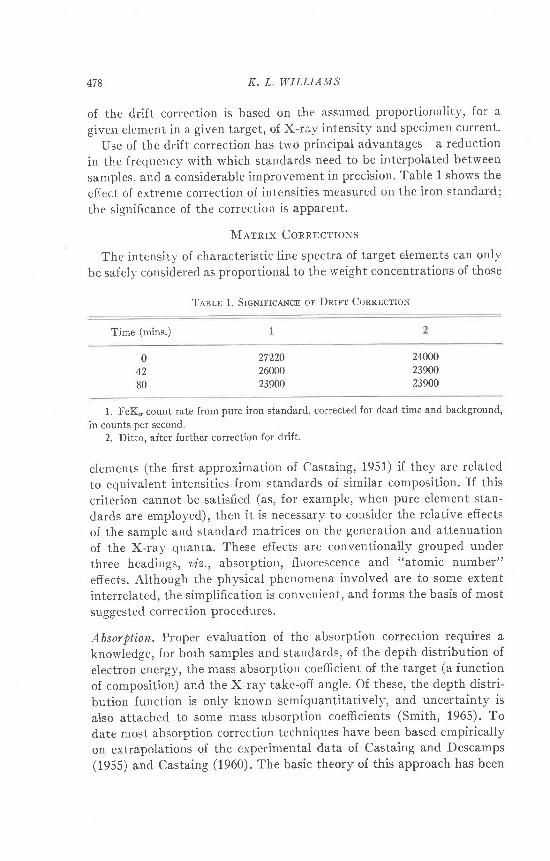
of the drift correction is based on the assumed proportionality, for a
given element in a given target, of X-ra-v intensity and specimen current.
Use of the drift correction has two principal advantages-a reduction
in the frequency with which standards need to be interpolated beLween
samples, and a considerable improvement in precision. Table 1 shows the
effect of extreme correction of intensities measured on the iron standard;
the significance of the correction is apparent.
Nlarnrx ConnBcrroxs
The intensit.v of characteristic l ine spectra of target elements can only
be safely considered as proportional to the weight concentrations of those
Te,er-n 1. SrcNrrrcexcr ol Dnrrt Connrcuon
Time (mins.)
272202600023900
1. FeKo count rate from pure iron standard, corrected for dead time and background,
in counts per second.2. Ditto, after further correction for drift.
elements (the first approximation of Castaing, 1951) if they are related
to equivalent intensities from standards of similar composition. If this
criterion cannot be satisfi.ed (as, Ior example, when pure element stan-
dards are employed), then it is necessary to consider the relative effects
of the sample and standard matrices on the generation and attenuation
of the X-ray quanta. These effects are conventionally grouped under
three headings, aiz., absorption, f luorescence and "atomic number"
efiects. Although the phl,sical phenomena involved are to some extenL
interrelated, the simplif ication is convenient, and forms the basis of most
suggested correction procedures.
Absorpti.on. Proper evaluation of the absorption correction requires a
knowledge, for both samples and standards, of the depth distribution of
electron energy, the mass absorption coefficient of the target (a function
of composition) and the X-ray take-off angle. Of these, the depth distri-
bution function is only known semiquantitatively, and uncertainty is
also attached to some mass-absorption coeffi.cients (Smith, 1965). To
date most absorption correction techniques have been based empirically
on extrapolations of the experimental data of Castaing and Descamps(1955) and Castaing (1960). The basic theory of this approach has been
240002s90023900
0+z
80

I;LLCTRON PROBE ANALYSIS OF SPHALERITE 179
exhaustively reiterated in the literature and need not be further dis-cussed here; the result of the experimental work was the production of aset of curves expressing F(1) as a function of 1, electron energy, andtarget atomic number, where y: p,fp cosec ,tt (p,/p--mass absorption co-efficient of target for the radiation concerned, *:take-off angle) andF(1) is in effect the ratio of the measured intensity to that which wouldhave been measured had there been no absorption.
If 1':measured intensity, then the true intensity 1, corrected forabsorption, is given by
r : r'/F(y)
Relating this to intensities derived from standards,
I _ I ' . F [ x ]
Io tJ F(x)
where l and F(1) refer to the sample and Io and F[1] to the standard.Extrapolations of the data of Castaing and Descamps to a wider range
of targets and electron energies are typified by the tables and curves ofBirks (1963). These achieve a useful simplicity by treating the variationof the absorption intensity function with atomic number as a relativelysmall second-order correction, and using the copper data of Castaingand Descamps for all elements.
Column 1 of Table 2lists the correction factors Flx]/F(x) calculatedfrom the data of Birks for a range of hypothetical sphalerite composi-tionsl separate factors are of course required for Fe, Mn and Zn. Pureelement standards are assumed throughout. Multiplication of the ap-parent intensity ratios by the appropriate factors yields refined values,corrected for absorption errors.l
An alternative approach to extrapolation of the same experimentaldata is that of Phil ibert (1963), who derived the analytical expression
F(x) :It + (x/")JIt + r' lt + (x/dll
where o (a function of incident electron energy) and h (a function ofatomic number) were assigned empirical values adjusted to fit the dataof Castaing and Descamps. Smith (1965) has offered a set of "i" valuesto substitute for the original /z values of Philibert; these are the products
I In the calculation of these factors, the mass absorption coefficients employed havebeen obtained from the tables of Heinrich (1964); in the case of some sphalerites the calcu-lated values have been confirmed bv exoerimental measurements on an X-rav fluorescencespectrograph.

480
I: Iron
K. L. WILLIAMS
'IAsr,n 2. Venrnrror ol MATRTx ConnncrroN P.tn.querrns wrrrr Cou"osrrroN
Absorption Generation Factor
FeS(wt percent)
1Rirks
Plxl/F(x)
2PhilibertSmith
Flxl/F(x)
5Experi-mental
6Poole &Tbomas
l tI Lons &lReed/Smith
MnS:0 07a
MnS:s .oTa
t v lns
III: Zinc
MnS:o7o
1 . 05 09 . 0
1 3 01 7 01 9 . 0
1 05 . 09 0
1 3 01 7 . 01 9 . 0
1 . 05 09 . 0
1 3 . 01 7 . O1 9 . 0
t .o23I o23r . 0 2 2I o221, O21,1 021
1 . 0 3 11 030I .0301 .O2l1 0211 . 0 2 1
0 . 9 9 40 .993o.9920.9900 9890 . s 8 5
o.9920 . 9 9 10 . 9 8 70 . 9 8 60 . 9 8 50.984
t . o21 ,I o2 lI o2 lr 020r .o12I o t z
| 021I o211.o12t -o121 .0121 . 0 1 0
1 .030| 029I o291 028I 028I 028
L O29I o29L0281 . 0 2 81 028| 027
0 0790 0 7 10 0630 . 0 5 60 . 0 4 80 . 0 4 3
0 0660 0590 0.;10 .0440 . 0 3 70 . 0 3 3
0 0510 0460.0400 . 0 3 50 0300 028
0 0470 . 0 4 10 0360 0 3 10 . 0 2 60 . 0 2 5
0 0400 . 0 3 50 . 0 3 00.o27o.o240 . 0 2 3
0.9920 . 9 9 10 . 9 8 90 . 9 8 80 9870 . 9 8 6
0 . 9 9 00 9890 9870 9860.9850 . 9 8 4
I .0031 0011 0000.9990.9970.996
1 0010.9990 . 9 9 80.9960 9950 994
o.999o 99'I0 . 9 9 60 . 9 9 40 . 9 9 30.992
0 . 9 4 5o . 9 4 3o.9420 9,110 . 9 3 90 . 9 3 9
0 9900 . 9 8 70 . 9 8 50 9840 9830 . 9 8 1
0 . 9 8 80 . 9 8 70 9860 9810.9800.980
0.9670 . 9 6 60 963o 9620 . 9 6 00 960
I 037I . 0 3 71 . 0 3 61 . 0 3 61 . 0 3 5I 035
1 . 0 0 3I 0041 0051 . 0 0 71 .0091 0 1 0
I o291 . 0 2 81 .0281.o271.O271 . O 2 7
I .0031 0051 0071 0091 0 1 11 012
r 0141 . 0 1 31 . 0 1 11 . 0 1 01 0091 .008
0 9 5 50 9530 . 9 5 20 9 5 10 9490 . 4 9 9
0 9660 . 9 6 50 . 9 6 10.9600 9590 . 9 5 8
0 . 9 6 40 . 9 6 30 9600 9580 9 5 70 9 5 7
o.9420 . 9 4 10 . 9 3 60 9350.93 ,10 . 9 3 4
! .o171 0 1 61 0 1 41 . 0 1 31 0 1 11 . 0 1 1
1 05 09 0
1 3 01 7 . O1 9 . 0
l I : Manganese
Wittry I ReedC | ( 1+7 )
0 0 9 1 I 1 . 1 0 00.082 I 0930 . 0 7 4 I 0 8 80 066 I 0800 0 s 8 | r 0 7 20 0s8 | 1 . 069
1 . 05 . 09 . 0
1 3 . 0t 7 . o1 9 0
1 . 05 . 09 0
1 3 . 01 7 01 9 . 0
1 038l 037I o371 .0371 0361 036
I .0371 . 0 3 7r 037r .0361 . 0 3 61 .036
1 056I 0 5 11.0491 . 0 4 51 . 0 4 11 . 0 3 9
1 0511 .0481 .0441 0411 . 0 3 71 035

ELECTRON PROBD ANALYSIS OF SPIIALERITL,
' l 'aern 2 (continued)
481
Fluorescence Geniration Factor
FeS(wt percent)
IBirks
FTXVF
2Philibert
SmithFIxl/ F(x\
3Wittry
4
Reed
( t * r )
5Experi-mental
6Poole &Thomas
0 . 9 5 30 9 5 10 9s00 . 9 4 9o.947o.947
7Long &
Reed/Smith
MnS
1 05 09 . 0
1 3 . 01 7 01 9 0
1 .004I 0051 0071 0091 . 0 1 11 012
r . 0 0 51 0071.0091 0 1 11 0 1 4I 0 1 6
1 006I 0071 0091 0 uI 0 1 31 014
o 9430 9410 9400 . 9 3 90 . 9 3 70 937
0 9410 9390 9380 . 9 3 70 . 9 3 50 s35
0 . 9 4 00 9390 93,10 . 9 3 4o.9320 9 3 1
0 . 9 3 70 . 9 3 60 . 9 3 40 9 3 10.9300 . 9 3 0
MnS: r0 .o7o
1 05 09 0
1.3 01 7 . 01 9 0
0 . 9 5 00.949o 9470 9460 . 9 4 50 . 9 4 4
of further empirical adjustments Ieading to better agreement with ex-perimental observations.
As Philibert indicated, his equation actually includes a partial correc-tion for atomic number efiects (since it tends to l/( l+h) as X tends tozero) and it is therefore not strictly comparable with factors obtainedfrom the extrapolation of Birks. The absorption portion of Phil ibert'sexpression may be written (Smith, 1965) as
( r+h)l r+{x/d)g+nl+e/" ) l l
Column 2 of Table 2 Iists absorption factors calculated from this ex-pression, after substitution of Smith's rl values for Philibert's Z values.The similarity to factors derived from Birks' data is not surprising sinceboth sets are derived ultimately from the same experimental results; itsimply confirms that either method of correction can be employed, ac-cording to individual inclination.
Absorption corrections have also been studied by Green (1963) andDuncumb and Shields (1964), who have considered electron energy interms of the overvoltage (Es-Er) (where E6:probe voltage andEr<:crit ical excitation potential of the relevant radiation), rather thanin terms of ,Eo alone. Duncumb and Shields modified the Philibertabsorption factor by addition of an overvoltage correction, yielding agood fit with experimental data; the tables of Adler and Goldstein(1965) incorporating this correction were not available to the author at

482 K, L. WILLIAMS
the time of writing and accordingly are omitted from this compilation.
In cases where absorption corrections are of greater magnitude, the
effects of the overvoltage correction should be investigated.Green's data has l ikewise been neglected in the present work, largely
because of doubts concerning its applicability to targets whose mean
atomic number differs appreciably from that of the element being deter-
mined (Smith, 1965). Finally, the approach of Archard and Mulvey(1963) has also been omitted from consideration because the relativelycomplex calcuiations involved are not warranted by the small correc-
tions required.Smith (1965) reports unsatisfactory results when any of these methods
is applied to light elements in silicate matrices, but recommends the use
of either Birks' or Philibert's factors for elements higher than Si in thePeriodic Table. The present work supports this recommendation in the
case of sphalerites.
Fluorescence. Departures from linear weight-intensity relationships may
also arise in part from fluorescent enhancement of characteristic radia-
tion induced by the continuum or by characteristic X rays of adequateenergy produced by excitation of other elements in the matrix.
Green and Cosslett (1961) have given an expression for the calculationof the extent of continuum fluorescence; Smith (1965) has shown thatthis expression reduces conveniently to
P - r0?((Z)Zo')- '
where P is the ratio of direct to indirect production, (Z) is the mean
atomic number of the target, and Za is the atomic number of the elementbeing determined. Table 3 lists P-values calculated from this expressionfor Zn, Fe and Mn targets, and for a sphalerite of typical compositionlin all cases continuum fluorescence contributes less than 8 percent of the
total yield and, more importantly, there is little difference between sam-ples and standards. This effect has accordingly been ignored in subse-quent calculations, although it may be of considerable significance in
other cases where atomic number separation between samples and stan-
dards is more extreme (in such cases it may be compensated by atomic
number corrections if these are made experimentally).Characteristic fluorescence arises when portion of the characteristic
spectrum of another matrix element has wavelengths shorter than theabsorption edge of the measured radiation. In the case of sphalerites,there are three possibilities which require investigation: (1) excitation
of FeK*, by ZnK., (2) excitation of MnK* by ZnK., and (3) excitation of
MnK" by FeKB.

ELFCTRON PROBE ANALYSIS OF SPHALERITE
feBrr 3. C.llculernl CoxrrNuulr Fr-uonrscrNcr YrrL-os
483
Element sought
Zn(Zno glFeo.osMno or)S
Fe(Zns eaFes 65Mn6 61)5
Mn(Zns eaFe6.s5Mn6.s1)S
Methods of correction for characteristic fluorescence have been pro-posed by Castaing (1951), Wittry (1957,1962), Birks (1961, 1963) andReed (1965). Castaing's formula is relatively diff icult to use (Wittry,1962), and Birks'correction is based empirically on data collected on aprobe having a different take-off angle from that used by the author, butdoes not incorporate an emergence angle factor. Accordingly the methodsof Wittry and Reed were selected for comparison.
Wittry expresses the fluorescent contribution in the form of a functionG, such that
I _ I ' . F [ x ]
ro ri F(i -f G
G itself is the product of subfactors G1, Gz, G3 and, if relevant, anoverall dilution multiplier (for systems of more than two elements). G1is a function of the difference in atomic numbers (2"-2") between theexciting (,4) and excited (B) elements, G2 of the ratio Ze/Zu and theconcentration of B, and Gs oI Ze. Wittry provides curves for the deter-mination of these factors.
Wittry's treatment is derived for the binary case, but a method for ex-tension to ternary systems is indicated. Sphalerites, however, are essen-tially four-element systems, so that a further extrapolation of Wittry'streatment is required. This involves some additional approximation,viz., the assumption of similar mass absorption coefficients of Fe, Mn andS for ZnK., of Zn,Fe and S for MnK", and of Zn,Mn and S for FeK".This assumption is not altogether unreasonable in the present case, butit may invalidate this procedure in other mineral systems. In such cases,calculations to allow for significant differences in mass absorption co-efficients become unduly complex, and Castaing's method may be moresuitable.
ZnZn
FeFe
MnMn
K. L. WILLIAMS
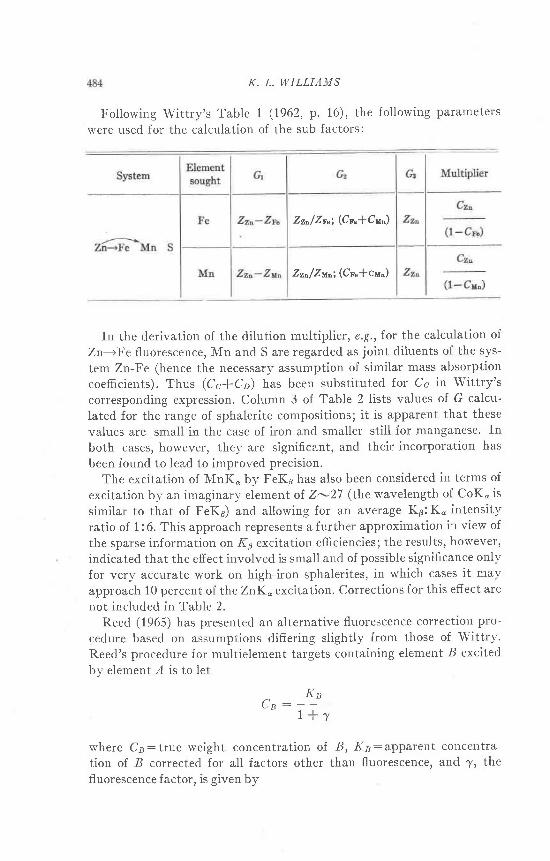
Following Wittry's Table 1 (1962, p. 16), the following parameters
were used for the calculation of the sub-factors:
In the derivation of the dilution multiplier, e.g.,for the calculation of
Zn--->Fe fluorescence, Mn and S are regarded as joint diluents of the sys-
tem Zn-Fe (hence the necessary assumption of similar mass absorption
coefficients). Thus (Cc*C2) has been substituted for Cc in Wittry's
corresponding expression. Column 3 of Table 2 lists values of G calcu-
lated for the range of sphalerite compositions; it is apparent that these
values are small in the case of iron and smaller still for manganese. In
both cases, however, they are significant, and their incorporation has
been found to lead to improved precision.The excitation of MnK" by FeKp has also been considered in terms of
excitation by an imaginary element ol Z-27 (the wavelength of CoK" is
similar to that of FeKB) and allowing for an average KBiK" intensity
ratio of 1:6. This approach represents a further approximation in view of
the sparse information on KB excitation efficiencies; the results, however,
indicated that the effect involved is small and of possible significance only
for very accurate work on high-iron sphalerites, in which cases it may
approach 10 percent of the ZnK* excitation. Corrections for this effect are
not included in Table 2.Reed (1965) has presented an alternative fluorescence correction pro-
cedure based on assumptions differing slightly from those of Wittry.Reed's procedure for multielement targets containing element B excited
by element ,4 is to let
^ K et n : , y ,
where Cz:true weight concentration of B, Ke:apparent concentra-
tion of B corrected for all factors other than fluorescence, and 7, thefluorescence factor, is given by
Zz^/Zr.; (Cp"*Cu")
Zzo/Zuo; (Cr"*cu")

ELI],CTRON PROBE ANALYSIS OF SPHALERITE
B
r : Ce-J@1.! ! - .1 [g( . ) + g0) ]PA
Ca is the weight concentration of element A. J(B), determined fromReed's tables, is a function of the element determined, the type of radia-tion (K or Z) measured and the type (K or L) of the exciting radiation.p!7 and pA ate mass absorption coefficients for element B and, the samplerespectivelyfor the exciting radiation of element A. D is a function of in-cident electron energy and of Ze-Ze (corresponding to Wittry's Gr).g(c) and g(y) are functions of the absorption parameters r and 1, where
: t l .cosec * i andPt PA
(the mass absorption coefficients being those of the target for the radia-tions indicated, and o being the eiectron mass absorption, or "Lenard,"coefficient. Values of o (after Philibert) and curves for the determinationof g(r) and g(1) are given by Reed.)
Values of (1f .y) for the range of sphalerite compositions are given inColumn 4 of Table 2. These are not directly comparable with Wittry'sG-values, but the relative effects of the two methods on the final correc-tion parameters are apparent from Table 5 below.
Calculation by Reed's method of the fluorescence of MnK* by FeKBgives very similar results to those obtained by Wittry's method, and con-firms that this is generally an insignificant source of potential error. Themore efficient excitation of MnK by FeK quantum energies is outweighedby the low concentration of Fe relative to Zn and by the lower Kp in-tensity.
"Atomi,c J{umber" Efects. Where samples and standards differ signifi-cantly in composition, differences in the depth distribution of electronenerg.v wil l also become significant, and it is necessary to correct furtherthe observed intensity ratios. The term "atomic number effects" is fre-quently used to describe these differences, although Smith (1965) haspointed out that atomic number is not the only variable involved, so thathe prefers the term "generation factor." Whatever the name employed,the effects remain at present imperfectly understood, and this has led toa variety of approaches to the derivation of the necessary correctionfactors.
Castaing (1951, 1963) introduced the concept of a-parameters associ-ated with each element, such that the true concentration Ce of element,4in a multielement target is derived from the intensity ratio fr by
2C;a;C t : k
dA
485

486 K. L, WILLIAMS
He suggested that appropriate values oI a; for a giaen system could be
determined experimentally by analysis of alloys of known composition
within that system. The assumption that a Iot a multielement target is a
Iinear combination of the a-parameters of the constituent elements is not
universally valid, but would appear to be reasonable for a given ac-
celerating voltage, for systems having a limited range of mean atomic
numbers. Phil ibert's (l+h) factor is based on a similar approximation.Poole and Thomas (1962) extended this treatment by further resolu-
tion of the factors inherent in a-parameters. Following Castaing (1960)
they showed that the distribution of excitation in depth is a function of
both target deceleration or stopping power S; and an electron backscatter
coefficient tr;, and that for fixed time counting,
ae : Sa\e
tr; is defined as the ratio between the intensity which would be emitted
if there were no backscattering and that which is actually emitted, and S;
is defined as -(68/02)/p. Values of S for various elements have been
calculated by Nelms (1956, 1958); using these and various experimen-
tally determined values of a for alloys of known composition, Poole and
Thomas calculated a series of empirical values of X;. Extrapolation of
these data allows calculation of a-parameters for other elements and s1's-
tems (within the l imits indicated above). Ziebold and Ogilvie (1963) pre-
sented a convenient curve relatin g a to Z , based on the data of Poole and
Thomas;strictly speaking this refers only to 30 keV electrons, but Poole
and Thomas suggest that the variation with electron energy of the S-fac-
tor at least is not pronounced when standard:sample intensity ratios are
considered, so that it would appear possible to use Ziebold and Ogilvie's
curve down to 20 keV.Variations of atomic number are not extreme when Fe, Mn and Zn are
determined in sphalerites using pure element standards, and this sug-
gested that the approaches of either Castaing or Poole and Thomas might
be used with reasonable success. Accordingly, a-parameters were de-
termined experimentally as follows: dzn was assigned an arbitrary value
of 1.33 (the value indicated by Ziebold and Ogilvie) and, from intensity
measurements (corrected for absorption) on Zn and ZnS, a correspond-
ing value of 1.56 was determined for as. This was used in turn to deter-
mine values of (1) 1.40 for ap", measured on pure Fe and FeS (troil i te),
and (2) 1.41 for dx11, I11€&SUred on pure Mn and MnS (low-iron alaban-
dite). These values are in reasonable agreement with those of l '52, L.40
and 1.42 respectively derived from Ziebold and Ogilvie's curve' thus
confirming that the latter may be used with reasonable success at least as
low as 20 keV.Using these a-parameters, a series of correction factors was then cal-

ELECTRON PROBE ANALYSIS OF SPHALERITE 487
culated for the range of sphalerite compositions, and these are given inColumn 5 of Table 21 correction factors calculated by the method ofPoole and Thomas from the data of Ziebold and Ogilvie are given inColumn 6.
The significance of this correction is demonstrated in Table 4, whichcompares the apparent composition of a typical sphalerite after correc-tion for absorption and fluorescence with that after further correctionfor atomic number effects (using the experimental parameters). Thesmall atomic number corrections for Fe and Mn are not surprising, sincethe mean atomic number of sphalerite lies, according to composition, be-tween 24.5 and 25.5, and the atomic numbers of iron and manganese are26 and 25 respectively. The effect on Zn (Z:30), however, is moremarked and indicates that evaluation of this factor is necessary evenwhen atomic number differences are not extreme.
Tarr,n 4. SrcNrnca,Ncn or "Arourc Nuuma" ConnncrroNs
ZnSFeSMnS
85 .97 . 80 . 8
94.5
91.27 . 90 . 8
99.9
1. After correction for instrumental factors, absorption and fluorescence,2. A|ter further correction for "atomic number" efiects.
The derivation of Poole and Thomas assumes that the ionization cross-section is independent of the overvoltage (Eo-Ex), but this is not alto-gether supported by experimental or theoretical data. Duncumb andShields (1963) and Green (1963) have considered the problem in terms ofpenetration, ionization and backscatter factors I this approach culminatedin the development by Long and Reed of an as yet unpublished (exceptby Smith's reference) formula whereby the counting rate for a given tar-get is multiplied by the factor
{s.ro + rn [ (Eo +
rvhere the angle brackets 0 indicate weighted means, qld R:Green'sbackscatter coeffi cient.
Smith (1965) empirically modified this expression to
/ Z \E*)/21- tn (z)l
" hi x R-r
/ Z \
" \;/ x R-lt + . t + o.9 ln (Ep - Ex) - ln (zs l

488 K, L, WILLIAMS
suggesting that the new value for this first factor gave better results forlight elements in silicate matrices. The author understands (J. V. P.Long, pers. comm.) that Long and Reed have since recommended a fur-ther modification of the first factor to 4.54, to be used in conjunctionwith their original form of the second overvoltage factor, rather than themodification suggested by Smith.
In Column 7 of Table 2 are listed values of the correction parameters(relative to those oJ pure element standard.s) calculated from Smith's ex-pression; the form in which these and the other atomic number correctionparameters are expressed requires them to be diuided' into the intensityratios after the latter have been corrected for absorption and fluorescence,using the method of successive approximation where necessary. Agree-ment with the corrections calculated from the experimental data or bythe methods of Poole and Thomas is reasonably good. The largest dis-crepancy is found in the case of Mn; a correction parameter close to unitl 'would be expected if atomic number considerations alone were involved,and this is confirmed by the experimental measurements. Factors calcu-lated from the data of Poole and Thomas are of the order of 1 to 2 percenthigher, possibly because this data is appropriate for 30 keV electrons. Onthe other hand, the Long and Reed/Smith parameters are 3 to 4 percentiowerl examination of the calculations shows that this difference stemsfrom the significance ol the (Z/A) factor in Smith's expression. Z/A doesnot vary smoothly throughout the Periodic Table, and in this particularcase a fortuitously significant difference appears between Z/A |or Mnand (Z/ A) for sphalerite, even though there is l i tt le difference in (Z). It isapparent, however, that these discrepancies are of very small magnitudein terms of uncertainties inherent in other aspects of the correction pro-cedures. Indeed, the agreement observed is sufficiently encouraging tosupport the use of mathematical corrections in cases where more complexcompositions preclude the experimental approach.
Couposrrn Connrcrrow Facrons
Smith (1965) has foreshadowed the development, over the next fewyears, of linear correction formulae which may be applied to the electronprobe analysis of various groups of rock-forming minerals, avoiding (in
the groups for which formulae are available) the necessity for tediouscalculations for each analysis. With the development of such a formulafor sphalerite in mind, the extent of variation between different combina-tions of the procedures described above has been examined.
It is obvious from Table 2 that the choice between the absorption cor-rection procedures of Birks and Phil ibert is of no great significance in thiscase; for convenience correction factors calculated from the data of Birks

ELECTRON PROBE ANALYSIS OF SPIIALERITE
have been used in the calculations discussed below, but other analystshave preferred Phil ibert's approach.
The extent of discrepancies arising frorn the choice between the twofluorescence and three atomic number correction procedures outl inedabove can be examined conveniently by calculating final correction pa-rameters based on various combinations of these procedures. For each
Tesr,r 5. EquarroNs lon Cer,cur,error or Coanlruro ConnncrroN Facrons
Correction Method
Correction FactorlAbsorption Fluorescence "Atomic Number"
489
A. Iron:
BirksBirksBirksBirksBirksBirks
B. Monganese:
BirksBirksBirksBirksBirksBirks
C. Zi.nc:
BirksBirksBirks
WittryReedWittryReedWittryReed
WittryReedWittryReedWittryReed
ExperimentalExperimentalPoole and ThomasPoole and ThomasLong and Reed/SmithLong and Reed/Smith
ExperimentalExperimentalPoole and ThomasPoole and ThomasLong and Reed/SmithLong and Reed/Smith
ExperimentalPoole and ThomasLong and Reed/Smith
0. 939+0. 0020x+0. 0025Y.933+ .0018X+ .0017Y.929+ .0020X+ .0025Y.923+ .0018X+ .0017Y.94n+ .0022X+ .O024Y.934+ .0091X+ .0016Y
0. 979+0. 0015X+0. 0014Y.975+ .0011X+ .0012Y.964+ .0015X+ .0014Y.958+ .0011X+ .0014Y
1.015+ .0016X+ .0016Y1.010+ .0013x+ .0013Y
1.061+ .0009x+ .0006Y1.0s0+ .0009x+ .0006Yr-064+ .001lx+ .0006Y
I X:weight percent FeS; Y:weight percent MnS
possible combination, combined correction parameters can be calculatedfor a range of sphalerite compositions. Equations expressing the variationof the final correction parameter with composition have been derived inthis fashion, and the results are given in Table 5;it was assumed that thecorrection parameter is a l inear function of both Fe and Mn content overthe relatively limited compositional range involved, and the equationswere computed from the calculated data by standard mathematical pro-cedures.
It is evident from Table 5 that discrepancies between the various com-binations are remarkably slight, particularly when their effects on the

K. L. WILLIAMS
relatively small contents of iron and manganese are considered' In prac-
tice satisfactory results are achieved by using the following simplified ex-
pressions to derive factors by which observed intensity ratios can be
multiplied (after correction for dead-time, background and drift) to cor-
rect for matrix errors:
Iron : Correction factor:0.94+0.002(X + Y)Manganese: Correction factor:0.97+0.002(X+ y)
Zinc: Correction factor: 1.06+0.001(X+ Y)
where X: weight percent FeS and 1: weight percent MnS.
It is difficult to evaluate the accuracy of these expressions and/or the
experimental technique in the absence of a suffi.ciently wide range of
homogeneous analyzed sphalerites. However, 50 analyses of sphalerites
apparently ranging from 0 to 15.0 percent FeS and from 0 to 1.3 percent
MnS yielded analysis totals ranging from 95.6 to 104.2 percent, with a
mean of 99.7 percent and a standard deviation of 2.1 percent of the mean.
These results are regarded as satisfactory, since the analyses were per-
formed on a routine basis with no particular emphasis placed on the
avoidance, for example, of fluorescence efiects from adjacent grains of
T.q.srE 6. Rupr.rcnrn Annrvsrs-SprrALERTrE 233(a) (T.L.E. MrNr, ZanneN, Tes.)
Point I:
FeSMnSZnS
Point II:
FeSMnSZnS
Point III:
FeSMnSZnS
101 .0
4/2/6s 3/3/6s
5 . 2 5 . 40 . 9 0 . 9
94.0 n.d,
16/6/6s
0 . 993.6
t/ro/6s
0 . 8n.d.
100. 1 9 9 . 8
6 . 6I . J
9 2 . 9
6 . 90 . 9n .d .
6 . 70 . 8
9 1 . 8
6 . 90 . 8n.d.
3 . 90 . 5n.d.
3 90 . 5n.d.
99.3
J . '
0 . 595.4
3 . 90 . 4
9 5 . 2
99. s99.6
]JLDCTRON PROB|J ANALYSIS OF SPHALERITE
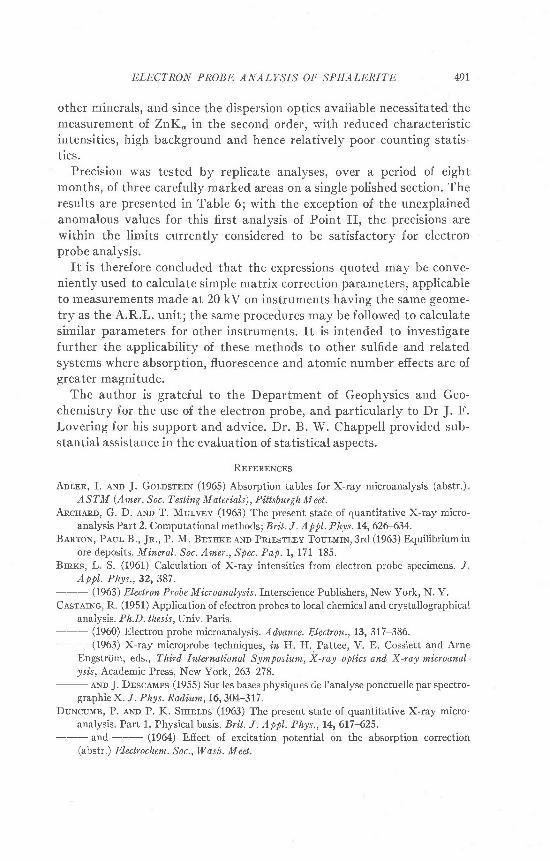
other minerals, and since the dispersion optics available necessitated themeasurement of ZnK. in the second order, with reduced characteristicintensities, high background and hence relatively poor counting statis-tics.
Precision was tested by replicate analyses, over a period of eightmonths, of three carefully marked areas on a single polished section. Theresults are presented in Table 6; with the exception of the unexplainedanomalous values for this first analysis of Point II, the precisions arewithin the limits currently considered to be satisfactory for electronprobe analysis.
It is therefore concluded that the expressions quoted may be conve-niently used to calculate simple matrix correction parameters, applicableto measurements made aL 20 kV on instruments having the same geome-try as the A.R.L. unit; the same procedures may be followed to calculatesimilar parameters for other instiuments. It is intended to investigatefurther the applicability of these methods to other sulfide and relatedsystems where absorption, fluorescence and atomic number effects are ofgreater magnitude.
The author is grateful to the Department of Geophysics and Geo-chemistry for the use of the electron probe, and particularly to Dr J. F.Lovering for his support and advice. Dr. B. W. Chappell provided sub-stantial assistance in the evaluation of statistical aspects.
Rnrrnnqcus
Aor.nn, I. ello J. GorosruN (1965) Absorption tables for X-ray microanalysis (abstr.)
A S T M (A m er . S o c. T e st i,n g M at er ial,s), P itt sbur gh M ebt.Ancraro, G. D. ,q,Nr T. Mulvrv (1963) The present state of quantitative X-ray micro-
analysis Part 2. Computational methods; Bri.t. L Appl. Phys. 14,626-634.Ban:ror, Paur- B., Jn., P. M. Bnrmr eNo Pnrnsrrnv Tour-urN,3rd (1963) Equilibrium in
ore deposits. MineroJ. Soc. Amer., Spec. Pap.l, 171-185.Brnrs, L S. (1961) Calculation of X-ray intensities from electron probe specimens. .I.
Appl,. Phys., 32, 387.--- (1963) El,ectron Probe Microanalysis.Interscience Publishers, New York, N. Y.CasrarNc, R. (1951) Application of eiectron probes to local chemical and crystallographical
analysis. Ph.D. thesis, Univ. Paris.--- (1960) Electron probe microanalysis. Adaance. Electron.,13, 317-386.- (1963) X-ray microprobe techniques, in H. H.,Pattee, V. E. Cosslett and Arne
Engstrdm, ed,s., Tltird. International Symposium, X-ray opti,cs anil X-ray microanal-ysas, Academic Press, New York,263-278.
- AND J. Dnscaws (1955) Sur les bases physiques de l'analyse ponctuelle par spectro-graphie X. f . P hys. Rad.ium, 16, 304-317.
DuNcuul, P. aNo P. K. Srnnr,ns (1963) The present state of quantitative X-ray micro-analysis. Part 1. Physicalbasis. Brit. J. Appl,. Phys.,14, 617-625.
--- and -- (1964) Efiect of excitation potential on the absorption correction(abstr.) El,ectrochem. S oc., W ash. M eet.
491
492 K, L. WILLIAMS
GnroN, M. (1963) The target absorption correction, inH.H. Pattee, V. E. Cosslett and
Arne Engstriim eds.; Th.i,rd Inlernationol Symposium, X-ray optics and X-ray micro'
analysis, Academic Press, New York, 361-377.GnnrN, H. .lNn V. E. Cossr-mr (1961) The efficiency of production of characteristic X-
radiat ioninth icktargetsofapureelement. Proc.Phys.Soc.(Lond'on)78,1206-1214Hnrunrcn, K.F.J. (1964) X-ray absorption uncertainty (abstr) Fleetrochem. Soc,Woslt'
Meet.Nnr.us, Awn T (1956, 1958) Energy loss and range of electrons and positrons. Nat. Bur.
Stond. (U .S .) Circ. 577 and Suppl.Poor.n, D. M ,rNo P. M. Tnouas (1962) Quantitative electron probe microanalysis. -/.
Inst. M etals, 90, 228-233.
Pnrr- lntt, J. (1963) A method of calculating the absorption correction in electron probe
microanalysis, inH H. Pattee, V. E. Cosslett and Arne Engstr6m eds.; Th.ird Inter'
nationoJ Symposiurn, X-ray opties and, X-ray microanolysis. Academic Press, New
York,379-392.Rnro, S. J. B. (1964) Characteristic fluorescence corrections in electron-probe microanaly-
sis. Brit. I. Appl. Phys.,16,913-926.Surrn, J. V. (1965) X-ray emission microanalysis of rock-forming minerals. I. Experimental
techniques. J. GeoI ,73, 830-864.Wrr-rreus, K. L. (1965) Determination of the iron content of sphalerite Econ. Geol' , 60,
174Vt747.Wtrrnv, D. B. (1957) An electron probe for local analysis by means of X-rays Ph.D.
thesis. Calif. Inst. Tech.-- (1962) Fluorescence by characteristic radiation in electron probe microanalysis
U.S.C.E.C. Rep. 84-204.Zrneor;n, T. O..tno R. E. Ocrr,vra (1963) Quantitative analysis with the electron micro-
analyzer. A nal. Chem., 35, 6, 621-627 .
M anus cript r eceir d., M ay 2 3, 1 9 66 ; aec epted J o r publication, J uly 2 3, I I 6 6.