the american freshman: national norms fall 2009...isbn 978-1-878477-49-1 (e-book, expanded edition)...
TRANSCRIPT

The American Freshman:National Norms Fall 2009
John H. Pryor Sylvia Hurtado Linda DeAngelo Laura Palucki Blake Serge Tran
Expanded Edition

The American Freshman:National Norms Fall 2009
Prepared by the Staff of theCooperative Institutional Research Program
John H. PryorSylvia HurtadoLinda DeAngeloLaura Palucki BlakeSerge Tran
Higher Education Research InstituteGraduate School of Education & Information StudiesUniversity of California, Los Angeles
Distributed in association with University of California PressBerkeley, Los Angeles, London 2009
Higher Education Research InstituteUniversity of California, Los Angeles
Sylvia Hurtado, Professor and Director
HERI Affiliated ScholarsWalter R. Allen, Allan Murray Cartter Professor ofHigher EducationAlexander W. Astin, Founding Director and Senior ScholarHelen S. Astin, Senior ScholarMitchell J. Chang, ProfessorPatricia M. McDonough, ProfessorJosé Luis Santos, Assistant ProfessorLinda J. Sax, Associate ProfessorRick Wagoner, Assistant ProfessorVictor B. Sáenz, Assistant Professor, University of Texas at Austin
The Higher Education Research Institute (HERI) is based in the Graduate School ofEducation & Information Studies at the Universityof California, Los Angeles. The Institute serves asan interdisciplinary center for research, evaluation,information, policy studies, and research training inpost-secondary education.
CIRP Advisory Committee
Betsy O. BarefootCo-Director and Senior ScholarPolicy Center on the First Year of CollegeVictor M. H. BordenAssociate Vice President and ProfessorIndiana UniversityC. Anthony BrohConsultantBroh Consulting ServicesMark L. GuntyAssistant Director of Institutional ResearchUniversity of Notre DameKurt J. KepplerVice President for Student AffairsValdosta State UniversityDavid Shulenburger Vice President for Academic AffairsNational Association of State Universities and Land Grant CollegesSylvia HurtadoProfessor and Director, HERI(ex-officio)John H. PryorDirector, CIRP(ex-officio)
3005 Moore Hall/Mailbox 951521, Los Angeles, CA 90095-1521www.heri.ucla.edu 310-825-1925
ACKNOWLEDGEMENTS: Cover design by Escott & Associates. Page layout and text design by The Oak Co. The authors wish to thank Kimberly R. Kelly, Colleen Quinn and Melissa Aragon for their assistance in the preparation of this book.
Published by the Higher Education Research Institute.Distributed in association with University of California Press, Berkeley, Los Angeles, London 2009Suggested citation:
Pryor, J. H., Hurtado, S., DeAngelo, L., Palucki Blake, L., & Tran, S. (2009). The American freshman: National norms fall 2009. Los Angeles: Higher Education Research Institute, UCLA.
To purchase additional copies of this monograph, please visit www.heri.ucla.edu or www.ucpress.eduAn e-book edition with expanded tables is also available.Copyright © 2009By the Regents of the University of CaliforniaISBN 978-1-878477-47-7 (paperback)ISBN 978-1-878477-49-1 (e-book, expanded edition)

This report is dedicated to the memory of Eric Lee Dey, Professor at the University of Virginia and formerly the University of Michigan.Alexander Astin, the founder of CIRP, appointed Eric as the first personto succeed him as director of CIRP. Eric also served as associate director ofHERI from 1991–93. He advanced survey research in higher educationthroughout his career, and published numerous articles using CIRP data.We are grateful for his contributions to HERI and to the field of highereducation.
iii


CONTENTS
Introduction 1
The American Freshman: National Norms Fall 2009 5
Financial Concerns Dominate 6
Post-Election Changes in Political Orientation, Political Engagement, and Political Views 8
Predispositions for Personal and Social Responsibility: Interconnections between Volunteerism, Perspective-Taking, and Values 10
More Students Taking AP Classes and Exams, Racial/Ethnic Group Differences Still Evident 13
Special Tutoring or Remedial Work 14
Veterans Entering as First-Time, Full-Time Incoming Students 15
Summary 16
References 17
The 2009 National Norms
Full-Time, First-Time Freshmen by Institution TypeAll Respondents 19Male Respondents 43Female Respondents 67
Full-Time, First-Time Freshmen by Institution Type and SelectivityPublic/Private Universities and Nonsectarian 4-year Colleges 91Public, Catholic, and Other Religious 4-year Colleges 115
Appendix A: Research Methodology 139
Appendix B: The 2009 CIRP Freshman Survey Instrument 147
Appendix C: Institutions Participating in the 2009 Freshman Survey 153
Appendix D: The Precision of the Normative Data and Their Comparisons 163
About the Authors 167
v


Recent years have seen a resurgence of interest in accountability and assessment in highereducation on a broad scale. Myriad forces havecombined to bring us here, including calls fromthe federal government, state governments,education associations and watchdogs, as well asparents and students. With the cost of highereducation increasing, and the means to pay for it decreasing, many have called for evidence that colleges and universities have an impact ontheir students. The Cooperative InstitutionalResearch Program (CIRP) was founded over 40 years ago to assess the impact of college ontwo levels. First, to assist participating institu-tions at the local level by providing them withthe answers to the latest questions about studentsand college impact through participation in theCIRP surveys. Secondly, by combining theresults in a national representation of differenttypes of colleges, we at the Higher EducationResearch Institute (HERI) provide bench-marking data to institutions. We also use the datain monographs, publications, and presentationsthat further the knowledge base about collegestudents and college impact at the national level.As always, we remain committed to our missionof fostering institutional improvement andinforming educational policy.
Colleges and universities that have collectedlongitudinal data using CIRP surveys—combining and matching the CIRP FreshmanSurvey data with subsequent data from the Your First College Year Survey and the College
1
INTRODUCTION
With the cost of higher education
increasing, and the means to pay for
it decreasing, many have called for
evidence that colleges and universities
have an impact on their students.
Senior Survey—have found themselves in a goodplace to answer questions about institutionaleffectiveness. Data from the HERI FacultySurvey adds another perspective to what weknow about the experiences and work life offaculty at our institutions.
A number of important studies using CIRP datawere published this year, and here we highlightonly a few (more can be found on the HERIwebsite at www.heri.ucla.edu). Denson andChang (2009) used CIRP Freshman Survey andCollege Senior Survey (CSS) data to examineracial diversity on campus, replicating findingsthat indicate that students who participate inclasses and workshops that examine diversityshow higher levels of academic skills, self-efficacy,and racial-cultural engagement. They alsodemonstrated on an institutional level thatstudents on campuses with high levels of partici-pation in such activities showed increases inthese outcomes, regardless of their own personal

involvement. That the effects of such efforts oncampus are so far reaching is encouraging tothose working in the field to address inequity,especially when segments of the populationprove hard to engage in such programs.
2
A centerpiece of our mission
is providing valuable and
actionable information to
participating institutions.
Park (2009) showed that satisfaction with diver-sity on campus was influenced not only by thedemographic make-up of the institution, butalso satisfaction with campus climate andstudent attitudes towards issues such as affirma-tive action and racial discrimination. Sinceprevious research using CIRP data (Astin, 1993)indicates a link between student satisfaction andretention, this is an important area for institu-tions to be aware of in their retention efforts.
DeAngelo (2009) portrayed the myriad ways inwhich an institution can impact a student’sdesire to pursue a PhD. Although previousCIRP research has indicated the importance ofinteracting with faculty in influencing PhD aspi-rations, this study underscored the importanceof faculty encouragement for graduate studyspecifically in the desire to pursue the PhD,which was even more important than the actualexperience of conducting research with a facultymember. DeAngelo’s paper is a must read forinstitutions wishing to increase their ability toencourage students to pursue the PhD.
In a look at methodological issues, DeAngeloand Tran (2009) illustrated the high correlationbetween self-reported and actual SAT scores bymatching CIRP Freshman Survey data and SATdata obtained directly from the College Board.
CIRP is continually improving. This includesrevising our survey instruments as we furtherrefine what we discover is important about thecollege experience and student outcomes. These last few years we have placed an increasedemphasis on multiple outcomes measures,expanded the already large range of college experiences we measure, and crafted new questions that allow us to measure the under-lying constructs of the surveys with greaterprecision.
Because a centerpiece of our mission is providingvaluable and actionable information to partici-pating institutions, we have also made extensiveadditions to the reports that help campusesspend more time discussing results. This startedwith the addition of PowerPoint executivesummaries of institutional data, which weremade available several years ago, to the mostrecent additions of significance testing andgraphical depictions of results.
We would occasionally hear from institutionsthat there was so much information in the CIRPsurveys that it was sometimes overwhelming. To assist in processing the information we haverolled out two significant additions to standardreports. These include CIRP Constructs andCIRP Themes. The CIRP Themes organizeresults around a theme such as academic preparation, diversity, civic engagement, andacademic enhancement experiences. The CIRPConstructs go one step further by combining the results of multiple questions that measure a

common underlying experience or outcome intoone scale. To determine these broad underlyingareas more precisely, we use Item ResponseTheory (IRT) to combine individual surveyitems into global measures that capture theseareas. For the first time this monograph and thereports for our participating institutions containresults on several of these constructs.
It is a challenging time to be in higher educa-tion, as this year’s findings concerning theimpact of the economy on incoming first-yearstudents illustrate. We encourage you to fullyexplore the results discussed in this monographand the many other publications using CIRPdata to assist in our joint quest to improvehigher education.
3
John H. PryorDirector
Cooperative Institutional Research Program
Sylvia HurtadoDirector
Higher Education Research Institute


THE AMERICAN FRESHMAN:NATIONAL NORMS FALL 2009
5
Economic concerns are at the forefront of the first-year student experience in 2009, reflecting the
impact of the global economic downturn. The CIRP Freshman Survey documents both immediate
effects, in terms of students’ choice and funding for college, and portends long-term effects, such as
major/career selection and changes in life goals. In recent years we have seen increases in political
engagement, social agency, and civic engagement
(Pryor, Hurtado, DeAngelo, Sharkness, Romero,
Korn, and Tran, 2008). The impact of socio-
historical factors such as the economy, the
election of President Obama, and the President’s
call to service, will be important to follow in
future first-year cohorts as well as with the CIRP
follow-up surveys (the Your First College Year
Survey and the College Senior Survey) that will help determine whether there are lasting effects on this
generation of students.
The results in this monograph are based upon data from 219,864 first-time, full-time first-year
students at 297 four-year colleges and universities of varying levels of selectivity and type in the
United States. These data have been statistically adjusted to reflect the responses of the 1.4 million
first-time full-time first-year students entering 1,555 four-year colleges and universities across the
country in 2009. This means that differences of one percentage point reflect the characteristics,
behavior, or attitudes of roughly 14,000 students nationally. This is the 44th consecutive year of the
CIRP Freshman Survey. Collectively, the CIRP surveys contain data on over 15 million students over
that time span.
Economic concerns are at the forefront
of the first-year student experience in
2009, reflecting the impact of the
global economic downturn.

Financial Concerns DominateToday more incoming first-year students areconcerned with their ability to finance theircollege education, with two out of three studentsreporting “some” (55.4%) or “major” (11.3%)concerns. Although the percentage with “major”concerns did not change appreciably from 2008, those with “some” concerns moved up 2.2 percentage points and continued to climb toits highest level since 1971. In practical terms,since last year roughly 30,000 more studentsnow have some concern that they will not beable to finance their college education.
Most students (78.2%) still plan on fundingtheir first year of college through family resources(such as parents), a figure that has been fairlystable since 2001, when we revised the responsecategories for this set of questions (see Figure 1).In our 2008 monograph we reported that morestudents were looking towards using their ownresources from working and personal savings andin aid that need not be repaid, such as grants
(Pryor et al., 2008). We also reported that thepercentage of first-year students taking out loansto pay for college in 2008 had not moved appre-ciably. As the economic downturn expanded in2009 the percentage of first-year students usingfunds from sources that need not be repaidcontinued to climb (now at 70.0%, the highestin this nine-year period). We now also find,however, that incoming students are more likelyto turn to loans, with 53.3% reporting usingloans, up 3.9 percentage points from 49.4% in2008 and at the highest point in this nine-yearperiod. Most of these loans were in the range of $3,000 to $6,000, according to responses onthe survey. Recent data from The Project onStudent Debt at The Institute for College Access& Success reveals that average debt for gradu-ating seniors in 2008 was $23,200, up from$18,650 in 2004, a figure that is rising annuallyby about 6% (Reed & Cheng, 2009). Thismeans a greater debt burden upon graduation.Although in our study the overall figure of thosein 2009 using aid that need not be repaid inched
up only slightly (from 69.3% in2008 to 70.0% in 2009), morestudents are receiving grants forhigher amounts. Those who reportreceiving aid of $10,000 or moremoved from 24.1% in 2008 to26.1% in 2009.
While the need seems to be greater,getting a job to help pay collegeexpenses was about as likely thisyear (49.3%) as last year (49.4%).This might reflect a pragmatic, oreven a hopeful view of employ-ment, as fewer students had jobs as high-school seniors in 2009(62.8%) than their peers last year(66.4%) or in 2007 (69.3%). Thislikely is a reflection of the state of
6
20
30
40
50
60
70
80
90
100
2001 2002 2003 2004 2005 2006 2007 2008 2009
% o
f St
ud
ents
Family ResourcesAid Which Does Not Need to be RepaidOwn ResourcesAid Which Needs to be Repaid
Figure 1. Trends in How Students are Paying for College

employment in the United Statesfor youth. The US Bureau ofLabor Statistics corroborates thisfinding, reporting that the youthlabor force employment rate forJuly 2009 was 4.6 percentagepoints down from the samemonth in 2008 (to 51.4% from56.0%) (US Bureau of LaborStatistics, 2009).
Students were not unique inhaving difficulty finding jobs.More parents of incoming first-year studentswere unemployed in 2009 (see Figure 2). Fourand a half percent of students reported that theirfathers were unemployed, this is higher than atany other time in the 44-year history of theCIRP Freshman Survey. In addition, 7.9% of students reported that their mothers wereunemployed, the highest percentage since 1979.As might be expected, parental employmentstatus is related to the level of concern aboutfinancing college. Students with both parentsemployed comprise 83.5% of the population,and are the least likely to have major concerns, at9.8%. Students who have two parents but onlyone is employed (10.0% of the population in thesurvey), are more likely to have major concerns,at 17.9%. In one-parent families in which thatparent is employed (5.2% of the population in the survey), 15.5% of students had majorconcerns and when that parent is unemployed(0.5% of the population in the survey) thepercentage climbs to 27.9%. In two-parentfamilies in which both parents are unemployed(0.8% of the population in the survey), concernsabout financing college climb further to 33.0%with major concerns about financing college.
In this economic downturn fewer incomingfirst-year students plan to major in or seek a
career in business. Potential business majorsdropped from 16.8% in 2008 to 14.4% in2009, the lowest level seen for this category in 35 years. Business career aspirations alsodropped from 14.1% in 2008 to 12.1% in2009. This now puts business career aspirationsat an all-time low going back to 1976.
College choice continues to be influenced by the economy. Last year saw all-time highs in theimportance of cost and financial aid, and thosetrends continued this year, breaking all suchrecords (see Figure 3). “The cost of attendingthis college” was a “very important” factor indetermining where to attend for 41.6% ofstudents, the highest it has ever been since thisquestion was added to the survey. An offer offinancial aid was a “very important” determiningfactor for 44.7% of incoming college students
7
0
5
10
15
20
1976 1979 1982 1985 1988 1991 1994 1997 2000 2003 2006 2009
% o
f Pa
ren
tal U
nem
plo
ymen
t
Unemployed MotherUnemployed Father
Figure 2. Trends in Parental Unemployment Among Freshman Students
Students were not unique in having
difficulty finding jobs. More parents
of incoming first-year students
were unemployed in 2009.

in 2009, up from 43.0% in 2008 and 39.4% in2007. Not being offered aid by their first choicewas a “very important” reason for choosing theircurrent college for 8.9% of incoming first-years,and the highest this figure has been since thequestion was first asked in 1984. Given the risingamount of debt burden, it is not surprising thatthe “graduates get good jobs” reason for choosinga college increased in importance in 2009 to56.5%, the highest level seen since this questionwas introduced in 1983. With the job outlookfor recent graduates diminishing, however,colleges will need to be able to deal with increas-ingly anxious students and monitor how suchanxieties impact college experiences that mayaffect retention and degree attainment.
Post-Election Changes in Political Orientation, PoliticalEngagement, and Political ViewsAlthough a drop in the percentage of first-yearstudents identifying as liberal might at first seemlike a reaction to President Obama’s first year in
office, it actually follows apattern seen in CIRP FreshmanSurvey data since PresidentCarter was elected in 1976. As we reported last year (Pryor,et al., 2008), the 2008 first-yearclass contained the highestpercentage of liberals since1973, at 31.0%. In 2009, thisdropped two percentage pointsto 29.0%, returning to pre- election levels (29.3% in 2007).Following a political partychange in the White House,regardless of the political partyin the White House, in the nextyear there is a slight drop in the
percentage of liberal students and a slight increasein the percentage of conservative students (see Figure 4). The exception to this rule is forGeorge W. Bush in 2001, when the percentagesof liberal students increased (up 2.1 percentagepoints) and conservative students remained fairlystable (a change of 0.2 percentage points) in theyear following the election.
Fewer first-year students in 2009 are discussingpolitics “frequently” than their counterpartswere just one year ago. This year, 33.1% of first-year students reported discussing politics“frequently” during the last year, a drop of 2.5 percentage points from 35.6% in 2008. This slight drop in the year following the elec-tion of a new president is consistent with dropsin discussing politics one year after a new presi-dential administration takes office in all years inwhich this question was asked on the freshmansurvey. Again, the exception to this rule is in2001, in which we would have expected adecrease following an election year. In 2001 thepercentage discussing politics “frequently” was
8
0
10
20
30
40
50
60
70
80
90
100
1976 19791973 1982 1985 1988 1991 1994 1997 2000 2003 2006 2009
% o
f St
ud
ents
Academic ReputationGraduates Get Good JobsOffered Financial AssistanceCost of CollegeNot Offered Aid by 1st Choice
Figure 3. Trends in Reasons Influencing Students’ Decision to Attend their Chosen Institution
(% indicating “Very Important”)

up from 16.4% in 2000 to 20.9%, an increase of 4.5 percentage points.These changes were likelydue somewhat in part to the September 11th attacks(since a good number ofschools administered theCIRP Freshman Surveybefore September 11th, the effect of the attacks islimited in the 2001 data).
The percentage of first-yearstudents reporting thatkeeping up to date with political affairs is “veryimportant” or “essential” dropped also this yearto 36.0% from 39.5% in 2008. This drop isconsistent with drops in this personal goalamong first-year students in the year after theelection of a new president going back toPresident Reagan, but again we see an exceptionin the year after the 2000 election. In 2001 thepercentage of students reporting that keeping upto date with political affairs was “very impor-tant” or “essential” grew to 31.4% from 28.1%rather than declined.
The percentage indicating that helping to promoteracial understanding was “very important” or“essential” also dropped this year, perhaps as aresult of the historic election of our first AfricanAmerican president. In 2008, just prior toelecting President Obama, 37.3% of incomingfirst-year students indicated that helping topromote racial understanding was personally“very important” or “essential” compared to33.1% in 2009, a drop of 4.2 percentage points.Drops were seen across all racial groups.
The drop in the importance of helping topromote racial understanding, however, must
9
27.526.3
21.019.2
27.4 26.624.8
26.9
31.029.0
16.4 16.919.0
21.519.5
22.1
18.9 19.120.7
21.8
0
5
10
15
20
25
30
35
40
1976Carter
1977 1980Reagan
1981 1992Clinton
1993 2000Bush
2001 2008Obama
2009
% o
f St
ud
ents
LiberalConservative
Figure 4. Trends in Political Orientation in the Year After a Presidential Election When the Party in the White House Changes
be taken in context of the other items in thissection of the survey on personal goals andvalues, many of which showed correspondingdrops. Developing a meaningful philosophy oflife dropped 3.4 percentage points. Influencingsocial values dropped 2.6 percentage points. The top goal for the second year in a row isbeing well off financially, at 78.1%, the highestthis figure has been since first asked in 1966.The importance of raising a family is now thesecond-most-prevalent goal, at 74.7%. Thus,perhaps in a reaction to the economic downturn,in some students there is focusing inwardtowards achieving financial security and a corre-sponding drop in goals more in line with socialagency. Colleges and universities with missionsfocused on increasing students’ social valuesaccustomed to record numbers of studentsembracing those personal goals will likely needto also address the concerns that students haveabout their own economic situation. As we willsee in the next section, there are actions thatcampuses can take that can move studentstowards higher degrees of social agency andenable them to develop perspective-taking skills.

Predispositions for Personal and SocialResponsibility: Interconnectionsbetween Volunteerism, Perspective-Taking, and ValuesA renewed emphasis on personal and socialresponsibility is one of the hallmarks of the earlytwenty-first century. This renewal is evident in efforts such as calls to engage and renewcommunity that came in response to the scholar-ship about the impending crisis emanating fromthe decline in community life in the UnitedStates (Putnam, 2000), to calls to service in thewake of events such as Hurricane Katrina, andto the expansion of national service programssuch as AmeriCorps and Learn and ServeAmerica. In higher education, these efforts havebeen matched by a new recognition of theimportance of developing personal and socialresponsibility among students as a core goal of a college education. In 2004, the Associationof American Colleges and Universities articu-lated five dimensions of personal and socialresponsibility for college students: Striving forExcellence, Cultivating Personal and AcademicIntegrity, Contributing to a Larger Community,
Taking Seriously the Perspectives of Others, andDeveloping Competence in Ethical and MoralReasoning (AAC&U, 2004). In this section we report on first-year college student predispo-sitions related to two of these dimensions—contributing to a larger community, or socialagency, and taking seriously the perspectives ofothers, or pluralistic orientation.
Volunteerism is central to developing a commit-ment to contribute to the larger community.This year, a record number of incoming first-year students expect to participate in communityservice or volunteer work during college, with30.8% indicating that there is a “very goodchance” they plan to engage civically in thismanner. An additional 41.3% of freshmen in2009 indicate that there is “some chance” theywill volunteer during college, and less than
10 percent (6.3%) stated they haveno intention of volunteering whilethey are in college. When this question was introduced to theCIRP Freshman Survey in 1990,only 16.9% of students indicatedthat there was a “very good chance”they would engage in volunteer orcommunity service work duringcollege, an increase of 82.2% injust under 20 years (see Figure 5).Though this rise has been steadysince the early 90s, increases in thisexpectation picked up steam in theend of this decade, rising 27.8%just since 2004.
10
10
5
0
15
20
25
30
35
40
1994 19971991 2000 2003 20092006
% o
f St
ud
ents
Participate in Volunteer orCommunity Service Work inCollege “Very Good Chance”
Figure 5. Trends in the Expectation for Doing Volunteer or Community Service Work in College
A record number of incoming
first-year students expect to
participate in community service
or volunteer work during college.

Volunteer participation inhigh school predisposesstudents to volunteering andcommunity service while incollege. As shown in Table 1,as the frequency of volun-teering in the year prior tocollege increases so does the expectation forvolunteering and community service in college.Most students who volunteered “frequently” intheir last year of high school (56.9%) indicatedthat there was a “very good chance” they wouldcontinue volunteering in college. Of thosestudents who did not volunteer in high schoolonly a very small minority, 8.2%, expect tovolunteer in college. Further, very few students(1.7%) who previously volunteered “frequently”reverse this trend and have no expectation thatthey will continue in college, whereas one out offive students (20.9%) who did not volunteerpreviously expects that they will continue in thisfashion. Evidence also indicates that studentswho expect to volunteer in college actually dovolunteer. Results from anationally representativesample of students at the endof the first year of collegeshow that among studentsthat indicate that there is a“very good chance” they willvolunteer in college, 79.8%actually do so within the firstyear of college (DeAngelo,Hurtado, & Pryor, forth-coming). As high-schoolseniors, 85.3% of incomingfirst-year students volun-teered “frequently” or“occasionally,” the highestpercentage since this ques-tion was asked in 1984.
Volunteering is also connected to social agencyvalues among first-year students. A CIRPConstruct formed from six items on the survey,Social Agency, measures the extent to whichstudents’ value political and social involvementin their community as a personal goal (see page 146 for the items used to create this andother CIRP Constructs). As shown in Figure 6,first-years who have volunteered or participatedin community service as part of class in the yearprior to starting college are much more likely tobegin college with a high score on Social Agencyvalues than those who have not had these experi-ences. In addition, as the frequency of serviceincreases from “not at all” to “occasionally” to “frequently” so does the likelihood that a
11
Table 1. Expectation for Volunteering or Community Service Work in College by Participation in Volunteer Work in High School (percentages)
Expectation for Volunteering/ Frequency of Volunteering in High School
Community Service Work Not at All Occasionally Frequently
No Chance 20.9 4.9 1.7
Very Little Chance 40.2 24.2 8.0
Some Chance 30.8 48.5 33.4
Very Good Chance 8.2 22.3 56.9
21.5
28.2
43.4
15.3
23.9
41.1
8.211.6
23.6
49.4
0
5
10
15
20
25
30
35
40
45
50
Not at All
Performed Community Service as Part of Class
During Senior Yearof High School
Performed Volunteer Work During Senior Year
of High School
FrequentlyOccasionally Not at All FrequentlyOccasionally Very LittleChance
Very GoodChance
No Chance
Expectation for Participating in Volunteer or Community Service
Work in College
SomeChance
% o
f St
ud
ents
Figure 6. Social Agency, by Volunteer/Community Service in High School and the Expectation of Service in College
(% of Students in High Social Agency Score Group)

student will begin college with a stronger incli-nation toward social agency. For instance,among first-year students who reported that they “frequently” participated in communityservice as part of a class during the year prior to starting college, 43.4% score high on SocialAgency, as compared to 28.2% of students who“occasionally” reported this activity, and 21.5%of students who did not report this activity.Further, regardless of service in high school,those who expect to engage in communityservice or volunteer work in college are muchmore likely to be committed to social agencythan those without this expectation. Among
incoming first-years that report that there is a“very good chance” they will volunteer in collegea near majority (49.4%) score high on SocialAgency as compared to 11.6% of students whoindicate that there is “very little chance,” and amere 8.2% of students who indicate that there is“no chance” they will volunteer or do commu-nity service work during college.
In addition to developing a commitment to thelarger community, volunteer and communityservice work also predisposes students to take the perspectives of others seriously, especiallywhen the commitment to volunteerism is strong.As shown in Figure 7, incoming students whohave volunteered in high school or expect tovolunteer in college have a stronger pluralisticorientation than students without these experi-ences and expectations. A CIRP Constructformed from five self-ratings variables on thesurvey, Pluralistic Orientation measures the skillsand dispositions for living and working in adiverse society (see page 146 for the individual
items that make up theCIRP Constructs). Amongstudents who volunteered“frequently” in highschool or performed incommunity service as partof a class on a frequentbasis a much higherpercentage have a highPluralistic Orientationscore (36.0% and 36.3%,respectively) than dostudents who did theseactivities “occasionally”(24.4% and 26.1%,respectively) or “not at all”(23.1% and 25.4%,respectively). The same
12
0
5
10
15
20
25
30
35
40
45
50
Not at All
Performed Community Service as Part of Class
During Senior Yearof High School
Performed Volunteer Work During Senior Year
of High School
FrequentlyOccasionally Not at All FrequentlyOccasionally Very LittleChance
Very GoodChance
No Chance
Expectation for Participating in Volunteer or Community Service
Work in College
SomeChance
% o
f St
ud
ents
25.4 26.1
36.3
21.324.4
36.0
22.120.3
24.7
37.6
Figure 7. Pluralistic Orientation, by Volunteer/Community Service Work in High School and the Expectation of Service in College
(% of Students in High Pluralistic Orientation Score Group)
Incoming students who have
volunteered in high school or
expect to volunteer in college have
a stronger pluralistic orientation
than students without these
experiences and expectations.

pattern is evident among those who expect to dovolunteer or community service work in college.Among students who indicate that there is a“very good chance” they will volunteer incollege, 37.6% begin college with a high scoreon Pluralistic Orientation as compared to only24.7% of those who indicate there is “somechance,” 20.3% of those who indicate there is“very little chance,” and 22.1% of those whoindicate there is “no chance” they will volunteeror engage in community service work.
Thus despite the fact that we see slight decreasesin the values and beliefs that contribute to socialagency, institutions that wish to increase suchvalues in their students know that the high desir-ability for community service and volunteeringamong incoming students, once achieved, canbring these levels up during college, potentiallyameliorating the overarching economic concernsof students.
More Students Taking AP Classes andExams, Racial/Ethnic Group DifferencesStill EvidentSince 2006 there have been slight increases inthe number of incoming first-year students whoreport taking Advance Placement (AP) classesand exams in high school. Today more than
two-thirds (67.9%) of all first-time, full-timeentering students report taking at least one APcourse in high school. While fewer studentsfollow through to take AP examinations, thepercentage taking at least one exam went upalmost 10 percentage points from slightly overhalf, 50.9%, to 60.3% in the last five years.
Despite these increases, we continue to seedifferences between racial/ethnic groups in APexperiences (see Table 2). Opportunities in highschools often determine if students gain access toAP courses. While only 5.4% of entering first-year students at four-year institutions reportedattending a school where no AP courses wereoffered, this percentage was much higher amongAmerican Indian (9.1%) and African American(6.8%) students compared with White (5.3%)and Hispanic (3.6%) students. Hispanic students(at 54.3%) compare very favorably relative toother groups who report taking between 1 to 4AP classes in high school (49.9% for White,50.0% for multiracial students, 45.3% forAfrican American students, and a low of 39.1%for American Indian students). However, AsianAmerican students are more than twice as likely to take between 5 to 9 AP courses in highschool compared to White students (33.8% and15.4%, respectively). Asian American students
13
Table 2. Number of AP Courses Taken in High School, by Race and Ethnicity(percentages)
Not offered at Race/Ethnicity my High School None 1 to 4 5 to 9 10 to 14
American Indian 9.1 41.0 39.1 9.2 0.8
Asian 5.8 11.0 42.5 33.8 6.4
Black 6.8 39.2 45.3 7.6 0.8
Hispanic 3.6 21.0 54.3 18.9 1.9
White 5.3 27.8 49.9 15.4 1.5
Multi-Racial 4.9 24.8 50.0 17.8 2.0
Other 7.8 24.7 47.6 17.1 2.5

are also four times more likely (6.4%) to reporttaking between 10 to 14 AP courses in highschool compared with White students (1.5%).This pattern by race/ethnicity is similar for APexam-taking, albeit with lower percentages.
Special Tutoring or Remedial WorkThere has been a steady rise in the percentage ofcollege students entering four-year institutionswho report that they have had remedial work orspecial tutoring in high school in English,reading, math, social studies, science, andforeign languages. In fact, reported remedialwork in high school by incoming collegestudents is at the highest levels ever reported in the survey (with the one exception of socialstudies which reaches a similar high percentagein 1980). Students are most likely to report thatthey had remedial work in math and least likelyin social studies. Looking across all categories,approximately one in five students (21.2%)entering a four-year college as a first-year studenttoday has had special tutoring or remedial workin high school. And, almost twice as many(38.7%) believe that they will need specialtutoring or remedial work in college.
There are some distinct gaps between havinghad tutoring or remedial work in the past andthe perception of needing it during college (seeTable 3). As might be predicted given the largenumbers having had such work in high school,the subject area with the largest perceived needfor remediation is mathematics. Although nearlyone quarter (24.4%) feel they will need specialtutoring or remediation in mathematics, only14.5% indicated they had received specialtutoring or done remedial work in the past.Similar gaps exist between expecting to needspecial tutoring or remedial work and havinghad some in the past for science (12.3% vs.6.1%), writing (11.9% vs. 5.8%), and foreignlanguage (11.3% vs. 5.9%). Two subject areasshowing decreases in needing special tutoring orremediation are reading (6.5% vs. 5.0%) andsocial studies (4.5% vs. 3.9%). Disparities arealso evident when we look at tutoring and reme-dial work by gender. Women are more likely toindicate they expect to need special tutoring orremediation than men in mathematics (29.2%vs. 18.8%) and science (15.1% vs. 8.9%). Men were more likely to indicate they needspecial tutoring or remediation in English(10.2% vs. 8.5%).
14
Table 3. Special Tutoring or Remedial Work in High School and College by High School Core Subject Areas (percentages)
Had Special Tutoring or Need Special Tutoring or Subject Area Remedial Work in High School Remedial Work in College
English 7.2 9.2
Reading 6.5 5.0
Mathematics 14.5 24.4
Social Studies 4.5 3.9
Science 6.1 12.3
Foreign Language 5.9 11.3
Writing 5.8 11.9
One or More Subjects 21.2 38.7

Veterans Entering as First-Time, Full-Time Incoming StudentsIn 2009, given the renewed influx of veterans tocollege, we reintroduced the veteran status itemon the CIRP Freshman Survey. This allows bothHERI and the individual institutions using thesurvey to compare veterans entering college withnon-veterans, as well as prepare for longitudinalstudies that can examine the veteran studentexperience. Most of our schools, 202, reportedhaving at least one entering first-year studentwho was a military veteran, comprising a total of 595 students reporting veteran status in thisyear’s freshman norms.
Almost two-thirds of the veterans, 60.3%, weremen. As we would expect, veterans tend to beolder compared to their classmates, and as aresult, fewer planned to live in college residencehalls compared with students entering thesesame 202 colleges (59.9% versus 79.0%).Although a similar proportion plan to live withfamily or other relatives (13.0% vs. 14.5%), theyare much more likely to be living in a privatehome, apartment, or room (18.9% vs. 2.8%) or other type of campus housing (5.0% vs.2.9%) compared to other students.
In terms of academic preparation,Figure 8 shows that veterans tend toreport receiving significantly lowerhigh-school grades than otherstudents entering the same colleges.For example, at the high end of thegrade continuum, other students aretwice more likely (23.1%) to reportreceiving A or A+ grades thanveterans (11.5%). At the lower endof the continuum, only 4.6% ofstudents reported receiving a C+ orless in high school compared with19.8% of veterans.
In a similar pattern as seen with the lower highschool grades, more than half of veterans(57.6%) did not take AP classes (see Table 4).This was because either they were not offered at their high school (9.0%) or because they didnot take any (48.6%) for some other reason.
This is compared with 5.3% (not offered) and27.0% (not taken) among other students.Under standably, lower high school grades mayhave prevented students from enrolling inadvanced course work. At the same time,veterans reported a need for special tutoring orremedial work in mathematics (35.8%) andwriting (20.7%) at higher levels than otherstudents at the same colleges (24.3% for math,11.6% for writing). This pattern is important
15
11.5
15.6
19.4
22.4
11.3 10.5
7.0
2.3
23.125.5
21.219.2
6.5
3.31.2
0.10
5
10
15
20
25
30
35
40
A or A+ A- B+ B B- C+ C D
% o
f St
ud
ents
VeteransAll Other Students
Figure 8. Average High School Grades, by Veterans and All Other Students Entering the Same Colleges
Veterans are more likely to
rate themselves higher on
leadership ability.

in that most of the veterans have not been in aclassroom context (as evidenced by responses onthe survey) recently.
A smaller percentage of veterans are in the highscore group on the Academic Self-Concept CIRPConstruct (21.0% vs. 25.9% for all otherstudents), but a much higher percentage ofveterans are in the high score group on the SocialSelf-Concept CIRP Construct (43.6% vs. 29.6%)(see page 146 for a list of the items that comprisethe CIRP Constructs). In particular, veterans are more likely to rate themselves higher onleadership ability. Though this is the case, fewer veterans expect that there is a “very goodchance” that they will become involved instudent clubs or groups (34.6% vs. 45.9%) ordiscuss course content with students outside ofclass (37.1% vs. 46.1%). It will be important for campuses to introduce veterans to both theacademic and social milieu in college, engagingthem socially and assisting them in meeting theiracademic goals.
SummaryThe global economic downturn is having animpact on the characteristics, attitudes, andbeliefs of incoming first-time students at four-year institutions. They are more concernedabout finances, more likely to take out loans andneed grants in higher amounts. They will likelybe graduating with higher debts and have shiftedmajors and career aspirations away from businessfields. Although the values of these studentscoming into college show a slight retrenchingtowards financial security and less towards socialagency, there is hope that their increased desirefor volunteering and community service willfoster an increase in such attitudes during theircollege careers.
Although more first-year students are taking AP classes and exams, we also see an increase instudents who feel that they will need specialtutoring or remedial work in college. Disparityin the opportunities to take AP classes in highschool persists among American Indian andAfrican American students. At the same time thatcolleges and universities need to accommodate
16
Table 4. Veterans Compared to Students at the Same Colleges (percentages)
Survey Item Veterans Other Students
AP Courses taken during high schoolNot offered at my HS 9.0 5.3None taken 48.6 27.0
Will need special tutoring or remedial work in:Mathematics 35.8 24.3Writing 20.7 11.6
CIRP Constructs “High Score Group”Academic Self-Concept 21.0 24.9Social Self-Concept 43.6 29.6
Self-Ratings: “Highest 10%” or “Above Average”Leadership ability 72.2 62.2
“Very Good Chance” that I will:Participate in student clubs/groups 34.6 45.9Discuss course content with students outside of class 37.1 46.1

such a wide range of abilities, from more remediation to more incoming students placinginto higher level courses, they are under tremen-dous financial burdens. These burdens oftenlead more towards cuts in course offerings ratherthan expansions, and have potential to leadtowards disappointment and frustration amongboth faculty and students.
The influx of veterans into colleges and universi-ties indicates perhaps a need for special servicesin today’s colleges and universities. They aremore likely to report a need for special tutoring
and remediation, and their academic self-concept is lower. Although veteran studentswould benefit from increased involvement in thecollege community, they will need encourage-ment from student affairs personnel and facultyin order to increase their likelihood of success incollege. As these students move through collegeit will be important to continue to monitor theirbehaviors, attitudes, and beliefs if we are tosuccessfully intervene to ensure that their collegeexperience allows them to attain their academicgoals.
17
References
Association of American Colleges and Universities (AAC&U). (2004). Taking responsibility for thequality of the baccalaureate degree. Washington, DC: Association of American Colleges andUniversities.
Astin, A. W. (1993). What matters in college?: Four critical years revisited. San Francisco: Jossey-Bass.
DeAngelo, L. (2009). PhD Aspirations: The effect of grades, academic self-confidence, faculty encourage-ment and research on undergraduates. Paper presented at the annual meeting of the AmericanEducational Research Association, San Diego, CA.
DeAngelo, L., Hurtado, S., & Pryor, J. H. (2010, forthcoming). Your first college year: National normsfor the 2008 YFCY survey. Los Angeles: Higher Education Research Institute, UCLA.
DeAngelo, L., & Tran, S. (2009). Relying on self-reported SAT scores in college impact studies: Issues ofaccuracy and implications. Paper presented at the annual meeting of the Association for the Study ofHigher Education, Vancouver, BC.
Denson, N., & Chang, M. J. (2009). Racial diversity matters: The impact of diversity-related studentengagement and institutional context. American Educational Research Journal, 46(2), 322–353.
Park, J. J. (2009). Are we satisfied?: A look at students satisfaction with diversity at traditionally whiteinstitutions. The Review of Higher Education, 32(3), 291–320.
Pryor, J. H., Hurtado, S., DeAngelo, L., Sharkness, J., Romero, L. C., Korn, W. S., & Tran, S.(2008). The American freshman: National norms fall 2008. Los Angeles: Higher Education ResearchInstitute, UCLA.

Putnam, R. D. (2000). Bowling alone: The collapse and revival of American community. New York:Simon & Schuster.
Reed, M., & Cheng, D. (2009). Student debt and the class of 2008. http://projectonstudentdebt.org/files/pub/classof2008.pdf accessed on December 16, 2009.
US Bureau of Labor Statistics. (2009). Employment and unemployment among youth summary.Economic News Release, www.bls.gov/news.release/youth.nr0.htm accessed on December 15, 2009.
18

2009 National Norms
FirstTime FullTime FreshmenMen and Women


First-time, Full-time Freshmen 219,864 120,900 98,964 42,939 77,961 30,456 19,955 27,550 62,216 36,748 5,490 2,340 3,150 How old will you be on December 31 of this year?
17 or younger 1.7 1.7 1.8 1.7 1.6 1.6 1.9 1.6 1.7 2.0 2.5 1.9 3.318 68.0 68.2 67.6 70.0 65.8 66.7 69.6 63.1 67.2 69.2 68.4 65.4 72.819 28.7 28.0 29.8 26.2 30.4 29.2 27.3 33.3 30.3 27.9 25.9 28.5 22.020 or older 1.6 2.0 0.8 2.0 2.1 2.5 1.2 2.0 0.8 0.9 3.3 4.2 1.8
Is English your native language?Yes 91.6 93.2 89.1 92.8 93.7 92.2 92.6 95.8 89.3 88.6 98.5 98.7 98.2No 8.4 6.8 10.9 7.2 6.3 7.8 7.4 4.2 10.7 11.4 1.5 1.3 1.8
In what year did you graduate from high school?2009 98.0 97.4 99.0 97.3 97.6 97.0 98.8 97.6 99.1 98.7 96.0 94.6 98.02008 1.3 1.6 0.7 1.6 1.6 2.1 0.8 1.6 0.6 1.0 2.4 3.1 1.32007 or earlier 0.5 0.7 0.2 0.8 0.6 0.8 0.4 0.5 0.3 0.2 1.3 1.8 0.5Passed G.E.D./Never completed high school 0.1 0.2 0.0 0.3 0.2 0.1 0.1 0.3 0.0 0.0 0.4 0.4 0.3
How many miles is this college from yourpermanent home?
5 or less 4.8 6.1 2.8 7.1 4.7 3.8 7.2 4.3 2.8 2.9 6.0 5.9 6.36 to 10 6.0 7.6 3.4 9.3 5.5 4.6 9.5 4.4 3.2 3.8 6.0 5.1 7.511 to 50 24.4 26.9 20.5 30.9 21.5 19.1 30.9 19.4 22.1 14.4 14.1 15.0 12.951 to 100 17.8 17.6 18.2 18.2 16.8 15.2 17.4 18.2 20.4 9.8 14.9 17.7 10.8101 to 500 33.0 27.9 40.8 25.4 31.2 29.4 26.1 35.5 42.2 35.6 33.9 38.8 26.7Over 500 14.1 14.0 14.3 9.1 20.4 27.9 8.9 18.1 9.2 33.5 25.0 17.7 35.8
What was your average grade in high school?A or A+ 22.6 17.4 30.6 14.7 20.9 20.4 18.6 22.6 27.3 43.0 9.5 7.2 12.8A- 25.5 22.3 30.4 21.1 23.8 24.9 24.4 22.4 29.9 32.6 11.3 9.3 14.2B+ 21.5 22.8 19.5 23.7 21.6 22.4 23.8 19.7 20.7 14.8 20.4 19.1 22.4B 19.5 22.8 14.5 25.2 19.5 19.5 21.8 18.6 16.4 7.5 21.6 21.6 21.7B- 6.5 8.5 3.3 9.2 7.7 7.3 6.8 8.5 3.7 1.5 15.2 17.0 12.7C+ 3.2 4.5 1.2 4.5 4.5 3.9 3.4 5.5 1.4 0.5 15.1 17.8 11.1C 1.2 1.7 0.5 1.6 1.9 1.6 1.1 2.7 0.5 0.2 6.5 7.6 4.9D 0.1 0.1 0.0 0.1 0.1 0.1 0.0 0.1 0.0 0.0 0.4 0.3 0.4
From what kind of high school did you graduate?Public school (not charter or magnet) 78.2 78.2 78.1 83.5 71.2 71.0 62.6 75.7 82.5 61.2 78.4 84.3 69.8Public charter school 1.8 2.1 1.2 2.4 1.7 1.8 1.9 1.5 1.2 1.1 5.2 4.6 6.1Public magnet school 3.1 2.8 3.5 2.8 2.9 3.5 2.0 2.6 3.3 3.9 8.0 6.8 9.9Private religious/parochial school 10.5 10.4 10.7 7.8 13.8 10.2 25.5 12.0 8.7 18.3 5.6 3.0 9.4Private independent college-prep school 5.9 5.7 6.3 3.0 9.3 12.9 7.6 6.3 3.9 15.3 2.6 1.3 4.7Home school 0.6 0.8 0.3 0.6 1.1 0.6 0.5 1.9 0.3 0.3 0.1 0.0 0.2
Prior to this term, have you ever taken courses forcredit at this institution?
No 95.9 95.7 96.3 95.7 95.7 95.4 95.2 96.2 96.4 96.1 92.2 94.3 89.2Yes 4.1 4.3 3.7 4.3 4.3 4.6 4.8 3.8 3.6 3.9 7.8 5.7 10.8
Since leaving high school, have you ever takencourses, whether for credit or not for credit, atany other institution (university, 4- or 2-yearcollege, technical, vocational, or business school)?
No 89.1 89.6 88.2 89.9 89.2 89.6 89.6 88.5 88.0 89.1 86.8 88.4 84.4Yes 10.9 10.4 11.8 10.1 10.8 10.4 10.4 11.5 12.0 10.9 13.2 11.6 15.6
21
2009 CIRP Freshman SurveyWeighted National Norms—All Respondents
Baccalaureate Black CollegesAll Bacc Institutions 4-year Colleges Universities and Universities
Institutions 4-yr Coll Universities Public Private Nonsec Catholic Oth Relig Public Private All HBCU Public Private

Where do you plan to live during the fall term?With my family or other relatives 14.2 19.2 6.5 25.5 10.7 10.4 17.8 7.5 6.6 6.0 9.3 7.4 12.0Other private home, apartment, or room 2.8 2.6 3.2 3.4 1.5 2.3 1.1 0.8 3.9 0.4 2.9 3.0 2.7College residence hall 79.5 75.0 86.4 66.8 85.9 85.1 79.8 89.7 84.8 92.2 84.0 85.2 82.2Fraternity or sorority house 0.5 0.1 1.1 0.1 0.2 0.4 0.0 0.1 1.4 0.1 0.0 0.0 0.0Other campus student housing 2.7 2.8 2.6 3.8 1.5 1.6 1.1 1.7 2.9 1.2 3.3 3.6 2.7Other 0.3 0.3 0.3 0.4 0.2 0.2 0.1 0.3 0.3 0.1 0.6 0.8 0.3
To how many colleges other than this one did youapply for admission this year?
None 14.1 14.5 13.3 16.0 12.6 12.5 9.3 14.3 14.6 8.4 9.1 9.9 7.8One 10.5 11.1 9.7 12.4 9.4 8.4 7.6 11.3 10.7 5.9 7.3 7.5 6.8Two 13.3 14.3 11.8 15.9 12.3 10.8 10.7 14.6 12.9 7.3 12.8 13.5 11.8Three 15.7 17.2 13.5 18.3 15.8 14.5 15.3 17.4 14.5 9.5 18.7 19.1 18.1Four 13.3 14.1 12.0 14.2 13.9 13.4 14.9 14.0 12.5 10.3 17.4 17.9 16.7Five 9.9 9.9 10.0 9.3 10.7 11.0 12.1 9.6 9.9 10.5 12.7 12.9 12.4Six 7.1 6.4 8.3 5.3 7.7 8.2 9.7 6.3 7.8 10.4 7.5 6.7 8.6Seven to ten 12.6 9.9 16.9 7.2 13.5 16.0 16.0 9.7 14.2 27.2 10.2 9.0 12.1Eleven or more 3.3 2.5 4.5 1.4 4.1 5.2 4.3 2.8 3.0 10.5 4.3 3.4 5.7
Were you accepted by your first choice college?Yes 79.2 81.7 75.3 81.8 81.6 80.0 80.9 83.7 76.8 69.6 78.0 78.4 77.4No 20.8 18.3 24.7 18.2 18.4 20.0 19.1 16.3 23.2 30.4 22.0 21.6 22.6
Is this college your:First choice? 60.7 60.6 60.8 59.7 61.8 63.1 58.5 62.0 61.3 59.1 43.8 41.0 48.0Second choice? 25.9 27.0 24.3 28.2 25.3 25.3 28.5 23.7 24.3 24.2 31.5 33.8 28.3Third choice? 8.7 8.3 9.2 8.3 8.4 7.7 9.0 8.9 8.9 10.3 15.1 15.8 14.1Less than third choice? 4.7 4.1 5.7 3.8 4.5 3.8 4.0 5.4 5.5 6.4 9.5 9.4 9.6
Citizenship status:U.S. citizen 96.5 97.1 95.7 97.8 96.2 94.3 97.7 97.4 96.3 93.5 99.0 99.3 98.5Permanent resident (green card) 2.0 1.5 2.7 1.6 1.3 1.7 1.5 0.8 2.6 2.8 0.5 0.3 0.8Neither 1.5 1.4 1.6 0.6 2.5 4.0 0.8 1.8 1.1 3.7 0.5 0.4 0.7
Are you a veteran?No 99.7 99.6 99.8 99.5 99.6 99.7 99.7 99.6 99.8 99.8 99.0 99.0 99.1Yes 0.3 0.4 0.2 0.5 0.4 0.3 0.3 0.4 0.2 0.2 1.0 1.0 0.9
Are your parents:Both alive and living with each other? 70.2 67.1 75.0 65.5 69.2 69.8 70.3 68.1 73.9 78.9 32.3 30.0 35.5Both alive, divorced or living apart? 26.1 28.8 21.8 30.3 26.8 26.5 25.7 27.5 22.8 18.1 59.7 61.6 57.0One or both deceased? 3.8 4.1 3.2 4.2 4.0 3.7 3.9 4.4 3.2 2.9 8.0 8.4 7.5
Have you had any special tutoring or remedialwork in any of the following subjects?
English 7.2 7.9 6.2 7.6 8.3 8.7 8.1 8.1 6.3 6.0 13.6 14.8 12.0Reading 6.5 7.2 5.4 7.0 7.5 7.6 7.5 7.3 5.6 4.9 13.4 14.6 11.6Mathematics 14.5 16.1 12.0 15.3 17.3 18.4 17.7 15.8 11.8 12.6 16.5 16.0 17.3Social Studies 4.5 5.0 3.8 4.9 5.1 4.9 5.1 5.4 4.0 3.3 11.3 12.4 9.6Science 6.1 6.7 5.4 6.1 7.4 7.7 7.0 7.2 5.3 5.8 10.6 11.2 9.6Foreign Language 5.9 6.5 5.1 6.0 7.0 7.1 6.9 6.9 5.1 5.1 9.8 10.1 9.3Writing 5.8 6.4 5.0 6.1 6.7 7.1 6.4 6.5 5.0 5.1 10.3 11.2 8.9
2009 CIRP Freshman SurveyWeighted National Norms—All Respondents
Baccalaureate Black Colleges All Bacc Institutions 4-year Colleges Universities and Universities
Institutions 4-yr Coll Universities Public Private Nonsec Catholic Oth Relig Public Private All HBCU Public Private
22

Do you feel you will need any special tutoring orremedial work in any of the following subjects?
English 9.2 10.3 7.6 10.6 10.0 10.1 8.5 10.6 8.1 5.6 16.8 19.8 12.3Reading 5.0 5.4 4.4 5.6 5.2 5.3 4.9 5.1 4.6 3.5 10.0 12.6 6.2Mathematics 24.4 27.1 20.3 28.7 24.9 22.8 26.1 26.6 21.8 14.4 44.0 46.1 41.0Social Studies 3.9 4.5 3.0 4.7 4.2 3.7 3.7 5.0 3.2 2.3 10.6 12.1 8.5Science 12.3 12.9 11.4 13.0 12.7 11.0 14.1 13.9 12.0 9.1 22.3 23.5 20.6Foreign Language 11.3 12.7 9.2 12.4 13.2 11.3 12.8 15.4 9.3 8.5 23.9 22.9 25.4Writing 11.9 13.2 9.9 12.8 13.7 14.4 12.0 13.7 10.2 8.6 20.3 22.8 16.5
How many Advanced Placement courses did youtake in high school?
Not offered at my high school 5.4 5.9 4.6 4.8 7.2 7.2 5.2 8.2 4.3 5.6 8.3 8.4 8.1None 26.7 33.7 16.2 35.5 31.3 28.5 34.9 32.4 18.3 8.1 43.1 46.8 37.71 to 4 49.2 49.2 49.3 49.9 48.3 48.0 50.5 47.4 50.9 43.2 42.2 39.7 45.95 to 9 16.6 10.2 26.2 8.8 12.0 14.7 8.8 10.7 23.5 36.8 5.0 3.5 7.210 to 14 1.9 0.8 3.4 0.7 1.0 1.3 0.5 1.0 2.8 5.8 0.9 1.0 0.715+ 0.2 0.2 0.3 0.2 0.2 0.3 0.1 0.2 0.2 0.5 0.6 0.6 0.4
How many Advanced Placement exams did youtake in high school?
Not offered at my high school 5.7 6.4 4.7 5.4 7.6 7.3 5.5 9.0 4.7 4.9 9.6 10.0 9.0None 34.0 42.1 22.2 44.5 38.9 35.2 43.2 40.8 25.0 12.1 51.8 55.7 46.21 to 4 44.7 43.1 47.1 43.1 43.0 44.0 44.1 41.3 47.6 45.1 34.1 30.9 38.65 to 9 14.0 7.9 23.1 6.5 9.7 12.5 6.7 8.2 20.5 32.7 3.6 2.4 5.210 to 14 1.4 0.5 2.7 0.4 0.7 0.9 0.3 0.6 2.2 4.8 0.5 0.5 0.615+ 0.1 0.1 0.2 0.1 0.2 0.2 0.1 0.1 0.1 0.3 0.5 0.5 0.3
What is the highest academic degree that youintend to obtain?—Highest Planned
None 0.8 1.1 0.5 1.0 1.1 1.2 1.0 1.2 0.6 0.4 2.1 2.2 1.9Vocational certificate 0.1 0.1 0.1 0.1 0.2 0.2 0.2 0.2 0.1 0.1 0.2 0.2 0.1Associate (A.A. or equivalent) 0.5 0.6 0.3 0.6 0.7 0.6 0.5 0.8 0.3 0.2 0.7 0.7 0.7Bachelor’s degree (B.A., B.S., etc.) 22.1 24.5 18.6 26.1 22.4 22.5 19.3 23.9 20.5 11.7 12.7 16.0 8.0Master’s degree (M.A., M.S., etc.) 42.4 43.5 40.7 45.2 41.3 41.0 44.0 40.2 41.6 37.4 34.3 39.3 27.0Ph.D. or Ed.D. 18.2 17.2 19.8 16.1 18.5 19.1 17.5 18.5 19.4 21.4 28.5 25.4 33.1M.D., D.O., D.D.S., or D.V.M. 9.8 7.4 13.4 6.2 9.0 8.3 11.0 8.7 12.3 17.7 11.3 7.2 17.2J.D. (Law) 4.5 3.8 5.4 3.1 4.8 5.2 4.8 4.3 4.2 9.8 6.7 5.1 9.1B.D. or M.DIV. (Divinity) 0.3 0.3 0.2 0.3 0.4 0.2 0.2 0.6 0.2 0.2 0.8 0.7 0.8Other 1.3 1.4 1.0 1.3 1.6 1.6 1.5 1.6 0.9 1.3 2.7 3.3 2.0
2009 CIRP Freshman SurveyWeighted National Norms—All Respondents
Baccalaureate Black Colleges All Bacc Institutions 4-year Colleges Universities and Universities
Institutions 4-yr Coll Universities Public Private Nonsec Catholic Oth Relig Public Private All HBCU Public Private
23

What is the highest academic degree that youintend to obtain?—Highest Planned at This College
None 1.2 1.6 0.7 1.9 1.3 1.0 1.1 1.7 0.7 0.5 3.1 3.8 2.1Vocational certificate 0.2 0.2 0.1 0.2 0.2 0.1 0.2 0.3 0.1 0.1 0.4 0.6 0.2Associate (A.A. or equivalent) 1.9 2.5 1.0 2.8 2.3 2.0 2.0 2.6 1.0 0.8 2.6 2.5 2.7Bachelor’s degree (B.A., B.S., etc.) 69.4 72.0 65.7 69.7 75.0 76.5 67.1 77.1 64.7 68.9 65.2 59.5 72.8Master’s degree (M.A., M.S., etc.) 20.2 18.7 22.5 20.7 16.1 15.7 22.6 13.5 23.6 18.8 17.9 22.8 11.2Ph.D. or Ed.D. 3.4 2.5 4.7 2.4 2.6 2.4 4.0 2.2 4.8 4.0 5.8 5.9 5.8M.D., D.O., D.D.S., or D.V.M. 1.8 0.7 3.4 0.7 0.7 0.5 1.3 0.6 3.2 3.9 1.7 1.2 2.3J.D. (Law) 0.7 0.4 1.1 0.3 0.5 0.5 0.4 0.5 0.8 2.0 1.1 1.3 0.8B.D. or M.DIV. (Divinity) 0.1 0.1 0.1 0.1 0.1 0.1 0.1 0.2 0.1 0.2 0.5 0.6 0.3Other 1.1 1.2 0.9 1.1 1.3 1.3 1.2 1.3 0.8 0.9 1.8 1.9 1.7
How would you describe the racial composition ofthe high school you last attended?
Completely non-White 3.4 3.6 2.9 4.0 3.2 3.0 3.6 3.2 3.0 2.7 18.6 18.8 18.3Mostly non-White 12.6 12.7 12.6 13.9 11.0 10.7 10.8 11.4 13.3 10.1 35.5 37.6 32.5Roughly half non-White 24.4 25.4 22.8 26.6 23.8 23.1 20.4 26.1 23.0 22.2 25.8 26.1 25.4Mostly White 52.2 51.2 53.8 48.9 54.3 55.5 57.2 51.7 52.8 57.6 18.2 15.9 21.7Completely White 7.4 7.1 7.8 6.6 7.7 7.7 8.1 7.6 7.9 7.4 1.8 1.6 2.1
How would you describe the racial composition ofthe neighborhood where you grew up?
Completely non-White 5.9 6.7 4.8 7.0 6.3 5.8 6.4 6.7 4.8 4.6 31.6 32.7 29.9Mostly non-White 11.2 11.5 10.8 12.3 10.5 10.1 10.8 10.7 11.1 9.6 32.1 31.8 32.6Roughly half non-White 13.7 14.1 13.0 14.8 13.1 13.0 12.7 13.3 13.0 13.1 19.3 20.0 18.4Mostly White 49.8 48.7 51.6 48.2 49.3 50.1 49.0 48.7 50.7 55.3 14.3 13.1 16.1Completely White 19.3 19.1 19.7 17.8 20.9 21.1 21.2 20.6 20.3 17.4 2.7 2.5 3.0
HOW MUCH OF YOUR FIRST YEAR’S EDUCATIONALEXPENSES (ROOM, BOARD, TUITION, AND FEES) DO YOU EXPECT TO COVER FROM:Family resources (parents, relatives, spouse, etc.)
None 21.8 25.1 16.6 29.3 19.6 18.8 19.5 20.5 17.9 11.7 38.4 43.1 31.6Less than $1,000 11.2 12.7 9.0 14.0 10.9 9.1 11.0 12.7 9.9 5.6 21.4 22.8 19.3$1,000–$2,999 13.0 14.1 11.2 15.3 12.6 10.8 13.1 14.3 12.2 7.3 16.8 17.1 16.4$3,000–$5,999 12.3 12.5 11.9 12.9 12.0 10.8 12.9 13.0 12.9 8.0 10.2 9.5 11.3$6,000–$9,999 10.7 10.4 11.1 10.2 10.7 10.2 10.7 11.3 11.8 8.3 4.6 2.9 7.1$10,000 + 31.0 25.1 40.1 18.3 34.1 40.4 32.8 28.2 35.2 59.0 8.5 4.6 14.3
My own resources (savings from work, work-study, other income)
None 37.1 39.3 33.8 41.9 35.9 37.0 34.0 35.5 32.7 38.1 54.0 56.6 50.1Less than $1,000 26.3 26.9 25.4 28.0 25.4 24.4 25.3 26.6 26.2 22.6 27.1 26.9 27.4$1,000–$2,999 23.1 21.5 25.7 19.6 24.0 24.0 25.0 23.5 26.1 24.4 13.6 11.2 17.0$3,000–$5,999 8.5 7.7 9.7 7.0 8.8 8.6 9.3 8.7 9.9 9.1 3.8 3.8 3.7$6,000–$9,999 2.6 2.4 2.9 1.9 3.0 2.8 3.3 3.1 3.0 2.7 0.7 0.7 0.8$10,000 + 2.3 2.2 2.4 1.7 3.0 3.3 3.0 2.6 2.3 3.2 0.9 0.8 1.0
2009 CIRP Freshman SurveyWeighted National Norms—All Respondents
Baccalaureate Black Colleges All Bacc Institutions 4-year Colleges Universities and Universities
Institutions 4-yr Coll Universities Public Private Nonsec Catholic Oth Relig Public Private All HBCU Public Private
24

HOW MUCH OF YOUR FIRST YEAR’S EDUCATIONALEXPENSES (ROOM, BOARD, TUITION, AND FEES) DO YOU EXPECT TO COVER FROM:Aid which need not be repaid (grants,scholarships, military funding, etc.)
None 30.0 29.1 31.3 35.1 21.2 26.3 19.5 16.6 32.1 28.6 23.7 24.4 22.6Less than $1,000 6.7 6.2 7.6 8.3 3.4 3.6 3.3 3.3 8.7 3.2 6.3 6.8 5.6$1,000–$2,999 13.0 12.3 13.9 15.6 8.0 7.7 8.1 8.3 15.8 6.6 14.9 16.3 12.7$3,000–$5,999 13.3 14.0 12.2 16.5 10.7 9.3 10.7 12.2 13.6 6.6 20.0 23.0 15.7$6,000–$9,999 10.9 11.2 10.5 9.7 13.1 12.1 13.2 14.2 11.3 7.3 13.1 12.0 14.6$10,000 + 26.1 27.1 24.5 14.8 43.6 41.1 45.1 45.5 18.5 47.7 22.1 17.6 28.8
Aid which must be repaid (loans, etc.)None 46.7 46.0 47.8 52.0 37.9 41.7 34.6 35.5 46.9 50.9 37.8 40.8 33.2Less than $1,000 3.8 4.0 3.3 4.5 3.4 2.7 3.5 4.0 3.7 2.1 7.0 7.0 7.1$1,000–$2,999 9.6 10.4 8.4 11.0 9.7 8.5 9.9 10.8 8.9 6.7 14.0 16.0 11.1$3,000–$5,999 17.2 17.2 17.1 16.1 18.6 15.7 20.9 20.7 17.6 15.3 16.8 17.9 15.3$6,000–$9,999 10.3 10.2 10.5 8.2 12.9 11.6 13.8 13.7 11.0 8.9 10.5 9.5 12.0$10,000 + 12.5 12.2 12.9 8.2 17.6 19.9 17.2 15.3 12.0 16.1 13.9 8.9 21.4
Other than aboveNone 93.4 93.1 93.8 93.7 92.3 93.0 91.6 91.9 94.0 93.2 91.5 91.5 91.6Less than $1,000 2.4 2.5 2.3 2.6 2.5 2.2 2.6 2.8 2.3 2.1 3.0 3.1 2.8$1,000–$2,999 1.4 1.5 1.4 1.4 1.6 1.4 1.8 1.8 1.4 1.4 2.1 2.0 2.3$3,000–$5,999 1.0 1.0 1.0 0.9 1.2 1.1 1.3 1.2 1.0 1.0 1.6 1.7 1.4$6,000–$9,999 0.6 0.6 0.6 0.5 0.8 0.7 0.9 0.8 0.5 0.6 0.5 0.5 0.3$10,000 + 1.1 1.2 1.0 0.9 1.6 1.6 1.7 1.5 0.8 1.8 1.3 1.2 1.5
What is your best estimate of your parents’ totalincome last year?
Less than $10,000 4.0 4.8 2.8 5.0 4.6 3.8 4.4 5.4 2.9 2.1 16.4 18.5 13.2$10,000 to $14,999 3.0 3.4 2.2 3.7 3.0 2.8 2.5 3.5 2.4 1.7 8.2 9.7 6.0$15,000 to $19,999 2.7 3.0 2.2 3.2 2.6 2.5 2.7 2.8 2.4 1.4 5.0 5.2 4.8$20,000 to $24,999 3.7 4.1 3.1 4.4 3.7 3.2 3.8 4.3 3.4 2.0 8.5 9.0 7.7$25,000 to $29,999 3.4 3.9 2.8 4.0 3.6 3.3 3.6 3.9 3.1 1.9 6.2 6.6 5.7$30,000 to $39,999 6.1 6.6 5.2 6.7 6.5 5.9 6.3 7.2 5.6 3.9 10.0 10.2 9.7$40,000 to $49,999 7.2 7.8 6.3 7.9 7.6 6.8 7.8 8.3 6.8 4.5 9.8 9.8 9.6$50,000 to $59,999 8.2 8.9 7.2 8.9 9.0 8.2 8.9 9.9 7.5 5.7 8.3 7.8 8.9$60,000 to $74,999 10.8 11.4 10.0 11.3 11.5 11.0 11.3 12.2 10.6 7.8 8.6 8.4 8.9$75,000 to $99,999 14.0 14.0 13.9 14.4 13.5 13.3 13.8 13.6 14.3 12.0 7.9 7.0 9.3$100,000 to $149,999 17.6 16.0 19.9 16.7 15.2 16.2 16.0 13.9 20.0 19.5 6.1 4.9 7.9$150,000 to $199,999 7.8 6.9 9.3 6.7 7.1 8.0 7.7 5.9 8.9 10.8 2.7 2.0 3.6$200,000 to $249,999 4.4 3.6 5.4 3.2 4.2 4.9 4.4 3.4 4.8 7.9 0.7 0.3 1.5$250,000 or more 7.2 5.5 9.7 3.9 7.7 10.1 6.9 5.7 7.3 18.8 1.6 0.6 3.0
Do you have any concern about your ability tofinance your college education?
None (I am confident that I will have sufficient funds) 33.3 33.7 32.7 34.8 32.2 33.7 30.6 31.5 31.8 35.9 27.0 27.8 25.9Some (but I probably will have enough funds) 55.4 54.6 56.7 53.8 55.6 54.7 57.0 56.0 57.5 53.7 52.4 52.2 52.6Major (not sure I will have enough funds to complete
college) 11.3 11.7 10.6 11.4 12.1 11.7 12.4 12.5 10.7 10.4 20.6 20.0 21.5
2009 CIRP Freshman SurveyWeighted National Norms—All Respondents
Baccalaureate Black Colleges All Bacc Institutions 4-year Colleges Universities and Universities
Institutions 4-yr Coll Universities Public Private Nonsec Catholic Oth Relig Public Private All HBCU Public Private
25

Your current religious preference:Baptist 10.9 13.8 6.3 14.4 13.0 8.3 6.6 20.8 6.3 6.4 52.4 53.7 50.5Buddhist 1.1 0.7 1.7 0.7 0.8 1.2 0.6 0.4 1.9 1.2 0.2 0.0 0.5Church of Christ 4.8 5.6 3.7 5.9 5.2 4.6 3.7 6.5 4.1 1.8 11.7 14.2 8.1Eastern Orthodox 0.6 0.6 0.8 0.6 0.5 0.6 0.7 0.3 0.7 1.1 0.1 0.0 0.1Episcopalian 1.3 1.3 1.4 1.1 1.5 1.8 0.9 1.4 1.3 1.9 0.8 0.7 1.0Hindu 0.7 0.3 1.4 0.3 0.4 0.7 0.3 0.2 1.2 2.0 0.1 0.1 0.1Jewish 2.6 1.8 3.7 1.7 2.0 3.9 0.4 0.9 3.1 6.1 0.0 0.0 0.1LDS (Mormon) 0.3 0.3 0.3 0.3 0.2 0.3 0.0 0.2 0.3 0.2 0.1 0.1 0.0Lutheran 3.8 3.3 4.7 2.9 3.7 2.3 2.4 5.9 5.3 2.2 0.2 0.2 0.3Methodist 4.6 4.6 4.4 4.5 4.8 3.7 2.4 7.1 4.8 3.1 4.3 4.0 4.7Muslim 1.0 0.8 1.2 0.7 0.8 0.9 1.3 0.5 1.1 1.6 0.7 0.6 0.8Presbyterian 2.9 2.8 3.2 2.4 3.2 2.7 1.5 4.7 3.1 3.5 0.5 0.3 0.7Quaker 0.2 0.2 0.2 0.1 0.3 0.3 0.2 0.3 0.2 0.2 0.0 0.0 0.1Roman Catholic 26.9 25.7 28.6 26.2 25.1 22.5 55.4 13.0 27.1 34.6 3.8 1.7 6.9Seventh Day Adventist 0.3 0.3 0.2 0.3 0.3 0.3 0.3 0.3 0.2 0.2 0.7 0.6 0.9United Church of Christ/Congregational 0.8 0.8 0.8 0.7 1.0 1.1 0.7 1.0 0.8 0.6 0.5 0.5 0.6Other Christian 12.7 14.1 10.7 13.7 14.6 11.3 8.1 21.1 11.2 8.6 14.5 14.1 15.1Other Religion 2.7 2.8 2.4 2.8 2.9 3.6 2.0 2.5 2.5 2.2 2.3 2.1 2.7None 21.9 20.2 24.4 20.7 19.6 29.8 12.4 12.8 24.9 22.6 6.9 7.1 6.6
Father’s current religious preference:Baptist 10.8 13.6 6.6 14.3 12.8 8.8 6.7 20.0 6.7 6.2 51.0 51.4 50.5Buddhist 1.6 0.8 2.8 0.8 0.9 1.5 0.6 0.5 3.1 2.0 0.4 0.4 0.4Church of Christ 4.8 5.5 3.8 5.9 5.1 5.1 3.6 5.8 4.3 2.0 10.1 12.1 7.3Eastern Orthodox 0.8 0.7 0.9 0.7 0.7 0.8 1.0 0.5 0.8 1.3 0.1 0.0 0.2Episcopalian 1.6 1.5 1.7 1.3 1.9 2.5 1.1 1.7 1.5 2.4 0.6 0.5 0.9Hindu 1.0 0.5 1.7 0.4 0.6 0.9 0.4 0.3 1.5 2.4 0.1 0.1 0.2Jewish 3.3 2.5 4.5 2.2 2.8 5.1 1.0 1.3 3.8 7.4 0.1 0.1 0.1LDS (Mormon) 0.3 0.3 0.4 0.4 0.2 0.2 0.1 0.2 0.4 0.2 0.0 0.1 0.0Lutheran 4.6 3.9 5.6 3.5 4.5 3.1 2.9 6.8 6.3 2.9 0.3 0.3 0.2Methodist 5.1 5.0 5.1 5.0 5.1 4.2 2.8 7.1 5.5 3.6 3.8 3.2 4.7Muslim 1.3 1.2 1.6 1.1 1.2 1.4 1.7 0.9 1.5 2.0 2.5 2.5 2.5Presbyterian 3.4 3.3 3.6 2.9 3.8 3.4 2.0 5.2 3.5 4.1 0.6 0.5 0.7Quaker 0.2 0.2 0.2 0.1 0.3 0.3 0.2 0.3 0.1 0.2 0.0 0.0 0.0Roman Catholic 30.4 29.3 31.9 30.3 28.1 26.8 55.4 15.8 30.6 36.8 4.1 2.3 6.7Seventh Day Adventist 0.3 0.4 0.3 0.4 0.3 0.3 0.4 0.3 0.3 0.3 0.7 0.7 0.7United Church of Christ/Congregational 0.8 0.8 0.8 0.7 1.0 1.2 0.6 1.0 0.8 0.6 0.5 0.5 0.4Other Christian 12.0 13.2 10.2 12.9 13.5 11.3 7.7 18.5 10.8 8.1 12.5 11.9 13.4Other Religion 2.0 2.1 1.9 2.1 2.1 2.5 1.7 1.8 2.0 1.6 2.3 2.3 2.3None 15.6 15.1 16.5 15.0 15.2 20.5 10.1 12.1 16.6 15.8 10.3 11.3 9.0
2009 CIRP Freshman SurveyWeighted National Norms—All Respondents
Baccalaureate Black Colleges All Bacc Institutions 4-year Colleges Universities and Universities
Institutions 4-yr Coll Universities Public Private Nonsec Catholic Oth Relig Public Private All HBCU Public Private
26

Mother’s current religious preference:Baptist 11.5 14.5 7.0 15.0 13.8 9.5 7.2 21.4 7.1 6.7 53.7 54.3 52.8Buddhist 1.7 0.9 3.0 0.8 0.9 1.5 0.6 0.5 3.3 2.1 0.2 0.1 0.3Church of Christ 5.4 6.1 4.2 6.4 5.7 5.7 4.2 6.5 4.8 2.2 11.3 13.6 8.0Eastern Orthodox 0.8 0.7 0.9 0.7 0.6 0.8 0.7 0.4 0.8 1.3 0.1 0.1 0.1Episcopalian 1.9 1.8 1.9 1.6 2.1 2.8 1.1 1.9 1.8 2.6 0.9 0.8 1.1Hindu 0.9 0.4 1.7 0.3 0.5 0.9 0.4 0.3 1.5 2.3 0.1 0.1 0.1Jewish 3.1 2.3 4.3 2.1 2.6 4.8 0.6 1.2 3.6 6.8 0.1 0.1 0.1LDS (Mormon) 0.4 0.4 0.4 0.5 0.2 0.3 0.1 0.2 0.4 0.2 0.1 0.1 0.0Lutheran 4.7 4.1 5.7 3.7 4.6 3.1 2.9 7.0 6.4 2.9 0.2 0.3 0.2Methodist 5.6 5.6 5.6 5.6 5.7 4.8 3.1 7.9 6.0 4.0 4.5 4.2 5.0Muslim 1.1 0.9 1.4 0.9 0.9 1.1 1.3 0.6 1.3 1.8 0.9 0.8 1.0Presbyterian 3.7 3.6 3.9 3.1 4.2 3.9 2.1 5.5 3.7 4.5 0.6 0.4 0.9Quaker 0.2 0.2 0.2 0.1 0.3 0.4 0.2 0.3 0.2 0.2 0.0 0.0 0.1Roman Catholic 32.0 30.6 34.0 31.5 29.5 28.3 58.9 16.2 32.5 39.8 4.6 2.2 8.1Seventh Day Adventist 0.3 0.4 0.3 0.4 0.4 0.4 0.4 0.4 0.3 0.3 0.7 0.7 0.7United Church of Christ/Congregational 1.0 1.0 0.9 0.9 1.2 1.4 0.8 1.1 1.0 0.7 0.5 0.5 0.6Other Christian 13.0 14.3 11.1 14.1 14.6 12.6 8.1 19.8 11.6 8.8 14.1 13.9 14.5Other Religion 2.1 2.2 2.1 2.1 2.2 2.8 1.7 1.9 2.2 1.8 2.5 2.5 2.5None 10.6 10.1 11.4 10.1 10.0 15.0 5.7 7.0 11.6 10.9 4.8 5.4 3.9
For the activities below, indicate which ones you“frequently” or “occasionally” did during the past year:
Attended a religious service 74.8 75.5 73.7 73.9 77.5 67.1 83.6 85.5 72.7 77.5 89.1 87.1 92.0Was bored in class* 38.6 37.9 39.8 39.0 36.3 37.2 33.7 36.7 40.3 38.0 32.7 34.4 30.2Participated in political demonstrations 26.2 25.8 26.7 24.5 27.6 27.9 26.8 27.6 26.2 28.5 39.0 36.3 43.0Tutored another student 54.3 50.4 60.4 49.7 51.3 50.4 52.3 51.8 58.1 69.5 58.8 55.2 63.9Studied with other students 87.4 86.1 89.4 85.6 86.7 85.9 88.2 86.7 89.1 90.6 86.4 85.6 87.7Was a guest in a teacher’s home 20.9 21.5 20.0 19.5 24.0 23.7 18.0 27.3 19.1 23.7 22.2 22.2 22.1Smoked cigarettes* 4.2 4.7 3.4 5.1 4.3 5.1 3.9 3.6 3.6 2.6 1.7 1.8 1.6Drank beer 39.5 38.8 40.7 38.4 39.2 46.5 43.2 29.7 39.9 43.8 12.1 12.5 11.4Drank wine or liquor 44.4 44.3 44.7 43.7 45.2 52.2 47.7 36.5 43.7 48.2 34.7 35.6 33.4Felt overwhelmed by all I had to do* 27.1 27.7 26.0 26.7 29.2 29.0 29.2 29.3 25.6 27.4 24.7 24.4 25.2Felt depressed* 6.1 6.7 5.3 6.4 7.0 7.1 6.0 7.5 5.2 5.4 9.4 10.1 8.3Performed volunteer work 85.3 83.4 88.1 81.5 86.0 84.6 87.4 86.7 86.9 92.6 82.5 79.8 86.6Played a musical instrument 44.0 41.9 47.1 40.6 43.6 43.4 37.5 47.0 46.1 51.1 38.0 37.2 39.2Asked a teacher for advice after class* 27.3 27.3 27.4 25.9 29.0 29.4 28.5 28.8 26.4 31.0 34.3 32.5 36.8Voted in a student election* 21.8 21.4 22.2 20.4 22.9 21.8 23.5 23.7 21.1 26.4 30.7 27.8 35.0Socialized with someone of another racial/ethnic
group* 68.5 68.2 69.1 68.1 68.4 69.3 65.7 68.6 67.8 74.0 69.8 66.0 75.3Came late to class 57.5 57.5 57.5 58.8 55.8 57.7 52.9 55.3 57.4 58.1 63.5 63.8 63.0Used the Internet:
For research or homework* 77.0 74.7 80.5 73.1 76.9 77.6 79.8 74.7 79.2 85.5 75.4 72.4 79.8To read news sites* 43.4 41.0 47.2 40.0 42.4 44.8 44.6 38.8 45.3 54.3 44.4 41.1 49.2To read blogs* 25.2 24.8 25.9 24.3 25.4 26.0 26.1 24.5 25.5 27.1 30.4 28.9 32.6To blog* 13.9 14.4 13.3 14.4 14.4 13.6 14.7 15.1 13.5 12.3 18.7 18.4 19.2
*responses for “frequently” only
2009 CIRP Freshman SurveyWeighted National Norms—All Respondents
Baccalaureate Black Colleges All Bacc Institutions 4-year Colleges Universities and Universities
Institutions 4-yr Coll Universities Public Private Nonsec Catholic Oth Relig Public Private All HBCU Public Private
27

For the activities below, indicate which ones you“frequently” or “occasionally” did during the past year:
Performed community service as part of a class 59.0 58.7 59.5 56.8 61.1 58.9 66.7 60.7 58.6 62.9 60.5 56.7 66.1Discussed religion* 30.3 30.0 30.7 27.5 33.3 28.8 32.2 38.4 28.8 37.9 31.5 28.1 36.4Discussed politics* 33.1 30.5 37.0 28.8 32.8 33.9 32.0 32.2 35.1 44.4 26.3 20.8 34.3Skipped school/class* 2.5 2.7 2.3 2.7 2.6 2.8 2.1 2.6 2.2 2.4 3.6 3.6 3.5
*responses for “frequently” onlyStudent rated self as “Highest 10%” or “AboveAverage” as compared with the average persontheir age:
Academic ability 69.6 63.0 79.8 61.0 65.6 67.0 64.4 64.8 77.6 88.4 59.1 54.7 65.4Artistic ability 28.9 28.7 29.3 27.2 30.8 37.0 23.3 28.1 28.6 31.6 28.7 27.8 30.1Computer skills 39.4 37.6 42.1 38.2 36.8 38.0 36.7 35.5 41.9 42.7 46.3 46.1 46.5Cooperativeness 74.3 73.2 76.0 72.6 74.0 72.8 76.0 74.2 75.6 77.7 71.9 69.7 75.1Creativity 55.5 55.3 55.9 53.8 57.3 61.4 51.8 55.7 55.1 58.9 61.2 60.2 62.7Drive to achieve 75.5 73.3 78.8 71.7 75.4 75.2 76.4 75.2 77.4 84.2 82.8 81.1 85.4Emotional health 55.3 53.2 58.5 52.9 53.5 52.3 54.2 54.5 57.7 61.5 55.0 52.8 58.1Leadership ability 61.8 60.3 64.0 59.7 61.2 59.5 61.4 63.0 62.6 69.6 71.6 69.9 73.9Mathematical ability 44.1 37.9 53.7 37.4 38.5 39.4 37.2 38.2 51.9 60.3 36.4 34.8 38.7Physical health 55.9 54.5 58.0 53.9 55.3 54.0 57.4 55.7 57.5 60.1 52.5 51.4 54.2Popularity 38.8 37.9 40.3 37.5 38.4 37.8 39.2 38.6 39.3 44.1 49.8 48.8 51.3Public speaking ability 37.2 35.3 40.0 34.3 36.7 36.6 35.3 37.4 37.8 48.3 41.7 39.2 45.4Self-confidence (intellectual) 60.2 57.5 64.3 56.6 58.8 58.2 56.3 60.7 62.5 70.9 75.4 74.8 76.4Self-confidence (social) 52.3 51.8 53.0 52.3 51.0 49.1 51.5 52.7 52.6 54.6 71.5 71.3 71.8Self-understanding 58.5 57.4 60.2 56.8 58.2 58.5 55.4 59.2 59.0 64.6 72.2 71.9 72.6Spirituality 38.4 39.5 36.8 38.6 40.7 34.3 38.6 48.4 35.6 41.2 58.3 58.8 57.6Understanding of others 67.4 66.8 68.3 66.2 67.6 67.3 67.5 67.9 67.3 72.0 67.7 65.9 70.3Writing ability 46.2 44.1 49.5 42.8 46.0 47.2 44.2 45.6 47.0 58.9 46.4 43.5 50.6Ability to see the world from someone else’s
perspective 65.8 63.5 69.4 62.8 64.4 66.6 62.5 63.0 68.0 74.7 60.8 57.8 65.3Tolerance of others with different beliefs 73.0 70.3 77.1 69.4 71.5 74.8 71.1 68.2 76.0 81.4 64.7 60.8 70.3Openness to having my own views challenged 58.7 57.1 61.1 56.7 57.7 60.3 56.9 55.4 60.0 65.4 63.0 62.0 64.6Ability to discuss and negotiate controversial issues 63.4 61.1 66.9 60.9 61.4 64.2 60.0 59.3 65.3 72.7 65.0 62.8 68.0Ability to work cooperatively with diverse people 78.5 76.7 81.2 76.3 77.2 78.2 77.2 76.2 80.3 84.6 77.3 74.1 82.1
What is the highest level of formal educationobtained by your father?
Grammar school or less 4.1 4.5 3.5 5.3 3.4 3.1 4.6 3.2 3.9 2.2 6.6 6.8 6.3Some high school 5.2 6.0 4.1 6.6 5.1 4.5 5.4 5.6 4.5 2.7 11.6 12.8 9.9High school graduate 19.3 22.4 14.7 23.4 21.1 18.8 21.9 23.1 16.1 9.5 33.2 36.0 29.2Postsecondary school other than college 3.2 3.6 2.7 3.7 3.4 3.0 3.9 3.6 2.9 2.1 3.7 4.1 3.2Some college 14.5 15.5 13.0 16.4 14.3 13.4 14.8 15.0 13.8 10.2 18.8 18.7 18.9College degree 28.4 26.8 30.9 26.4 27.4 28.0 27.6 26.5 31.3 29.3 15.8 14.1 18.2Some graduate school 2.1 1.8 2.4 1.6 2.2 2.3 2.1 2.1 2.3 3.0 1.0 0.5 1.7Graduate degree 23.0 19.4 28.6 16.6 23.1 26.8 19.7 20.8 25.2 41.1 9.3 7.0 12.7
2009 CIRP Freshman SurveyWeighted National Norms—All Respondents
Baccalaureate Black Colleges All Bacc Institutions 4-year Colleges Universities and Universities
Institutions 4-yr Coll Universities Public Private Nonsec Catholic Oth Relig Public Private All HBCU Public Private
28

What is the highest level of formal educationobtained by your mother?
Grammar school or less 3.7 4.0 3.3 4.8 3.0 2.5 4.1 2.9 3.7 1.9 6.1 6.4 5.6Some high school 3.8 4.1 3.2 4.9 3.2 2.8 3.6 3.3 3.5 2.0 6.5 7.4 5.2High school graduate 17.4 19.6 13.9 20.5 18.5 16.5 20.1 19.7 15.1 9.4 23.1 25.2 20.1Postsecondary school other than college 3.5 3.7 3.1 3.7 3.8 3.6 4.3 3.7 3.2 2.4 3.9 3.9 3.9Some college 16.8 17.9 15.1 19.1 16.4 15.0 16.1 18.1 16.0 11.8 22.8 23.6 21.6College degree 33.4 31.3 36.7 30.0 32.9 33.5 32.2 32.7 36.3 38.2 22.9 21.5 24.9Some graduate school 2.7 2.5 3.1 2.2 2.9 3.0 2.8 2.9 2.9 4.0 2.2 1.7 2.8Graduate degree 18.7 16.8 21.6 14.8 19.3 23.1 16.8 16.7 19.3 30.4 12.5 10.1 15.9
During the past year, did you “frequently”:Ask questions in class 53.9 52.8 55.7 51.5 54.5 55.2 54.7 53.7 53.7 63.0 59.9 58.0 62.7Support your opinions with a logical argument 57.8 54.6 62.8 53.2 56.4 59.4 54.1 54.3 60.3 72.2 53.0 48.8 59.1Seek solutions to problems and explain them to others 51.2 48.3 55.8 47.2 49.9 51.7 48.6 48.6 53.1 65.8 49.6 46.5 54.1Revise your papers to improve your writing 46.6 45.2 48.8 42.7 48.4 48.6 49.2 47.7 47.0 55.4 48.9 46.3 52.7Evaluate the quality or reliability of information you
received 36.9 34.9 40.2 33.3 36.9 38.7 35.3 35.9 38.0 48.5 38.6 35.9 42.5Take a risk because you feel you have more to gain 39.3 39.4 39.2 39.3 39.5 40.4 39.4 38.5 38.4 42.3 44.0 43.1 45.4Seek alternative solutions to a problem 44.3 43.3 45.9 42.8 44.0 45.1 43.6 42.9 44.6 50.6 46.1 43.3 50.1Look up scientific research articles and resources 21.9 20.1 24.6 19.3 21.2 22.5 21.8 19.7 23.2 29.8 21.3 19.8 23.4Explore topics on your own, even though it was not
required for a class 30.9 29.6 33.0 28.6 30.9 34.2 27.7 29.0 31.4 39.1 29.3 26.7 33.1Accept mistakes as part of the learning process 51.8 51.2 52.7 51.2 51.2 51.5 50.6 51.2 52.5 53.6 60.2 58.6 62.7Seek feedback on your academic work 47.3 46.4 48.6 44.8 48.6 49.7 48.7 47.4 47.0 54.7 56.6 54.8 59.3Take notes during class 66.5 66.1 67.0 63.8 69.2 67.7 73.8 68.6 65.5 72.8 74.8 73.1 77.5Work with other students on class assignments 54.6 53.3 56.6 53.9 52.6 51.7 55.6 52.2 56.3 57.8 56.8 55.5 58.6
2009 CIRP Freshman SurveyWeighted National Norms—All Respondents
Baccalaureate Black Colleges All Bacc Institutions 4-year Colleges Universities and Universities
Institutions 4-yr Coll Universities Public Private Nonsec Catholic Oth Relig Public Private All HBCU Public Private
29

Your probable career occupation:Accountant or actuary 2.3 2.3 2.3 2.2 2.5 2.2 3.4 2.3 2.4 1.9 2.7 3.0 2.2Actor or entertainer 1.3 1.6 0.9 1.6 1.5 1.7 0.7 1.8 0.8 1.2 1.6 1.6 1.7Architect or urban planner 0.8 0.6 1.1 0.6 0.6 0.8 0.4 0.4 1.2 0.8 0.7 1.0 0.4Artist 2.7 3.7 1.2 2.2 5.6 11.1 1.2 2.1 1.3 0.9 1.0 1.1 0.9Business (clerical) 0.6 0.7 0.6 0.6 0.7 0.7 0.8 0.6 0.6 0.5 0.7 0.7 0.6Business executive (management, administrator) 6.4 5.7 7.4 5.2 6.5 6.8 7.2 5.8 6.8 9.8 5.4 6.2 4.4Business owner or proprietor 2.6 2.7 2.5 2.6 3.0 3.2 2.8 2.8 2.4 2.7 4.1 3.4 5.1Business salesperson or buyer 0.8 0.7 0.8 0.7 0.7 0.7 1.1 0.5 0.9 0.6 0.4 0.4 0.5Clergy (minister, priest) 0.2 0.2 0.0 0.1 0.4 0.1 0.1 0.8 0.0 0.1 0.2 0.1 0.2Clergy (other religious) 0.1 0.1 0.0 0.0 0.2 0.1 0.1 0.4 0.0 0.1 0.0 0.0 0.1Clinical psychologist 1.4 1.6 1.2 1.6 1.6 1.4 1.7 1.7 1.2 1.2 2.5 2.7 2.2College administrator/staff 0.0 0.1 0.0 0.0 0.1 0.1 0.1 0.1 0.0 0.0 0.1 0.1 0.1College teacher 0.5 0.5 0.5 0.3 0.6 0.7 0.3 0.7 0.4 0.7 0.2 0.2 0.2Computer programmer or analyst 1.7 1.7 1.8 1.8 1.5 1.4 1.2 1.6 2.0 1.1 3.1 3.1 3.1Conservationist or forester 0.3 0.3 0.3 0.3 0.4 0.5 0.1 0.4 0.4 0.1 0.1 0.2 0.0Dentist (including orthodontist) 1.1 0.9 1.4 1.0 0.9 0.6 1.2 1.0 1.5 1.3 1.7 1.4 2.2Dietitian or nutritionist 0.5 0.4 0.7 0.5 0.3 0.2 0.5 0.4 0.8 0.2 0.1 0.2 0.1Engineer 7.7 4.5 12.6 5.6 3.1 3.8 2.8 2.6 13.5 9.2 5.0 5.6 4.1Farmer or rancher 0.3 0.3 0.3 0.3 0.3 0.3 0.1 0.3 0.4 0.2 0.1 0.1 0.0Foreign service worker (including diplomat) 0.8 0.7 1.0 0.4 1.0 1.3 0.5 0.9 0.6 2.3 0.2 0.0 0.4Homemaker (full-time) 0.1 0.1 0.1 0.1 0.1 0.1 0.1 0.1 0.1 0.1 0.0 0.0 0.0Interior decorator (including designer) 0.3 0.3 0.3 0.2 0.5 0.8 0.3 0.2 0.3 0.2 0.1 0.1 0.1Lab technician or hygienist 0.2 0.2 0.2 0.2 0.2 0.1 0.2 0.2 0.2 0.1 0.2 0.2 0.3Law enforcement officer 1.3 1.9 0.5 2.2 1.4 1.2 1.3 1.7 0.6 0.2 2.1 2.4 1.6Lawyer (attorney) or judge 3.6 3.1 4.3 2.6 3.8 3.9 4.0 3.7 3.6 7.0 7.0 5.6 9.0Military service (career) 1.8 2.5 0.7 4.0 0.5 0.5 0.5 0.5 0.8 0.6 0.6 0.6 0.6Musician (performer, composer) 1.5 1.8 1.1 1.9 1.7 1.1 0.7 2.8 1.2 1.0 2.3 2.5 1.9Nurse 4.7 5.7 3.2 6.3 4.9 2.5 10.6 4.5 3.5 2.1 6.9 8.5 4.7Optometrist 0.3 0.3 0.4 0.3 0.2 0.2 0.3 0.3 0.4 0.2 0.3 0.2 0.4Pharmacist 1.9 1.8 2.0 1.4 2.2 2.0 2.9 2.2 2.0 2.1 3.8 1.5 7.1Physician 6.7 4.7 9.8 3.7 6.0 4.9 8.2 6.0 8.7 14.0 7.8 4.4 12.7Policymaker/Government 1.0 0.9 1.3 0.7 1.1 1.1 1.0 1.0 1.0 2.5 0.6 0.3 1.0School counselor 0.4 0.4 0.2 0.4 0.4 0.3 0.5 0.5 0.3 0.1 0.4 0.3 0.5School principal or superintendent 0.1 0.1 0.0 0.1 0.1 0.0 0.0 0.1 0.0 0.0 0.2 0.2 0.1Scientific researcher 2.1 1.8 2.6 1.5 2.1 2.5 1.3 1.9 2.5 3.1 1.4 1.3 1.5Social, welfare, or recreation worker 1.1 1.3 0.8 1.4 1.2 0.8 1.2 1.5 0.9 0.5 2.7 3.1 2.1Therapist (physical, occupational, speech) 3.4 3.7 2.8 3.9 3.5 2.4 4.6 4.2 3.2 1.4 3.7 4.7 2.2Teacher or administrator (elementary) 4.1 5.7 1.8 6.5 4.6 2.7 5.1 6.4 2.0 1.2 4.1 5.4 2.2Teacher or administrator (secondary) 4.4 5.5 2.6 6.2 4.7 3.1 4.5 6.4 2.9 1.6 3.1 4.0 1.8Veterinarian 1.2 1.1 1.3 1.0 1.2 1.4 0.7 1.3 1.5 0.6 0.7 0.7 0.7Writer or journalist 2.7 2.6 2.8 2.4 2.9 2.9 2.5 3.0 2.7 3.2 2.1 2.1 2.1Skilled trades 0.2 0.3 0.2 0.3 0.2 0.2 0.2 0.3 0.2 0.2 0.2 0.2 0.2Laborer (unskilled) 0.3 0.3 0.3 0.3 0.2 0.2 0.3 0.2 0.3 0.1 0.1 0.1 0.0Semi-skilled worker 0.2 0.2 0.2 0.2 0.2 0.2 0.2 0.2 0.2 0.1 0.1 0.1 0.1Unemployed 1.3 1.5 1.1 1.5 1.5 1.5 1.4 1.4 1.1 1.0 3.0 3.2 2.6Other 8.6 9.2 7.5 9.0 9.4 10.1 7.8 9.5 8.0 5.9 10.0 10.5 9.2Undecided 14.4 14.1 15.0 14.0 14.1 15.8 13.3 12.8 14.8 15.8 6.8 7.0 6.6
2009 CIRP Freshman SurveyWeighted National Norms—All Respondents
Baccalaureate Black Colleges All Bacc Institutions 4-year Colleges Universities and Universities
Institutions 4-yr Coll Universities Public Private Nonsec Catholic Oth Relig Public Private All HBCU Public Private
30

Your father’s occupation:Accountant or actuary 2.7 2.3 3.2 2.2 2.5 2.3 3.4 2.3 3.1 3.7 1.2 0.8 1.8Actor or entertainer 0.1 0.1 0.1 0.1 0.1 0.2 0.1 0.1 0.1 0.1 0.2 0.3 0.1Architect or urban planner 1.1 1.0 1.1 1.0 1.1 1.2 0.8 1.0 1.1 1.1 0.6 0.6 0.6Artist 0.4 0.4 0.3 0.3 0.6 1.0 0.2 0.4 0.3 0.3 0.2 0.2 0.3Business (clerical) 1.4 1.4 1.4 1.4 1.4 1.6 1.4 1.1 1.4 1.2 1.7 1.7 1.6Business executive (management, administrator) 10.8 9.9 12.2 9.3 10.8 11.5 11.6 9.6 11.3 15.5 4.8 4.0 5.9Business owner or proprietor 8.6 8.4 8.9 8.0 8.9 9.8 8.6 8.1 8.6 10.1 4.5 3.5 6.0Business salesperson or buyer 4.6 4.4 4.9 4.5 4.3 4.2 5.1 4.0 5.0 4.3 2.3 2.2 2.4Clergy (minister, priest) 0.6 0.7 0.5 0.5 1.1 0.6 0.2 2.2 0.5 0.6 1.2 0.8 1.7Clergy (other religious) 0.1 0.1 0.1 0.1 0.2 0.1 0.1 0.3 0.1 0.1 0.1 0.0 0.1Clinical psychologist 0.1 0.1 0.1 0.1 0.1 0.2 0.1 0.1 0.1 0.2 0.1 0.0 0.1College administrator/staff 0.3 0.3 0.3 0.3 0.4 0.4 0.4 0.5 0.3 0.4 0.4 0.4 0.4College teacher 0.6 0.6 0.8 0.3 0.9 1.0 0.5 0.9 0.6 1.3 0.4 0.4 0.4Computer programmer or analyst 3.7 3.5 4.0 3.7 3.3 3.4 3.0 3.3 4.1 3.7 1.8 1.3 2.4Conservationist or forester 0.1 0.1 0.1 0.1 0.2 0.2 0.1 0.1 0.1 0.1 0.0 0.1 0.0Dentist (including orthodontist) 0.5 0.4 0.7 0.3 0.4 0.5 0.5 0.4 0.6 1.0 0.2 0.0 0.5Dietitian or nutritionist 0.1 0.1 0.1 0.1 0.1 0.1 0.1 0.1 0.1 0.1 0.2 0.3 0.2Engineer 8.6 7.6 10.2 8.2 6.8 7.0 6.8 6.7 10.6 8.7 5.3 5.5 5.1Farmer or rancher 1.1 0.9 1.5 0.8 0.9 0.7 0.5 1.4 1.7 0.6 0.4 0.5 0.3Foreign service worker (including diplomat) 0.1 0.1 0.1 0.1 0.1 0.2 0.1 0.1 0.1 0.2 0.1 0.1 0.2Homemaker (full-time) 0.3 0.3 0.3 0.3 0.3 0.4 0.3 0.3 0.3 0.2 0.2 0.2 0.4Interior decorator (including designer) 0.0 0.0 0.0 0.0 0.0 0.0 0.1 0.0 0.0 0.1 0.1 0.1 0.0Lab technician or hygienist 0.3 0.3 0.3 0.3 0.3 0.2 0.3 0.3 0.4 0.3 0.2 0.1 0.3Law enforcement officer 1.8 2.1 1.3 2.4 1.8 1.7 2.3 1.8 1.4 1.1 2.6 2.6 2.8Lawyer (attorney) or judge 2.4 2.0 3.1 1.4 2.7 3.4 2.5 2.0 2.4 5.6 0.8 0.5 1.2Military service (career) 1.8 2.1 1.2 2.4 1.7 1.4 1.0 2.2 1.4 0.8 4.1 3.9 4.3Musician (performer, composer) 0.2 0.3 0.2 0.3 0.3 0.3 0.2 0.4 0.2 0.2 0.4 0.3 0.6Nurse 0.5 0.6 0.5 0.6 0.6 0.5 0.8 0.5 0.6 0.3 0.5 0.4 0.6Optometrist 0.1 0.1 0.1 0.1 0.1 0.1 0.1 0.1 0.1 0.1 0.0 0.0 0.0Pharmacist 0.4 0.3 0.5 0.3 0.4 0.3 0.4 0.3 0.5 0.5 0.4 0.2 0.6Physician 2.3 1.6 3.3 1.0 2.4 2.8 2.0 2.1 2.4 6.4 0.9 0.5 1.3Policymaker/Government 0.7 0.8 0.7 0.8 0.8 0.9 0.7 0.8 0.6 0.8 0.9 0.7 1.1School counselor 0.1 0.1 0.1 0.1 0.1 0.1 0.1 0.1 0.1 0.1 0.1 0.1 0.1School principal or superintendent 0.2 0.2 0.2 0.2 0.2 0.2 0.2 0.3 0.1 0.2 0.2 0.2 0.1Scientific researcher 0.7 0.5 1.0 0.4 0.6 0.9 0.3 0.5 0.9 1.6 0.3 0.1 0.6Social, welfare, or recreation worker 0.5 0.6 0.5 0.6 0.6 0.6 0.6 0.6 0.5 0.5 1.2 1.4 1.0Therapist (physical, occupational, speech) 0.3 0.3 0.3 0.3 0.3 0.3 0.3 0.3 0.3 0.3 0.3 0.2 0.4Teacher or administrator (elementary) 0.7 0.8 0.6 0.8 0.8 0.7 0.7 0.9 0.6 0.6 0.7 0.7 0.6Teacher or administrator (secondary) 1.8 1.9 1.7 1.8 2.0 1.9 1.6 2.3 1.7 1.5 1.3 1.1 1.6Veterinarian 0.2 0.1 0.2 0.1 0.1 0.2 0.1 0.1 0.2 0.1 0.3 0.4 0.2Writer or journalist 0.4 0.3 0.4 0.2 0.4 0.5 0.4 0.4 0.3 0.6 0.2 0.1 0.3Skilled trades 6.8 7.6 5.5 8.0 7.0 6.8 7.5 7.1 5.9 4.4 6.7 6.7 6.9Laborer (unskilled) 3.0 3.2 2.8 3.4 2.9 2.5 3.4 3.2 3.1 1.6 4.1 4.0 4.2Semi-skilled worker 2.8 2.8 2.8 3.0 2.5 2.3 2.7 2.8 3.0 1.7 3.9 4.3 3.4Unemployed 4.5 5.0 3.8 5.0 4.8 4.5 5.2 5.0 4.1 2.9 12.0 13.7 9.6Other 21.3 23.5 18.0 24.8 21.7 20.2 22.9 22.7 19.1 14.1 32.0 34.9 27.8
2009 CIRP Freshman SurveyWeighted National Norms—All Respondents
Baccalaureate Black Colleges All Bacc Institutions 4-year Colleges Universities and Universities
Institutions 4-yr Coll Universities Public Private Nonsec Catholic Oth Relig Public Private All HBCU Public Private
31

Your mother’s occupation:Accountant or actuary 5.3 5.1 5.5 5.4 4.7 4.7 4.6 4.6 5.7 4.7 4.7 4.5 4.9Actor or entertainer 0.1 0.1 0.0 0.1 0.1 0.1 0.1 0.0 0.0 0.1 0.1 0.1 0.0Architect or urban planner 0.2 0.2 0.3 0.2 0.3 0.4 0.1 0.2 0.2 0.4 0.1 0.1 0.1Artist 0.7 0.7 0.7 0.5 1.0 1.5 0.4 0.7 0.6 0.8 0.3 0.3 0.3Business (clerical) 3.9 4.0 3.8 4.2 3.8 3.6 4.2 3.9 3.8 3.6 3.5 3.1 4.0Business executive (management, administrator) 5.8 5.8 5.7 5.8 5.9 6.1 6.1 5.6 5.6 6.4 5.9 4.9 7.4Business owner or proprietor 3.1 2.9 3.3 2.8 3.2 3.5 2.7 3.1 3.2 3.6 2.4 1.8 3.3Business salesperson or buyer 2.3 2.2 2.4 2.4 2.0 2.2 2.0 1.8 2.5 2.0 1.6 1.6 1.5Clergy (minister, priest) 0.1 0.1 0.1 0.1 0.2 0.2 0.1 0.4 0.1 0.1 0.2 0.1 0.3Clergy (other religious) 0.1 0.1 0.1 0.1 0.2 0.1 0.1 0.3 0.1 0.1 0.0 0.1 0.0Clinical psychologist 0.2 0.2 0.2 0.1 0.2 0.3 0.2 0.2 0.2 0.3 0.3 0.3 0.2College administrator/staff 0.6 0.6 0.6 0.4 0.8 0.8 0.8 0.9 0.6 0.7 0.7 0.7 0.7College teacher 0.5 0.4 0.6 0.3 0.6 0.8 0.3 0.6 0.5 1.0 0.2 0.2 0.2Computer programmer or analyst 1.4 1.3 1.7 1.3 1.2 1.4 1.1 1.1 1.7 1.9 0.9 0.5 1.3Conservationist or forester 0.0 0.0 0.1 0.0 0.1 0.1 0.0 0.1 0.1 0.0 0.0 0.1 0.0Dentist (including orthodontist) 0.5 0.5 0.6 0.5 0.5 0.5 0.5 0.5 0.6 0.6 0.3 0.3 0.3Dietitian or nutritionist 0.4 0.3 0.4 0.3 0.4 0.3 0.4 0.4 0.4 0.3 0.4 0.4 0.5Engineer 0.9 0.7 1.4 0.7 0.6 0.7 0.5 0.5 1.3 1.4 0.6 0.7 0.6Farmer or rancher 0.2 0.2 0.2 0.1 0.2 0.2 0.1 0.2 0.2 0.1 0.0 0.0 0.0Foreign service worker (including diplomat) 0.1 0.1 0.1 0.0 0.1 0.1 0.1 0.1 0.1 0.1 0.0 0.0 0.1Homemaker (full-time) 8.0 7.1 9.5 6.2 8.2 7.5 8.3 8.9 8.4 13.8 1.7 1.4 2.3Interior decorator (including designer) 0.4 0.4 0.5 0.4 0.5 0.6 0.4 0.4 0.4 0.5 0.2 0.0 0.5Lab technician or hygienist 0.7 0.7 0.8 0.7 0.6 0.6 0.7 0.6 0.8 0.7 0.5 0.5 0.6Law enforcement officer 0.3 0.4 0.2 0.4 0.3 0.3 0.3 0.4 0.3 0.2 1.3 1.4 1.1Lawyer (attorney) or judge 1.1 0.9 1.3 0.6 1.2 1.6 0.9 0.9 1.0 2.7 1.0 0.8 1.4Military service (career) 0.2 0.2 0.2 0.3 0.2 0.2 0.2 0.3 0.2 0.1 0.9 0.9 1.0Musician (performer, composer) 0.2 0.2 0.2 0.1 0.2 0.3 0.1 0.3 0.1 0.3 0.1 0.0 0.1Nurse 8.4 8.7 7.9 8.9 8.4 7.6 10.0 8.4 8.1 6.9 10.5 11.5 9.1Optometrist 0.1 0.2 0.1 0.1 0.2 0.2 0.2 0.2 0.1 0.1 0.1 0.0 0.3Pharmacist 0.5 0.4 0.6 0.4 0.5 0.5 0.4 0.4 0.6 0.7 0.4 0.4 0.6Physician 0.9 0.7 1.4 0.4 0.9 1.3 0.6 0.7 1.0 2.7 0.5 0.4 0.7Policymaker/Government 0.5 0.6 0.5 0.5 0.6 0.6 0.5 0.7 0.5 0.5 1.2 1.0 1.5School counselor 0.3 0.4 0.3 0.3 0.4 0.4 0.3 0.4 0.3 0.4 0.4 0.4 0.4School principal or superintendent 0.2 0.2 0.2 0.2 0.3 0.3 0.3 0.3 0.2 0.2 0.3 0.4 0.3Scientific researcher 0.4 0.3 0.6 0.3 0.3 0.5 0.3 0.2 0.5 1.1 0.2 0.2 0.2Social, welfare, or recreation worker 1.8 1.8 1.7 1.8 1.9 1.8 1.9 1.9 1.6 1.7 4.1 4.3 3.9Therapist (physical, occupational, speech) 1.6 1.6 1.7 1.6 1.6 1.7 1.6 1.5 1.7 1.7 1.1 1.2 0.9Teacher or administrator (elementary) 7.7 7.8 7.6 7.7 7.9 7.5 7.7 8.6 7.8 6.8 6.0 5.8 6.3Teacher or administrator (secondary) 3.9 3.9 3.8 3.8 4.1 4.2 3.4 4.3 3.8 4.0 3.4 3.2 3.6Veterinarian 0.1 0.1 0.1 0.1 0.1 0.2 0.1 0.1 0.1 0.1 0.0 0.0 0.1Writer or journalist 0.4 0.4 0.5 0.3 0.5 0.7 0.4 0.4 0.4 0.8 0.2 0.2 0.2Skilled trades 1.4 1.5 1.3 1.6 1.3 1.2 1.4 1.4 1.4 1.0 1.2 1.3 1.0Laborer (unskilled) 1.7 1.7 1.6 1.8 1.5 1.3 1.6 1.6 1.8 0.9 1.9 2.0 1.7Semi-skilled worker 1.8 1.8 1.9 2.0 1.5 1.2 1.6 1.6 2.1 1.2 2.1 2.3 2.0Unemployed 7.9 8.2 7.5 8.6 7.7 7.8 7.8 7.4 7.6 7.2 10.7 11.6 9.4Other 22.8 24.4 20.4 25.5 23.0 22.2 24.7 22.9 21.7 15.5 27.3 29.0 24.8
2009 CIRP Freshman SurveyWeighted National Norms—All Respondents
Baccalaureate Black Colleges All Bacc Institutions 4-year Colleges Universities and Universities
Institutions 4-yr Coll Universities Public Private Nonsec Catholic Oth Relig Public Private All HBCU Public Private
32

Race/Ethnicity—mark all that apply(total may add to more than 100%)American Indian/Alaska Native 2.5 3.0 1.7 3.3 2.6 2.5 1.8 3.0 1.7 1.5 3.8 3.2 4.6Asian American/Asian 8.9 5.0 15.0 4.6 5.5 7.7 4.6 3.6 14.6 16.7 0.9 0.5 1.6Native Hawaiian/Pacific Islander 1.0 1.0 1.1 1.1 0.8 0.8 1.1 0.7 1.1 1.0 0.4 0.2 0.7African American/Black 11.0 14.1 6.2 13.3 15.1 12.9 12.8 18.6 6.1 6.9 96.7 96.7 96.6Mexican American/Chicano 5.5 5.3 5.7 7.3 2.7 2.1 4.2 2.6 6.2 4.1 0.8 0.8 0.7Puerto Rican 1.5 1.7 1.1 1.6 1.9 1.9 2.6 1.6 0.9 1.6 1.2 0.9 1.5Other Latino 4.2 4.5 3.7 5.0 3.7 4.1 4.8 2.8 3.4 5.0 1.1 0.8 1.6White/Caucasian 73.1 73.7 72.2 72.5 75.4 76.3 74.6 74.9 72.6 70.6 4.3 4.7 3.7Other 3.4 3.7 3.0 3.8 3.6 4.0 3.5 3.2 2.9 3.7 3.4 2.9 4.2
Student “agree strongly” or “agree somewhat”:There is too much concern in the courts for the rights
of criminals 55.3 56.7 53.2 58.5 54.2 51.1 55.8 56.8 54.3 49.0 46.1 47.3 44.4Abortion should be legal 58.0 55.1 62.4 55.8 54.3 67.0 49.7 43.2 62.1 63.4 49.9 48.4 52.2Marijuana should be legalized 45.6 44.6 47.2 45.0 44.0 52.0 41.1 37.2 47.2 47.1 41.4 40.7 42.3Racial discrimination is no longer a major problem
in America 23.2 23.5 22.8 25.2 21.3 21.0 21.7 21.5 23.1 21.6 13.5 15.3 10.8Realistically, an individual can do little to bring about
changes in our society 27.6 29.2 25.1 30.5 27.6 28.1 27.6 27.0 25.8 22.2 36.5 40.4 30.8Same-sex couples should have the right to legal
marital status 64.9 62.3 68.9 62.6 62.0 72.9 64.5 49.4 68.5 70.6 50.8 50.1 51.9Only volunteers should serve in the armed forces 62.8 61.7 64.7 61.1 62.4 67.1 60.5 58.4 63.7 68.5 59.8 58.2 62.2Dissent is a critical component of the political process 61.5 58.1 66.7 56.6 60.1 63.4 57.6 58.0 64.4 75.2 52.2 50.3 54.9Colleges have the right to ban extreme speakers from
campus 40.7 41.2 40.0 40.7 41.8 38.6 41.6 45.3 39.6 41.7 41.6 42.0 40.9Students from disadvantaged social backgrounds
should be given preferential treatment in college admissions 37.4 39.5 34.2 39.1 40.0 40.4 38.0 40.7 34.4 33.3 55.4 55.5 55.2
Colleges should prohibit racist/sexist speech on campus 68.4 68.5 68.3 68.0 69.2 69.2 69.2 69.2 67.8 69.9 59.6 58.7 60.7
How would you characterize your political views?Far left 2.8 2.8 2.7 2.5 3.2 4.2 2.1 2.7 2.6 3.3 4.0 4.0 4.0Liberal 29.0 26.7 32.7 25.4 28.3 35.4 26.0 22.1 32.0 35.4 31.7 28.0 37.1Middle-of-the-road 44.4 45.7 42.3 47.1 43.9 43.5 48.0 42.4 43.5 37.9 45.3 46.2 44.0Conservative 21.8 22.6 20.6 22.6 22.5 15.4 21.8 30.2 20.3 21.9 16.2 18.9 12.4Far right 2.0 2.2 1.7 2.4 2.0 1.5 2.0 2.6 1.7 1.6 2.8 2.9 2.5
The following reasons were “very important” indeciding to go to college:
My parents wanted me to go 42.7 44.1 40.4 45.9 41.7 39.0 45.9 42.5 41.0 38.4 56.8 59.3 53.3To be able to get a better job 84.3 84.3 84.4 85.8 82.3 80.8 87.1 81.5 84.8 82.7 92.0 92.8 90.9To gain a general education and appreciation of ideas 71.2 70.9 71.7 69.2 73.0 74.1 73.8 71.5 70.1 77.6 83.7 83.0 84.6To make me a more cultured person 52.8 52.1 53.8 49.6 55.3 57.5 54.7 53.4 51.5 62.5 66.7 63.1 72.0To be able to make more money 72.5 72.9 72.0 75.6 69.3 67.9 75.6 67.8 73.2 67.6 88.7 90.3 86.2To learn more about things that interest me 82.7 82.1 83.6 81.1 83.4 85.3 81.4 82.5 83.0 86.0 86.2 85.4 87.3
2009 CIRP Freshman SurveyWeighted National Norms—All Respondents
Baccalaureate Black Colleges All Bacc Institutions 4-year Colleges Universities and Universities
Institutions 4-yr Coll Universities Public Private Nonsec Catholic Oth Relig Public Private All HBCU Public Private
33

DURING YOUR LAST YEAR IN HIGH SCHOOL, HOWMUCH TIME DID YOU SPEND DURING A TYPICALWEEK DOING THE FOLLOWING ACTIVITIES?Studying/homework
None 2.3 2.6 1.8 2.9 2.2 2.2 1.8 2.5 2.0 1.4 3.4 4.0 2.5Less than one hour 12.4 13.9 10.1 15.6 11.6 11.4 10.6 12.3 11.2 6.3 16.8 18.1 14.81 to 2 hours 22.9 24.8 19.8 27.0 21.9 20.1 22.6 23.5 21.6 13.3 32.0 35.5 27.03 to 5 hours 27.7 27.9 27.5 28.6 26.9 26.0 27.7 27.4 28.7 22.7 25.7 24.7 27.26 to 10 hours 18.8 17.4 20.9 15.7 19.6 20.1 19.9 19.0 20.3 23.3 12.3 10.6 14.811 to 15 hours 8.5 7.4 10.2 5.9 9.3 10.2 9.5 8.3 8.8 15.3 4.9 3.8 6.416 to 20 hours 4.2 3.5 5.4 2.4 4.9 5.8 4.6 4.1 4.3 9.6 2.3 1.5 3.5Over 20 hours 3.2 2.5 4.2 1.8 3.6 4.3 3.2 3.0 3.2 8.1 2.5 1.7 3.7
Socializing with friendsNone 0.4 0.4 0.3 0.4 0.4 0.5 0.4 0.4 0.4 0.3 0.6 0.7 0.5Less than one hour 1.6 1.8 1.3 1.9 1.6 1.5 1.6 1.7 1.3 1.2 3.2 3.7 2.41 to 2 hours 6.9 7.1 6.6 7.3 6.9 6.4 6.6 7.5 6.9 5.8 10.2 10.4 9.93 to 5 hours 20.0 19.8 20.3 19.9 19.7 18.8 18.8 20.9 20.6 19.5 21.9 21.7 22.36 to 10 hours 26.3 25.2 28.2 24.6 25.9 25.9 26.5 25.5 27.7 29.9 22.3 22.0 22.711 to 15 hours 18.4 18.1 18.9 17.7 18.7 18.8 18.9 18.4 18.7 19.6 13.4 12.7 14.416 to 20 hours 10.8 11.0 10.7 10.9 11.0 11.6 11.7 10.1 10.6 11.0 8.1 7.7 8.7Over 20 hours 15.5 16.6 13.6 17.3 15.8 16.4 15.5 15.4 13.9 12.7 20.3 21.0 19.3
Talking with teachers outside of classNone 9.9 10.2 9.5 11.1 9.0 8.7 9.0 9.4 10.2 6.8 9.7 10.3 8.7Less than one hour 42.5 41.8 43.6 43.3 39.8 38.3 41.4 40.7 45.1 38.1 34.9 37.0 32.01 to 2 hours 31.0 30.5 31.7 29.4 32.0 32.9 31.4 31.3 30.6 35.6 28.7 27.5 30.43 to 5 hours 11.6 11.9 11.0 11.0 13.1 13.8 12.5 12.6 10.3 13.8 15.5 14.6 16.76 to 10 hours 3.2 3.4 2.8 3.2 3.8 3.9 3.6 3.7 2.5 3.8 6.6 6.2 7.111 to 15 hours 1.0 1.2 0.8 1.1 1.3 1.4 1.2 1.2 0.7 1.1 2.3 2.1 2.516 to 20 hours 0.4 0.5 0.3 0.4 0.5 0.5 0.5 0.5 0.3 0.4 1.0 1.0 1.1Over 20 hours 0.4 0.5 0.3 0.4 0.6 0.6 0.5 0.6 0.3 0.4 1.4 1.3 1.6
Exercise or sportsNone 5.0 5.6 4.1 5.8 5.3 5.2 4.8 5.7 4.3 3.3 10.8 11.3 10.0Less than one hour 8.7 9.0 8.2 9.0 8.9 9.2 7.8 9.2 8.5 7.3 10.4 10.0 11.11 to 2 hours 14.7 14.5 15.0 15.0 13.8 14.0 13.3 13.8 15.3 13.9 16.3 16.1 16.73 to 5 hours 18.4 17.7 19.6 18.0 17.4 17.6 17.0 17.3 19.4 20.4 18.8 19.4 18.06 to 10 hours 18.7 17.6 20.4 18.0 17.0 17.5 18.0 16.0 20.3 21.0 14.4 14.5 14.211 to 15 hours 14.3 13.9 14.9 13.4 14.6 14.8 15.3 14.2 14.7 15.5 9.1 8.5 9.916 to 20 hours 8.8 9.0 8.4 8.7 9.5 9.0 10.2 9.6 8.3 8.9 6.1 5.9 6.4Over 20 hours 11.4 12.7 9.3 12.1 13.5 12.7 13.7 14.2 9.3 9.6 14.1 14.3 13.8
PartyingNone 30.3 30.6 29.9 29.3 32.2 28.7 25.9 39.0 30.4 28.3 19.7 19.5 20.1Less than one hour 15.6 15.1 16.4 15.0 15.2 15.2 14.3 15.7 16.5 16.0 12.6 11.9 13.51 to 2 hours 17.3 16.8 18.1 17.2 16.3 16.6 18.0 15.1 17.9 18.5 19.2 19.2 19.23 to 5 hours 18.5 18.3 18.7 18.6 17.9 19.3 20.8 15.1 18.3 20.1 24.3 24.5 24.16 to 10 hours 10.5 10.7 10.2 11.0 10.2 11.3 12.2 8.2 10.1 10.6 11.0 10.8 11.211 to 15 hours 4.1 4.4 3.8 4.5 4.1 4.5 4.8 3.4 3.8 3.7 5.1 5.5 4.516 to 20 hours 1.8 1.9 1.5 2.0 1.9 2.0 2.1 1.6 1.5 1.4 3.7 4.1 3.1Over 20 hours 1.9 2.3 1.4 2.4 2.1 2.4 1.9 1.9 1.4 1.5 4.4 4.5 4.3
2009 CIRP Freshman SurveyWeighted National Norms—All Respondents
Baccalaureate Black Colleges All Bacc Institutions 4-year Colleges Universities and Universities
Institutions 4-yr Coll Universities Public Private Nonsec Catholic Oth Relig Public Private All HBCU Public Private
34
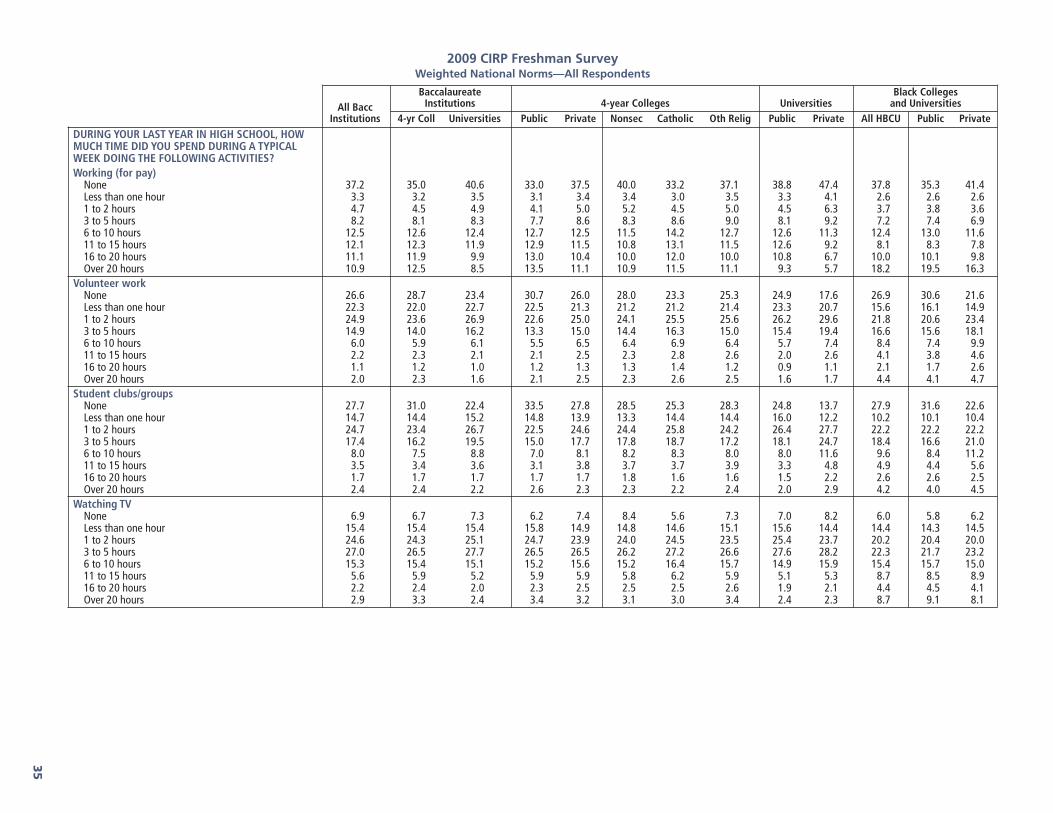
DURING YOUR LAST YEAR IN HIGH SCHOOL, HOWMUCH TIME DID YOU SPEND DURING A TYPICALWEEK DOING THE FOLLOWING ACTIVITIES?Working (for pay)
None 37.2 35.0 40.6 33.0 37.5 40.0 33.2 37.1 38.8 47.4 37.8 35.3 41.4Less than one hour 3.3 3.2 3.5 3.1 3.4 3.4 3.0 3.5 3.3 4.1 2.6 2.6 2.61 to 2 hours 4.7 4.5 4.9 4.1 5.0 5.2 4.5 5.0 4.5 6.3 3.7 3.8 3.63 to 5 hours 8.2 8.1 8.3 7.7 8.6 8.3 8.6 9.0 8.1 9.2 7.2 7.4 6.96 to 10 hours 12.5 12.6 12.4 12.7 12.5 11.5 14.2 12.7 12.6 11.3 12.4 13.0 11.611 to 15 hours 12.1 12.3 11.9 12.9 11.5 10.8 13.1 11.5 12.6 9.2 8.1 8.3 7.816 to 20 hours 11.1 11.9 9.9 13.0 10.4 10.0 12.0 10.0 10.8 6.7 10.0 10.1 9.8Over 20 hours 10.9 12.5 8.5 13.5 11.1 10.9 11.5 11.1 9.3 5.7 18.2 19.5 16.3
Volunteer workNone 26.6 28.7 23.4 30.7 26.0 28.0 23.3 25.3 24.9 17.6 26.9 30.6 21.6Less than one hour 22.3 22.0 22.7 22.5 21.3 21.2 21.2 21.4 23.3 20.7 15.6 16.1 14.91 to 2 hours 24.9 23.6 26.9 22.6 25.0 24.1 25.5 25.6 26.2 29.6 21.8 20.6 23.43 to 5 hours 14.9 14.0 16.2 13.3 15.0 14.4 16.3 15.0 15.4 19.4 16.6 15.6 18.16 to 10 hours 6.0 5.9 6.1 5.5 6.5 6.4 6.9 6.4 5.7 7.4 8.4 7.4 9.911 to 15 hours 2.2 2.3 2.1 2.1 2.5 2.3 2.8 2.6 2.0 2.6 4.1 3.8 4.616 to 20 hours 1.1 1.2 1.0 1.2 1.3 1.3 1.4 1.2 0.9 1.1 2.1 1.7 2.6Over 20 hours 2.0 2.3 1.6 2.1 2.5 2.3 2.6 2.5 1.6 1.7 4.4 4.1 4.7
Student clubs/groupsNone 27.7 31.0 22.4 33.5 27.8 28.5 25.3 28.3 24.8 13.7 27.9 31.6 22.6Less than one hour 14.7 14.4 15.2 14.8 13.9 13.3 14.4 14.4 16.0 12.2 10.2 10.1 10.41 to 2 hours 24.7 23.4 26.7 22.5 24.6 24.4 25.8 24.2 26.4 27.7 22.2 22.2 22.23 to 5 hours 17.4 16.2 19.5 15.0 17.7 17.8 18.7 17.2 18.1 24.7 18.4 16.6 21.06 to 10 hours 8.0 7.5 8.8 7.0 8.1 8.2 8.3 8.0 8.0 11.6 9.6 8.4 11.211 to 15 hours 3.5 3.4 3.6 3.1 3.8 3.7 3.7 3.9 3.3 4.8 4.9 4.4 5.616 to 20 hours 1.7 1.7 1.7 1.7 1.7 1.8 1.6 1.6 1.5 2.2 2.6 2.6 2.5Over 20 hours 2.4 2.4 2.2 2.6 2.3 2.3 2.2 2.4 2.0 2.9 4.2 4.0 4.5
Watching TVNone 6.9 6.7 7.3 6.2 7.4 8.4 5.6 7.3 7.0 8.2 6.0 5.8 6.2Less than one hour 15.4 15.4 15.4 15.8 14.9 14.8 14.6 15.1 15.6 14.4 14.4 14.3 14.51 to 2 hours 24.6 24.3 25.1 24.7 23.9 24.0 24.5 23.5 25.4 23.7 20.2 20.4 20.03 to 5 hours 27.0 26.5 27.7 26.5 26.5 26.2 27.2 26.6 27.6 28.2 22.3 21.7 23.26 to 10 hours 15.3 15.4 15.1 15.2 15.6 15.2 16.4 15.7 14.9 15.9 15.4 15.7 15.011 to 15 hours 5.6 5.9 5.2 5.9 5.9 5.8 6.2 5.9 5.1 5.3 8.7 8.5 8.916 to 20 hours 2.2 2.4 2.0 2.3 2.5 2.5 2.5 2.6 1.9 2.1 4.4 4.5 4.1Over 20 hours 2.9 3.3 2.4 3.4 3.2 3.1 3.0 3.4 2.4 2.3 8.7 9.1 8.1
2009 CIRP Freshman SurveyWeighted National Norms—All Respondents
Baccalaureate Black Colleges All Bacc Institutions 4-year Colleges Universities and Universities
Institutions 4-yr Coll Universities Public Private Nonsec Catholic Oth Relig Public Private All HBCU Public Private
35

DURING YOUR LAST YEAR IN HIGH SCHOOL, HOWMUCH TIME DID YOU SPEND DURING A TYPICALWEEK DOING THE FOLLOWING ACTIVITIES?Household/childcare duties
None 19.3 19.4 19.2 18.8 20.1 22.7 17.3 18.9 19.0 20.2 17.9 18.6 16.8Less than one hour 20.8 19.5 22.9 19.4 19.7 20.3 19.1 19.3 22.9 22.9 15.4 15.2 15.61 to 2 hours 30.1 29.3 31.3 29.5 29.2 28.5 30.1 29.5 31.3 31.3 25.0 24.5 25.73 to 5 hours 18.5 19.1 17.7 19.2 18.9 17.9 20.2 19.5 17.7 17.5 19.3 18.4 20.66 to 10 hours 6.4 7.1 5.4 7.2 6.8 6.0 7.6 7.4 5.5 5.1 9.9 9.9 9.911 to 15 hours 2.3 2.7 1.8 2.9 2.4 2.3 2.7 2.5 1.8 1.6 4.6 4.8 4.216 to 20 hours 0.9 1.1 0.7 1.1 1.1 1.0 1.1 1.2 0.7 0.6 2.1 2.0 2.2Over 20 hours 1.5 1.8 1.0 1.9 1.6 1.5 1.9 1.8 1.0 0.8 6.0 6.6 5.1
Reading for pleasureNone 25.7 27.2 23.3 28.4 25.6 24.4 26.4 26.4 24.5 18.7 28.3 31.7 23.3Less than one hour 23.4 22.4 25.1 22.5 22.1 21.8 24.0 21.6 25.3 24.2 22.3 22.1 22.71 to 2 hours 23.1 22.2 24.5 21.8 22.7 23.4 22.8 21.9 24.0 26.6 22.5 20.8 24.83 to 5 hours 15.6 15.3 16.1 14.8 16.0 16.6 14.9 16.0 15.5 18.4 13.1 12.0 14.86 to 10 hours 7.1 7.2 6.8 7.0 7.6 7.8 6.7 7.8 6.6 7.6 6.4 6.0 7.011 to 15 hours 2.7 3.0 2.3 3.0 3.1 3.2 2.8 3.2 2.2 2.5 3.4 3.4 3.516 to 20 hours 1.1 1.2 0.9 1.2 1.3 1.3 1.2 1.4 0.9 0.9 1.2 1.1 1.4Over 20 hours 1.3 1.5 1.0 1.4 1.5 1.6 1.2 1.6 1.0 1.2 2.7 2.8 2.6
Playing video/computer gamesNone 41.0 40.7 41.5 40.5 40.9 40.3 43.7 40.0 40.8 44.0 40.7 39.2 42.8Less than one hour 19.8 20.1 19.4 20.4 19.7 19.1 20.1 20.2 19.5 19.2 18.6 18.3 19.01 to 2 hours 15.2 15.2 15.1 15.3 15.2 15.1 14.7 15.4 15.2 14.8 16.2 17.4 14.53 to 5 hours 11.7 11.5 12.1 11.3 11.7 12.0 10.5 12.0 12.3 11.2 11.3 11.1 11.66 to 10 hours 6.3 6.3 6.4 6.4 6.2 6.5 5.9 6.1 6.5 5.9 5.8 6.3 5.111 to 15 hours 2.8 2.9 2.7 2.8 3.0 3.4 2.5 3.0 2.7 2.5 3.4 3.2 3.716 to 20 hours 1.3 1.3 1.2 1.3 1.3 1.5 1.0 1.3 1.2 1.0 1.3 1.5 1.1Over 20 hours 1.9 2.0 1.7 2.1 1.9 2.0 1.5 1.9 1.8 1.4 2.6 2.9 2.2
Online social networks (MySpace, Facebook, etc.)None 8.1 8.4 7.7 9.2 7.4 7.0 7.7 7.6 8.2 6.0 8.2 9.1 6.8Less than one hour 18.4 18.0 19.1 19.4 16.2 16.1 16.8 15.9 20.0 16.0 15.5 16.6 14.01 to 2 hours 27.3 26.4 28.8 26.4 26.3 26.7 26.4 25.9 29.0 28.3 21.6 21.4 22.03 to 5 hours 24.4 24.0 25.1 23.0 25.2 25.2 25.1 25.2 24.5 27.5 20.6 20.3 21.26 to 10 hours 11.6 11.9 11.0 11.2 12.9 13.0 12.2 13.1 10.6 12.8 12.9 12.0 14.211 to 15 hours 4.7 5.1 4.1 4.7 5.6 5.5 5.7 5.7 3.9 4.7 6.9 6.7 7.316 to 20 hours 2.2 2.5 1.8 2.3 2.6 2.7 2.4 2.7 1.8 2.1 4.2 3.9 4.6Over 20 hours 3.1 3.7 2.2 3.7 3.8 3.8 3.7 3.9 2.1 2.5 10.1 10.2 10.0
The following reasons were “very important” indeciding to go to this particular college:
My parents wanted me to come here 18.8 20.0 17.0 20.4 19.5 17.2 22.0 20.6 16.8 17.5 27.9 28.8 26.5My relatives wanted me to come here 7.3 8.0 6.0 8.4 7.5 6.4 8.4 8.3 5.9 6.4 18.2 20.2 15.4My teacher advised me 7.8 8.8 6.2 9.0 8.5 9.2 8.7 7.6 6.1 6.8 13.2 14.3 11.5This college has a very good academic reputation 63.6 60.3 68.9 56.0 66.1 67.6 69.6 63.0 65.8 80.3 58.1 47.7 73.0This college has a good reputation for its social
activities 39.3 37.0 43.0 35.8 38.5 36.7 41.2 39.2 43.6 40.6 45.8 44.1 48.2I was offered financial assistance 44.7 48.9 38.0 39.5 61.2 55.3 65.2 65.4 35.2 48.6 53.7 55.9 50.4
2009 CIRP Freshman SurveyWeighted National Norms—All Respondents
Baccalaureate Black Colleges All Bacc Institutions 4-year Colleges Universities and Universities
Institutions 4-yr Coll Universities Public Private Nonsec Catholic Oth Relig Public Private All HBCU Public Private
36

The following reasons were “very important” indeciding to go to this particular college:
The cost of attending this college 41.6 43.7 38.3 52.1 32.7 30.4 38.3 32.3 41.2 27.3 47.2 56.3 34.0High school counselor advised me 10.3 11.4 8.6 11.9 10.8 11.2 13.0 9.2 8.1 10.2 16.6 17.6 15.2Private college counselor advised me 3.6 4.2 2.7 3.2 5.6 5.3 5.7 5.8 2.2 4.7 7.1 6.8 7.5I wanted to live near home 20.1 23.4 14.9 26.5 19.3 16.2 26.0 19.3 15.9 11.1 21.3 23.9 17.3Not offered aid by first choice 8.9 9.0 8.6 9.0 9.1 8.1 11.3 9.0 8.9 7.6 15.0 16.4 12.9Could not afford first choice 12.2 12.6 11.6 14.8 9.7 9.1 11.9 9.4 12.8 7.4 18.2 21.6 13.3This college’s graduates gain admission to top
graduate/professional schools 34.6 30.9 40.6 26.6 36.4 37.7 40.8 33.0 37.3 52.5 41.8 30.7 57.7This college’s graduates get good jobs 56.5 53.8 60.8 50.0 58.7 60.3 65.0 54.1 58.4 69.5 59.1 51.5 70.0I was attracted by the religious affiliation/orientation
of the college 7.8 9.6 5.0 4.5 16.4 4.9 17.6 27.5 2.6 13.7 15.7 13.3 19.3I wanted to go to a school about the size of this
college 39.8 43.5 34.0 37.2 51.9 49.5 52.4 54.2 31.2 44.3 38.2 35.9 41.5Rankings in national magazines 18.5 13.8 25.9 11.2 17.3 20.2 17.3 14.4 23.6 34.3 20.4 12.7 31.6Information from a website 19.2 19.1 19.4 17.4 21.2 24.4 19.5 18.6 17.9 24.9 28.0 25.2 32.0I was admitted through an Early Action or Early
Decision program 12.9 12.4 13.8 9.9 15.7 17.8 16.2 13.2 10.9 24.2 12.8 10.9 15.5The athletic department recruited me 8.9 12.0 3.8 8.2 17.1 15.3 14.7 20.1 3.3 5.8 11.1 12.8 8.5A visit to the campus 41.4 42.8 39.1 37.3 50.0 51.7 47.5 49.5 36.6 48.5 40.6 40.5 40.9Ability to take online courses 2.7 3.0 2.0 3.4 2.6 2.1 3.0 2.9 2.1 1.7 6.9 8.2 4.9
Your probable field of study:Arts and Humanities
Art, fine and applied 3.2 4.2 1.6 2.6 6.4 12.6 1.6 2.2 1.8 1.1 1.1 1.3 0.7English (language and literature) 1.9 2.0 1.8 1.8 2.3 2.5 1.9 2.3 1.7 2.2 1.3 0.7 2.0History 1.5 1.6 1.2 1.5 1.7 1.6 1.6 1.9 1.1 1.6 0.4 0.3 0.5Journalism 1.5 1.4 1.7 1.4 1.2 1.1 1.5 1.2 1.6 1.9 1.8 2.1 1.5Language and Literature (except English) 0.7 0.6 0.8 0.5 0.7 0.7 0.4 0.8 0.7 1.0 0.1 0.1 0.1Music 1.5 1.8 1.1 1.8 1.7 1.0 0.6 2.9 1.2 1.1 1.7 1.9 1.3Philosophy 0.3 0.3 0.3 0.2 0.4 0.5 0.3 0.4 0.3 0.5 0.2 0.1 0.3Speech 0.1 0.1 0.1 0.1 0.1 0.0 0.1 0.1 0.1 0.1 0.1 0.1 0.1Theater or Drama 1.1 1.4 0.8 1.4 1.3 1.5 0.4 1.5 0.7 1.0 0.8 0.5 1.2Theology or Religion 0.2 0.3 0.1 0.0 0.6 0.1 0.3 1.3 0.0 0.2 0.0 0.0 0.1Other Arts and Humanities 1.3 1.5 1.1 1.3 1.6 2.5 0.6 1.2 1.1 1.1 0.8 0.8 0.7
Biological ScienceBiology (general) 5.6 4.7 6.9 4.1 5.4 4.6 7.5 5.3 6.7 7.8 10.2 7.3 14.4Biochemistry or Biophysics 1.4 0.9 2.2 0.7 1.1 1.2 1.1 1.1 2.2 2.1 0.8 0.5 1.3Botany 0.0 0.0 0.1 0.0 0.0 0.0 0.0 0.0 0.1 0.0 0.0 0.0 0.0Environmental Science 0.8 0.9 0.8 0.7 1.1 1.4 0.4 1.1 0.8 0.7 0.2 0.3 0.1Marine (Life) Science 0.4 0.5 0.3 0.6 0.4 0.5 0.2 0.5 0.3 0.2 0.1 0.0 0.1Microbiology or Bacteriology 0.3 0.2 0.5 0.2 0.1 0.2 0.1 0.1 0.5 0.3 0.2 0.2 0.2Zoology 0.4 0.4 0.5 0.4 0.4 0.6 0.2 0.4 0.5 0.1 0.1 0.1 0.1Other Biological Science 0.8 0.5 1.2 0.5 0.6 0.7 0.6 0.4 1.2 1.0 0.5 0.5 0.5
2009 CIRP Freshman SurveyWeighted National Norms—All Respondents
Baccalaureate Black Colleges All Bacc Institutions 4-year Colleges Universities and Universities
Institutions 4-yr Coll Universities Public Private Nonsec Catholic Oth Relig Public Private All HBCU Public Private
37

Your probable field of study (continued):Business
Accounting 2.3 2.3 2.2 2.3 2.4 1.9 3.5 2.3 2.3 1.9 3.0 3.5 2.3Business Administration (general) 3.0 3.1 2.9 3.0 3.3 3.4 2.9 3.3 2.9 2.7 3.0 3.4 2.4Finance 1.4 1.0 2.1 0.8 1.1 1.2 1.8 0.7 1.7 3.5 1.0 0.6 1.4International Business 1.2 1.2 1.4 0.9 1.5 1.7 1.6 1.1 1.1 2.3 0.5 0.3 0.9Marketing 2.4 2.3 2.5 2.3 2.4 2.3 3.8 1.7 2.5 2.5 2.6 2.4 2.8Management 3.2 3.5 2.8 3.5 3.7 3.8 3.8 3.4 2.9 2.4 4.1 3.9 4.4Secretarial Studies 0.0 0.0 0.0 0.0 0.0 0.0 0.0 0.0 0.0 0.0 0.0 0.0 0.0Other Business 0.8 0.7 1.0 0.5 1.0 1.3 0.7 0.9 1.0 1.1 0.7 0.8 0.5
EducationBusiness Education 0.1 0.1 0.1 0.1 0.1 0.1 0.0 0.1 0.1 0.1 0.2 0.2 0.2Elementary Education 3.6 4.9 1.5 5.6 4.1 2.4 4.3 5.7 1.7 1.0 4.3 5.6 2.4Music or Art Education 0.6 0.9 0.3 0.9 0.8 0.5 0.3 1.3 0.4 0.2 0.8 1.2 0.3Physical Education or Recreation 0.8 1.2 0.2 1.3 1.0 0.6 0.5 1.6 0.3 0.1 1.9 2.5 0.9Secondary Education 2.2 2.8 1.2 3.1 2.5 1.5 2.9 3.3 1.3 0.8 2.3 3.1 1.1Special Education 0.5 0.7 0.3 0.9 0.6 0.3 0.9 0.7 0.3 0.2 0.4 0.5 0.2Other Education 0.3 0.4 0.2 0.5 0.3 0.2 0.2 0.4 0.2 0.2 0.3 0.4 0.2
EngineeringAeronautical or Astronautical Engineering 0.9 0.7 1.2 1.0 0.2 0.3 0.1 0.1 1.4 0.5 0.2 0.1 0.4Civil Engineering 1.3 0.9 1.9 1.2 0.5 0.4 0.8 0.6 2.0 1.4 0.8 0.9 0.7Chemical Engineering 1.0 0.3 1.9 0.4 0.3 0.3 0.3 0.2 1.9 1.8 0.2 0.1 0.4Computer Engineering 1.1 0.8 1.6 1.1 0.5 0.6 0.5 0.5 1.8 1.0 1.6 1.7 1.5Electrical or Electronic Engineering 1.0 0.7 1.6 0.9 0.4 0.5 0.4 0.3 1.8 1.1 1.1 1.5 0.4Industrial Engineering 0.2 0.1 0.4 0.1 0.1 0.1 0.0 0.0 0.5 0.2 0.5 0.8 0.0Mechanical Engineering 2.4 1.6 3.7 2.1 1.1 1.5 0.9 0.7 3.9 2.8 1.1 1.3 1.0Other Engineering 1.8 1.0 3.1 1.4 0.6 0.8 0.4 0.5 3.0 3.4 0.8 0.8 0.7
Physical ScienceAstronomy 0.1 0.1 0.1 0.1 0.1 0.1 0.0 0.1 0.1 0.1 0.0 0.0 0.0Atmospheric Science (incl. Meteorology) 0.1 0.1 0.2 0.1 0.1 0.0 0.0 0.1 0.3 0.1 0.0 0.0 0.0Chemistry 1.2 1.2 1.3 1.1 1.2 1.1 1.4 1.3 1.2 1.8 2.0 1.0 3.5Earth Science 0.2 0.2 0.2 0.2 0.2 0.2 0.0 0.1 0.2 0.1 0.0 0.0 0.0Marine Science (incl. Oceanography) 0.1 0.2 0.1 0.2 0.1 0.2 0.0 0.1 0.1 0.1 0.0 0.0 0.0Mathematics 0.9 0.8 1.0 0.7 0.9 1.0 0.8 0.8 0.9 1.3 0.4 0.2 0.8Physics 0.6 0.5 0.7 0.5 0.6 0.7 0.3 0.6 0.6 1.0 0.3 0.2 0.5Other Physical Science 0.2 0.2 0.2 0.2 0.2 0.2 0.2 0.3 0.3 0.2 0.1 0.1 0.1
ProfessionalArchitecture or Urban Planning 0.6 0.4 0.9 0.4 0.4 0.6 0.3 0.2 1.0 0.7 0.3 0.4 0.2Family & Consumer Sciences 0.2 0.1 0.2 0.2 0.1 0.0 0.1 0.1 0.2 0.2 0.2 0.3 0.0Health Technology (medical, dental, laboratory) 0.5 0.5 0.5 0.6 0.5 0.3 0.7 0.5 0.5 0.5 0.3 0.2 0.4Library or Archival Science 0.1 0.1 0.1 0.1 0.1 0.1 0.1 0.1 0.1 0.0 0.1 0.1 0.1Medicine, Dentistry, Veterinary Medicine 3.9 3.2 4.9 2.6 3.9 3.1 4.7 4.4 4.5 6.4 3.2 1.7 5.3Nursing 4.7 5.6 3.2 6.2 4.8 2.6 10.6 4.3 3.5 2.1 6.4 8.1 3.8Pharmacy 1.3 1.3 1.2 0.9 1.8 1.6 2.1 1.7 1.1 1.8 2.4 0.7 4.9Therapy (occupational, physical, speech) 2.3 2.5 2.0 2.4 2.5 1.6 3.6 3.0 2.3 0.8 2.2 3.2 0.9Other Professional 0.8 0.9 0.7 0.9 0.8 0.6 1.2 0.8 0.6 0.9 0.6 0.6 0.6
2009 CIRP Freshman SurveyWeighted National Norms—All Respondents
Baccalaureate Black Colleges All Bacc Institutions 4-year Colleges Universities and Universities
Institutions 4-yr Coll Universities Public Private Nonsec Catholic Oth Relig Public Private All HBCU Public Private
38

Your probable field of study (continued):Social Science
Anthropology 0.5 0.4 0.6 0.3 0.5 0.7 0.1 0.4 0.5 0.7 0.0 0.0 0.1Economics 0.7 0.5 1.1 0.3 0.8 1.3 0.4 0.4 0.7 2.5 0.3 0.0 0.7Ethnic Studies 0.1 0.1 0.1 0.0 0.1 0.1 0.0 0.1 0.1 0.1 0.0 0.0 0.0Geography 0.1 0.1 0.1 0.1 0.1 0.1 0.0 0.1 0.1 0.0 0.1 0.1 0.1Political Science (gov’t., international relations) 3.3 2.9 4.0 2.4 3.5 3.9 3.1 3.3 3.1 7.3 3.4 2.1 5.3Psychology 5.2 5.6 4.6 5.7 5.5 5.1 5.9 5.7 4.8 4.2 7.5 7.5 7.4Public Policy 0.1 0.1 0.2 0.1 0.1 0.1 0.0 0.1 0.1 0.5 0.1 0.0 0.1Social Work 0.6 0.8 0.4 0.9 0.8 0.4 0.7 1.2 0.4 0.2 2.5 3.0 1.8Sociology 0.7 0.8 0.7 0.9 0.6 0.6 0.7 0.6 0.7 0.5 1.1 1.1 1.2Women’s Studies 0.0 0.0 0.0 0.0 0.0 0.1 0.0 0.0 0.0 0.0 0.1 0.1 0.1Other Social Science 0.4 0.4 0.4 0.4 0.3 0.3 0.3 0.4 0.4 0.3 0.4 0.4 0.3
TechnicalBuilding Trades 0.0 0.0 0.0 0.0 0.0 0.0 0.0 0.0 0.0 0.0 0.0 0.0 0.0Data Processing or Computer Programming 0.6 0.6 0.5 0.7 0.5 0.5 0.3 0.7 0.5 0.3 0.6 0.5 0.8Drafting or Design 0.3 0.3 0.2 0.2 0.4 0.7 0.1 0.3 0.2 0.1 0.4 0.5 0.1Electronics 0.1 0.1 0.0 0.1 0.1 0.1 0.0 0.0 0.0 0.0 0.0 0.1 0.0Mechanics 0.0 0.0 0.0 0.0 0.0 0.0 0.0 0.1 0.0 0.0 0.0 0.0 0.0Other Technical 0.1 0.1 0.1 0.1 0.1 0.1 0.1 0.1 0.1 0.1 0.0 0.1 0.0
Other FieldsAgriculture 0.6 0.6 0.6 0.8 0.2 0.2 0.0 0.3 0.7 0.2 1.0 1.6 0.0Communications 1.9 1.7 2.1 1.8 1.7 1.5 2.0 1.7 2.2 2.0 2.1 2.4 1.5Computer Science 1.0 1.0 1.0 1.1 0.8 0.8 0.7 0.8 1.1 0.7 2.0 2.2 1.7Forestry 0.1 0.1 0.1 0.1 0.0 0.0 0.0 0.1 0.1 0.0 0.1 0.2 0.0Kinesiology 0.8 0.8 0.7 1.1 0.5 0.2 0.3 0.8 0.9 0.1 0.2 0.1 0.2Law Enforcement 1.5 2.1 0.4 2.4 1.8 1.6 1.5 2.2 0.5 0.3 3.6 3.8 3.2Military Science 0.1 0.2 0.1 0.3 0.1 0.1 0.1 0.1 0.1 0.1 0.1 0.0 0.1Other Field 1.5 1.7 1.2 1.4 2.0 2.4 1.1 2.1 1.3 0.9 1.7 2.2 1.0Undecided 6.8 6.9 6.5 7.6 6.0 6.0 6.3 5.8 6.7 5.8 2.8 2.8 2.8
Objectives considered to be “Essential” or “Very Important”:
Becoming accomplished in one of the performing arts(acting, dancing, etc.) 16.1 17.3 14.1 16.5 18.4 19.4 14.0 19.4 13.3 16.8 26.5 28.6 23.5
Becoming an authority in my field 58.5 57.8 59.5 57.3 58.5 58.7 59.1 58.0 58.1 64.8 75.0 73.9 76.6Obtaining recognition from my colleagues for
contributions to my special field 56.3 55.0 58.3 54.9 55.3 57.2 58.0 52.0 57.6 60.8 68.9 68.6 69.4Influencing the political structure 20.8 20.9 20.8 20.4 21.5 21.3 21.5 21.6 19.5 25.3 38.5 37.7 39.6Influencing social values 42.1 43.3 40.2 41.9 45.2 43.2 45.5 47.0 38.8 45.3 59.4 57.0 63.0Raising a family 74.7 74.9 74.3 75.3 74.4 69.7 79.7 76.7 74.1 74.9 77.8 77.3 78.6Being very well off financially 78.1 77.7 78.8 80.0 74.7 74.0 82.2 71.7 79.8 74.8 90.2 89.3 91.5Helping others who are in difficulty 69.1 69.2 68.9 68.1 70.8 67.1 74.1 73.1 67.7 73.5 79.8 77.8 82.8Making a theoretical contribution to science 21.6 19.3 25.3 18.8 19.9 19.5 22.6 19.0 24.9 26.6 32.3 30.2 35.4Writing original works (poems, novels, short stories,
etc.) 16.0 17.0 14.4 15.9 18.4 19.9 15.6 18.1 13.7 17.0 27.7 28.3 26.9Creating artistic work (painting, sculpture,
decorating, etc.) 16.2 17.7 13.8 15.9 20.0 26.1 13.9 16.6 13.7 14.2 22.1 23.7 19.9Becoming successful in a business of my own 41.9 42.3 41.4 41.5 43.4 45.7 44.1 40.6 41.0 42.7 68.3 67.1 70.0Becoming involved in programs to clean up the
environment 26.9 26.2 28.1 24.5 28.5 31.0 27.2 26.4 27.5 30.2 41.8 39.8 44.8
2009 CIRP Freshman SurveyWeighted National Norms—All Respondents
Baccalaureate Black Colleges All Bacc Institutions 4-year Colleges Universities and Universities
Institutions 4-yr Coll Universities Public Private Nonsec Catholic Oth Relig Public Private All HBCU Public Private
39

Objectives considered to be “Essential” or “Very Important”:
Developing a meaningful philosophy of life 48.0 46.9 49.9 45.2 49.1 50.6 47.1 48.6 48.1 56.2 59.2 57.0 62.3Participating in a community action program 29.8 29.1 30.8 26.7 32.3 30.9 34.1 33.0 28.5 38.9 51.0 46.4 57.5Helping to promote racial understanding 33.1 33.0 33.4 31.2 35.4 35.4 35.6 35.2 32.1 37.9 57.0 52.6 63.5Keeping up to date with political affairs 36.0 33.4 40.1 31.9 35.5 37.5 35.3 33.6 37.9 48.3 44.5 40.9 49.8Becoming a community leader 35.8 35.2 36.8 33.8 36.9 35.6 37.9 37.9 34.9 43.9 57.0 53.5 61.9Improving my understanding of other
countries/cultures 49.4 47.6 52.4 44.4 51.6 54.3 48.9 50.2 49.9 61.5 57.7 52.8 64.7Adopting “green” practices to protect the
environment 41.6 39.6 44.8 37.9 41.9 46.8 41.2 37.1 44.0 47.6 43.8 41.8 46.5Student estimates “Very Good Chance” that they will:
Change major field 13.5 12.4 15.1 13.3 11.3 11.8 11.2 10.8 15.0 15.5 9.1 9.2 9.0Change career choice 12.8 11.7 14.6 11.6 12.0 13.2 10.8 11.3 13.9 17.0 7.5 7.8 7.2Participate in student government 7.1 6.9 7.3 6.6 7.3 7.3 7.5 7.4 6.7 9.5 16.9 15.7 18.7Get a job to help pay for college expenses 49.3 49.1 49.6 49.1 49.0 48.5 50.3 48.9 51.0 44.8 43.8 44.0 43.4Work full-time while attending college 6.8 8.1 4.8 9.9 5.8 5.6 6.7 5.5 5.0 4.0 10.9 12.0 9.2Join a social fraternity or sorority 10.9 10.1 12.2 11.1 8.7 7.6 7.1 10.6 12.0 13.0 37.9 37.5 38.6Play club, intramural, or recreational sports 32.4 30.5 35.5 29.4 31.9 31.1 33.6 31.9 34.9 37.9 25.1 24.5 26.0Play intercollegiate athletics (eg NCAA or
NAIA-sponsored) 13.7 18.2 6.6 13.9 23.8 22.3 20.4 27.0 6.0 9.0 19.4 20.9 17.3Make at least a “B” average 66.2 64.6 68.8 62.3 67.5 68.1 68.9 66.2 67.2 74.4 69.6 67.6 72.6Need extra time to complete your degree
requirements 6.3 6.8 5.6 7.4 6.1 5.1 6.3 6.9 6.1 3.9 11.1 13.0 8.4Participate in student protests or demonstrations 6.0 5.8 6.2 5.1 6.7 7.9 5.9 5.8 5.7 8.1 10.8 9.5 12.7Transfer to another college before graduating 6.8 8.2 4.4 9.7 6.2 5.2 5.5 7.7 4.8 2.9 12.9 15.1 9.8Be satisfied with your college 56.4 53.6 60.8 49.8 58.5 60.0 57.9 57.2 59.0 67.6 47.5 40.9 57.2Participate in volunteer or community service work 30.8 28.6 34.2 24.1 34.5 32.1 35.9 36.2 30.5 47.8 39.9 31.6 51.9Seek personal counseling 8.5 8.5 8.6 8.6 8.4 8.5 8.6 8.1 8.7 8.0 15.0 14.7 15.5Communicate regularly with your professors 37.2 37.0 37.4 33.0 42.3 44.8 40.4 40.6 34.5 47.9 45.8 41.4 52.1Socialize with someone of another racial/ethnic group 65.0 62.6 68.9 60.4 65.4 67.3 62.5 64.9 66.9 76.0 57.2 53.0 63.1Participate in student clubs/groups 45.9 42.1 51.8 38.9 46.3 47.6 47.3 44.5 48.4 64.2 46.5 41.4 53.8Participate in a study abroad program 30.1 27.7 33.8 22.8 34.1 37.1 31.7 32.2 30.3 46.3 28.2 23.6 34.9Have a roommate of different race/ethnicity 28.5 27.3 30.3 26.0 29.0 31.4 24.3 28.8 27.7 39.9 19.1 19.7 18.4Discuss course content with students outside of class 46.5 42.6 52.6 38.9 47.5 50.8 44.3 45.7 49.9 62.3 38.7 32.0 48.4Work on a professor’s research project 30.8 31.8 29.1 31.5 32.3 32.7 32.2 32.0 28.0 32.9 47.7 44.9 51.7
Do you give the Higher Education ResearchInstitute (HERI) permission to include your IDnumber should your college request the data foradditional research analyses?
Yes 68.2 70.0 65.1 73.0 66.0 64.4 65.2 68.1 66.7 59.5 66.0 66.7 65.0No 31.8 30.0 34.9 27.0 34.0 35.6 34.8 31.9 33.3 40.5 34.0 33.3 35.0
2009 CIRP Freshman SurveyWeighted National Norms—All Respondents
Baccalaureate Black Colleges All Bacc Institutions 4-year Colleges Universities and Universities
Institutions 4-yr Coll Universities Public Private Nonsec Catholic Oth Relig Public Private All HBCU Public Private
40

CIRP Construct: Habits of MindHigh Construct Score Group 27.7 25.8 30.8 24.2 27.9 30.3 26.7 26.0 28.2 40.3 30.6 27.0 35.9Average Construct Score Group 39.0 38.2 40.2 38.4 38.0 37.4 38.3 38.5 40.7 38.1 36.0 35.5 36.7Low Construct Score Group 33.3 36.0 29.0 37.4 34.0 32.3 35.0 35.5 31.0 21.6 33.4 37.4 27.4Mean Score 50.3 49.8 51.1 49.4 50.2 50.7 50.0 49.8 50.6 53.0 50.5 49.7 51.7
CIRP Construct: Academic Self-ConceptHigh Construct Score Group 24.4 19.6 31.8 18.1 21.7 22.6 19.2 22.0 28.6 44.0 28.2 25.7 31.8Average Construct Score Group 40.5 38.7 43.3 38.2 39.3 39.5 40.7 38.5 44.1 40.2 33.8 32.2 36.2Low Construct Score Group 35.1 41.7 24.9 43.7 38.9 37.9 40.1 39.5 27.3 15.8 38.0 42.1 32.0Mean Score 49.1 47.8 51.1 47.5 48.3 48.4 47.9 48.4 50.4 53.5 49.4 48.7 50.4
CIRP Construct: Social Self-ConceptHigh Construct Score Group 29.2 28.2 30.6 27.7 28.8 27.5 28.8 30.3 29.1 36.5 45.5 43.8 48.0Average Construct Score Group 38.0 37.5 38.8 37.6 37.3 37.5 38.0 36.9 39.1 37.6 33.0 33.1 32.8Low Construct Score Group 32.9 34.3 30.6 34.7 33.8 35.0 33.2 32.8 31.8 25.9 21.5 23.1 19.2Mean Score 49.4 49.1 49.8 49.0 49.2 48.8 49.4 49.5 49.4 51.1 53.0 52.6 53.5
CIRP Construct: Pluralistic OrientationHigh Construct Score Group 27.5 25.9 29.9 25.3 26.7 29.4 25.1 24.8 28.3 36.0 31.3 28.6 35.2Average Construct Score Group 36.7 35.8 38.1 35.9 35.7 35.9 36.4 35.2 38.1 37.8 33.6 33.5 33.7Low Construct Score Group 35.8 38.3 32.0 38.9 37.5 34.7 38.5 40.0 33.6 26.2 35.2 37.9 31.2Mean Score 49.9 49.4 50.7 49.3 49.6 50.3 49.4 49.1 50.3 52.0 50.2 49.5 51.4
CIRP Construct: Social AgencyHigh Construct Score Group 28.0 27.5 28.9 25.3 30.4 29.2 31.3 31.2 26.7 37.0 51.4 46.4 58.7Average Construct Score Group 40.4 40.2 40.7 40.4 40.0 39.0 41.2 40.3 41.0 39.6 34.2 37.3 29.6Low Construct Score Group 31.6 32.3 30.4 34.4 29.6 31.7 27.5 28.5 32.3 23.5 14.4 16.3 11.7Mean Score 48.3 48.2 48.5 47.6 48.9 48.5 49.2 49.1 48.0 50.4 53.8 52.7 55.2
CIRP Construct: College Reputation OrientationHigh Construct Score Group 32.0 28.5 37.6 24.5 33.7 34.9 38.6 30.1 34.4 49.5 38.1 27.7 53.2Average Construct Score Group 26.5 27.1 25.5 27.1 27.1 27.7 27.9 26.1 26.3 22.4 23.2 25.7 19.5Low Construct Score Group 41.5 44.4 36.9 48.4 39.2 37.4 33.5 43.9 39.3 28.2 38.7 46.6 27.3Mean Score 48.7 48.1 49.8 47.3 49.1 49.4 50.2 48.3 49.3 51.6 49.1 47.4 51.4
CIRP Construct: Likelihood of College InvolvementHigh Construct Score Group 28.2 25.3 32.9 20.9 31.1 32.3 30.4 30.2 28.8 47.8 33.9 27.4 43.3Average Construct Score Group 37.8 37.3 38.5 37.7 36.9 36.6 37.5 36.9 39.4 35.0 32.7 33.6 31.4Low Construct Score Group 34.0 37.3 28.6 41.4 32.0 31.2 32.1 32.9 31.8 17.2 33.4 39.0 25.3Mean Score 45.9 45.3 46.9 44.5 46.3 46.5 46.2 46.2 46.2 49.3 46.5 45.2 48.3
Note: CIRP Constructs are scored on a normal curve, a “Low” score represents students who are one-half standard deviation or more below the mean, a “High” score represents students who are one-half standard deviation or more above themean, and an “Average” score represents students whose scores are within one-half standard deviation of the mean.
2009 CIRP Freshman SurveyWeighted National Norms—All Respondents
Baccalaureate Black Colleges All Bacc Institutions 4-year Colleges Universities and Universities
Institutions 4-yr Coll Universities Public Private Nonsec Catholic Oth Relig Public Private All HBCU Public Private
41


2009 National Norms
FirstTime FullTime FreshmenMen


First-time, Full-time Freshmen 98,582 52,171 46,411 19,535 32,636 13,369 7,502 11,765 29,328 17,083 2,173 974 1,199How old will you be on December 31 of this year?
17 or younger 1.4 1.3 1.4 1.4 1.3 1.1 1.5 1.3 1.4 1.5 1.7 1.2 2.518 63.2 62.9 63.7 64.8 60.3 61.2 64.8 57.5 63.2 65.5 65.0 61.4 70.619 33.2 32.8 33.8 31.0 35.4 34.0 32.1 38.3 34.3 31.8 28.6 31.4 24.220 or older 2.2 2.9 1.1 2.8 3.0 3.6 1.6 2.9 1.1 1.2 4.7 6.0 2.7
Is English your native language?Yes 92.0 93.6 89.7 93.2 94.1 92.3 94.1 96.0 89.9 89.0 98.0 98.4 97.3No 8.0 6.4 10.3 6.8 5.9 7.7 5.9 4.0 10.1 11.0 2.0 1.6 2.7
In what year did you graduate from high school?2009 97.4 96.5 98.7 96.1 97.0 96.2 98.6 97.1 98.8 98.6 94.2 92.2 97.42008 1.6 2.1 0.9 2.3 1.9 2.5 0.9 1.8 0.8 1.1 3.4 4.7 1.42007 or earlier 0.8 1.1 0.3 1.2 0.9 1.1 0.5 0.8 0.4 0.3 1.8 2.4 0.9Passed G.E.D./Never completed high school 0.2 0.3 0.0 0.3 0.2 0.1 0.1 0.3 0.0 0.0 0.7 0.8 0.4
How many miles is this college from yourpermanent home?
5 or less 4.6 6.0 2.7 7.1 4.4 3.7 7.0 4.2 2.7 2.8 6.6 6.6 6.76 to 10 5.3 6.6 3.3 8.2 4.5 3.9 8.2 3.7 3.1 3.8 5.1 4.4 6.111 to 50 24.2 26.5 20.9 30.7 20.8 18.7 30.0 19.1 22.5 14.7 14.0 14.9 12.851 to 100 17.5 17.0 18.3 16.8 17.2 16.4 17.0 18.2 20.5 9.7 15.4 18.4 10.8101 to 500 33.6 28.5 40.9 25.3 33.0 30.9 28.6 37.1 42.1 36.3 35.1 39.2 28.9Over 500 14.8 15.4 13.9 12.0 20.0 26.3 9.2 17.8 9.0 32.7 23.7 16.4 34.8
What was your average grade in high school?A or A+ 19.7 13.8 28.1 12.5 15.7 15.5 13.7 16.7 24.9 40.4 5.7 3.9 8.6A- 23.7 19.9 29.1 19.1 21.0 21.6 21.5 20.2 28.5 31.5 8.5 6.4 11.9B+ 21.4 22.2 20.2 22.4 21.9 22.4 24.1 20.3 21.3 16.3 16.2 13.5 20.3B 21.3 24.8 16.2 26.8 22.1 21.8 25.0 21.2 18.1 8.8 23.0 21.8 24.8B- 8.0 10.7 4.1 11.1 10.0 10.0 9.1 10.6 4.7 2.0 18.2 20.3 15.0C+ 4.1 5.9 1.6 5.8 6.2 5.9 4.8 7.0 1.8 0.7 18.3 22.0 12.4C 1.8 2.6 0.6 2.3 3.0 2.6 1.7 3.8 0.7 0.2 9.6 11.6 6.4D 0.1 0.1 0.0 0.1 0.1 0.1 0.1 0.2 0.0 0.0 0.6 0.6 0.6
From what kind of high school did you graduate?Public school (not charter or magnet) 77.2 77.2 77.1 82.3 70.2 70.4 58.2 75.0 81.7 59.4 77.9 84.2 68.0Public charter school 1.7 2.0 1.2 2.4 1.5 1.6 1.5 1.3 1.2 1.1 4.8 4.6 5.1Public magnet school 2.8 2.5 3.2 2.4 2.5 3.3 1.4 2.2 3.1 3.6 7.8 6.0 10.7Private religious/parochial school 11.2 11.1 11.4 8.6 14.5 10.4 29.2 12.7 9.3 19.4 6.2 3.2 10.8Private independent college-prep school 6.6 6.4 6.8 3.6 10.3 13.7 9.2 7.1 4.4 16.2 3.2 1.9 5.3Home school 0.6 0.8 0.3 0.6 1.0 0.6 0.5 1.7 0.3 0.3 0.1 0.1 0.2
Prior to this term, have you ever taken courses forcredit at this institution?
No 95.7 95.6 95.9 95.7 95.4 94.9 95.1 96.0 96.0 95.4 91.8 93.9 88.6Yes 4.3 4.4 4.1 4.3 4.6 5.1 4.9 4.0 4.0 4.6 8.2 6.1 11.4
Since leaving high school, have you ever takencourses, whether for credit or not for credit, atany other institution (university, 4- or 2-yearcollege, technical, vocational, or business school)?
No 90.3 91.1 89.3 91.4 90.6 91.0 91.6 89.6 89.2 89.9 89.2 91.7 85.2Yes 9.7 8.9 10.7 8.6 9.4 9.0 8.4 10.4 10.8 10.1 10.8 8.3 14.8
45
2009 CIRP Freshman SurveyWeighted National Norms—Men
Baccalaureate Black CollegesAll Bacc Institutions 4-year Colleges Universities and Universities
Institutions 4-yr Coll Universities Public Private Nonsec Catholic Oth Relig Public Private All HBCU Public Private

Where do you plan to live during the fall term?With my family or other relatives 13.8 18.9 6.3 25.6 9.7 9.8 16.0 6.9 6.4 6.0 10.6 10.3 11.2Other private home, apartment, or room 2.9 2.7 3.3 3.5 1.6 2.3 1.2 1.1 4.0 0.4 3.4 3.4 3.4College residence hall 79.8 75.1 86.5 67.0 86.3 85.1 81.2 89.7 85.0 92.2 82.2 82.1 82.4Fraternity or sorority house 0.7 0.2 1.4 0.1 0.4 0.9 0.0 0.1 1.7 0.1 0.0 0.0 0.0Other campus student housing 2.5 2.6 2.3 3.3 1.6 1.7 1.2 1.7 2.6 1.2 3.0 3.2 2.8Other 0.3 0.4 0.3 0.4 0.3 0.3 0.2 0.4 0.3 0.2 0.7 0.9 0.3
To how many colleges other than this one did youapply for admission this year?
None 15.3 15.7 14.6 17.5 13.3 13.6 9.5 14.5 16.0 9.0 9.1 10.2 7.4One 10.6 11.0 10.1 12.6 8.8 8.1 7.2 10.2 11.1 6.1 6.4 6.4 6.4Two 13.5 14.5 12.1 16.2 12.2 10.8 10.8 14.4 13.3 7.6 13.9 15.3 11.7Three 15.8 17.4 13.7 18.2 16.2 15.2 15.7 17.6 14.7 9.7 19.4 19.9 18.6Four 13.2 13.9 12.2 14.0 13.8 12.9 15.0 14.2 12.7 10.3 17.3 17.5 17.0Five 10.0 10.1 9.8 9.3 11.2 11.5 12.9 10.3 9.6 10.7 13.8 13.9 13.7Six 6.8 5.9 7.9 4.7 7.7 8.3 9.2 6.4 7.3 10.5 6.8 5.8 8.5Seven to ten 11.6 9.0 15.4 6.2 12.8 14.8 15.5 9.6 12.7 26.1 9.1 7.7 11.3Eleven or more 3.1 2.4 4.1 1.3 4.0 4.9 4.2 2.9 2.6 10.0 4.1 3.3 5.4
Were you accepted by your first choice college?Yes 77.4 80.2 73.4 80.4 80.0 78.8 78.3 82.0 74.9 67.4 74.8 75.1 74.4No 22.6 19.8 26.6 19.6 20.0 21.2 21.7 18.0 25.1 32.6 25.2 24.9 25.6
Is this college your:First choice? 61.3 61.0 61.6 61.4 60.4 62.1 57.7 59.8 62.4 58.8 42.3 40.2 45.5Second choice? 25.3 26.6 23.3 27.3 25.7 25.9 28.2 24.3 23.2 23.9 31.1 33.1 28.0Third choice? 8.8 8.4 9.3 7.9 9.1 8.0 9.8 9.9 9.0 10.5 16.0 16.8 14.8Less than third choice? 4.7 4.0 5.7 3.4 4.8 4.0 4.3 6.0 5.5 6.8 10.6 9.9 11.7
Citizenship status:U.S. citizen 96.2 96.8 95.3 97.6 95.8 94.1 97.4 97.0 95.9 93.1 98.9 99.3 98.1Permanent resident (green card) 2.1 1.5 2.8 1.7 1.3 1.6 1.5 1.0 2.8 2.8 0.5 0.2 1.0Neither 1.7 1.6 1.8 0.7 2.9 4.3 1.1 2.1 1.3 4.0 0.6 0.4 0.9
Are you a veteran?No 99.6 99.4 99.7 99.4 99.5 99.5 99.6 99.5 99.7 99.7 98.8 98.6 99.1Yes 0.4 0.6 0.3 0.6 0.5 0.5 0.4 0.5 0.3 0.3 1.2 1.4 0.9
Are your parents:Both alive and living with each other? 72.7 69.5 77.2 68.2 71.3 72.0 74.0 69.3 76.3 80.9 35.9 33.6 39.5Both alive, divorced or living apart? 23.8 26.6 19.9 27.8 25.0 24.4 22.7 26.5 20.7 16.4 56.6 58.6 53.5One or both deceased? 3.5 3.9 2.9 4.1 3.8 3.6 3.3 4.1 3.0 2.7 7.5 7.8 7.0
Have you had any special tutoring or remedialwork in any of the following subjects?
English 8.2 9.0 6.9 8.6 9.6 10.1 8.9 9.3 6.9 6.8 15.1 17.3 11.8Reading 7.1 8.0 5.8 7.7 8.4 8.7 8.1 8.1 5.9 5.6 14.8 16.6 11.9Mathematics 12.3 14.2 9.7 13.5 15.1 15.9 15.3 14.2 9.5 10.6 16.9 16.7 17.1Social Studies 5.0 5.6 4.2 5.5 5.8 5.6 5.6 6.1 4.3 3.7 11.9 13.3 9.8Science 6.0 6.7 5.1 6.2 7.3 7.5 6.8 7.3 5.1 5.4 11.3 12.0 10.3Foreign Language 6.2 6.9 5.4 6.4 7.5 7.8 7.3 7.3 5.3 5.6 10.2 10.8 9.3Writing 6.7 7.4 5.6 7.2 7.8 8.3 7.2 7.6 5.6 5.8 10.9 12.3 8.6
2009 CIRP Freshman SurveyWeighted National Norms—Men
Baccalaureate Black Colleges All Bacc Institutions 4-year Colleges Universities and Universities
Institutions 4-yr Coll Universities Public Private Nonsec Catholic Oth Relig Public Private All HBCU Public Private
46

Do you feel you will need any special tutoring orremedial work in any of the following subjects?
English 10.2 11.7 8.0 11.6 11.9 11.7 10.0 12.9 8.5 5.9 17.4 21.0 11.8Reading 5.8 6.4 4.8 6.5 6.4 6.6 6.1 6.3 5.0 3.8 10.8 13.5 6.7Mathematics 18.8 21.9 14.3 22.5 21.0 19.3 21.1 22.8 15.4 10.2 38.9 42.3 33.5Social Studies 3.2 3.8 2.4 3.7 4.0 3.4 3.4 4.9 2.5 1.9 9.7 10.6 8.3Science 8.9 9.9 7.5 10.0 9.8 8.8 9.6 10.9 7.8 6.1 19.5 20.8 17.6Foreign Language 11.2 13.1 8.4 12.7 13.6 11.9 12.6 15.9 8.6 7.7 24.3 23.1 26.1Writing 11.6 13.2 9.3 12.5 14.2 14.9 12.0 14.4 9.7 8.1 19.3 21.9 15.3
How many Advanced Placement courses did youtake in high school?
Not offered at my high school 5.4 5.9 4.7 5.0 7.3 7.2 5.1 8.2 4.3 6.0 8.4 9.0 7.4None 28.2 36.3 17.0 37.2 34.9 32.7 37.3 36.3 19.1 9.0 45.2 50.0 37.61 to 4 47.1 46.5 47.9 47.2 45.5 45.0 48.5 44.6 49.6 41.5 39.8 36.3 45.35 to 9 16.9 10.2 26.2 9.5 11.1 13.5 8.3 9.8 23.5 36.5 5.4 3.4 8.610 to 14 2.2 0.9 3.9 0.9 1.0 1.2 0.6 0.9 3.2 6.4 0.7 0.7 0.715+ 0.3 0.2 0.3 0.2 0.2 0.3 0.2 0.2 0.3 0.6 0.5 0.5 0.4
How many Advanced Placement exams did youtake in high school?
Not offered at my high school 5.7 6.4 4.7 5.6 7.6 7.2 5.6 8.9 4.6 5.1 10.2 11.4 8.4None 35.4 44.5 22.9 46.0 42.6 39.4 45.6 44.9 25.6 12.9 52.2 56.2 46.11 to 4 42.4 40.2 45.3 40.6 39.7 40.7 41.7 37.8 46.0 42.8 32.3 28.8 37.75 to 9 14.6 8.1 23.5 7.2 9.2 11.6 6.7 7.7 20.9 33.1 3.9 2.2 6.610 to 14 1.8 0.6 3.3 0.6 0.7 0.9 0.3 0.6 2.7 5.7 0.7 0.8 0.615+ 0.2 0.1 0.2 0.1 0.2 0.3 0.1 0.2 0.1 0.4 0.6 0.6 0.7
What is the highest academic degree that youintend to obtain?—Highest Planned
None 1.0 1.2 0.6 1.1 1.4 1.6 1.0 1.5 0.6 0.5 2.5 3.0 1.9Vocational certificate 0.1 0.1 0.0 0.1 0.2 0.2 0.2 0.1 0.0 0.1 0.2 0.3 0.0Associate (A.A. or equivalent) 0.5 0.6 0.3 0.6 0.7 0.6 0.4 0.9 0.3 0.2 0.8 0.7 0.9Bachelor’s degree (B.A., B.S., etc.) 24.0 26.7 20.4 28.5 24.1 24.0 20.9 25.5 22.5 12.3 16.6 20.3 11.1Master’s degree (M.A., M.S., etc.) 42.0 42.6 41.1 44.2 40.5 40.5 43.5 39.1 41.9 37.8 37.4 41.5 31.2Ph.D. or Ed.D. 17.4 16.2 19.1 15.2 17.7 18.2 15.8 17.9 18.6 21.2 25.9 22.8 30.6M.D., D.O., D.D.S., or D.V.M. 8.6 6.4 11.7 5.3 7.8 7.0 10.6 7.4 10.5 16.0 7.3 4.5 11.5J.D. (Law) 4.8 4.2 5.7 3.4 5.4 5.9 5.6 4.7 4.4 10.3 6.0 3.6 9.6B.D. or M.DIV. (Divinity) 0.3 0.4 0.2 0.3 0.6 0.4 0.3 1.0 0.2 0.3 1.2 1.1 1.2Other 1.3 1.5 1.0 1.3 1.8 1.7 1.8 1.9 0.9 1.4 2.1 2.1 1.9
2009 CIRP Freshman SurveyWeighted National Norms—Men
Baccalaureate Black Colleges All Bacc Institutions 4-year Colleges Universities and Universities
Institutions 4-yr Coll Universities Public Private Nonsec Catholic Oth Relig Public Private All HBCU Public Private
47

What is the highest academic degree that youintend to obtain?—Highest Planned at ThisCollege
None 1.5 2.0 0.7 2.3 1.7 1.2 1.4 2.2 0.8 0.6 4.4 5.5 2.8Vocational certificate 0.2 0.2 0.1 0.2 0.2 0.1 0.2 0.3 0.1 0.1 0.7 1.1 0.1Associate (A.A. or equivalent) 1.7 2.3 0.9 2.4 2.3 2.2 1.6 2.7 0.9 0.7 2.4 1.9 3.0Bachelor’s degree (B.A., B.S., etc.) 69.2 72.9 64.2 72.1 74.0 74.9 66.7 76.0 63.4 67.1 64.5 57.0 75.0Master’s degree (M.A., M.S., etc.) 20.4 17.5 24.2 18.2 16.5 16.4 23.0 13.9 25.4 20.2 17.6 21.8 11.8Ph.D. or Ed.D. 3.3 2.4 4.5 2.3 2.6 2.4 3.9 2.3 4.6 4.0 6.1 7.2 4.5M.D., D.O., D.D.S., or D.V.M. 1.7 0.6 3.1 0.7 0.6 0.5 1.1 0.5 2.9 3.8 1.2 1.1 1.2J.D. (Law) 0.8 0.4 1.2 0.3 0.6 0.7 0.5 0.4 0.9 2.4 1.2 1.8 0.4B.D. or M.DIV. (Divinity) 0.2 0.2 0.2 0.1 0.2 0.2 0.2 0.3 0.2 0.2 0.6 0.8 0.3Other 1.2 1.4 0.9 1.3 1.5 1.5 1.4 1.4 0.8 0.9 1.4 1.8 0.9
How would you describe the racial composition ofthe high school you last attended?
Completely non-White 3.0 3.4 2.5 3.8 2.9 2.9 2.8 3.0 2.4 2.5 20.0 20.7 18.9Mostly non-White 12.0 12.2 11.7 13.4 10.6 10.8 8.9 11.1 12.3 9.5 36.8 39.3 33.0Roughly half non-White 22.8 23.6 21.6 24.5 22.2 21.2 19.0 24.7 21.8 21.0 24.9 24.8 25.0Mostly White 54.2 52.9 56.0 50.7 55.9 57.1 60.9 52.5 55.0 59.6 16.3 13.6 20.4Completely White 8.0 7.9 8.2 7.6 8.3 7.9 8.3 8.6 8.4 7.4 2.1 1.7 2.8
How would you describe the racial composition ofthe neighborhood where you grew up?
Completely non-White 5.8 6.7 4.4 6.9 6.4 6.2 5.2 7.2 4.4 4.6 34.5 36.8 31.0Mostly non-White 10.9 11.4 10.3 11.9 10.5 10.3 10.0 11.1 10.6 9.2 32.3 32.0 32.8Roughly half non-White 13.1 13.4 12.6 14.1 12.4 12.2 12.3 12.8 12.6 12.6 18.4 18.9 17.8Mostly White 50.1 48.6 52.3 48.3 49.2 49.5 50.9 48.1 51.3 55.8 12.2 10.2 15.3Completely White 20.1 19.9 20.4 18.8 21.4 21.9 21.6 20.9 21.1 17.7 2.6 2.2 3.1
HOW MUCH OF YOUR FIRST YEAR’S EDUCATIONALEXPENSES (ROOM, BOARD, TUITION, AND FEES) DO YOU EXPECT TO COVER FROM:Family resources (parents, relatives, spouse, etc.)
None 23.2 27.6 16.8 32.7 20.7 20.2 20.3 21.5 18.0 12.2 39.3 43.2 33.4Less than $1,000 10.0 11.3 8.2 12.6 9.4 8.3 8.7 10.9 9.0 5.0 20.0 21.3 18.1$1,000–$2,999 12.4 13.6 10.7 14.6 12.1 10.2 12.1 14.2 11.8 6.5 17.3 18.2 15.8$3,000–$5,999 12.1 12.3 11.8 12.3 12.4 11.2 12.9 13.5 12.8 7.9 9.7 9.4 10.3$6,000–$9,999 10.5 10.0 11.3 9.6 10.5 9.9 10.2 11.4 12.0 8.3 4.8 3.1 7.4$10,000 + 31.8 25.2 41.3 18.2 34.8 40.2 35.8 28.5 36.4 60.2 8.9 4.9 15.1
My own resources (savings from work, work-study, other income)
None 39.5 42.7 35.0 45.5 38.8 39.7 37.9 38.1 33.8 39.4 56.2 58.9 51.9Less than $1,000 23.9 24.2 23.5 24.8 23.3 22.5 21.7 25.0 24.2 21.1 24.1 23.8 24.5$1,000–$2,999 22.8 20.7 25.7 19.0 23.0 22.7 24.3 22.8 26.2 24.0 13.9 11.6 17.5$3,000–$5,999 8.6 7.5 10.1 6.7 8.7 8.6 9.6 8.4 10.4 9.2 4.2 4.2 4.1$6,000–$9,999 2.7 2.5 3.0 2.0 3.1 2.9 3.4 3.1 3.1 2.7 0.6 0.7 0.4$10,000 + 2.5 2.4 2.6 1.9 3.1 3.5 3.2 2.6 2.4 3.6 1.1 0.8 1.6
2009 CIRP Freshman SurveyWeighted National Norms—Men
Baccalaureate Black Colleges All Bacc Institutions 4-year Colleges Universities and Universities
Institutions 4-yr Coll Universities Public Private Nonsec Catholic Oth Relig Public Private All HBCU Public Private
48

HOW MUCH OF YOUR FIRST YEAR’S EDUCATIONALEXPENSES (ROOM, BOARD, TUITION, AND FEES) DO YOU EXPECT TO COVER FROM:Aid which need not be repaid (grants,scholarships, military funding, etc.)
None 32.9 32.1 34.0 37.6 24.5 29.7 22.9 19.4 34.8 30.6 27.0 27.4 26.3Less than $1,000 6.4 5.8 7.3 7.5 3.3 3.3 3.2 3.4 8.4 2.9 6.8 8.2 4.7$1,000–$2,999 12.1 11.3 13.3 14.1 7.4 7.2 7.6 7.6 15.2 6.2 13.3 15.0 10.7$3,000–$5,999 12.3 12.9 11.5 15.1 9.8 8.2 9.7 11.5 13.0 6.0 19.0 23.2 12.3$6,000–$9,999 10.0 10.0 9.9 8.5 12.1 10.8 12.8 13.3 10.7 6.9 11.2 9.6 13.8$10,000 + 26.3 28.0 23.9 17.1 42.9 40.8 43.8 44.9 17.9 47.5 22.7 16.6 32.2
Aid which must be repaid (loans, etc.)None 49.6 49.5 49.7 55.9 40.7 43.7 38.7 38.2 48.8 52.9 41.3 44.2 36.9Less than $1,000 3.6 3.9 3.2 4.2 3.4 2.8 3.6 4.0 3.5 2.0 6.7 6.8 6.5$1,000–$2,999 8.9 9.7 7.8 9.9 9.5 8.4 9.5 10.6 8.2 6.3 12.5 14.3 9.6$3,000–$5,999 15.9 15.6 16.3 14.3 17.4 14.7 19.4 19.4 16.8 14.5 15.2 16.8 12.8$6,000–$9,999 9.7 9.4 10.2 7.6 11.9 11.1 12.5 12.7 10.6 8.6 9.9 9.0 11.5$10,000 + 12.3 12.0 12.8 8.2 17.2 19.3 16.3 15.2 12.1 15.7 14.4 8.9 22.8
Other than aboveNone 93.1 92.7 93.6 93.5 91.6 92.4 91.1 91.0 93.7 93.0 91.3 90.7 92.1Less than $1,000 2.6 2.7 2.5 2.7 2.7 2.4 2.7 3.0 2.5 2.2 2.7 3.0 2.2$1,000–$2,999 1.5 1.6 1.4 1.5 1.8 1.5 2.0 2.0 1.5 1.3 2.5 2.7 2.1$3,000–$5,999 1.1 1.1 1.0 0.9 1.4 1.3 1.5 1.5 1.0 1.1 1.7 1.8 1.6$6,000–$9,999 0.5 0.5 0.5 0.4 0.8 0.6 0.9 0.9 0.5 0.5 0.2 0.3 0.2$10,000 + 1.2 1.4 1.1 1.1 1.7 1.7 1.8 1.6 0.8 1.9 1.6 1.5 1.7
What is your best estimate of your parents’ totalincome last year?
Less than $10,000 3.3 4.0 2.3 4.0 4.1 3.6 3.3 4.9 2.4 1.9 13.7 15.8 10.5$10,000 to $14,999 2.3 2.7 1.7 3.0 2.4 2.2 1.7 2.9 1.8 1.3 7.3 9.1 4.5$15,000 to $19,999 2.1 2.3 1.8 2.6 2.0 1.7 1.6 2.5 2.0 1.2 3.7 3.6 4.0$20,000 to $24,999 3.1 3.5 2.5 3.8 3.1 2.6 2.8 3.7 2.7 1.9 8.2 8.1 8.2$25,000 to $29,999 2.9 3.2 2.6 3.3 3.0 2.8 2.5 3.4 2.8 1.6 5.1 5.4 4.7$30,000 to $39,999 5.3 5.8 4.4 6.1 5.5 4.8 4.9 6.6 4.8 3.1 9.4 9.9 8.8$40,000 to $49,999 6.3 7.0 5.4 7.1 6.8 6.1 6.1 7.7 5.9 3.6 9.9 10.0 9.8$50,000 to $59,999 7.8 8.6 6.8 8.6 8.5 7.8 8.2 9.4 7.1 5.3 9.1 9.4 8.8$60,000 to $74,999 10.4 11.0 9.7 10.9 11.0 11.0 10.4 11.4 10.3 7.4 10.3 11.3 8.9$75,000 to $99,999 14.9 15.1 14.6 15.4 14.6 14.1 15.7 14.7 15.2 12.4 9.2 8.1 10.8$100,000 to $149,999 19.9 18.5 21.9 19.3 17.4 18.2 19.3 15.9 22.2 20.7 7.9 6.4 10.2$150,000 to $199,999 8.7 7.7 10.1 7.6 7.8 8.7 9.0 6.4 9.7 11.4 2.9 2.1 4.1$200,000 to $249,999 4.9 4.2 5.8 3.9 4.7 5.4 5.5 3.8 5.2 8.2 0.9 0.1 2.2$250,000 or more 8.0 6.3 10.4 4.5 8.9 11.0 9.0 6.7 7.9 19.9 2.3 0.8 4.7
Do you have any concern about your ability tofinance your college education?
None (I am confident that I will have sufficient funds) 40.1 41.4 38.2 43.0 39.3 40.0 39.3 38.6 37.5 40.8 30.3 30.5 30.2Some (but I probably will have enough funds) 51.2 49.6 53.5 48.3 51.3 51.1 51.9 51.1 54.2 50.8 52.5 53.4 51.1Major (not sure I will have enough funds to complete
college) 8.7 9.0 8.3 8.7 9.4 8.9 8.9 10.3 8.3 8.5 17.2 16.2 18.7
2009 CIRP Freshman SurveyWeighted National Norms—Men
Baccalaureate Black Colleges All Bacc Institutions 4-year Colleges Universities and Universities
Institutions 4-yr Coll Universities Public Private Nonsec Catholic Oth Relig Public Private All HBCU Public Private
49

Your current religious preference:Baptist 10.5 13.7 5.9 13.8 13.5 9.0 5.8 21.6 5.9 5.9 50.9 51.1 50.5Buddhist 1.1 0.8 1.7 0.8 0.8 1.1 0.6 0.5 1.8 1.2 0.2 0.0 0.5Church of Christ 5.3 6.2 3.9 6.2 6.2 5.8 4.2 7.5 4.4 1.9 12.9 16.1 8.0Eastern Orthodox 0.7 0.6 0.7 0.7 0.5 0.6 0.8 0.3 0.7 1.1 0.1 0.0 0.2Episcopalian 1.2 1.2 1.2 1.1 1.4 1.6 0.9 1.4 1.1 1.7 0.9 0.8 1.1Hindu 0.9 0.4 1.5 0.3 0.5 0.7 0.5 0.2 1.3 2.2 0.1 0.2 0.1Jewish 2.7 1.9 3.8 1.8 2.1 3.9 0.5 1.0 3.1 6.4 0.0 0.0 0.1LDS (Mormon) 0.3 0.3 0.3 0.4 0.2 0.3 0.1 0.2 0.3 0.2 0.0 0.0 0.0Lutheran 3.8 3.2 4.7 3.0 3.4 2.3 1.8 5.3 5.4 2.1 0.3 0.2 0.4Methodist 4.3 4.5 4.2 4.4 4.5 3.4 2.2 6.8 4.5 2.9 3.9 3.4 4.7Muslim 1.0 0.8 1.3 0.7 0.9 1.0 1.2 0.5 1.2 1.6 0.8 0.7 0.8Presbyterian 2.9 2.7 3.1 2.5 3.1 2.3 1.5 4.6 2.9 3.5 0.6 0.3 1.1Quaker 0.2 0.2 0.2 0.2 0.3 0.3 0.2 0.3 0.2 0.2 0.1 0.0 0.3Roman Catholic 26.4 25.2 28.1 25.5 24.7 22.9 55.3 13.5 26.3 34.9 3.7 1.9 6.5Seventh Day Adventist 0.2 0.3 0.2 0.3 0.2 0.3 0.2 0.2 0.2 0.2 0.8 0.9 0.7United Church of Christ/Congregational 0.7 0.7 0.6 0.6 0.9 0.9 0.6 1.0 0.7 0.5 0.3 0.2 0.4Other Christian 11.6 13.0 9.7 12.5 13.7 10.6 8.0 19.4 10.3 7.7 13.8 13.4 14.5Other Religion 2.5 2.6 2.3 2.5 2.6 3.0 1.8 2.4 2.4 2.1 2.2 2.0 2.5None 23.8 21.8 26.6 22.7 20.5 29.9 13.8 13.4 27.3 24.1 8.4 8.8 7.7
Father’s current religious preference:Baptist 10.8 13.9 6.3 14.2 13.6 9.8 6.2 20.9 6.5 5.8 50.6 50.6 50.5Buddhist 1.6 0.8 2.7 0.8 0.9 1.4 0.5 0.5 2.9 2.0 0.3 0.2 0.5Church of Christ 5.5 6.4 4.3 6.6 6.2 6.3 4.4 6.8 4.9 2.1 12.0 15.1 7.4Eastern Orthodox 0.8 0.8 0.9 0.8 0.7 0.9 1.0 0.4 0.8 1.2 0.1 0.0 0.3Episcopalian 1.6 1.6 1.7 1.3 1.9 2.5 1.2 1.6 1.5 2.1 0.8 0.6 1.1Hindu 1.1 0.5 1.9 0.4 0.6 0.9 0.6 0.3 1.7 2.8 0.2 0.2 0.1Jewish 3.5 2.6 4.8 2.4 2.9 5.0 1.2 1.5 4.0 8.1 0.1 0.0 0.2LDS (Mormon) 0.4 0.4 0.4 0.5 0.3 0.3 0.1 0.3 0.4 0.2 0.1 0.1 0.0Lutheran 4.7 3.9 5.8 3.7 4.3 3.1 2.5 6.2 6.5 3.0 0.3 0.2 0.3Methodist 5.1 5.2 5.1 5.2 5.1 3.9 2.8 7.3 5.5 3.5 4.0 3.3 5.1Muslim 1.3 1.1 1.7 1.0 1.2 1.4 1.5 0.9 1.6 1.9 2.4 2.8 1.9Presbyterian 3.5 3.4 3.6 3.1 3.8 3.2 1.9 5.2 3.4 4.3 0.6 0.3 1.1Quaker 0.2 0.2 0.2 0.1 0.3 0.2 0.3 0.3 0.1 0.2 0.0 0.0 0.1Roman Catholic 30.2 29.1 31.7 30.1 27.6 26.7 56.3 16.0 30.3 37.1 4.1 2.2 7.0Seventh Day Adventist 0.3 0.3 0.2 0.4 0.3 0.3 0.4 0.3 0.3 0.2 0.4 0.5 0.4United Church of Christ/Congregational 0.8 0.8 0.7 0.7 1.0 1.1 0.5 1.0 0.7 0.6 0.2 0.2 0.1Other Christian 11.7 12.8 10.1 12.4 13.4 11.3 7.7 18.2 10.7 7.7 12.1 11.1 13.6Other Religion 1.8 1.8 1.8 1.8 1.8 2.2 1.4 1.7 1.9 1.6 1.8 1.8 1.7None 15.1 14.4 16.1 14.5 14.2 19.4 9.5 10.7 16.3 15.6 10.0 10.9 8.7
2009 CIRP Freshman SurveyWeighted National Norms—Men
Baccalaureate Black Colleges All Bacc Institutions 4-year Colleges Universities and Universities
Institutions 4-yr Coll Universities Public Private Nonsec Catholic Oth Relig Public Private All HBCU Public Private
50

Mother’s current religious preference:Baptist 11.3 14.7 6.7 14.7 14.6 10.4 6.6 22.5 6.8 6.1 53.6 53.8 53.2Buddhist 1.7 0.8 2.9 0.8 0.8 1.3 0.5 0.4 3.1 2.0 0.2 0.0 0.4Church of Christ 6.0 7.0 4.7 7.0 6.9 7.2 4.9 7.5 5.4 2.3 12.6 15.6 8.2Eastern Orthodox 0.8 0.7 0.9 0.8 0.6 0.7 0.8 0.4 0.8 1.3 0.0 0.0 0.1Episcopalian 1.8 1.8 1.8 1.6 2.1 2.6 1.2 1.9 1.7 2.3 1.1 1.0 1.3Hindu 1.1 0.5 1.9 0.4 0.6 0.9 0.6 0.3 1.7 2.7 0.2 0.3 0.1Jewish 3.3 2.4 4.6 2.2 2.7 4.8 0.9 1.4 3.9 7.4 0.0 0.0 0.1LDS (Mormon) 0.4 0.4 0.4 0.6 0.3 0.3 0.0 0.3 0.4 0.2 0.0 0.0 0.0Lutheran 4.8 4.0 5.9 3.8 4.1 2.9 2.4 6.2 6.7 2.9 0.2 0.2 0.3Methodist 5.5 5.6 5.3 5.6 5.5 4.5 3.0 7.8 5.7 3.8 4.0 3.2 5.2Muslim 1.1 0.9 1.5 0.8 1.0 1.1 1.3 0.6 1.4 1.8 1.0 1.1 1.0Presbyterian 3.7 3.6 3.9 3.4 4.0 3.5 1.9 5.3 3.7 4.7 0.7 0.2 1.4Quaker 0.2 0.2 0.2 0.2 0.3 0.5 0.3 0.2 0.2 0.3 0.1 0.0 0.2Roman Catholic 31.8 30.3 33.9 31.2 29.0 28.4 59.4 16.4 32.1 40.4 4.2 2.3 7.1Seventh Day Adventist 0.3 0.3 0.3 0.4 0.3 0.3 0.3 0.2 0.3 0.2 0.8 0.8 0.6United Church of Christ/Congregational 0.9 0.9 0.8 0.8 1.2 1.3 0.7 1.1 0.9 0.6 0.3 0.2 0.5Other Christian 12.5 13.8 10.7 13.4 14.3 12.3 8.2 19.0 11.4 8.2 13.3 13.1 13.7Other Religion 1.9 1.9 2.0 1.9 1.9 2.3 1.3 1.6 2.0 1.7 2.2 2.3 2.1None 10.8 10.2 11.6 10.4 10.0 14.7 5.9 6.8 11.8 11.1 5.4 5.9 4.5
For the activities below, indicate which ones you“frequently” or “occasionally” did during the past year:
Attended a religious service 72.6 73.3 71.5 71.6 75.7 65.7 81.9 83.8 70.4 75.7 87.3 85.3 90.3Was bored in class* 39.9 39.1 40.9 39.8 38.3 38.1 36.7 39.0 41.1 39.9 32.7 31.5 34.5Participated in political demonstrations 26.0 26.0 26.0 24.7 27.6 27.5 27.2 27.9 25.5 28.0 39.9 36.8 44.7Tutored another student 52.2 47.9 58.5 48.2 47.4 47.2 48.3 47.3 56.1 67.6 57.3 54.1 62.2Studied with other students 84.2 82.6 86.6 82.1 83.4 82.9 84.3 83.5 86.1 88.1 85.3 85.6 84.8Was a guest in a teacher’s home 21.2 22.0 20.0 20.2 24.5 23.9 19.2 27.5 19.1 23.5 23.3 23.2 23.4Smoked cigarettes* 4.6 5.1 3.7 5.7 4.4 5.1 4.2 3.6 3.9 3.0 2.7 2.7 2.7Drank beer 45.6 45.8 45.3 44.7 47.3 53.7 53.5 37.7 44.1 49.9 19.9 20.3 19.3Drank wine or liquor 45.2 45.7 44.4 44.5 47.4 53.6 50.9 39.3 43.1 49.4 37.2 37.6 36.5Felt overwhelmed by all I had to do* 15.9 16.6 15.0 15.9 17.5 17.5 16.5 17.8 14.7 16.5 17.0 15.8 18.7Felt depressed* 4.7 5.2 4.1 5.0 5.5 5.4 4.7 5.8 4.1 4.5 7.5 7.2 8.0Performed volunteer work 81.3 79.2 84.3 77.0 82.2 80.5 83.4 83.4 82.8 89.7 79.0 76.3 83.1Played a musical instrument 47.5 45.2 50.7 45.5 44.8 44.8 40.7 46.7 49.9 54.0 42.5 40.3 45.7Asked a teacher for advice after class* 24.3 24.5 24.0 23.2 26.2 26.5 25.5 26.3 22.9 28.3 33.5 32.1 35.6Voted in a student election* 20.1 20.0 20.3 19.1 21.1 20.4 21.6 21.7 19.1 24.9 28.6 25.9 32.7Socialized with someone of another racial/ethnic
group* 67.5 67.2 68.0 67.0 67.4 67.7 66.0 67.7 66.6 73.2 67.3 62.9 74.3Came late to class 59.5 59.6 59.3 60.3 58.6 60.0 57.1 57.7 59.0 60.2 63.3 63.5 63.0Used the Internet:
For research or homework* 71.1 68.1 75.4 66.5 70.3 71.4 73.1 67.8 73.9 81.2 68.8 65.4 74.1To read news sites* 46.2 43.4 50.2 42.4 44.9 47.7 46.4 41.2 48.1 58.6 42.6 38.8 48.5To read blogs* 23.1 22.2 24.4 21.4 23.3 24.5 22.9 22.1 23.7 26.9 27.8 25.5 31.3To blog* 11.5 11.8 11.0 11.6 12.1 11.6 11.8 12.9 10.9 11.2 17.5 17.1 18.0
*responses for “frequently” only
2009 CIRP Freshman SurveyWeighted National Norms—Men
Baccalaureate Black Colleges All Bacc Institutions 4-year Colleges Universities and Universities
Institutions 4-yr Coll Universities Public Private Nonsec Catholic Oth Relig Public Private All HBCU Public Private
51

For the activities below, indicate which ones you“frequently” or “occasionally” did during the past year:
Performed community service as part of a class 55.1 54.8 55.6 51.9 58.7 57.1 64.5 57.9 54.2 61.0 56.9 52.1 64.2Discussed religion* 29.2 28.6 30.1 26.7 31.2 27.5 31.7 35.1 28.1 37.5 28.0 23.6 34.8Discussed politics* 35.7 33.1 39.6 32.4 34.0 34.2 34.9 33.4 37.7 47.2 26.4 20.7 35.2Skipped school/class* 2.7 2.9 2.4 2.8 3.1 3.2 2.6 3.1 2.4 2.7 4.7 3.9 5.9
*responses for “frequently” onlyStudent rated self as “Highest 10%” or “AboveAverage” as compared with the average persontheir age:
Academic ability 73.6 66.4 83.9 65.8 67.3 68.1 68.1 66.0 82.2 90.3 62.3 57.5 69.6Artistic ability 27.4 27.7 26.9 27.0 28.8 32.7 23.2 27.0 26.2 29.6 34.5 33.1 36.6Computer skills 48.8 45.7 53.4 46.4 44.8 46.0 45.0 43.4 53.1 54.4 50.0 48.5 52.2Cooperativeness 73.4 72.2 75.0 71.8 72.8 71.6 75.2 73.2 74.5 76.9 69.8 66.5 74.9Creativity 56.0 55.8 56.2 54.6 57.5 60.7 53.6 55.7 55.2 59.7 66.3 64.9 68.4Drive to achieve 73.0 71.2 75.6 70.0 72.9 72.2 73.0 73.5 74.1 81.3 81.6 79.8 84.5Emotional health 62.4 60.9 64.5 60.4 61.7 60.6 62.5 62.5 63.7 67.5 61.0 58.6 64.6Leadership ability 65.8 65.5 66.2 64.7 66.6 65.1 66.3 68.4 64.6 72.3 74.1 71.7 77.7Mathematical ability 54.0 46.5 64.8 46.9 46.1 46.6 45.7 45.7 63.6 69.3 41.0 38.9 44.3Physical health 67.8 67.9 67.7 67.4 68.6 66.1 71.5 69.9 67.4 68.9 67.8 66.7 69.5Popularity 47.1 47.4 46.8 46.1 49.1 48.1 51.3 49.3 45.6 51.3 57.2 54.2 61.8Public speaking ability 41.5 40.4 43.2 39.4 41.7 41.5 41.6 42.0 40.7 52.7 45.6 42.2 50.7Self-confidence (intellectual) 69.4 67.0 72.9 66.3 68.0 67.3 66.0 69.7 71.4 78.9 78.4 76.6 81.4Self-confidence (social) 57.8 58.4 57.0 58.5 58.3 56.2 59.3 60.1 56.6 58.5 73.4 72.0 75.6Self-understanding 63.5 63.0 64.2 62.8 63.4 63.2 61.4 64.5 63.1 68.8 74.2 73.2 75.8Spirituality 37.8 39.0 36.1 38.2 40.1 34.1 38.8 47.1 34.7 41.2 55.8 55.9 55.6Understanding of others 65.3 65.1 65.6 64.4 66.0 65.9 65.6 66.2 64.4 70.3 67.5 65.6 70.5Writing ability 44.2 42.2 47.2 41.4 43.2 44.4 43.2 41.8 44.5 57.7 46.5 43.4 51.4Ability to see the world from someone else’s
perspective 65.5 63.2 68.8 62.8 63.7 65.6 62.2 62.4 67.4 74.4 61.9 58.4 67.3Tolerance of others with different beliefs 71.9 69.3 75.7 68.7 70.0 72.7 69.9 67.1 74.6 79.9 65.6 62.4 70.5Openness to having my own views challenged 60.8 59.2 63.0 59.0 59.6 61.2 59.6 57.8 61.7 67.8 63.6 61.8 66.4Ability to discuss and negotiate controversial issues 69.4 67.3 72.6 67.6 66.8 68.0 67.4 65.1 71.1 78.0 68.2 65.3 72.6Ability to work cooperatively with diverse people 78.0 76.3 80.5 76.2 76.4 77.1 76.7 75.5 79.5 84.3 76.0 72.7 81.1
What is the highest level of formal educationobtained by your father?
Grammar school or less 3.6 4.1 3.0 4.7 3.2 3.2 4.0 3.0 3.3 2.0 6.4 6.9 5.6Some high school 4.6 5.2 3.5 5.7 4.6 4.1 4.1 5.3 3.8 2.4 10.0 11.4 7.8High school graduate 17.8 20.8 13.6 21.1 20.3 18.3 19.4 22.8 14.8 9.0 30.7 33.8 25.9Postsecondary school other than college 2.9 3.2 2.6 3.4 2.9 2.9 3.3 2.9 2.7 2.1 3.5 3.9 2.8Some college 14.0 15.2 12.3 16.1 13.9 12.8 14.8 14.8 13.1 9.4 19.9 19.9 20.0College degree 30.1 28.5 32.5 28.5 28.6 29.3 29.9 27.2 33.1 29.9 17.9 15.9 21.0Some graduate school 2.1 1.9 2.5 1.7 2.1 2.1 2.2 2.1 2.3 3.0 0.9 0.2 2.0Graduate degree 24.8 21.1 30.0 18.8 24.3 27.4 22.3 21.8 26.8 42.2 10.8 8.1 14.9
2009 CIRP Freshman SurveyWeighted National Norms—Men
Baccalaureate Black Colleges All Bacc Institutions 4-year Colleges Universities and Universities
Institutions 4-yr Coll Universities Public Private Nonsec Catholic Oth Relig Public Private All HBCU Public Private
52

What is the highest level of formal educationobtained by your mother?
Grammar school or less 3.3 3.6 2.8 4.3 2.8 2.4 3.4 3.0 3.1 1.8 6.4 7.1 5.2Some high school 3.2 3.5 2.7 4.0 2.8 2.6 2.8 3.2 2.9 1.8 5.1 5.6 4.3High school graduate 16.8 19.1 13.6 19.4 18.6 16.7 18.8 20.6 14.7 9.5 21.2 22.0 20.1Postsecondary school other than college 3.2 3.4 2.9 3.3 3.4 3.4 3.7 3.3 3.1 2.2 3.4 3.7 2.9Some college 15.9 16.9 14.5 17.9 15.6 14.5 15.4 16.8 15.4 11.1 21.7 22.9 19.9College degree 35.1 33.1 38.0 32.5 33.9 34.1 34.5 33.4 37.7 38.9 26.3 25.7 27.2Some graduate school 2.8 2.5 3.2 2.2 2.8 3.0 2.6 2.7 3.0 4.0 2.1 1.7 2.9Graduate degree 19.7 17.9 22.3 16.3 20.1 23.5 18.9 17.0 20.0 30.6 13.7 11.2 17.5
During the past year, did you “frequently”:Ask questions in class 50.0 48.7 52.0 47.4 50.4 51.2 49.5 50.0 50.0 59.7 53.4 51.0 57.1Support your opinions with a logical argument 60.9 57.1 66.3 56.6 57.9 60.9 56.4 55.3 64.1 75.0 52.2 46.3 61.2Seek solutions to problems and explain them to others 50.7 47.0 56.0 46.9 47.1 49.5 45.2 45.4 53.4 65.7 45.8 42.6 50.6Revise your papers to improve your writing 36.6 34.8 39.3 32.8 37.5 39.1 37.8 35.7 37.3 46.9 40.7 38.7 43.8Evaluate the quality or reliability of information you
received 37.1 34.4 40.9 33.9 35.2 37.5 33.6 33.4 38.7 48.9 37.3 34.2 41.9Take a risk because you feel you have more to gain 42.9 43.0 42.7 43.3 42.7 43.1 43.2 42.0 41.8 45.9 46.4 45.3 47.9Seek alternative solutions to a problem 45.4 43.8 47.6 44.1 43.5 44.4 43.2 42.6 46.4 52.2 45.8 42.6 50.7Look up scientific research articles and resources 23.5 21.1 27.0 20.9 21.4 23.0 21.6 19.7 25.7 32.0 21.9 22.0 21.9Explore topics on your own, even though it was not
required for a class 34.6 32.5 37.7 32.2 32.7 35.9 30.2 30.4 35.9 44.3 29.3 26.7 33.3Accept mistakes as part of the learning process 50.2 49.2 51.6 49.5 48.9 49.0 47.3 49.5 51.1 53.7 54.4 51.5 58.8Seek feedback on your academic work 40.3 39.3 41.9 38.1 41.0 42.5 40.2 39.7 39.9 49.3 47.7 45.1 51.8Take notes during class 52.1 51.4 53.1 49.0 54.7 53.8 58.3 54.1 51.3 60.0 64.9 62.8 68.1Work with other students on class assignments 48.2 46.4 50.9 46.5 46.2 45.5 47.2 46.5 50.3 53.1 53.1 51.8 55.2
2009 CIRP Freshman SurveyWeighted National Norms—Men
Baccalaureate Black Colleges All Bacc Institutions 4-year Colleges Universities and Universities
Institutions 4-yr Coll Universities Public Private Nonsec Catholic Oth Relig Public Private All HBCU Public Private
53

Your probable career occupation:Accountant or actuary 2.8 2.9 2.6 2.6 3.3 3.0 5.2 2.8 2.7 2.3 3.6 3.9 3.2Actor or entertainer 1.3 1.6 0.9 1.7 1.4 1.4 0.9 1.6 0.8 1.1 2.1 2.1 2.1Architect or urban planner 1.0 0.8 1.2 0.9 0.7 0.9 0.6 0.6 1.4 0.8 1.5 2.1 0.6Artist 2.1 2.9 0.8 1.8 4.5 8.6 0.8 1.7 0.9 0.6 1.4 1.3 1.5Business (clerical) 0.7 0.8 0.6 0.7 0.9 0.8 1.1 0.9 0.7 0.6 1.1 1.1 1.0Business executive (management, administrator) 8.6 8.0 9.4 6.8 9.7 10.1 11.0 8.6 8.4 13.0 8.0 8.5 7.2Business owner or proprietor 3.9 4.1 3.5 3.7 4.8 5.0 5.1 4.4 3.4 3.9 6.5 5.0 8.7Business salesperson or buyer 0.9 0.8 0.9 0.8 0.9 0.9 1.6 0.7 1.0 0.5 0.6 0.5 0.7Clergy (minister, priest) 0.3 0.4 0.1 0.2 0.7 0.2 0.2 1.5 0.1 0.3 0.4 0.3 0.5Clergy (other religious) 0.1 0.1 0.0 0.1 0.2 0.1 0.0 0.5 0.0 0.1 0.1 0.0 0.2Clinical psychologist 0.7 0.8 0.5 0.8 0.8 0.6 0.8 0.9 0.5 0.5 1.0 1.4 0.6College administrator/staff 0.1 0.1 0.1 0.0 0.1 0.1 0.0 0.1 0.1 0.1 0.2 0.2 0.1College teacher 0.6 0.6 0.6 0.4 0.8 0.9 0.3 0.9 0.5 0.8 0.2 0.3 0.2Computer programmer or analyst 3.3 3.3 3.4 3.6 2.8 2.7 2.5 3.1 3.7 2.0 5.7 5.2 6.5Conservationist or forester 0.3 0.4 0.3 0.4 0.4 0.4 0.1 0.5 0.3 0.1 0.1 0.1 0.0Dentist (including orthodontist) 1.1 0.9 1.3 1.0 0.8 0.5 1.4 0.9 1.3 1.3 1.4 1.4 1.4Dietitian or nutritionist 0.2 0.2 0.2 0.2 0.2 0.2 0.2 0.2 0.2 0.1 0.2 0.3 0.1Engineer 13.6 8.5 20.9 10.4 5.9 6.7 5.6 5.1 22.7 13.9 8.6 9.4 7.4Farmer or rancher 0.5 0.5 0.5 0.5 0.3 0.3 0.1 0.5 0.6 0.2 0.1 0.2 0.1Foreign service worker (including diplomat) 0.5 0.4 0.6 0.3 0.6 0.7 0.4 0.5 0.4 1.6 0.3 0.0 0.7Homemaker (full-time) 0.0 0.0 0.0 0.0 0.0 0.0 0.0 0.0 0.0 0.0 0.0 0.0 0.1Interior decorator (including designer) 0.1 0.1 0.0 0.1 0.1 0.2 0.1 0.0 0.0 0.0 0.1 0.1 0.0Lab technician or hygienist 0.1 0.1 0.1 0.1 0.1 0.0 0.1 0.2 0.1 0.1 0.1 0.1 0.1Law enforcement officer 2.2 3.3 0.8 3.8 2.6 2.2 2.6 2.9 0.9 0.3 2.9 3.5 2.2Lawyer (attorney) or judge 3.6 3.2 4.2 2.7 4.0 4.2 4.4 3.7 3.5 6.9 5.9 4.1 8.6Military service (career) 3.3 4.8 1.3 7.6 1.0 0.9 1.1 1.0 1.4 1.1 1.2 1.2 1.2Musician (performer, composer) 2.1 2.5 1.5 2.7 2.2 1.6 1.3 3.3 1.5 1.3 3.9 4.6 2.9Nurse 0.9 1.1 0.6 1.2 1.1 0.4 3.0 1.1 0.7 0.3 0.9 0.9 0.7Optometrist 0.2 0.2 0.2 0.2 0.2 0.1 0.2 0.2 0.2 0.1 0.0 0.0 0.1Pharmacist 1.6 1.5 1.7 1.2 2.0 1.8 2.4 2.0 1.7 1.7 2.5 1.1 4.6Physician 6.2 4.3 8.8 3.3 5.6 4.5 8.0 5.7 7.8 12.8 5.7 3.3 9.4Policymaker/Government 1.3 1.1 1.6 1.0 1.3 1.3 1.6 1.3 1.2 3.2 0.7 0.4 1.1School counselor 0.1 0.2 0.1 0.1 0.2 0.2 0.2 0.2 0.1 0.0 0.2 0.2 0.2School principal or superintendent 0.1 0.1 0.0 0.1 0.1 0.0 0.0 0.1 0.0 0.0 0.3 0.4 0.2Scientific researcher 2.3 1.9 2.7 1.7 2.3 2.6 1.6 2.3 2.6 3.2 1.2 1.2 1.3Social, welfare, or recreation worker 0.3 0.4 0.2 0.4 0.4 0.2 0.4 0.5 0.3 0.1 0.8 1.1 0.4Therapist (physical, occupational, speech) 2.2 2.8 1.3 2.7 2.8 1.9 3.4 3.6 1.5 0.5 3.7 4.8 2.1Teacher or administrator (elementary) 0.9 1.3 0.3 1.4 1.2 0.7 1.2 1.8 0.4 0.1 1.3 1.6 0.8Teacher or administrator (secondary) 4.2 5.6 2.2 6.2 4.9 3.0 4.9 7.0 2.5 1.2 3.5 4.2 2.4Veterinarian 0.5 0.5 0.4 0.5 0.6 0.7 0.2 0.6 0.5 0.2 0.6 0.6 0.5Writer or journalist 1.8 1.8 1.7 1.7 2.0 2.1 1.9 2.0 1.7 1.9 1.5 1.5 1.4Skilled trades 0.4 0.5 0.3 0.6 0.4 0.3 0.4 0.5 0.3 0.2 0.3 0.3 0.2Laborer (unskilled) 0.5 0.5 0.4 0.6 0.4 0.4 0.6 0.4 0.5 0.2 0.1 0.2 0.0Semi-skilled worker 0.3 0.3 0.3 0.4 0.3 0.3 0.2 0.2 0.3 0.2 0.2 0.2 0.2Unemployed 1.2 1.3 1.1 1.3 1.4 1.5 1.2 1.3 1.1 1.0 2.6 3.2 1.6Other 7.1 8.0 5.9 7.8 8.3 8.7 6.2 8.6 6.3 4.7 7.7 8.4 6.6Undecided 14.0 14.3 13.7 13.9 14.8 15.8 14.7 13.7 13.4 14.7 9.1 9.7 8.3
2009 CIRP Freshman SurveyWeighted National Norms—Men
Baccalaureate Black Colleges All Bacc Institutions 4-year Colleges Universities and Universities
Institutions 4-yr Coll Universities Public Private Nonsec Catholic Oth Relig Public Private All HBCU Public Private
54

Your father’s occupation:Accountant or actuary 2.9 2.5 3.6 2.4 2.6 2.4 3.8 2.4 3.5 3.8 1.1 0.7 1.7Actor or entertainer 0.1 0.1 0.1 0.1 0.2 0.2 0.1 0.1 0.1 0.1 0.1 0.1 0.2Architect or urban planner 1.1 1.0 1.1 1.0 1.0 1.1 0.9 1.1 1.1 1.1 0.5 0.5 0.5Artist 0.4 0.5 0.3 0.3 0.7 1.1 0.2 0.6 0.3 0.3 0.3 0.3 0.4Business (clerical) 1.5 1.5 1.4 1.6 1.5 1.7 1.6 1.2 1.5 1.2 2.6 3.1 1.8Business executive (management, administrator) 11.9 11.0 13.3 10.0 12.2 13.2 13.5 10.5 12.4 16.6 6.4 5.5 7.8Business owner or proprietor 8.4 8.3 8.5 8.0 8.7 9.3 8.6 8.2 8.2 9.7 4.8 3.4 6.7Business salesperson or buyer 4.8 4.7 5.0 4.6 4.7 4.4 6.1 4.4 5.2 4.4 2.5 2.4 2.6Clergy (minister, priest) 0.7 0.8 0.5 0.5 1.2 0.7 0.2 2.2 0.5 0.6 1.4 1.3 1.5Clergy (other religious) 0.1 0.1 0.1 0.1 0.2 0.1 0.1 0.4 0.1 0.1 0.0 0.0 0.0Clinical psychologist 0.1 0.1 0.1 0.1 0.1 0.1 0.1 0.1 0.1 0.2 0.1 0.1 0.1College administrator/staff 0.3 0.3 0.3 0.3 0.4 0.4 0.5 0.5 0.3 0.4 0.5 0.4 0.5College teacher 0.7 0.6 0.9 0.3 1.0 1.1 0.6 1.1 0.7 1.4 0.4 0.5 0.3Computer programmer or analyst 3.7 3.3 4.2 3.7 2.9 3.1 2.6 2.9 4.3 3.6 1.3 0.5 2.6Conservationist or forester 0.2 0.2 0.1 0.2 0.2 0.2 0.1 0.1 0.2 0.1 0.1 0.1 0.0Dentist (including orthodontist) 0.5 0.4 0.8 0.3 0.5 0.4 0.7 0.4 0.7 1.1 0.2 0.1 0.4Dietitian or nutritionist 0.1 0.1 0.1 0.1 0.1 0.1 0.1 0.2 0.1 0.1 0.3 0.4 0.1Engineer 8.8 7.8 10.4 8.6 6.5 6.6 7.0 6.3 10.8 8.6 6.9 7.6 5.9Farmer or rancher 1.1 0.9 1.5 0.8 1.0 0.8 0.5 1.4 1.8 0.5 0.4 0.5 0.3Foreign service worker (including diplomat) 0.1 0.1 0.1 0.1 0.1 0.2 0.1 0.1 0.1 0.2 0.0 0.0 0.1Homemaker (full-time) 0.4 0.4 0.3 0.3 0.4 0.4 0.4 0.5 0.4 0.3 0.3 0.3 0.4Interior decorator (including designer) 0.1 0.1 0.1 0.1 0.0 0.0 0.0 0.1 0.1 0.1 0.1 0.1 0.1Lab technician or hygienist 0.3 0.3 0.4 0.3 0.3 0.2 0.4 0.3 0.4 0.3 0.1 0.0 0.3Law enforcement officer 1.8 2.2 1.3 2.4 1.9 2.0 2.4 1.7 1.3 1.2 1.9 1.7 2.1Lawyer (attorney) or judge 2.6 2.2 3.1 1.7 2.9 3.4 3.1 2.2 2.4 5.8 0.9 0.6 1.3Military service (career) 1.8 2.3 1.2 2.8 1.6 1.5 0.9 1.9 1.3 0.8 4.5 3.5 5.9Musician (performer, composer) 0.2 0.3 0.1 0.3 0.3 0.3 0.2 0.4 0.1 0.2 0.3 0.1 0.6Nurse 0.6 0.6 0.6 0.7 0.5 0.5 0.7 0.5 0.6 0.3 0.6 0.4 0.9Optometrist 0.1 0.1 0.1 0.1 0.1 0.1 0.1 0.1 0.1 0.1 0.0 0.0 0.0Pharmacist 0.4 0.4 0.5 0.3 0.4 0.4 0.6 0.3 0.5 0.5 0.6 0.3 1.0Physician 2.5 1.8 3.5 1.2 2.7 3.1 2.5 2.3 2.6 6.9 1.1 0.7 1.7Policymaker/Government 0.7 0.8 0.6 0.8 0.9 1.0 0.7 0.8 0.6 0.8 1.2 0.9 1.5School counselor 0.1 0.1 0.1 0.1 0.1 0.1 0.1 0.1 0.1 0.1 0.1 0.1 0.0School principal or superintendent 0.2 0.2 0.1 0.2 0.3 0.2 0.2 0.3 0.1 0.2 0.2 0.2 0.2Scientific researcher 0.8 0.5 1.1 0.5 0.7 0.9 0.4 0.5 1.0 1.6 0.5 0.3 0.8Social, welfare, or recreation worker 0.6 0.7 0.5 0.7 0.6 0.6 0.6 0.5 0.5 0.5 1.6 2.0 1.0Therapist (physical, occupational, speech) 0.3 0.3 0.3 0.3 0.3 0.3 0.3 0.4 0.3 0.3 0.3 0.3 0.2Teacher or administrator (elementary) 0.8 0.9 0.6 0.9 0.8 0.7 0.8 1.0 0.6 0.6 0.8 0.7 0.9Teacher or administrator (secondary) 2.0 2.2 1.8 2.2 2.2 2.1 1.8 2.6 1.8 1.6 1.0 0.6 1.6Veterinarian 0.2 0.1 0.2 0.1 0.2 0.2 0.1 0.2 0.2 0.1 0.1 0.0 0.3Writer or journalist 0.3 0.3 0.4 0.3 0.4 0.5 0.4 0.4 0.3 0.6 0.2 0.1 0.3Skilled trades 7.4 8.4 6.1 8.9 7.7 7.5 7.5 8.0 6.5 4.3 7.1 7.3 6.7Laborer (unskilled) 2.9 3.2 2.5 3.3 3.0 2.7 3.2 3.4 2.8 1.4 4.5 4.9 3.9Semi-skilled worker 3.0 3.0 3.0 3.2 2.7 2.3 2.6 3.1 3.3 1.7 3.9 4.2 3.4Unemployed 3.7 4.1 3.2 4.1 4.1 3.8 3.9 4.4 3.4 2.6 9.8 11.2 7.9Other 18.4 20.2 15.9 21.2 18.8 17.9 19.1 19.8 16.7 12.8 28.4 32.0 23.3
2009 CIRP Freshman SurveyWeighted National Norms—Men
Baccalaureate Black Colleges All Bacc Institutions 4-year Colleges Universities and Universities
Institutions 4-yr Coll Universities Public Private Nonsec Catholic Oth Relig Public Private All HBCU Public Private
55

Your mother’s occupation:Accountant or actuary 5.7 5.5 5.9 5.7 5.1 5.1 4.9 5.3 6.2 4.8 5.6 5.4 5.9Actor or entertainer 0.1 0.1 0.0 0.1 0.1 0.1 0.1 0.1 0.0 0.1 0.1 0.1 0.0Architect or urban planner 0.2 0.2 0.3 0.2 0.3 0.4 0.1 0.2 0.2 0.4 0.2 0.3 0.2Artist 0.7 0.7 0.7 0.5 1.0 1.4 0.4 0.8 0.6 0.8 0.1 0.0 0.3Business (clerical) 4.0 4.0 4.0 4.3 3.7 3.6 4.4 3.6 4.0 3.7 3.2 2.8 3.7Business executive (management, administrator) 5.5 5.6 5.5 5.3 6.0 6.0 6.4 5.7 5.3 6.3 6.4 5.6 7.4Business owner or proprietor 2.9 2.8 3.1 2.7 3.0 3.4 2.7 2.7 3.0 3.4 2.9 1.6 4.7Business salesperson or buyer 2.4 2.3 2.4 2.5 2.2 2.4 2.2 2.0 2.5 2.1 1.8 1.7 2.0Clergy (minister, priest) 0.1 0.1 0.1 0.1 0.2 0.2 0.0 0.3 0.1 0.1 0.1 0.2 0.0Clergy (other religious) 0.1 0.2 0.1 0.1 0.2 0.1 0.1 0.4 0.1 0.1 0.0 0.0 0.0Clinical psychologist 0.2 0.2 0.2 0.2 0.2 0.2 0.2 0.1 0.2 0.2 0.4 0.5 0.2College administrator/staff 0.6 0.6 0.6 0.4 0.9 0.9 1.0 0.9 0.6 0.8 0.7 0.8 0.7College teacher 0.5 0.4 0.6 0.3 0.6 0.8 0.3 0.6 0.5 1.0 0.2 0.1 0.4Computer programmer or analyst 1.5 1.3 1.7 1.4 1.2 1.3 1.0 1.1 1.7 1.7 1.2 0.6 1.9Conservationist or forester 0.0 0.0 0.1 0.0 0.1 0.1 0.0 0.0 0.1 0.1 0.0 0.0 0.1Dentist (including orthodontist) 0.6 0.5 0.7 0.5 0.5 0.5 0.6 0.5 0.6 0.7 0.2 0.2 0.1Dietitian or nutritionist 0.3 0.3 0.4 0.3 0.3 0.3 0.4 0.3 0.4 0.3 0.3 0.1 0.6Engineer 1.0 0.7 1.4 0.8 0.6 0.7 0.7 0.5 1.5 1.4 0.6 0.5 0.7Farmer or rancher 0.2 0.2 0.2 0.2 0.2 0.2 0.1 0.2 0.3 0.1 0.0 0.0 0.1Foreign service worker (including diplomat) 0.1 0.1 0.1 0.0 0.1 0.1 0.1 0.1 0.1 0.1 0.0 0.0 0.1Homemaker (full-time) 7.1 6.1 8.4 5.7 6.8 6.4 7.3 7.0 7.3 12.7 1.2 1.0 1.6Interior decorator (including designer) 0.4 0.4 0.5 0.4 0.5 0.6 0.5 0.4 0.4 0.7 0.3 0.1 0.7Lab technician or hygienist 0.7 0.6 0.8 0.7 0.5 0.6 0.7 0.5 0.8 0.8 0.6 0.4 0.9Law enforcement officer 0.3 0.4 0.2 0.4 0.3 0.2 0.3 0.4 0.2 0.2 1.1 1.1 1.0Lawyer (attorney) or judge 1.1 1.0 1.4 0.7 1.4 1.7 1.2 1.1 1.0 2.7 1.4 1.3 1.4Military service (career) 0.2 0.3 0.1 0.3 0.2 0.1 0.1 0.3 0.1 0.1 1.0 0.9 1.1Musician (performer, composer) 0.2 0.2 0.2 0.1 0.2 0.2 0.1 0.3 0.1 0.3 0.1 0.1 0.2Nurse 8.7 9.2 7.9 9.5 8.8 8.3 10.5 8.6 8.2 6.8 11.6 13.2 9.3Optometrist 0.2 0.2 0.1 0.2 0.2 0.2 0.2 0.2 0.1 0.1 0.1 0.1 0.1Pharmacist 0.6 0.6 0.7 0.5 0.6 0.7 0.5 0.6 0.7 0.8 0.6 0.5 0.8Physician 1.1 0.8 1.5 0.5 1.1 1.4 0.9 0.8 1.1 2.9 0.7 0.6 0.9Policymaker/Government 0.5 0.6 0.5 0.6 0.6 0.6 0.4 0.7 0.5 0.5 1.2 1.2 1.4School counselor 0.4 0.4 0.3 0.4 0.5 0.6 0.4 0.5 0.3 0.3 0.4 0.3 0.6School principal or superintendent 0.3 0.3 0.2 0.3 0.4 0.4 0.4 0.4 0.2 0.2 0.4 0.4 0.4Scientific researcher 0.5 0.3 0.7 0.3 0.4 0.5 0.4 0.3 0.6 1.2 0.4 0.4 0.5Social, welfare, or recreation worker 1.8 1.8 1.7 1.9 1.8 1.9 1.7 1.7 1.7 1.6 3.9 4.5 3.0Therapist (physical, occupational, speech) 1.7 1.7 1.8 1.7 1.7 1.7 1.6 1.7 1.8 1.7 1.4 1.8 0.7Teacher or administrator (elementary) 8.1 8.2 7.9 8.2 8.3 8.0 8.3 8.7 8.1 7.0 7.2 7.3 7.1Teacher or administrator (secondary) 4.2 4.4 3.9 4.4 4.5 4.5 3.8 4.8 3.9 4.1 3.9 3.3 4.8Veterinarian 0.1 0.1 0.1 0.1 0.1 0.1 0.1 0.1 0.1 0.1 0.0 0.0 0.0Writer or journalist 0.5 0.4 0.5 0.3 0.6 0.8 0.6 0.4 0.4 0.9 0.3 0.3 0.2Skilled trades 1.6 1.7 1.4 1.8 1.5 1.3 1.6 1.7 1.4 1.0 1.1 1.3 0.9Laborer (unskilled) 1.7 1.7 1.6 1.8 1.6 1.4 1.4 2.0 1.9 0.9 2.0 2.1 1.8Semi-skilled worker 2.1 2.1 2.1 2.4 1.7 1.5 1.8 1.9 2.3 1.3 2.4 2.5 2.2Unemployed 7.9 8.0 7.8 8.3 7.6 7.9 7.2 7.6 7.8 7.6 8.5 9.5 7.0Other 21.3 22.5 19.5 23.2 21.5 20.8 22.7 21.8 20.7 15.2 24.2 25.2 22.7
2009 CIRP Freshman SurveyWeighted National Norms—Men
Baccalaureate Black Colleges All Bacc Institutions 4-year Colleges Universities and Universities
Institutions 4-yr Coll Universities Public Private Nonsec Catholic Oth Relig Public Private All HBCU Public Private
56
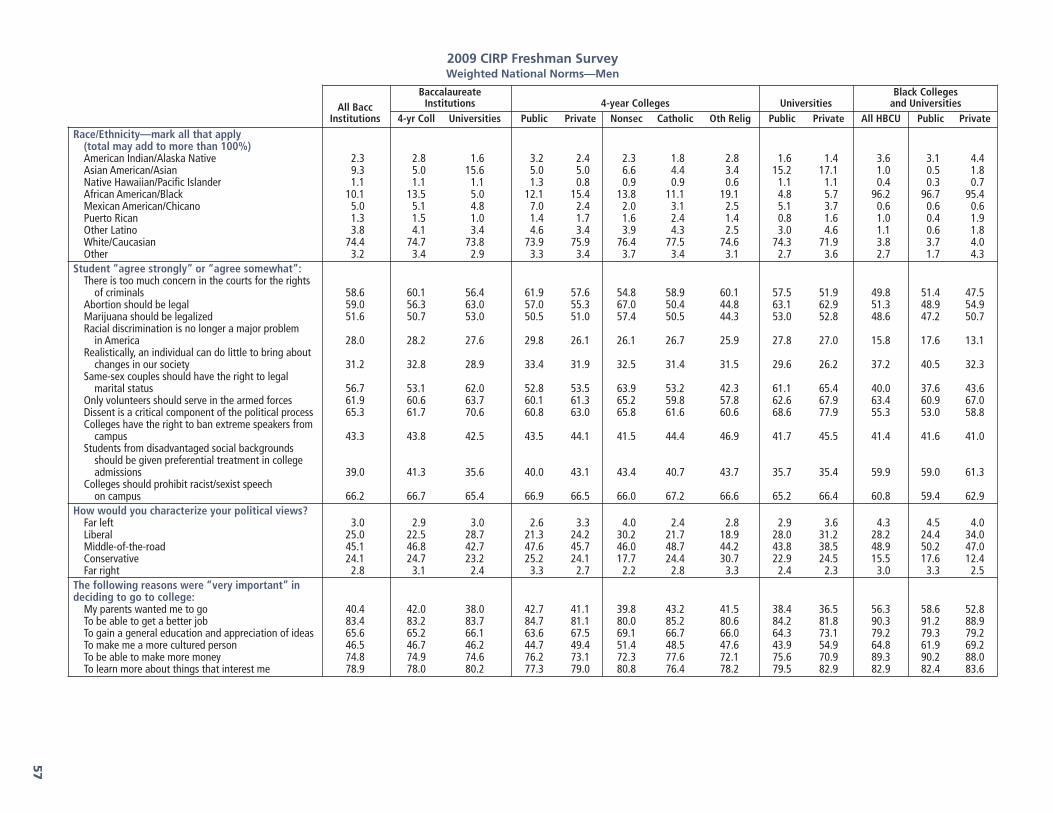
Race/Ethnicity—mark all that apply(total may add to more than 100%)American Indian/Alaska Native 2.3 2.8 1.6 3.2 2.4 2.3 1.8 2.8 1.6 1.4 3.6 3.1 4.4Asian American/Asian 9.3 5.0 15.6 5.0 5.0 6.6 4.4 3.4 15.2 17.1 1.0 0.5 1.8Native Hawaiian/Pacific Islander 1.1 1.1 1.1 1.3 0.8 0.9 0.9 0.6 1.1 1.1 0.4 0.3 0.7African American/Black 10.1 13.5 5.0 12.1 15.4 13.8 11.1 19.1 4.8 5.7 96.2 96.7 95.4Mexican American/Chicano 5.0 5.1 4.8 7.0 2.4 2.0 3.1 2.5 5.1 3.7 0.6 0.6 0.6Puerto Rican 1.3 1.5 1.0 1.4 1.7 1.6 2.4 1.4 0.8 1.6 1.0 0.4 1.9Other Latino 3.8 4.1 3.4 4.6 3.4 3.9 4.3 2.5 3.0 4.6 1.1 0.6 1.8White/Caucasian 74.4 74.7 73.8 73.9 75.9 76.4 77.5 74.6 74.3 71.9 3.8 3.7 4.0Other 3.2 3.4 2.9 3.3 3.4 3.7 3.4 3.1 2.7 3.6 2.7 1.7 4.3
Student “agree strongly” or “agree somewhat”:There is too much concern in the courts for the rights
of criminals 58.6 60.1 56.4 61.9 57.6 54.8 58.9 60.1 57.5 51.9 49.8 51.4 47.5Abortion should be legal 59.0 56.3 63.0 57.0 55.3 67.0 50.4 44.8 63.1 62.9 51.3 48.9 54.9Marijuana should be legalized 51.6 50.7 53.0 50.5 51.0 57.4 50.5 44.3 53.0 52.8 48.6 47.2 50.7Racial discrimination is no longer a major problem
in America 28.0 28.2 27.6 29.8 26.1 26.1 26.7 25.9 27.8 27.0 15.8 17.6 13.1Realistically, an individual can do little to bring about
changes in our society 31.2 32.8 28.9 33.4 31.9 32.5 31.4 31.5 29.6 26.2 37.2 40.5 32.3Same-sex couples should have the right to legal
marital status 56.7 53.1 62.0 52.8 53.5 63.9 53.2 42.3 61.1 65.4 40.0 37.6 43.6Only volunteers should serve in the armed forces 61.9 60.6 63.7 60.1 61.3 65.2 59.8 57.8 62.6 67.9 63.4 60.9 67.0Dissent is a critical component of the political process 65.3 61.7 70.6 60.8 63.0 65.8 61.6 60.6 68.6 77.9 55.3 53.0 58.8Colleges have the right to ban extreme speakers from
campus 43.3 43.8 42.5 43.5 44.1 41.5 44.4 46.9 41.7 45.5 41.4 41.6 41.0Students from disadvantaged social backgrounds
should be given preferential treatment in college admissions 39.0 41.3 35.6 40.0 43.1 43.4 40.7 43.7 35.7 35.4 59.9 59.0 61.3
Colleges should prohibit racist/sexist speech on campus 66.2 66.7 65.4 66.9 66.5 66.0 67.2 66.6 65.2 66.4 60.8 59.4 62.9
How would you characterize your political views?Far left 3.0 2.9 3.0 2.6 3.3 4.0 2.4 2.8 2.9 3.6 4.3 4.5 4.0Liberal 25.0 22.5 28.7 21.3 24.2 30.2 21.7 18.9 28.0 31.2 28.2 24.4 34.0Middle-of-the-road 45.1 46.8 42.7 47.6 45.7 46.0 48.7 44.2 43.8 38.5 48.9 50.2 47.0Conservative 24.1 24.7 23.2 25.2 24.1 17.7 24.4 30.7 22.9 24.5 15.5 17.6 12.4Far right 2.8 3.1 2.4 3.3 2.7 2.2 2.8 3.3 2.4 2.3 3.0 3.3 2.5
The following reasons were “very important” indeciding to go to college:
My parents wanted me to go 40.4 42.0 38.0 42.7 41.1 39.8 43.2 41.5 38.4 36.5 56.3 58.6 52.8To be able to get a better job 83.4 83.2 83.7 84.7 81.1 80.0 85.2 80.6 84.2 81.8 90.3 91.2 88.9To gain a general education and appreciation of ideas 65.6 65.2 66.1 63.6 67.5 69.1 66.7 66.0 64.3 73.1 79.2 79.3 79.2To make me a more cultured person 46.5 46.7 46.2 44.7 49.4 51.4 48.5 47.6 43.9 54.9 64.8 61.9 69.2To be able to make more money 74.8 74.9 74.6 76.2 73.1 72.3 77.6 72.1 75.6 70.9 89.3 90.2 88.0To learn more about things that interest me 78.9 78.0 80.2 77.3 79.0 80.8 76.4 78.2 79.5 82.9 82.9 82.4 83.6
2009 CIRP Freshman SurveyWeighted National Norms—Men
Baccalaureate Black Colleges All Bacc Institutions 4-year Colleges Universities and Universities
Institutions 4-yr Coll Universities Public Private Nonsec Catholic Oth Relig Public Private All HBCU Public Private
57

DURING YOUR LAST YEAR IN HIGH SCHOOL, HOWMUCH TIME DID YOU SPEND DURING A TYPICALWEEK DOING THE FOLLOWING ACTIVITIES?Studying/homework
None 3.8 4.3 3.0 4.8 3.7 3.5 3.5 4.1 3.2 2.2 5.7 6.6 4.3Less than one hour 16.2 18.0 13.5 19.4 16.1 15.4 15.8 16.8 14.7 8.6 19.1 19.5 18.41 to 2 hours 25.2 27.1 22.5 28.7 24.9 23.1 25.1 26.6 24.2 16.0 33.0 37.4 26.63 to 5 hours 26.2 25.8 26.7 25.8 25.8 24.8 26.6 26.5 27.4 24.2 22.4 20.8 24.76 to 10 hours 16.5 15.0 18.6 13.6 16.9 18.4 16.5 15.4 17.8 22.0 11.9 9.7 15.111 to 15 hours 6.6 5.5 8.3 4.6 6.8 7.7 7.1 5.8 7.0 13.2 4.0 2.9 5.616 to 20 hours 3.0 2.3 4.1 1.6 3.3 4.0 3.3 2.6 3.2 7.4 1.8 1.3 2.4Over 20 hours 2.5 1.9 3.3 1.5 2.5 3.1 2.2 2.0 2.4 6.3 2.2 1.8 2.8
Socializing with friendsNone 0.5 0.6 0.5 0.6 0.5 0.6 0.5 0.5 0.5 0.5 0.8 0.9 0.6Less than one hour 1.5 1.7 1.2 1.8 1.6 1.7 1.5 1.5 1.2 1.3 2.8 3.4 1.91 to 2 hours 6.5 6.7 6.2 7.0 6.3 6.2 5.4 6.9 6.4 5.5 8.9 10.1 7.03 to 5 hours 18.6 18.1 19.2 18.3 17.8 16.8 16.6 19.4 19.5 18.1 21.1 22.0 19.86 to 10 hours 25.2 23.9 27.3 23.5 24.3 24.4 24.0 24.3 26.8 28.9 22.1 21.4 23.311 to 15 hours 18.6 18.4 18.9 17.9 19.0 18.7 20.3 18.8 18.8 19.4 13.5 11.7 16.116 to 20 hours 11.0 11.1 10.8 10.8 11.5 12.0 12.6 10.4 10.7 11.2 8.8 7.9 10.1Over 20 hours 18.1 19.6 15.9 20.0 19.0 19.7 19.0 18.2 16.1 15.1 22.1 22.7 21.2
Talking with teachers outside of classNone 12.2 12.4 11.8 13.5 10.9 10.6 10.7 11.4 12.7 8.5 11.9 13.0 10.1Less than one hour 44.2 43.4 45.4 44.9 41.4 39.9 44.0 42.0 46.9 39.6 34.6 36.3 32.01 to 2 hours 29.1 28.6 29.7 27.4 30.3 31.1 29.4 29.8 28.5 34.3 27.7 26.1 30.03 to 5 hours 10.0 10.5 9.4 9.6 11.7 12.1 10.7 11.6 8.6 12.5 15.1 14.0 16.66 to 10 hours 2.8 3.1 2.4 2.7 3.5 3.7 3.2 3.4 2.2 3.4 5.9 5.3 6.711 to 15 hours 0.8 1.0 0.6 0.9 1.1 1.3 1.0 0.8 0.5 0.9 2.4 2.7 1.916 to 20 hours 0.3 0.4 0.2 0.4 0.4 0.5 0.5 0.4 0.2 0.3 0.9 0.7 1.2Over 20 hours 0.5 0.6 0.4 0.5 0.7 0.9 0.5 0.6 0.4 0.5 1.6 1.8 1.5
Exercise or sportsNone 3.1 3.3 3.0 3.5 3.0 3.1 2.6 3.0 3.1 2.4 3.7 3.9 3.4Less than one hour 6.0 5.9 6.1 6.0 5.9 6.8 4.5 5.5 6.4 5.3 5.3 5.1 5.61 to 2 hours 11.9 11.2 13.0 11.8 10.3 10.9 9.3 10.1 13.2 12.0 12.9 13.0 12.73 to 5 hours 17.4 16.3 18.9 16.7 15.9 16.0 15.1 16.1 18.8 19.3 21.2 22.5 19.26 to 10 hours 19.4 18.1 21.2 18.9 17.0 17.9 17.9 15.6 21.2 21.4 16.3 16.0 16.911 to 15 hours 15.9 15.7 16.1 15.4 16.1 16.0 16.8 16.0 16.0 16.8 11.7 11.6 11.816 to 20 hours 10.4 11.0 9.5 10.7 11.5 10.6 12.8 12.1 9.4 10.0 8.4 7.6 9.7Over 20 hours 15.9 18.5 12.1 17.1 20.3 18.7 21.0 21.7 11.9 12.9 20.5 20.4 20.8
PartyingNone 26.3 25.9 26.8 25.9 25.9 23.2 20.1 31.1 27.5 24.6 16.3 16.6 15.8Less than one hour 15.4 14.7 16.5 14.9 14.5 13.8 13.6 15.6 16.7 15.9 12.8 12.8 12.91 to 2 hours 17.5 17.0 18.4 17.1 16.8 17.4 17.2 15.9 18.3 18.9 19.9 20.6 18.83 to 5 hours 19.2 19.4 19.1 19.3 19.5 20.6 21.9 17.4 18.6 20.8 24.3 24.1 24.66 to 10 hours 11.7 12.1 11.1 12.0 12.3 13.0 15.1 10.4 11.0 11.6 11.9 10.8 13.511 to 15 hours 4.9 5.3 4.4 5.3 5.3 5.7 6.2 4.5 4.4 4.3 5.5 5.8 5.116 to 20 hours 2.1 2.3 1.8 2.2 2.4 2.6 2.7 2.1 1.7 1.9 3.7 4.0 3.4Over 20 hours 2.8 3.4 1.9 3.4 3.3 3.7 3.1 3.0 1.9 2.1 5.7 5.5 6.0
2009 CIRP Freshman SurveyWeighted National Norms—Men
Baccalaureate Black Colleges All Bacc Institutions 4-year Colleges Universities and Universities
Institutions 4-yr Coll Universities Public Private Nonsec Catholic Oth Relig Public Private All HBCU Public Private
58

DURING YOUR LAST YEAR IN HIGH SCHOOL, HOWMUCH TIME DID YOU SPEND DURING A TYPICALWEEK DOING THE FOLLOWING ACTIVITIES?Working (for pay)
None 39.3 36.8 43.0 35.3 38.9 41.0 35.3 38.1 41.2 49.6 36.3 34.2 39.5Less than one hour 4.0 4.0 4.1 3.8 4.2 4.2 4.1 4.4 3.8 4.9 3.6 3.6 3.51 to 2 hours 5.1 5.0 5.2 4.6 5.5 5.6 5.2 5.5 4.9 6.6 4.6 4.4 5.03 to 5 hours 8.3 8.5 7.9 8.3 8.9 8.7 8.6 9.1 7.7 8.8 8.4 9.3 7.16 to 10 hours 11.5 11.8 11.0 11.8 11.6 10.8 13.0 11.9 11.3 10.0 13.4 14.4 11.911 to 15 hours 10.8 10.9 10.7 11.2 10.4 9.6 11.8 10.6 11.3 8.1 8.1 7.5 9.116 to 20 hours 9.7 10.2 9.0 11.2 8.8 8.7 10.2 8.4 9.9 6.0 8.1 8.0 8.3Over 20 hours 11.4 12.9 9.1 13.7 11.7 11.5 11.7 11.9 9.9 6.0 17.5 18.6 15.8
Volunteer workNone 32.7 34.9 29.6 36.9 32.0 33.1 30.3 31.6 31.5 22.4 33.0 36.7 27.5Less than one hour 23.9 23.5 24.4 23.6 23.2 22.6 22.8 24.0 24.9 22.7 18.0 18.5 17.41 to 2 hours 22.5 21.2 24.4 20.4 22.2 21.8 22.6 22.6 23.5 27.8 19.5 17.7 22.23 to 5 hours 12.0 11.2 13.3 10.3 12.4 12.4 12.8 12.1 12.5 16.1 15.0 13.8 16.86 to 10 hours 4.7 4.7 4.7 4.3 5.2 5.1 6.0 4.9 4.2 6.3 6.5 5.2 8.511 to 15 hours 1.7 1.8 1.6 1.7 2.0 1.9 2.2 1.9 1.5 2.1 3.6 3.6 3.716 to 20 hours 0.8 0.9 0.7 0.9 1.0 0.9 1.1 0.9 0.7 0.9 1.0 0.8 1.3Over 20 hours 1.7 1.9 1.4 1.8 2.1 2.1 2.1 2.0 1.3 1.5 3.2 3.6 2.7
Student clubs/groupsNone 35.1 39.1 29.2 41.0 36.5 36.1 34.2 38.0 32.1 18.0 35.5 40.5 27.9Less than one hour 15.6 15.2 16.2 15.3 15.1 14.4 15.7 15.7 16.8 13.8 10.7 10.3 11.41 to 2 hours 22.2 20.5 24.6 19.8 21.5 21.7 22.7 20.9 23.9 27.2 20.7 20.2 21.43 to 5 hours 14.4 12.9 16.7 12.1 14.0 14.2 14.6 13.6 15.2 22.3 14.7 11.7 19.16 to 10 hours 6.5 5.9 7.3 5.6 6.4 6.9 6.3 6.0 6.6 10.1 7.4 6.2 9.111 to 15 hours 2.8 2.7 2.8 2.6 3.0 3.2 3.2 2.7 2.6 3.8 5.1 4.8 5.516 to 20 hours 1.3 1.4 1.3 1.4 1.3 1.5 1.3 1.2 1.2 1.8 2.5 2.9 1.9Over 20 hours 2.1 2.3 2.0 2.4 2.1 2.2 2.0 2.0 1.7 3.0 3.5 3.3 3.8
Watching TVNone 6.8 6.5 7.2 6.4 6.7 7.7 4.7 6.6 7.0 8.0 6.0 6.4 5.4Less than one hour 13.7 13.6 13.9 14.1 13.0 13.3 11.2 13.6 14.1 12.9 12.1 12.3 11.71 to 2 hours 22.7 22.2 23.3 22.6 21.8 21.8 22.1 21.6 23.5 22.5 19.7 19.9 19.43 to 5 hours 26.5 26.0 27.2 25.9 26.2 25.7 27.1 26.3 27.2 27.0 22.8 21.8 24.46 to 10 hours 17.0 17.2 16.8 16.9 17.6 17.0 19.1 17.5 16.6 17.5 16.1 16.5 15.511 to 15 hours 6.8 7.2 6.2 7.1 7.3 7.1 8.3 7.0 6.1 6.5 9.6 9.1 10.416 to 20 hours 2.7 2.8 2.5 2.6 3.1 3.0 3.5 3.1 2.5 2.7 4.3 4.2 4.5Over 20 hours 3.8 4.3 3.0 4.3 4.3 4.4 4.0 4.5 3.0 3.0 9.4 9.9 8.7
2009 CIRP Freshman SurveyWeighted National Norms—Men
Baccalaureate Black Colleges All Bacc Institutions 4-year Colleges Universities and Universities
Institutions 4-yr Coll Universities Public Private Nonsec Catholic Oth Relig Public Private All HBCU Public Private
59
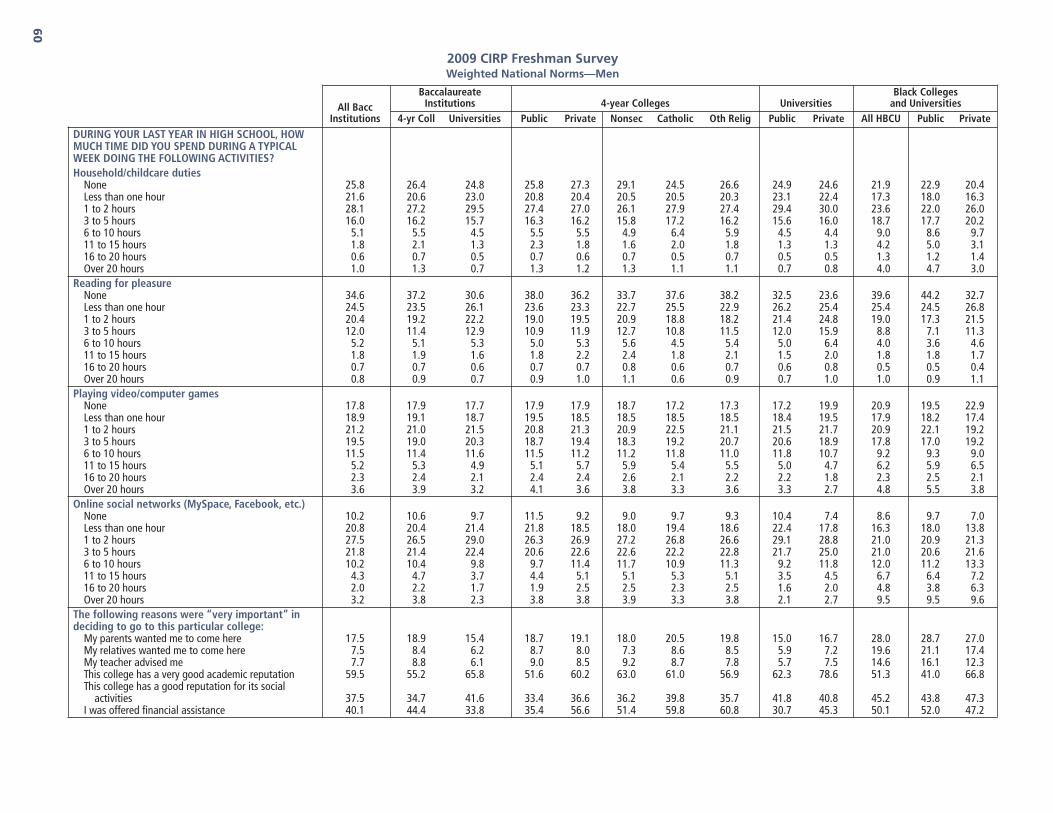
DURING YOUR LAST YEAR IN HIGH SCHOOL, HOWMUCH TIME DID YOU SPEND DURING A TYPICALWEEK DOING THE FOLLOWING ACTIVITIES?Household/childcare duties
None 25.8 26.4 24.8 25.8 27.3 29.1 24.5 26.6 24.9 24.6 21.9 22.9 20.4Less than one hour 21.6 20.6 23.0 20.8 20.4 20.5 20.5 20.3 23.1 22.4 17.3 18.0 16.31 to 2 hours 28.1 27.2 29.5 27.4 27.0 26.1 27.9 27.4 29.4 30.0 23.6 22.0 26.03 to 5 hours 16.0 16.2 15.7 16.3 16.2 15.8 17.2 16.2 15.6 16.0 18.7 17.7 20.26 to 10 hours 5.1 5.5 4.5 5.5 5.5 4.9 6.4 5.9 4.5 4.4 9.0 8.6 9.711 to 15 hours 1.8 2.1 1.3 2.3 1.8 1.6 2.0 1.8 1.3 1.3 4.2 5.0 3.116 to 20 hours 0.6 0.7 0.5 0.7 0.6 0.7 0.5 0.7 0.5 0.5 1.3 1.2 1.4Over 20 hours 1.0 1.3 0.7 1.3 1.2 1.3 1.1 1.1 0.7 0.8 4.0 4.7 3.0
Reading for pleasureNone 34.6 37.2 30.6 38.0 36.2 33.7 37.6 38.2 32.5 23.6 39.6 44.2 32.7Less than one hour 24.5 23.5 26.1 23.6 23.3 22.7 25.5 22.9 26.2 25.4 25.4 24.5 26.81 to 2 hours 20.4 19.2 22.2 19.0 19.5 20.9 18.8 18.2 21.4 24.8 19.0 17.3 21.53 to 5 hours 12.0 11.4 12.9 10.9 11.9 12.7 10.8 11.5 12.0 15.9 8.8 7.1 11.36 to 10 hours 5.2 5.1 5.3 5.0 5.3 5.6 4.5 5.4 5.0 6.4 4.0 3.6 4.611 to 15 hours 1.8 1.9 1.6 1.8 2.2 2.4 1.8 2.1 1.5 2.0 1.8 1.8 1.716 to 20 hours 0.7 0.7 0.6 0.7 0.7 0.8 0.6 0.7 0.6 0.8 0.5 0.5 0.4Over 20 hours 0.8 0.9 0.7 0.9 1.0 1.1 0.6 0.9 0.7 1.0 1.0 0.9 1.1
Playing video/computer gamesNone 17.8 17.9 17.7 17.9 17.9 18.7 17.2 17.3 17.2 19.9 20.9 19.5 22.9Less than one hour 18.9 19.1 18.7 19.5 18.5 18.5 18.5 18.5 18.4 19.5 17.9 18.2 17.41 to 2 hours 21.2 21.0 21.5 20.8 21.3 20.9 22.5 21.1 21.5 21.7 20.9 22.1 19.23 to 5 hours 19.5 19.0 20.3 18.7 19.4 18.3 19.2 20.7 20.6 18.9 17.8 17.0 19.26 to 10 hours 11.5 11.4 11.6 11.5 11.2 11.2 11.8 11.0 11.8 10.7 9.2 9.3 9.011 to 15 hours 5.2 5.3 4.9 5.1 5.7 5.9 5.4 5.5 5.0 4.7 6.2 5.9 6.516 to 20 hours 2.3 2.4 2.1 2.4 2.4 2.6 2.1 2.2 2.2 1.8 2.3 2.5 2.1Over 20 hours 3.6 3.9 3.2 4.1 3.6 3.8 3.3 3.6 3.3 2.7 4.8 5.5 3.8
Online social networks (MySpace, Facebook, etc.)None 10.2 10.6 9.7 11.5 9.2 9.0 9.7 9.3 10.4 7.4 8.6 9.7 7.0Less than one hour 20.8 20.4 21.4 21.8 18.5 18.0 19.4 18.6 22.4 17.8 16.3 18.0 13.81 to 2 hours 27.5 26.5 29.0 26.3 26.9 27.2 26.8 26.6 29.1 28.8 21.0 20.9 21.33 to 5 hours 21.8 21.4 22.4 20.6 22.6 22.6 22.2 22.8 21.7 25.0 21.0 20.6 21.66 to 10 hours 10.2 10.4 9.8 9.7 11.4 11.7 10.9 11.3 9.2 11.8 12.0 11.2 13.311 to 15 hours 4.3 4.7 3.7 4.4 5.1 5.1 5.3 5.1 3.5 4.5 6.7 6.4 7.216 to 20 hours 2.0 2.2 1.7 1.9 2.5 2.5 2.3 2.5 1.6 2.0 4.8 3.8 6.3Over 20 hours 3.2 3.8 2.3 3.8 3.8 3.9 3.3 3.8 2.1 2.7 9.5 9.5 9.6
The following reasons were “very important” indeciding to go to this particular college:
My parents wanted me to come here 17.5 18.9 15.4 18.7 19.1 18.0 20.5 19.8 15.0 16.7 28.0 28.7 27.0My relatives wanted me to come here 7.5 8.4 6.2 8.7 8.0 7.3 8.6 8.5 5.9 7.2 19.6 21.1 17.4My teacher advised me 7.7 8.8 6.1 9.0 8.5 9.2 8.7 7.8 5.7 7.5 14.6 16.1 12.3This college has a very good academic reputation 59.5 55.2 65.8 51.6 60.2 63.0 61.0 56.9 62.3 78.6 51.3 41.0 66.8This college has a good reputation for its social
activities 37.5 34.7 41.6 33.4 36.6 36.2 39.8 35.7 41.8 40.8 45.2 43.8 47.3I was offered financial assistance 40.1 44.4 33.8 35.4 56.6 51.4 59.8 60.8 30.7 45.3 50.1 52.0 47.2
2009 CIRP Freshman SurveyWeighted National Norms—Men
Baccalaureate Black Colleges All Bacc Institutions 4-year Colleges Universities and Universities
Institutions 4-yr Coll Universities Public Private Nonsec Catholic Oth Relig Public Private All HBCU Public Private
60

The following reasons were “very important” indeciding to go to this particular college:
The cost of attending this college 37.5 39.4 34.7 47.1 28.8 26.8 33.9 28.7 37.4 24.7 43.2 52.0 30.1High school counselor advised me 9.8 11.0 8.1 11.0 11.0 12.1 12.0 9.3 7.4 10.5 16.8 17.8 15.3Private college counselor advised me 3.7 4.3 2.8 3.4 5.6 5.6 5.6 5.6 2.2 5.1 7.8 8.0 7.5I wanted to live near home 16.3 19.0 12.2 21.8 15.2 13.4 20.3 14.9 12.9 9.6 18.8 21.1 15.3Not offered aid by first choice 7.8 8.0 7.5 7.7 8.4 7.5 10.1 8.7 7.6 7.1 14.7 16.5 12.0Could not afford first choice 10.4 10.8 9.8 12.3 8.7 8.1 10.4 8.5 10.6 6.5 17.7 21.2 12.6This college’s graduates gain admission to top
graduate/professional schools 30.6 26.8 36.1 23.5 31.3 33.6 33.4 28.1 32.3 50.1 36.2 25.8 51.5This college’s graduates get good jobs 53.4 50.2 58.2 47.7 53.6 56.4 57.2 48.9 55.7 67.6 53.7 45.7 65.4I was attracted by the religious affiliation/orientation
of the college 6.4 7.9 4.3 4.1 13.0 4.5 14.1 21.7 2.2 12.0 13.8 12.3 16.0I wanted to go to a school about the size of this
college 32.7 34.7 29.6 29.0 42.5 41.5 42.8 43.5 27.1 39.0 29.6 27.4 32.9Rankings in national magazines 18.8 13.8 26.1 11.7 16.7 19.4 15.9 14.2 23.7 35.2 17.6 11.6 26.6Information from a website 15.4 15.0 16.1 13.7 16.7 19.5 15.2 14.5 14.5 21.8 22.0 19.7 25.3I was admitted through an Early Action or Early
Decision program 11.3 10.5 12.3 8.4 13.5 16.0 13.8 10.7 9.4 23.3 12.0 11.4 13.0The athletic department recruited me 12.0 17.3 4.2 11.2 25.5 22.4 21.4 30.5 3.5 6.8 16.0 17.9 13.1A visit to the campus 35.1 36.7 32.8 31.4 44.0 45.8 41.8 43.1 30.0 43.2 35.7 35.7 35.7Ability to take online courses 2.7 3.1 2.0 3.1 3.1 2.8 3.7 3.3 2.0 2.2 7.5 9.0 5.2
Your probable field of study:Arts and Humanities
Art, fine and applied 2.2 3.1 0.9 1.9 4.7 9.1 0.9 1.5 1.0 0.5 1.6 2.0 1.0English (language and literature) 1.3 1.4 1.1 1.3 1.6 1.8 1.2 1.6 1.0 1.4 0.9 0.6 1.3History 1.9 2.2 1.5 2.1 2.2 1.9 2.4 2.5 1.4 1.8 0.4 0.4 0.5Journalism 0.9 0.9 1.0 0.9 0.8 0.7 1.3 0.8 1.0 1.1 1.2 1.5 0.8Language and Literature (except English) 0.4 0.4 0.4 0.4 0.4 0.4 0.3 0.4 0.4 0.6 0.0 0.0 0.1Music 1.9 2.3 1.4 2.5 2.0 1.3 0.8 3.3 1.4 1.2 2.7 3.4 1.6Philosophy 0.5 0.5 0.5 0.3 0.6 0.6 0.6 0.6 0.4 0.8 0.1 0.0 0.4Speech 0.1 0.1 0.0 0.1 0.0 0.0 0.0 0.1 0.0 0.1 0.0 0.0 0.0Theater or Drama 0.9 1.2 0.6 1.3 1.0 1.2 0.5 1.1 0.6 0.8 0.8 0.4 1.2Theology or Religion 0.3 0.4 0.1 0.1 0.8 0.1 0.3 1.8 0.0 0.3 0.1 0.0 0.3Other Arts and Humanities 1.0 1.2 0.7 1.2 1.3 1.7 0.4 1.1 0.6 0.9 0.7 0.7 0.8
Biological ScienceBiology (general) 4.7 3.8 6.0 3.3 4.6 3.9 6.7 4.5 5.7 6.9 6.7 4.0 10.7Biochemistry or Biophysics 1.4 0.9 2.1 0.7 1.2 1.1 1.2 1.2 2.2 2.1 0.5 0.4 0.6Botany 0.1 0.0 0.1 0.0 0.1 0.1 0.0 0.1 0.1 0.0 0.0 0.0 0.0Environmental Science 0.9 1.0 0.7 0.8 1.2 1.4 0.6 1.3 0.7 0.6 0.1 0.1 0.1Marine (Life) Science 0.4 0.5 0.2 0.6 0.4 0.4 0.2 0.4 0.2 0.2 0.1 0.1 0.0Microbiology or Bacteriology 0.3 0.2 0.5 0.2 0.1 0.2 0.1 0.1 0.5 0.4 0.2 0.3 0.1Zoology 0.3 0.3 0.3 0.3 0.3 0.4 0.2 0.3 0.3 0.0 0.2 0.3 0.1Other Biological Science 0.6 0.4 0.9 0.4 0.4 0.4 0.3 0.4 0.9 0.8 0.6 0.7 0.5
2009 CIRP Freshman SurveyWeighted National Norms—Men
Baccalaureate Black Colleges All Bacc Institutions 4-year Colleges Universities and Universities
Institutions 4-yr Coll Universities Public Private Nonsec Catholic Oth Relig Public Private All HBCU Public Private
61

Your probable field of study (continued):Business
Accounting 2.8 2.9 2.7 2.7 3.2 2.7 5.5 2.8 2.8 2.4 3.7 4.1 3.2Business Administration (general) 4.3 4.6 3.8 4.2 5.2 5.3 5.1 5.2 3.9 3.7 3.7 3.7 3.7Finance 2.3 1.6 3.3 1.2 2.0 2.2 3.7 1.2 2.7 5.6 1.8 1.2 2.8International Business 1.3 1.4 1.3 1.0 1.8 2.0 1.9 1.5 1.0 2.3 0.7 0.3 1.3Marketing 2.6 2.6 2.5 2.4 3.0 2.9 4.7 2.3 2.5 2.6 4.2 3.8 4.9Management 4.7 5.4 3.7 5.0 5.9 6.1 6.8 5.4 3.9 3.3 6.1 5.3 7.3Secretarial Studies 0.0 0.0 0.0 0.0 0.0 0.0 0.0 0.0 0.0 0.0 0.0 0.0 0.0Other Business 1.1 1.0 1.3 0.7 1.4 1.7 1.2 1.2 1.3 1.3 1.1 1.3 0.8
EducationBusiness Education 0.1 0.2 0.1 0.2 0.2 0.2 0.1 0.2 0.1 0.1 0.1 0.2 0.0Elementary Education 0.6 0.9 0.2 0.9 0.9 0.6 0.9 1.2 0.2 0.1 1.3 1.7 0.8Music or Art Education 0.5 0.7 0.3 0.8 0.5 0.2 0.2 1.0 0.3 0.2 1.4 2.1 0.2Physical Education or Recreation 1.2 1.9 0.3 2.0 1.8 1.0 0.9 2.9 0.3 0.1 3.8 5.2 1.7Secondary Education 2.0 2.7 1.0 2.9 2.6 1.6 3.1 3.4 1.1 0.5 2.3 2.8 1.4Special Education 0.2 0.3 0.1 0.3 0.2 0.1 0.3 0.3 0.1 0.0 0.1 0.2 0.0Other Education 0.2 0.2 0.1 0.2 0.2 0.1 0.2 0.2 0.1 0.1 0.1 0.1 0.0
EngineeringAeronautical or Astronautical Engineering 1.7 1.3 2.3 1.9 0.4 0.6 0.2 0.3 2.7 0.8 0.4 0.2 0.7Civil Engineering 2.3 1.7 3.1 2.3 1.0 0.7 1.6 1.1 3.3 2.2 1.6 1.9 1.2Chemical Engineering 1.4 0.5 2.7 0.6 0.4 0.4 0.4 0.4 2.8 2.5 0.2 0.0 0.6Computer Engineering 2.2 1.7 3.0 2.1 1.1 1.1 1.0 1.0 3.3 1.8 3.0 3.1 3.0Electrical or Electronic Engineering 2.0 1.3 3.0 1.8 0.8 1.0 0.8 0.6 3.3 1.9 2.1 3.0 0.7Industrial Engineering 0.4 0.2 0.6 0.2 0.1 0.1 0.0 0.1 0.7 0.3 1.1 1.8 0.0Mechanical Engineering 4.8 3.3 6.8 4.2 2.2 2.9 2.1 1.5 7.3 5.0 2.0 2.2 1.8Other Engineering 2.8 1.8 4.2 2.4 0.9 1.2 0.6 0.8 4.3 4.1 1.3 1.6 1.0
Physical ScienceAstronomy 0.1 0.1 0.2 0.1 0.1 0.1 0.0 0.1 0.2 0.2 0.0 0.0 0.0Atmospheric Science (incl. Meteorology) 0.2 0.1 0.3 0.1 0.1 0.0 0.0 0.1 0.4 0.1 0.0 0.0 0.0Chemistry 1.3 1.2 1.4 1.1 1.3 1.1 1.4 1.4 1.3 2.0 1.2 0.4 2.4Earth Science 0.2 0.2 0.2 0.2 0.2 0.3 0.1 0.2 0.2 0.1 0.0 0.0 0.0Marine Science (incl. Oceanography) 0.1 0.2 0.1 0.2 0.1 0.2 0.1 0.1 0.0 0.1 0.0 0.0 0.0Mathematics 1.0 0.9 1.1 0.8 1.1 1.2 0.9 0.9 0.9 1.5 0.7 0.5 1.1Physics 1.1 1.0 1.2 1.0 1.0 1.2 0.6 1.0 1.0 1.6 0.5 0.2 0.9Other Physical Science 0.3 0.3 0.2 0.3 0.3 0.2 0.2 0.4 0.2 0.2 0.0 0.0 0.1
ProfessionalArchitecture or Urban Planning 0.7 0.5 1.0 0.5 0.5 0.6 0.5 0.3 1.1 0.6 0.5 0.6 0.4Family & Consumer Sciences 0.0 0.0 0.0 0.0 0.0 0.0 0.0 0.1 0.0 0.0 0.1 0.1 0.0Health Technology (medical, dental, laboratory) 0.4 0.4 0.3 0.4 0.4 0.3 0.6 0.4 0.3 0.4 0.3 0.2 0.4Library or Archival Science 0.1 0.1 0.0 0.1 0.1 0.1 0.1 0.1 0.0 0.0 0.1 0.1 0.1Medicine, Dentistry, Veterinary Medicine 3.0 2.6 3.7 2.2 3.1 2.3 4.0 3.5 3.2 5.3 2.4 1.6 3.5Nursing 0.9 1.2 0.5 1.2 1.1 0.4 3.1 1.0 0.6 0.3 0.8 0.9 0.8Pharmacy 1.0 1.1 0.9 0.8 1.6 1.6 1.7 1.6 0.7 1.5 1.7 0.5 3.6Therapy (occupational, physical, speech) 1.6 2.1 1.0 2.0 2.2 1.4 3.0 2.8 1.1 0.4 2.3 3.2 1.0Other Professional 0.6 0.8 0.4 0.9 0.7 0.5 0.8 0.8 0.4 0.6 0.5 0.6 0.4
2009 CIRP Freshman SurveyWeighted National Norms—Men
Baccalaureate Black Colleges All Bacc Institutions 4-year Colleges Universities and Universities
Institutions 4-yr Coll Universities Public Private Nonsec Catholic Oth Relig Public Private All HBCU Public Private
62

Your probable field of study (continued):Social Science
Anthropology 0.2 0.2 0.3 0.2 0.2 0.3 0.1 0.2 0.3 0.4 0.0 0.0 0.1Economics 1.1 0.8 1.5 0.5 1.3 2.0 0.7 0.8 0.9 3.7 0.4 0.0 1.0Ethnic Studies 0.0 0.0 0.0 0.1 0.0 0.0 0.0 0.0 0.0 0.1 0.0 0.0 0.0Geography 0.1 0.1 0.1 0.1 0.1 0.1 0.0 0.1 0.1 0.0 0.2 0.1 0.2Political Science (gov’t., international relations) 3.7 3.5 4.0 3.2 3.8 4.2 4.1 3.4 3.1 7.2 3.9 2.0 6.7Psychology 2.7 3.0 2.4 3.0 3.0 3.0 3.0 3.1 2.5 2.1 3.8 4.4 2.9Public Policy 0.1 0.1 0.2 0.0 0.1 0.1 0.1 0.1 0.1 0.4 0.1 0.0 0.2Social Work 0.2 0.2 0.1 0.2 0.2 0.1 0.2 0.5 0.1 0.0 0.7 1.0 0.3Sociology 0.5 0.6 0.4 0.6 0.5 0.4 0.6 0.5 0.5 0.3 1.1 1.2 0.9Women’s Studies 0.0 0.0 0.0 0.0 0.0 0.0 0.0 0.0 0.0 0.0 0.1 0.0 0.2Other Social Science 0.3 0.4 0.2 0.4 0.3 0.3 0.3 0.3 0.2 0.3 0.4 0.4 0.4
TechnicalBuilding Trades 0.0 0.0 0.0 0.1 0.0 0.0 0.0 0.0 0.1 0.0 0.0 0.0 0.0Data Processing or Computer Programming 1.1 1.2 0.9 1.3 1.1 1.0 0.6 1.3 1.0 0.6 1.2 0.9 1.5Drafting or Design 0.3 0.3 0.1 0.3 0.4 0.7 0.1 0.3 0.2 0.1 0.7 1.1 0.2Electronics 0.1 0.2 0.1 0.2 0.1 0.2 0.0 0.1 0.1 0.0 0.1 0.1 0.0Mechanics 0.1 0.1 0.0 0.1 0.1 0.1 0.0 0.2 0.0 0.0 0.0 0.0 0.0Other Technical 0.1 0.1 0.1 0.1 0.1 0.1 0.0 0.3 0.1 0.1 0.0 0.0 0.0
Other FieldsAgriculture 0.8 0.8 0.7 1.1 0.3 0.3 0.0 0.5 0.9 0.1 1.4 2.3 0.1Communications 1.3 1.3 1.3 1.3 1.3 1.2 1.5 1.4 1.3 1.3 2.4 2.7 1.9Computer Science 1.9 1.8 1.9 2.0 1.6 1.6 1.4 1.7 2.0 1.1 3.3 3.3 3.4Forestry 0.2 0.2 0.2 0.2 0.1 0.0 0.1 0.2 0.2 0.0 0.3 0.5 0.0Kinesiology 0.8 1.0 0.6 1.3 0.6 0.3 0.3 1.0 0.7 0.1 0.4 0.3 0.4Law Enforcement 2.2 3.4 0.6 3.8 2.8 2.5 2.6 3.3 0.6 0.4 4.4 4.8 3.8Military Science 0.3 0.4 0.1 0.6 0.2 0.1 0.3 0.2 0.1 0.1 0.1 0.1 0.1Other Field 1.5 1.8 1.1 1.5 2.2 2.6 1.1 2.4 1.2 0.7 1.5 1.9 1.1Undecided 6.2 6.8 5.3 7.3 6.0 6.0 6.4 5.9 5.5 4.9 3.3 3.5 2.8
Objectives considered to be “Essential” or “Very Important”:
Becoming accomplished in one of the performing arts(acting, dancing, etc.) 15.3 16.6 13.3 16.0 17.5 18.4 13.9 18.1 12.5 16.1 27.8 30.6 23.8
Becoming an authority in my field 60.9 60.7 61.1 60.2 61.4 61.3 61.8 61.4 59.6 66.7 73.4 71.6 76.1Obtaining recognition from my colleagues for
contributions to my special field 56.8 55.4 58.9 55.0 56.1 57.2 58.3 53.9 58.1 62.0 68.7 67.0 71.2Influencing the political structure 23.8 24.3 22.9 24.1 24.7 24.6 25.0 24.5 21.3 28.7 40.6 39.8 41.7Influencing social values 39.3 41.1 36.6 39.9 42.8 41.5 42.7 44.1 35.0 42.5 56.8 53.9 61.1Raising a family 74.8 75.0 74.5 74.8 75.4 71.6 79.3 77.7 74.1 76.1 81.9 80.4 84.1Being very well off financially 79.1 78.4 80.2 79.5 76.9 76.8 82.6 74.5 81.1 77.0 88.0 85.3 91.9Helping others who are in difficulty 61.4 61.9 60.8 60.4 63.8 60.5 64.9 66.9 59.1 67.1 75.3 72.1 79.9Making a theoretical contribution to science 24.3 21.4 28.6 21.1 21.8 21.7 23.5 21.1 28.2 30.2 32.8 32.0 34.0Writing original works (poems, novels, short stories,
etc.) 15.8 17.1 14.0 16.3 18.2 19.6 16.3 17.6 13.1 17.1 29.5 30.2 28.5Creating artistic work (painting, sculpture,
decorating, etc.) 14.3 15.9 11.9 14.7 17.5 21.2 13.1 15.3 11.5 13.4 25.3 27.1 22.6Becoming successful in a business of my own 46.3 46.9 45.3 45.5 48.9 50.4 51.9 46.0 44.5 48.1 71.2 70.4 72.4Becoming involved in programs to clean up the
environment 24.2 23.9 24.6 22.0 26.5 28.4 25.2 24.9 23.8 27.8 43.6 41.9 46.1
2009 CIRP Freshman SurveyWeighted National Norms—Men
Baccalaureate Black Colleges All Bacc Institutions 4-year Colleges Universities and Universities
Institutions 4-yr Coll Universities Public Private Nonsec Catholic Oth Relig Public Private All HBCU Public Private
63

Objectives considered to be “Essential” or “VeryImportant”:
Developing a meaningful philosophy of life 48.8 47.9 50.1 46.5 49.8 50.8 48.0 49.6 48.3 57.0 57.6 55.1 61.2Participating in a community action program 24.3 24.3 24.1 22.3 27.2 26.2 27.4 28.1 22.2 31.2 47.2 43.0 53.6Helping to promote racial understanding 30.0 30.5 29.4 28.7 32.9 32.3 33.0 33.4 28.2 33.7 55.0 49.8 62.7Keeping up to date with political affairs 39.2 37.5 41.8 36.6 38.6 40.2 40.2 36.2 39.6 49.9 46.3 41.5 53.5Becoming a community leader 35.4 35.7 35.0 34.4 37.5 36.1 37.9 38.9 32.9 42.6 56.7 52.5 62.9Improving my understanding of other
countries/cultures 44.5 43.6 45.8 41.7 46.1 48.0 44.5 44.8 43.4 54.7 55.9 51.9 61.7Adopting “green” practices to protect the
environment 36.0 34.2 38.6 32.9 36.1 39.7 35.9 32.5 37.7 42.1 44.3 43.1 46.1Student estimates “Very Good Chance” that they will:
Change major field 12.3 11.7 13.2 12.4 10.6 10.4 10.9 10.7 13.1 13.5 9.4 8.9 10.0Change career choice 11.3 10.7 12.3 10.5 11.0 11.5 10.2 10.7 11.6 15.0 7.8 7.9 7.6Participate in student government 6.1 6.0 6.1 5.7 6.5 6.7 6.3 6.3 5.3 8.9 14.6 13.4 16.3Get a job to help pay for college expenses 41.5 40.4 43.1 40.2 40.6 40.3 41.0 40.8 44.4 38.5 36.8 36.1 37.8Work full-time while attending college 5.7 6.9 4.0 8.3 4.9 5.0 5.1 4.6 4.1 3.6 11.0 12.0 9.6Join a social fraternity or sorority 8.2 7.7 9.0 7.8 7.5 7.5 5.6 8.4 8.8 9.6 30.7 30.7 30.8Play club, intramural, or recreational sports 39.5 37.3 42.7 36.4 38.5 37.1 41.8 38.6 41.8 46.0 29.3 28.9 29.8Play intercollegiate athletics (eg NCAA or
NAIA-sponsored) 18.1 25.2 7.5 19.1 33.5 30.8 27.6 38.8 6.7 10.3 29.0 31.9 24.6Make at least a “B” average 64.4 61.4 69.1 59.0 64.5 65.2 66.4 63.1 67.4 75.2 65.0 60.4 71.9Need extra time to complete your degree
requirements 5.8 6.2 5.3 6.4 6.0 5.0 6.4 6.8 5.7 4.1 10.6 12.8 7.4Participate in student protests or demonstrations 5.2 5.1 5.4 4.4 6.0 6.9 5.2 5.4 4.9 7.3 9.7 8.7 11.1Transfer to another college before graduating 6.5 8.1 4.1 8.9 7.0 5.8 6.1 8.6 4.3 3.3 14.8 16.0 12.9Be satisfied with your college 52.0 48.4 57.5 45.7 52.0 54.7 51.8 49.2 55.5 65.1 41.0 35.3 49.4Participate in volunteer or community service work 20.1 18.5 22.5 15.2 22.8 22.0 23.3 23.6 19.1 34.9 29.0 20.9 40.9Seek personal counseling 6.8 6.7 6.9 6.5 6.9 7.1 7.0 6.8 6.9 6.8 12.7 12.4 13.2Communicate regularly with your professors 32.5 32.0 33.1 28.8 36.4 39.4 33.7 34.5 30.2 43.9 35.1 31.5 40.5Socialize with someone of another racial/ethnic group 59.8 57.0 64.0 55.5 59.1 60.3 56.1 59.1 61.9 71.7 49.3 45.2 55.5Participate in student clubs/groups 37.1 33.0 43.3 31.0 35.6 38.0 36.1 32.9 39.8 55.9 35.4 31.0 41.9Participate in a study abroad program 20.8 19.3 23.1 15.6 24.3 26.6 22.2 22.8 20.0 34.3 21.9 18.8 26.5Have a roommate of different race/ethnicity 25.0 24.0 26.4 23.0 25.3 26.8 19.6 26.2 23.8 35.9 16.6 16.3 17.0Discuss course content with students outside of class 40.2 35.8 46.8 33.4 39.0 42.3 34.8 37.3 44.0 56.8 31.0 24.9 40.0Work on a professor’s research project 28.4 29.1 27.4 28.4 30.1 30.9 29.3 29.7 26.3 31.5 42.6 39.1 47.6
Do you give the Higher Education ResearchInstitute (HERI) permission to include your IDnumber should your college request the data foradditional research analyses?
Yes 67.8 69.4 65.2 72.7 64.9 63.2 63.8 67.3 66.9 59.2 59.4 63.2 54.0No 32.2 30.6 34.8 27.3 35.1 36.8 36.2 32.7 33.1 40.8 40.6 36.8 46.0
2009 CIRP Freshman SurveyWeighted National Norms—Men
Baccalaureate Black Colleges All Bacc Institutions 4-year Colleges Universities and Universities
Institutions 4-yr Coll Universities Public Private Nonsec Catholic Oth Relig Public Private All HBCU Public Private
64

CIRP Construct: Habits of MindHigh Construct Score Group 27.7 25.2 31.3 24.2 26.7 29.5 24.9 24.3 28.8 41.2 28.4 24.4 34.6Average Construct Score Group 38.0 37.1 39.2 37.8 36.1 35.1 37.1 36.7 39.9 36.6 32.5 31.5 34.1Low Construct Score Group 34.3 37.7 29.4 38.0 37.3 35.4 38.0 38.9 31.3 22.2 39.0 44.1 31.3Mean Score 50.2 49.5 51.1 49.4 49.7 50.2 49.5 49.3 50.6 53.1 49.7 48.8 51.1
CIRP Construct: Academic Self-ConceptHigh Construct Score Group 29.9 24.0 38.5 22.8 25.5 26.4 22.9 25.7 34.9 52.3 30.8 27.5 35.9Average Construct Score Group 40.6 39.7 41.9 40.0 39.2 39.2 41.8 38.0 43.7 34.9 34.8 33.6 36.6Low Construct Score Group 29.5 36.4 19.6 37.1 35.3 34.4 35.2 36.3 21.4 12.7 34.4 38.9 27.5Mean Score 50.4 49.0 52.5 48.8 49.3 49.4 49.0 49.3 51.9 55.0 50.0 49.1 51.4
CIRP Construct: Social Self-ConceptHigh Construct Score Group 34.9 35.0 34.8 34.1 36.1 34.5 36.1 37.8 32.8 42.5 51.3 48.7 55.3Average Construct Score Group 37.4 37.2 37.6 37.4 36.9 37.2 38.0 36.2 38.4 34.9 28.9 28.2 30.0Low Construct Score Group 27.7 27.8 27.5 28.4 27.0 28.4 25.9 26.0 28.8 22.6 19.8 23.0 14.8Mean Score 50.7 50.7 50.6 50.5 50.9 50.5 51.1 51.3 50.2 52.2 54.0 53.3 55.0
CIRP Construct: Pluralistic OrientationHigh Construct Score Group 29.0 27.5 31.2 27.0 28.1 30.1 26.3 26.5 29.2 38.9 32.8 29.7 37.5Average Construct Score Group 36.8 35.9 38.0 36.3 35.5 35.3 37.1 35.0 38.4 36.5 33.0 33.5 32.3Low Construct Score Group 34.3 36.6 30.8 36.7 36.5 34.6 36.6 38.4 32.4 24.7 34.2 36.8 30.2Mean Score 50.2 49.8 50.9 49.7 49.8 50.3 49.7 49.3 50.5 52.5 50.4 49.6 51.7
CIRP Construct: Social AgencyHigh Construct Score Group 24.9 25.1 24.5 23.2 27.6 26.8 28.0 28.3 22.5 32.1 49.0 43.8 56.8Average Construct Score Group 39.7 39.6 39.9 39.3 40.1 38.8 40.5 41.2 39.8 40.4 34.2 37.5 29.5Low Construct Score Group 35.4 35.3 35.5 37.5 32.3 34.4 31.5 30.5 37.7 27.5 16.7 18.7 13.7Mean Score 47.3 47.4 47.3 46.8 48.1 47.8 48.3 48.4 46.8 49.2 53.0 51.8 54.8
CIRP Construct: College Reputation OrientationHigh Construct Score Group 28.0 24.5 33.1 21.6 28.5 30.6 31.0 25.1 29.5 46.8 32.4 22.2 47.5Average Construct Score Group 27.4 27.5 27.3 27.6 27.3 28.4 27.8 26.0 28.4 23.3 23.6 25.6 20.6Low Construct Score Group 44.6 48.0 39.5 50.8 44.2 41.1 41.1 48.9 42.1 29.9 44.0 52.1 31.9Mean Score 48.1 47.3 49.1 46.8 48.1 48.6 48.8 47.3 48.6 51.3 48.1 46.5 50.4
CIRP Construct: Likelihood of College InvolvementHigh Construct Score Group 18.7 16.6 21.9 13.6 20.7 22.5 19.8 19.2 18.0 36.2 24.3 18.8 32.5Average Construct Score Group 37.8 36.1 40.5 35.6 36.7 35.9 37.3 37.4 40.6 40.1 32.5 32.4 32.8Low Construct Score Group 43.4 47.3 37.6 50.8 42.6 41.6 42.9 43.4 41.4 23.7 43.1 48.8 34.7Mean Score 44.0 43.4 45.0 42.7 44.2 44.5 44.1 44.0 44.3 47.6 44.5 43.3 46.2
Note: CIRP Constructs are scored on a normal curve, a “Low” score represents students who are one-half standard deviation or more below the mean, a “High” score represents students who are one-half standard deviation or more above themean, and an “Average” score represents students whose scores are within one-half standard deviation of the mean.
2009 CIRP Freshman SurveyWeighted National Norms—Men
Baccalaureate Black Colleges All Bacc Institutions 4-year Colleges Universities and Universities
Institutions 4-yr Coll Universities Public Private Nonsec Catholic Oth Relig Public Private All HBCU Public Private
65


2009 National Norms
FirstTime FullTime FreshmenWomen

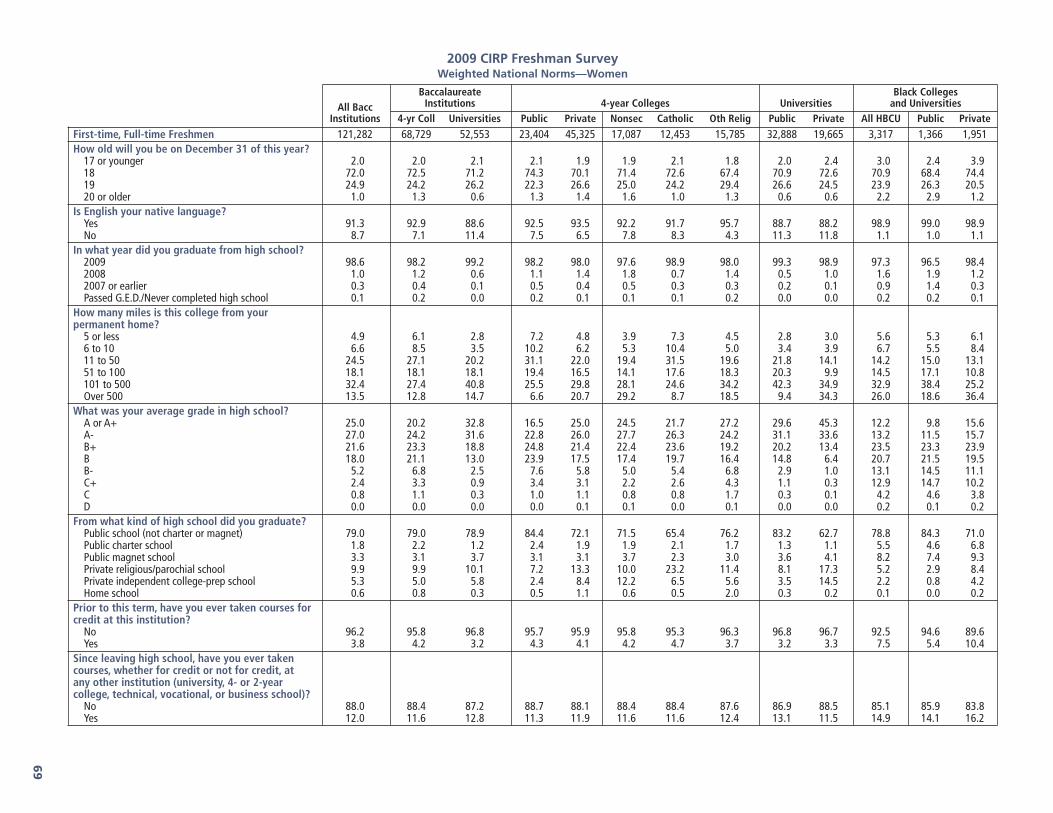
First-time, Full-time Freshmen 121,282 68,729 52,553 23,404 45,325 17,087 12,453 15,785 32,888 19,665 3,317 1,366 1,951How old will you be on December 31 of this year?
17 or younger 2.0 2.0 2.1 2.1 1.9 1.9 2.1 1.8 2.0 2.4 3.0 2.4 3.918 72.0 72.5 71.2 74.3 70.1 71.4 72.6 67.4 70.9 72.6 70.9 68.4 74.419 24.9 24.2 26.2 22.3 26.6 25.0 24.2 29.4 26.6 24.5 23.9 26.3 20.520 or older 1.0 1.3 0.6 1.3 1.4 1.6 1.0 1.3 0.6 0.6 2.2 2.9 1.2
Is English your native language?Yes 91.3 92.9 88.6 92.5 93.5 92.2 91.7 95.7 88.7 88.2 98.9 99.0 98.9No 8.7 7.1 11.4 7.5 6.5 7.8 8.3 4.3 11.3 11.8 1.1 1.0 1.1
In what year did you graduate from high school?2009 98.6 98.2 99.2 98.2 98.0 97.6 98.9 98.0 99.3 98.9 97.3 96.5 98.42008 1.0 1.2 0.6 1.1 1.4 1.8 0.7 1.4 0.5 1.0 1.6 1.9 1.22007 or earlier 0.3 0.4 0.1 0.5 0.4 0.5 0.3 0.3 0.2 0.1 0.9 1.4 0.3Passed G.E.D./Never completed high school 0.1 0.2 0.0 0.2 0.1 0.1 0.1 0.2 0.0 0.0 0.2 0.2 0.1
How many miles is this college from yourpermanent home?
5 or less 4.9 6.1 2.8 7.2 4.8 3.9 7.3 4.5 2.8 3.0 5.6 5.3 6.16 to 10 6.6 8.5 3.5 10.2 6.2 5.3 10.4 5.0 3.4 3.9 6.7 5.5 8.411 to 50 24.5 27.1 20.2 31.1 22.0 19.4 31.5 19.6 21.8 14.1 14.2 15.0 13.151 to 100 18.1 18.1 18.1 19.4 16.5 14.1 17.6 18.3 20.3 9.9 14.5 17.1 10.8101 to 500 32.4 27.4 40.8 25.5 29.8 28.1 24.6 34.2 42.3 34.9 32.9 38.4 25.2Over 500 13.5 12.8 14.7 6.6 20.7 29.2 8.7 18.5 9.4 34.3 26.0 18.6 36.4
What was your average grade in high school?A or A+ 25.0 20.2 32.8 16.5 25.0 24.5 21.7 27.2 29.6 45.3 12.2 9.8 15.6A- 27.0 24.2 31.6 22.8 26.0 27.7 26.3 24.2 31.1 33.6 13.2 11.5 15.7B+ 21.6 23.3 18.8 24.8 21.4 22.4 23.6 19.2 20.2 13.4 23.5 23.3 23.9B 18.0 21.1 13.0 23.9 17.5 17.4 19.7 16.4 14.8 6.4 20.7 21.5 19.5B- 5.2 6.8 2.5 7.6 5.8 5.0 5.4 6.8 2.9 1.0 13.1 14.5 11.1C+ 2.4 3.3 0.9 3.4 3.1 2.2 2.6 4.3 1.1 0.3 12.9 14.7 10.2C 0.8 1.1 0.3 1.0 1.1 0.8 0.8 1.7 0.3 0.1 4.2 4.6 3.8D 0.0 0.0 0.0 0.0 0.1 0.1 0.0 0.1 0.0 0.0 0.2 0.1 0.2
From what kind of high school did you graduate?Public school (not charter or magnet) 79.0 79.0 78.9 84.4 72.1 71.5 65.4 76.2 83.2 62.7 78.8 84.3 71.0Public charter school 1.8 2.2 1.2 2.4 1.9 1.9 2.1 1.7 1.3 1.1 5.5 4.6 6.8Public magnet school 3.3 3.1 3.7 3.1 3.1 3.7 2.3 3.0 3.6 4.1 8.2 7.4 9.3Private religious/parochial school 9.9 9.9 10.1 7.2 13.3 10.0 23.2 11.4 8.1 17.3 5.2 2.9 8.4Private independent college-prep school 5.3 5.0 5.8 2.4 8.4 12.2 6.5 5.6 3.5 14.5 2.2 0.8 4.2Home school 0.6 0.8 0.3 0.5 1.1 0.6 0.5 2.0 0.3 0.2 0.1 0.0 0.2
Prior to this term, have you ever taken courses forcredit at this institution?
No 96.2 95.8 96.8 95.7 95.9 95.8 95.3 96.3 96.8 96.7 92.5 94.6 89.6Yes 3.8 4.2 3.2 4.3 4.1 4.2 4.7 3.7 3.2 3.3 7.5 5.4 10.4
Since leaving high school, have you ever takencourses, whether for credit or not for credit, atany other institution (university, 4- or 2-yearcollege, technical, vocational, or business school)?
No 88.0 88.4 87.2 88.7 88.1 88.4 88.4 87.6 86.9 88.5 85.1 85.9 83.8Yes 12.0 11.6 12.8 11.3 11.9 11.6 11.6 12.4 13.1 11.5 14.9 14.1 16.2
69
2009 CIRP Freshman SurveyWeighted National Norms—Women
Baccalaureate Black CollegesAll Bacc Institutions 4-year Colleges Universities and Universities
Institutions 4-yr Coll Universities Public Private Nonsec Catholic Oth Relig Public Private All HBCU Public Private

Where do you plan to live during the fall term?With my family or other relatives 14.5 19.4 6.7 25.5 11.4 11.0 18.9 7.9 6.9 6.1 8.3 5.2 12.6Other private home, apartment, or room 2.7 2.5 3.2 3.3 1.4 2.3 1.0 0.6 3.9 0.4 2.6 2.7 2.3College residence hall 79.2 74.9 86.2 66.6 85.6 85.0 78.9 89.6 84.7 92.3 85.2 87.5 82.1Fraternity or sorority house 0.4 0.1 0.9 0.1 0.0 0.0 0.0 0.1 1.1 0.1 0.0 0.0 0.0Other campus student housing 2.9 3.0 2.8 4.2 1.5 1.5 1.0 1.7 3.2 1.2 3.4 4.0 2.7Other 0.2 0.2 0.3 0.3 0.1 0.1 0.1 0.2 0.3 0.0 0.5 0.7 0.3
To how many colleges other than this one did youapply for admission this year?
None 13.1 13.6 12.2 14.7 12.1 11.6 9.2 14.2 13.4 7.8 9.0 9.7 8.1One 10.5 11.2 9.3 12.2 9.8 8.7 7.8 12.1 10.3 5.7 7.9 8.4 7.1Two 13.2 14.2 11.5 15.6 12.4 10.9 10.6 14.7 12.6 7.1 12.0 12.1 11.9Three 15.7 17.1 13.3 18.4 15.5 13.9 15.1 17.2 14.3 9.3 18.2 18.5 17.8Four 13.4 14.3 11.8 14.5 14.1 13.7 14.9 13.9 12.2 10.3 17.5 18.3 16.5Five 9.9 9.7 10.2 9.3 10.2 10.6 11.7 9.1 10.1 10.4 11.9 12.2 11.6Six 7.5 6.7 8.7 5.9 7.8 8.2 10.0 6.2 8.3 10.4 7.9 7.5 8.6Seven to ten 13.5 10.6 18.2 7.9 14.0 17.0 16.3 9.8 15.6 28.2 11.1 9.9 12.6Eleven or more 3.5 2.6 4.9 1.5 4.2 5.5 4.4 2.7 3.3 10.9 4.4 3.4 5.9
Were you accepted by your first choice college?Yes 80.7 82.9 77.0 82.9 82.9 80.9 82.5 85.0 78.5 71.5 80.4 81.0 79.5No 19.3 17.1 23.0 17.1 17.1 19.1 17.5 15.0 21.5 28.5 19.6 19.0 20.5
Is this college your:First choice? 60.2 60.3 60.1 58.4 62.8 64.0 59.0 63.7 60.3 59.3 44.9 41.6 49.7Second choice? 26.4 27.3 25.1 29.0 25.0 24.8 28.7 23.3 25.3 24.5 31.9 34.3 28.4Third choice? 8.6 8.3 9.2 8.5 7.9 7.5 8.4 8.1 8.9 10.2 14.5 15.1 13.7Less than third choice? 4.7 4.2 5.6 4.1 4.2 3.7 3.8 4.9 5.5 6.0 8.7 9.1 8.2
Citizenship status:U.S. citizen 96.8 97.3 96.0 97.9 96.5 94.6 97.8 97.7 96.6 93.8 99.1 99.3 98.8Permanent resident (green card) 1.9 1.5 2.5 1.6 1.3 1.8 1.5 0.7 2.5 2.8 0.4 0.3 0.6Neither 1.3 1.2 1.5 0.5 2.2 3.7 0.6 1.5 0.9 3.4 0.5 0.3 0.6
Are you a veteran?No 99.8 99.7 99.9 99.7 99.7 99.8 99.7 99.7 99.9 99.9 99.2 99.3 99.1Yes 0.2 0.3 0.1 0.3 0.3 0.2 0.3 0.3 0.1 0.1 0.8 0.7 0.9
Are your parents:Both alive and living with each other? 68.1 65.1 72.9 63.2 67.6 68.0 68.1 67.1 71.8 77.2 29.6 27.4 32.8Both alive, divorced or living apart? 27.9 30.6 23.7 32.4 28.2 28.3 27.6 28.3 24.7 19.7 62.0 63.8 59.4One or both deceased? 3.9 4.3 3.4 4.3 4.2 3.7 4.3 4.6 3.5 3.1 8.4 8.8 7.8
Have you had any special tutoring or remedialwork in any of the following subjects?
English 6.5 7.0 5.6 6.7 7.4 7.5 7.6 7.1 5.7 5.4 12.5 12.9 12.1Reading 6.0 6.6 5.0 6.4 6.8 6.7 7.1 6.7 5.3 4.3 12.4 13.1 11.3Mathematics 16.3 17.8 14.0 16.8 18.9 20.6 19.3 17.0 13.8 14.5 16.2 15.4 17.4Social Studies 4.1 4.5 3.5 4.4 4.6 4.3 4.7 4.9 3.6 3.0 10.8 11.8 9.4Science 6.2 6.6 5.6 6.0 7.5 8.0 7.2 7.1 5.5 6.1 10.0 10.7 9.1Foreign Language 5.6 6.1 4.8 5.8 6.6 6.6 6.7 6.6 4.8 4.7 9.5 9.6 9.2Writing 5.1 5.5 4.5 5.2 5.8 6.1 5.8 5.6 4.5 4.5 9.9 10.4 9.1
2009 CIRP Freshman SurveyWeighted National Norms—Women
Baccalaureate Black Colleges All Bacc Institutions 4-year Colleges Universities and Universities
Institutions 4-yr Coll Universities Public Private Nonsec Catholic Oth Relig Public Private All HBCU Public Private
70

Do you feel you will need any special tutoring orremedial work in any of the following subjects?
English 8.5 9.2 7.3 9.7 8.5 8.8 7.6 8.7 7.8 5.3 16.3 18.9 12.6Reading 4.4 4.6 4.0 4.9 4.2 4.3 4.1 4.2 4.2 3.2 9.4 11.9 5.9Mathematics 29.2 31.3 25.7 33.8 28.0 25.8 29.2 29.6 27.7 18.2 47.8 48.9 46.1Social Studies 4.5 5.0 3.7 5.5 4.4 4.0 3.9 5.1 3.9 2.6 11.3 13.2 8.6Science 15.1 15.3 14.9 15.5 15.0 12.9 16.9 16.1 15.7 11.8 24.3 25.6 22.6Foreign Language 11.4 12.4 9.8 12.1 12.8 10.8 12.9 14.9 10.0 9.2 23.7 22.7 24.9Writing 12.1 13.2 10.4 13.1 13.2 13.9 12.0 13.2 10.7 9.1 21.0 23.6 17.3
How many Advanced Placement courses did youtake in high school?
Not offered at my high school 5.3 5.8 4.6 4.7 7.2 7.3 5.3 8.2 4.4 5.3 8.2 7.9 8.7None 25.4 31.7 15.4 34.2 28.5 25.0 33.5 29.4 17.6 7.3 41.6 44.4 37.81 to 4 51.0 51.4 50.5 52.2 50.4 50.5 51.6 49.6 52.1 44.6 43.9 42.3 46.35 to 9 16.4 10.2 26.3 8.3 12.6 15.7 9.1 11.4 23.4 37.0 4.6 3.5 6.210 to 14 1.6 0.8 3.0 0.6 1.0 1.3 0.4 1.1 2.4 5.2 1.0 1.2 0.715+ 0.2 0.2 0.3 0.2 0.2 0.2 0.1 0.3 0.2 0.5 0.6 0.7 0.4
How many Advanced Placement exams did youtake in high school?
Not offered at my high school 5.7 6.3 4.7 5.3 7.6 7.3 5.5 9.0 4.7 4.8 9.2 9.0 9.4None 32.9 40.1 21.5 43.2 36.1 31.7 41.7 37.6 24.3 11.4 51.5 55.3 46.31 to 4 46.6 45.3 48.7 45.2 45.4 46.7 45.7 43.9 49.1 47.1 35.3 32.5 39.25 to 9 13.6 7.8 22.7 5.9 10.1 13.2 6.7 8.7 20.1 32.5 3.3 2.6 4.310 to 14 1.1 0.4 2.2 0.2 0.6 0.9 0.3 0.6 1.7 4.1 0.4 0.2 0.515+ 0.1 0.1 0.1 0.1 0.1 0.2 0.1 0.1 0.1 0.2 0.3 0.5 0.1
What is the highest academic degree that youintend to obtain?—Highest Planned
None 0.8 0.9 0.5 1.0 0.9 0.9 1.0 1.0 0.5 0.2 1.7 1.6 1.9Vocational certificate 0.1 0.1 0.1 0.1 0.2 0.2 0.1 0.3 0.1 0.1 0.2 0.2 0.2Associate (A.A. or equivalent) 0.5 0.6 0.3 0.6 0.7 0.6 0.6 0.8 0.3 0.2 0.6 0.7 0.5Bachelor’s degree (B.A., B.S., etc.) 20.5 22.8 16.9 24.1 21.1 21.2 18.2 22.6 18.5 11.2 9.9 12.8 5.9Master’s degree (M.A., M.S., etc.) 42.7 44.2 40.3 46.1 41.9 41.4 44.2 41.1 41.2 37.0 32.1 37.7 24.1Ph.D. or Ed.D. 18.9 17.9 20.5 16.9 19.2 19.9 18.6 18.9 20.2 21.5 30.4 27.3 34.8M.D., D.O., D.D.S., or D.V.M. 10.9 8.2 15.1 6.9 9.9 9.5 11.3 9.7 14.0 19.1 14.2 9.2 21.2J.D. (Law) 4.1 3.5 5.1 2.9 4.3 4.7 4.4 3.9 4.0 9.3 7.2 6.1 8.8B.D. or M.DIV. (Divinity) 0.2 0.2 0.2 0.2 0.2 0.1 0.2 0.4 0.2 0.1 0.5 0.4 0.6Other 1.2 1.4 1.0 1.3 1.5 1.5 1.3 1.4 1.0 1.2 3.2 4.1 2.0
2009 CIRP Freshman SurveyWeighted National Norms—Women
Baccalaureate Black Colleges All Bacc Institutions 4-year Colleges Universities and Universities
Institutions 4-yr Coll Universities Public Private Nonsec Catholic Oth Relig Public Private All HBCU Public Private
71

What is the highest academic degree that youintend to obtain?—Highest Planned at ThisCollege
None 1.0 1.3 0.6 1.6 1.0 0.8 0.8 1.2 0.7 0.3 2.1 2.5 1.6Vocational certificate 0.2 0.2 0.1 0.2 0.2 0.1 0.2 0.3 0.0 0.1 0.3 0.3 0.3Associate (A.A. or equivalent) 2.1 2.7 1.1 3.1 2.3 1.9 2.3 2.6 1.2 0.8 2.7 2.9 2.4Bachelor’s degree (B.A., B.S., etc.) 69.7 71.3 67.1 67.7 75.7 77.8 67.3 77.9 66.0 70.6 65.7 61.4 71.2Master’s degree (M.A., M.S., etc.) 20.1 19.6 20.8 22.9 15.8 15.1 22.4 13.2 21.8 17.5 18.0 23.5 10.9Ph.D. or Ed.D. 3.4 2.5 4.8 2.4 2.6 2.4 4.0 2.2 5.1 4.0 5.7 4.9 6.7M.D., D.O., D.D.S., or D.V.M. 1.9 0.8 3.6 0.8 0.8 0.5 1.4 0.7 3.5 4.0 2.1 1.2 3.2J.D. (Law) 0.6 0.3 0.9 0.3 0.4 0.3 0.4 0.5 0.7 1.6 1.0 1.0 1.1B.D. or M.DIV. (Divinity) 0.1 0.1 0.1 0.2 0.1 0.0 0.0 0.2 0.1 0.1 0.3 0.4 0.3Other 1.0 1.0 0.9 0.9 1.2 1.1 1.1 1.3 0.8 0.9 2.1 1.9 2.3
How would you describe the racial composition ofthe high school you last attended?
Completely non-White 3.6 3.8 3.3 4.2 3.3 3.0 4.0 3.3 3.5 2.9 17.6 17.4 17.9Mostly non-White 13.2 13.0 13.4 14.4 11.3 10.6 11.9 11.6 14.2 10.7 34.6 36.3 32.2Roughly half non-White 25.8 26.9 23.9 28.3 25.0 24.7 21.3 27.3 24.1 23.3 26.5 27.1 25.6Mostly White 50.6 49.8 51.9 47.3 53.1 54.2 54.8 51.0 50.8 55.8 19.7 17.6 22.5Completely White 6.8 6.5 7.4 5.8 7.3 7.5 8.0 6.8 7.4 7.4 1.6 1.5 1.7
How would you describe the racial composition ofthe neighborhood where you grew up?
Completely non-White 6.1 6.6 5.1 7.0 6.1 5.4 7.1 6.4 5.2 4.6 29.5 29.7 29.1Mostly non-White 11.5 11.6 11.3 12.5 10.4 9.9 11.3 10.4 11.6 9.9 32.0 31.7 32.4Roughly half non-White 14.2 14.6 13.5 15.5 13.6 13.7 12.9 13.8 13.4 13.5 20.0 20.8 18.8Mostly White 49.6 48.7 51.1 48.1 49.4 50.6 47.8 49.1 50.1 54.7 15.8 15.2 16.7Completely White 18.7 18.4 19.1 16.9 20.5 20.4 20.9 20.3 19.7 17.2 2.8 2.7 2.9
HOW MUCH OF YOUR FIRST YEAR’S EDUCATIONALEXPENSES (ROOM, BOARD, TUITION, AND FEES) DO YOU EXPECT TO COVER FROM:Family resources (parents, relatives, spouse, etc.)
None 20.6 23.1 16.5 26.5 18.7 17.6 18.9 19.8 17.9 11.4 37.8 43.0 30.3Less than $1,000 12.3 13.8 9.7 15.2 12.0 9.7 12.4 14.2 10.7 6.2 22.4 24.0 20.2$1,000–$2,999 13.5 14.6 11.7 15.8 13.0 11.4 13.8 14.3 12.6 8.1 16.5 16.3 16.8$3,000–$5,999 12.4 12.7 12.0 13.4 11.8 10.4 13.0 12.6 13.1 8.0 10.5 9.5 11.9$6,000–$9,999 10.8 10.7 11.0 10.7 10.8 10.4 10.9 11.2 11.7 8.3 4.5 2.7 6.9$10,000 + 30.4 25.0 39.1 18.4 33.6 40.5 30.9 28.0 34.1 58.0 8.3 4.4 13.8
My own resources (savings from work, work-study, other income)
None 35.1 36.6 32.8 38.9 33.6 34.8 31.5 33.5 31.7 36.9 52.4 54.9 48.8Less than $1,000 28.3 29.0 27.1 30.6 27.1 26.0 27.7 27.8 28.0 24.0 29.3 29.3 29.3$1,000–$2,999 23.5 22.1 25.7 20.1 24.7 25.0 25.5 24.0 26.0 24.7 13.3 11.0 16.7$3,000–$5,999 8.4 7.9 9.3 7.2 8.8 8.5 9.2 9.0 9.4 8.9 3.5 3.4 3.5$6,000–$9,999 2.5 2.3 2.8 1.8 2.9 2.6 3.2 3.0 2.8 2.7 0.8 0.7 1.1$10,000 + 2.2 2.1 2.3 1.5 2.9 3.1 2.9 2.7 2.1 2.8 0.7 0.7 0.6
2009 CIRP Freshman SurveyWeighted National Norms—Women
Baccalaureate Black Colleges All Bacc Institutions 4-year Colleges Universities and Universities
Institutions 4-yr Coll Universities Public Private Nonsec Catholic Oth Relig Public Private All HBCU Public Private
72

HOW MUCH OF YOUR FIRST YEAR’S EDUCATIONALEXPENSES (ROOM, BOARD, TUITION, AND FEES) DO YOU EXPECT TO COVER FROM:Aid which need not be repaid (grants,scholarships, military funding, etc.)
None 27.6 26.8 28.9 33.1 18.6 23.4 17.3 14.4 29.5 26.8 21.3 22.1 20.1Less than $1,000 7.0 6.5 7.9 8.8 3.5 3.9 3.4 3.2 9.0 3.4 5.9 5.7 6.2$1,000–$2,999 13.7 13.2 14.5 16.8 8.5 8.1 8.4 8.8 16.4 6.9 16.0 17.2 14.2$3,000–$5,999 14.1 15.0 12.7 17.7 11.4 10.2 11.4 12.7 14.2 7.2 20.8 22.8 18.0$6,000–$9,999 11.7 12.2 10.9 10.8 13.9 13.2 13.5 15.0 11.8 7.7 14.4 13.9 15.1$10,000 + 25.9 26.4 25.1 12.8 44.1 41.3 46.0 45.9 19.0 48.0 21.6 18.3 26.4
Aid which must be repaid (loans, etc.)None 44.2 43.1 46.0 48.8 35.7 39.9 32.0 33.5 45.2 49.1 35.2 38.3 30.7Less than $1,000 3.9 4.2 3.5 4.8 3.4 2.7 3.5 4.0 3.8 2.3 7.2 7.1 7.5$1,000–$2,999 10.2 11.0 9.0 11.9 9.8 8.5 10.1 11.0 9.5 7.1 15.1 17.2 12.1$3,000–$5,999 18.2 18.5 17.8 17.6 19.6 16.5 21.9 21.6 18.3 16.1 18.0 18.7 17.0$6,000–$9,999 10.8 10.8 10.8 8.7 13.6 12.0 14.7 14.6 11.3 9.1 10.9 9.8 12.4$10,000 + 12.6 12.4 12.9 8.2 17.9 20.4 17.8 15.3 12.0 16.4 13.6 8.9 20.4
Other than aboveNone 93.7 93.5 94.0 93.9 92.9 93.5 92.0 92.6 94.2 93.3 91.7 92.1 91.2Less than $1,000 2.3 2.4 2.1 2.5 2.3 2.0 2.6 2.6 2.1 2.1 3.2 3.2 3.2$1,000–$2,999 1.4 1.4 1.3 1.4 1.5 1.3 1.7 1.7 1.3 1.4 1.9 1.4 2.5$3,000–$5,999 1.0 1.0 1.0 1.0 1.0 1.0 1.1 0.9 1.0 0.9 1.5 1.6 1.3$6,000–$9,999 0.7 0.7 0.6 0.5 0.8 0.8 0.9 0.8 0.6 0.6 0.6 0.7 0.5$10,000 + 1.0 1.0 1.0 0.6 1.5 1.5 1.7 1.3 0.8 1.7 1.1 0.9 1.4
What is your best estimate of your parents’ totalincome last year?
Less than $10,000 4.6 5.4 3.3 5.8 4.9 4.0 5.0 5.8 3.5 2.3 18.4 20.6 15.2$10,000 to $14,999 3.5 4.0 2.7 4.4 3.5 3.4 3.0 3.9 2.9 2.1 8.9 10.1 7.1$15,000 to $19,999 3.1 3.5 2.6 3.7 3.1 3.1 3.4 3.0 2.8 1.7 6.0 6.4 5.5$20,000 to $24,999 4.2 4.7 3.6 5.0 4.3 3.8 4.4 4.7 4.0 2.2 8.7 9.6 7.4$25,000 to $29,999 3.9 4.5 3.1 4.7 4.1 3.8 4.3 4.3 3.3 2.1 7.0 7.4 6.4$30,000 to $39,999 6.8 7.3 6.0 7.3 7.3 6.8 7.2 7.7 6.4 4.5 10.5 10.5 10.4$40,000 to $49,999 8.0 8.4 7.2 8.5 8.3 7.5 8.9 8.8 7.7 5.3 9.6 9.7 9.6$50,000 to $59,999 8.6 9.3 7.5 9.1 9.4 8.6 9.3 10.3 7.9 6.0 7.6 6.6 9.0$60,000 to $74,999 11.2 11.8 10.3 11.6 11.9 10.9 11.9 12.9 10.9 8.2 7.3 6.2 8.9$75,000 to $99,999 13.1 13.2 13.1 13.6 12.6 12.5 12.6 12.7 13.5 11.7 7.0 6.2 8.2$100,000 to $149,999 15.5 13.9 18.0 14.3 13.4 14.4 13.8 12.3 17.9 18.4 4.8 3.8 6.3$150,000 to $199,999 7.1 6.2 8.5 5.9 6.5 7.3 6.9 5.5 8.1 10.2 2.5 2.0 3.3$200,000 to $249,999 3.9 3.1 5.1 2.6 3.8 4.6 3.6 3.1 4.4 7.5 0.6 0.4 1.0$250,000 or more 6.4 4.8 9.0 3.3 6.7 9.3 5.5 4.8 6.7 17.9 1.1 0.5 1.8
Do you have any concern about your ability tofinance your college education?
None (I am confident that I will have sufficient funds) 27.5 27.5 27.6 28.1 26.8 28.3 25.1 26.0 26.6 31.6 24.6 25.7 23.1Some (but I probably will have enough funds) 59.0 58.6 59.7 58.3 59.0 57.7 60.2 59.7 60.6 56.2 52.3 51.4 53.6Major (not sure I will have enough funds to complete
college) 13.5 13.9 12.7 13.7 14.2 14.0 14.7 14.2 12.9 12.2 23.0 22.8 23.3
2009 CIRP Freshman SurveyWeighted National Norms—Women
Baccalaureate Black Colleges All Bacc Institutions 4-year Colleges Universities and Universities
Institutions 4-yr Coll Universities Public Private Nonsec Catholic Oth Relig Public Private All HBCU Public Private
73

Your current religious preference:Baptist 11.2 13.9 6.8 14.9 12.6 7.8 7.1 20.2 6.7 6.8 53.5 55.7 50.5Buddhist 1.1 0.7 1.8 0.6 0.8 1.2 0.6 0.4 2.0 1.2 0.3 0.1 0.6Church of Christ 4.4 5.1 3.4 5.6 4.4 3.6 3.4 5.7 3.9 1.8 10.9 12.8 8.2Eastern Orthodox 0.6 0.5 0.8 0.5 0.5 0.7 0.7 0.3 0.7 1.1 0.1 0.1 0.1Episcopalian 1.4 1.3 1.5 1.2 1.5 2.0 1.0 1.4 1.4 2.1 0.8 0.7 1.0Hindu 0.7 0.3 1.2 0.2 0.4 0.6 0.2 0.3 1.1 1.8 0.0 0.0 0.1Jewish 2.4 1.7 3.6 1.5 2.0 4.0 0.3 0.9 3.0 5.8 0.0 0.0 0.0LDS (Mormon) 0.3 0.3 0.3 0.3 0.2 0.3 0.0 0.2 0.3 0.1 0.1 0.1 0.0Lutheran 3.8 3.3 4.7 2.8 4.0 2.3 2.7 6.4 5.3 2.3 0.2 0.1 0.2Methodist 4.7 4.8 4.7 4.6 5.0 3.9 2.6 7.4 5.0 3.4 4.5 4.4 4.7Muslim 0.9 0.8 1.2 0.8 0.8 0.8 1.3 0.4 1.0 1.7 0.6 0.4 0.8Presbyterian 3.0 2.8 3.2 2.3 3.4 3.0 1.5 4.7 3.2 3.6 0.4 0.3 0.5Quaker 0.2 0.2 0.2 0.1 0.3 0.3 0.1 0.3 0.1 0.2 0.0 0.0 0.0Roman Catholic 27.3 26.1 29.2 26.7 25.4 22.2 55.5 12.6 27.8 34.4 3.9 1.6 7.2Seventh Day Adventist 0.3 0.3 0.3 0.3 0.4 0.4 0.4 0.4 0.3 0.2 0.6 0.4 1.0United Church of Christ/Congregational 0.9 0.9 0.9 0.8 1.0 1.2 0.8 1.0 1.0 0.7 0.7 0.7 0.7Other Christian 13.7 15.0 11.5 14.8 15.3 11.9 8.1 22.5 12.1 9.4 15.0 14.7 15.5Other Religion 2.9 3.1 2.5 3.0 3.1 4.1 2.2 2.6 2.6 2.3 2.5 2.2 2.9None 20.3 19.0 22.4 19.0 19.0 29.7 11.5 12.2 22.7 21.2 5.9 5.8 5.9
Father’s current religious preference:Baptist 10.9 13.4 6.8 14.4 12.2 7.9 7.1 19.3 6.9 6.6 51.3 51.9 50.5Buddhist 1.7 0.9 3.0 0.8 0.9 1.5 0.6 0.5 3.2 2.1 0.4 0.5 0.3Church of Christ 4.3 4.8 3.4 5.3 4.3 4.2 3.1 4.9 3.8 1.9 8.7 9.8 7.2Eastern Orthodox 0.8 0.7 0.9 0.7 0.7 0.8 0.9 0.5 0.8 1.3 0.1 0.0 0.1Episcopalian 1.6 1.5 1.7 1.2 1.9 2.4 1.1 1.7 1.4 2.6 0.5 0.3 0.7Hindu 0.8 0.4 1.5 0.3 0.5 0.9 0.3 0.3 1.3 2.1 0.1 0.0 0.2Jewish 3.1 2.4 4.3 2.1 2.7 5.2 0.8 1.2 3.6 6.8 0.2 0.2 0.1LDS (Mormon) 0.3 0.2 0.3 0.3 0.1 0.2 0.1 0.1 0.4 0.2 0.0 0.0 0.0Lutheran 4.5 3.9 5.4 3.3 4.7 3.1 3.2 7.3 6.1 2.9 0.3 0.4 0.2Methodist 5.0 4.9 5.1 4.9 5.1 4.4 2.8 7.0 5.4 3.8 3.6 3.1 4.4Muslim 1.3 1.2 1.5 1.2 1.3 1.4 1.9 0.8 1.4 2.0 2.5 2.3 2.8Presbyterian 3.4 3.2 3.6 2.7 3.9 3.6 2.0 5.1 3.5 3.9 0.6 0.6 0.5Quaker 0.2 0.2 0.2 0.1 0.3 0.3 0.2 0.3 0.2 0.2 0.0 0.0 0.0Roman Catholic 30.5 29.6 32.1 30.4 28.5 26.9 54.9 15.7 30.9 36.4 4.1 2.4 6.5Seventh Day Adventist 0.3 0.4 0.3 0.4 0.4 0.4 0.4 0.3 0.3 0.3 0.9 0.8 0.9United Church of Christ/Congregational 0.9 0.9 0.9 0.8 1.0 1.2 0.7 1.0 0.9 0.7 0.7 0.8 0.6Other Christian 12.2 13.4 10.4 13.4 13.5 11.3 7.7 18.8 10.9 8.5 12.8 12.5 13.2Other Religion 2.2 2.3 2.0 2.3 2.2 2.8 1.9 1.9 2.0 1.7 2.7 2.6 2.7None 16.1 15.6 16.8 15.4 15.9 21.5 10.5 13.2 16.9 16.0 10.6 11.6 9.1
2009 CIRP Freshman SurveyWeighted National Norms—Women
Baccalaureate Black Colleges All Bacc Institutions 4-year Colleges Universities and Universities
Institutions 4-yr Coll Universities Public Private Nonsec Catholic Oth Relig Public Private All HBCU Public Private
74

Mother’s current religious preference:Baptist 11.6 14.3 7.4 15.2 13.1 8.7 7.6 20.6 7.4 7.3 53.7 54.6 52.5Buddhist 1.8 0.9 3.2 0.8 1.0 1.7 0.6 0.5 3.5 2.1 0.2 0.2 0.2Church of Christ 4.8 5.4 3.8 6.0 4.8 4.5 3.7 5.6 4.2 2.2 10.3 12.1 7.9Eastern Orthodox 0.7 0.6 0.9 0.6 0.6 0.8 0.7 0.4 0.8 1.3 0.1 0.1 0.1Episcopalian 1.9 1.8 2.0 1.6 2.1 3.0 1.1 1.9 1.8 2.8 0.8 0.6 1.0Hindu 0.8 0.4 1.4 0.3 0.5 0.8 0.2 0.3 1.3 2.0 0.0 0.0 0.1Jewish 2.9 2.2 4.0 2.0 2.4 4.9 0.5 1.0 3.3 6.2 0.2 0.2 0.2LDS (Mormon) 0.3 0.3 0.4 0.4 0.2 0.3 0.1 0.2 0.4 0.2 0.1 0.2 0.0Lutheran 4.7 4.2 5.4 3.7 5.0 3.3 3.2 7.7 6.1 3.0 0.3 0.3 0.2Methodist 5.7 5.7 5.8 5.5 5.8 5.1 3.1 8.0 6.2 4.2 5.0 5.0 4.9Muslim 1.1 0.9 1.3 0.9 0.9 1.1 1.3 0.5 1.2 1.9 0.8 0.6 1.0Presbyterian 3.7 3.5 3.9 2.9 4.3 4.2 2.1 5.6 3.8 4.2 0.5 0.6 0.5Quaker 0.2 0.2 0.2 0.1 0.3 0.3 0.2 0.3 0.2 0.2 0.0 0.0 0.1Roman Catholic 32.2 30.9 34.2 31.7 29.9 28.1 58.5 16.1 32.8 39.3 5.0 2.2 8.8Seventh Day Adventist 0.4 0.4 0.3 0.4 0.5 0.4 0.5 0.5 0.3 0.3 0.7 0.6 0.8United Church of Christ/Congregational 1.1 1.1 1.1 0.9 1.2 1.5 0.8 1.1 1.1 0.8 0.7 0.7 0.7Other Christian 13.5 14.8 11.3 14.8 14.8 12.8 8.1 20.5 11.9 9.4 14.7 14.5 15.0Other Religion 2.3 2.4 2.2 2.2 2.5 3.2 1.9 2.2 2.3 1.9 2.7 2.6 2.8None 10.5 10.0 11.3 9.9 10.0 15.2 5.7 7.1 11.4 10.7 4.3 4.9 3.5
For the activities below, indicate which ones you“frequently” or “occasionally” did during the past year:
Attended a religious service 76.6 77.2 75.7 75.7 79.0 68.3 84.6 86.8 74.9 79.0 90.4 88.4 93.1Was bored in class* 37.6 36.9 38.9 38.4 34.8 36.5 31.7 34.8 39.6 36.2 32.7 36.5 27.2Participated in political demonstrations 26.3 25.7 27.3 24.3 27.5 28.3 26.5 27.3 26.8 29.0 38.4 35.9 41.8Tutored another student 56.1 52.5 62.2 51.0 54.3 53.2 54.9 55.2 59.8 71.1 59.8 56.1 65.1Studied with other students 90.0 88.8 92.0 88.5 89.2 88.4 90.6 89.3 91.7 92.9 87.3 85.6 89.6Was a guest in a teacher’s home 20.7 21.1 20.0 19.0 23.6 23.5 17.3 27.2 19.0 23.8 21.4 21.5 21.2Smoked cigarettes* 3.9 4.4 3.1 4.6 4.3 5.2 3.8 3.6 3.3 2.2 1.0 1.1 0.9Drank beer 34.4 33.1 36.6 33.2 33.0 40.4 36.7 23.5 36.1 38.3 6.5 6.7 6.2Drank wine or liquor 43.8 43.2 44.9 43.0 43.4 51.1 45.7 34.4 44.3 47.2 32.9 34.1 31.3Felt overwhelmed by all I had to do* 36.4 36.7 35.9 35.5 38.2 38.6 37.2 38.3 35.6 37.1 30.3 30.8 29.6Felt depressed* 7.3 7.9 6.3 7.7 8.3 8.5 6.8 8.8 6.3 6.2 10.7 12.3 8.6Performed volunteer work 88.6 86.8 91.6 85.2 88.9 88.0 89.9 89.3 90.7 95.3 85.1 82.4 88.9Played a musical instrument 41.0 39.3 43.9 36.7 42.7 42.2 35.4 47.2 42.6 48.6 34.9 34.9 34.7Asked a teacher for advice after class* 29.8 29.5 30.4 28.2 31.1 31.8 30.3 30.9 29.6 33.5 34.9 32.9 37.6Voted in a student election* 23.1 22.6 24.0 21.4 24.2 22.9 24.7 25.2 23.0 27.7 32.3 29.2 36.5Socialized with someone of another racial/ethnic
group* 69.4 69.0 70.1 68.9 69.1 70.7 65.6 69.3 68.8 74.8 71.5 68.2 76.1Came late to class 55.9 55.8 55.9 57.5 53.7 55.8 50.3 53.4 55.9 56.2 63.6 64.1 63.0Used the Internet:
For research or homework* 81.9 80.0 85.1 78.4 82.0 82.8 84.0 80.2 84.0 89.3 80.1 77.5 83.7To read news sites* 41.1 39.1 44.4 38.0 40.5 42.4 43.4 37.0 42.8 50.4 45.6 42.8 49.6To read blogs* 27.0 26.9 27.2 26.7 27.1 27.3 28.0 26.4 27.2 27.4 32.3 31.5 33.5To blog* 16.0 16.5 15.3 16.7 16.2 15.4 16.6 16.9 15.9 13.3 19.7 19.4 20.0
*responses for “frequently” only
2009 CIRP Freshman SurveyWeighted National Norms—Women
Baccalaureate Black Colleges All Bacc Institutions 4-year Colleges Universities and Universities
Institutions 4-yr Coll Universities Public Private Nonsec Catholic Oth Relig Public Private All HBCU Public Private
75

For the activities below, indicate which ones you“frequently” or “occasionally” did during the past year:
Performed community service as part of a class 62.2 61.8 63.0 60.8 62.9 60.3 68.1 62.8 62.6 64.5 63.1 60.0 67.4Discussed religion* 31.2 31.1 31.3 28.2 34.8 29.9 32.6 41.1 29.5 38.2 33.9 31.4 37.5Discussed politics* 30.9 28.5 34.7 25.9 31.9 33.5 30.1 31.2 32.8 41.8 26.2 20.9 33.7Skipped school/class* 2.3 2.5 2.1 2.6 2.3 2.6 1.8 2.2 2.1 2.2 2.8 3.3 1.9
*responses for “frequently” onlyStudent rated self as “Highest 10%” or “AboveAverage” as compared with the average persontheir age:
Academic ability 66.2 60.2 76.2 56.9 64.4 66.0 62.1 63.9 73.3 86.7 56.8 52.6 62.6Artistic ability 30.3 29.5 31.4 27.3 32.4 40.5 23.3 29.0 30.9 33.4 24.6 23.8 25.7Computer skills 31.4 31.1 31.9 31.5 30.5 31.3 31.4 29.3 31.7 32.3 43.7 44.3 42.7Cooperativeness 75.1 73.9 76.9 73.2 74.8 73.7 76.4 75.1 76.6 78.3 73.3 72.0 75.2Creativity 55.2 54.8 55.7 53.1 57.1 61.9 50.7 55.7 55.0 58.3 57.6 56.7 58.8Drive to achieve 77.6 75.0 81.7 73.2 77.4 77.6 78.5 76.4 80.3 86.8 83.7 82.0 86.0Emotional health 49.3 47.0 53.2 46.8 47.2 45.2 48.9 48.2 52.4 56.2 50.7 48.5 53.8Leadership ability 58.4 56.2 62.1 55.5 57.1 54.8 58.2 58.8 60.7 67.2 69.7 68.6 71.3Mathematical ability 35.7 31.0 43.6 29.6 32.7 33.4 31.9 32.4 41.3 52.2 33.0 31.7 34.9Physical health 45.9 43.8 49.3 42.9 45.1 43.8 48.6 44.5 48.5 52.2 41.6 40.1 43.7Popularity 31.8 30.3 34.4 30.5 30.1 29.1 31.6 30.2 33.5 37.6 44.6 44.8 44.2Public speaking ability 33.5 31.3 37.1 30.1 32.8 32.5 31.4 33.8 35.2 44.4 39.0 37.0 41.7Self-confidence (intellectual) 52.4 49.9 56.4 48.6 51.7 50.4 50.2 53.7 54.4 63.8 73.3 73.5 73.1Self-confidence (social) 47.6 46.4 49.4 47.2 45.3 43.2 46.5 46.9 49.0 51.2 70.1 70.7 69.3Self-understanding 54.2 52.8 56.5 51.8 54.2 54.6 51.7 55.0 55.3 60.9 70.7 70.9 70.4Spirituality 39.0 39.9 37.5 38.9 41.2 34.5 38.5 49.4 36.4 41.2 60.1 60.9 58.9Understanding of others 69.1 68.1 70.7 67.6 68.8 68.4 68.6 69.3 69.9 73.5 67.9 66.2 70.3Writing ability 47.9 45.7 51.5 43.8 48.1 49.5 44.8 48.5 49.3 59.9 46.3 43.6 50.1Ability to see the world from someone else’s
perspective 66.1 63.7 69.9 62.8 64.9 67.6 62.6 63.5 68.6 75.0 60.1 57.4 63.9Tolerance of others with different beliefs 73.9 71.2 78.4 70.0 72.6 76.6 71.8 69.0 77.2 82.7 64.0 59.6 70.2Openness to having my own views challenged 57.0 55.5 59.5 54.8 56.3 59.5 55.3 53.6 58.5 63.2 62.6 62.1 63.4Ability to discuss and negotiate controversial issues 58.3 56.2 61.7 55.4 57.3 60.9 55.3 54.6 60.0 67.9 62.7 61.1 64.9Ability to work cooperatively with diverse people 78.9 77.0 81.9 76.4 77.8 79.2 77.4 76.7 81.1 84.8 78.3 75.1 82.8
What is the highest level of formal educationobtained by your father?
Grammar school or less 4.5 4.9 4.0 5.9 3.6 3.1 5.0 3.4 4.5 2.3 6.7 6.8 6.7Some high school 5.8 6.6 4.6 7.4 5.5 4.9 6.2 5.9 5.0 3.1 12.8 13.8 11.3High school graduate 20.6 23.7 15.7 25.2 21.7 19.2 23.4 23.3 17.3 9.8 35.1 37.6 31.5Postsecondary school other than college 3.5 3.9 2.9 4.0 3.8 3.2 4.2 4.2 3.1 2.2 3.9 4.2 3.4Some college 14.9 15.7 13.6 16.5 14.6 14.0 14.9 15.2 14.4 10.9 18.0 17.9 18.1College degree 27.0 25.4 29.5 24.7 26.4 27.0 26.1 26.0 29.7 28.8 14.3 12.9 16.3Some graduate school 2.0 1.8 2.4 1.4 2.3 2.4 2.1 2.2 2.3 3.0 1.0 0.7 1.5Graduate degree 21.6 18.0 27.3 14.9 22.1 26.3 18.1 19.9 23.8 40.0 8.3 6.2 11.2
2009 CIRP Freshman SurveyWeighted National Norms—Women
Baccalaureate Black Colleges All Bacc Institutions 4-year Colleges Universities and Universities
Institutions 4-yr Coll Universities Public Private Nonsec Catholic Oth Relig Public Private All HBCU Public Private
76

What is the highest level of formal educationobtained by your mother?
Grammar school or less 4.1 4.3 3.8 5.3 3.1 2.5 4.6 2.9 4.2 1.9 5.9 5.9 5.9Some high school 4.2 4.6 3.6 5.6 3.4 3.1 4.1 3.4 4.0 2.1 7.5 8.8 5.8High school graduate 17.9 20.1 14.2 21.4 18.4 16.4 20.9 19.1 15.6 9.2 24.5 27.6 20.1Postsecondary school other than college 3.7 4.0 3.1 4.0 4.1 3.8 4.7 4.0 3.3 2.5 4.3 4.1 4.5Some college 17.6 18.7 15.7 20.0 17.1 15.4 16.6 19.1 16.5 12.4 23.6 24.1 22.8College degree 32.0 29.8 35.6 28.0 32.2 33.0 30.7 32.2 35.0 37.6 20.5 18.5 23.4Some graduate school 2.7 2.5 3.1 2.1 3.0 3.1 2.9 3.0 2.8 4.1 2.2 1.8 2.7Graduate degree 17.8 15.8 21.0 13.6 18.7 22.8 15.5 16.4 18.6 30.2 11.6 9.3 14.8
During the past year, did you “frequently”:Ask questions in class 57.2 56.1 59.0 54.8 57.6 58.5 57.9 56.5 57.2 65.8 64.6 63.2 66.6Support your opinions with a logical argument 55.2 52.5 59.6 50.3 55.2 58.2 52.7 53.6 56.9 69.8 53.6 50.7 57.6Seek solutions to problems and explain them to others 51.7 49.4 55.6 47.4 52.0 53.6 50.7 51.1 52.8 65.9 52.4 49.5 56.5Revise your papers to improve your writing 54.9 53.5 57.4 50.9 56.8 56.7 56.3 57.1 55.9 63.1 54.7 51.8 58.8Evaluate the quality or reliability of information you
received 36.9 35.2 39.6 32.8 38.3 39.8 36.4 37.8 37.3 48.1 39.5 37.0 43.0Take a risk because you feel you have more to gain 36.3 36.4 36.0 36.0 37.0 38.2 37.0 35.8 35.2 39.1 42.4 41.5 43.6Seek alternative solutions to a problem 43.4 42.9 44.3 41.8 44.3 45.8 43.9 43.2 43.0 49.2 46.3 43.9 49.7Look up scientific research articles and resources 20.5 19.4 22.5 18.0 21.1 22.0 21.9 19.7 21.0 27.8 20.8 18.3 24.4Explore topics on your own, even though it was not
required for a class 27.8 27.2 28.8 25.5 29.4 32.7 26.1 27.9 27.3 34.4 29.3 26.7 33.0Accept mistakes as part of the learning process 53.2 52.8 53.8 52.7 53.0 53.7 52.6 52.7 53.9 53.5 64.4 63.8 65.3Seek feedback on your academic work 53.1 52.1 54.7 50.3 54.5 55.8 54.0 53.5 53.4 59.5 63.0 61.9 64.4Take notes during class 78.5 77.9 79.5 75.9 80.4 79.3 83.5 80.0 78.3 84.2 81.9 80.6 83.8Work with other students on class assignments 60.0 58.9 61.8 59.9 57.6 56.8 60.9 56.7 61.8 62.0 59.3 58.2 60.9
2009 CIRP Freshman SurveyWeighted National Norms—Women
Baccalaureate Black Colleges All Bacc Institutions 4-year Colleges Universities and Universities
Institutions 4-yr Coll Universities Public Private Nonsec Catholic Oth Relig Public Private All HBCU Public Private
77

Your probable career occupation:Accountant or actuary 1.9 1.8 1.9 1.8 1.8 1.5 2.2 1.9 2.0 1.7 2.1 2.4 1.6Actor or entertainer 1.3 1.6 0.9 1.5 1.6 1.8 0.6 1.9 0.8 1.2 1.3 1.2 1.4Architect or urban planner 0.6 0.3 0.9 0.3 0.4 0.7 0.3 0.2 1.0 0.9 0.2 0.2 0.3Artist 3.2 4.3 1.6 2.5 6.5 13.3 1.4 2.4 1.7 1.1 0.8 1.0 0.5Business (clerical) 0.5 0.5 0.5 0.6 0.5 0.5 0.5 0.4 0.5 0.4 0.4 0.5 0.3Business executive (management, administrator) 4.6 3.9 5.7 3.9 4.0 4.0 4.9 3.5 5.3 7.0 3.7 4.5 2.6Business owner or proprietor 1.6 1.6 1.6 1.6 1.6 1.8 1.4 1.6 1.6 1.6 2.5 2.3 2.8Business salesperson or buyer 0.7 0.6 0.8 0.7 0.6 0.6 0.8 0.4 0.8 0.6 0.3 0.3 0.3Clergy (minister, priest) 0.1 0.1 0.0 0.0 0.1 0.0 0.0 0.3 0.0 0.0 0.0 0.0 0.1Clergy (other religious) 0.1 0.1 0.0 0.0 0.2 0.0 0.1 0.3 0.0 0.1 0.0 0.0 0.0Clinical psychologist 2.1 2.3 1.8 2.3 2.2 2.0 2.4 2.4 1.8 1.8 3.5 3.6 3.3College administrator/staff 0.0 0.0 0.0 0.0 0.0 0.0 0.1 0.1 0.0 0.0 0.1 0.1 0.1College teacher 0.4 0.3 0.4 0.3 0.4 0.4 0.3 0.5 0.3 0.5 0.2 0.2 0.2Computer programmer or analyst 0.4 0.4 0.4 0.4 0.4 0.4 0.3 0.5 0.4 0.3 1.3 1.6 0.8Conservationist or forester 0.3 0.3 0.3 0.2 0.3 0.5 0.1 0.3 0.4 0.2 0.1 0.2 0.0Dentist (including orthodontist) 1.2 1.0 1.6 1.0 1.0 0.7 1.2 1.1 1.6 1.4 2.0 1.4 2.8Dietitian or nutritionist 0.8 0.6 1.1 0.7 0.4 0.2 0.7 0.5 1.3 0.4 0.1 0.1 0.1Engineer 2.8 1.4 5.0 1.6 1.0 1.4 1.0 0.7 5.1 4.9 2.5 3.0 1.9Farmer or rancher 0.2 0.2 0.2 0.2 0.2 0.2 0.1 0.2 0.2 0.1 0.0 0.0 0.0Foreign service worker (including diplomat) 1.0 0.9 1.3 0.5 1.3 1.7 0.6 1.3 0.9 3.0 0.1 0.0 0.3Homemaker (full-time) 0.1 0.1 0.1 0.1 0.1 0.1 0.1 0.2 0.1 0.1 0.0 0.0 0.0Interior decorator (including designer) 0.5 0.5 0.5 0.3 0.7 1.2 0.4 0.4 0.6 0.3 0.1 0.1 0.1Lab technician or hygienist 0.2 0.2 0.2 0.2 0.2 0.2 0.2 0.3 0.3 0.1 0.3 0.2 0.4Law enforcement officer 0.6 0.7 0.3 0.9 0.6 0.4 0.5 0.8 0.3 0.2 1.5 1.6 1.2Lawyer (attorney) or judge 3.6 3.0 4.5 2.5 3.7 3.7 3.8 3.7 3.8 7.1 7.7 6.6 9.2Military service (career) 0.5 0.7 0.2 1.2 0.2 0.2 0.1 0.2 0.2 0.2 0.3 0.3 0.2Musician (performer, composer) 1.1 1.2 0.8 1.2 1.3 0.7 0.4 2.3 0.8 0.8 1.1 1.0 1.3Nurse 7.9 9.3 5.6 10.5 7.8 4.3 15.4 7.1 6.1 3.7 11.1 13.7 7.3Optometrist 0.4 0.3 0.5 0.3 0.3 0.2 0.4 0.3 0.5 0.3 0.5 0.4 0.5Pharmacist 2.1 2.0 2.3 1.6 2.4 2.1 3.3 2.3 2.3 2.4 4.7 1.8 8.8Physician 7.1 5.0 10.7 3.9 6.3 5.1 8.4 6.3 9.5 15.1 9.1 5.1 14.9Policymaker/Government 0.8 0.6 1.0 0.5 0.8 0.9 0.6 0.8 0.8 1.9 0.5 0.3 0.9School counselor 0.5 0.6 0.4 0.7 0.6 0.4 0.7 0.7 0.4 0.2 0.5 0.4 0.7School principal or superintendent 0.0 0.1 0.0 0.1 0.0 0.0 0.0 0.1 0.0 0.0 0.0 0.0 0.1Scientific researcher 1.9 1.6 2.5 1.4 1.9 2.5 1.2 1.7 2.3 3.0 1.5 1.4 1.6Social, welfare, or recreation worker 1.7 2.0 1.3 2.1 1.8 1.3 1.8 2.3 1.4 0.8 3.9 4.4 3.2Therapist (physical, occupational, speech) 4.4 4.5 4.2 4.9 4.1 2.8 5.3 4.6 4.8 2.2 3.6 4.6 2.3Teacher or administrator (elementary) 6.9 9.1 3.2 10.7 7.1 4.2 7.6 9.8 3.5 2.2 6.0 8.0 3.1Teacher or administrator (secondary) 4.5 5.5 3.0 6.2 4.5 3.2 4.3 5.9 3.3 1.9 2.9 3.9 1.4Veterinarian 1.7 1.5 2.1 1.4 1.7 2.0 0.9 1.9 2.4 1.0 0.8 0.8 0.9Writer or journalist 3.4 3.2 3.8 3.0 3.5 3.6 2.9 3.7 3.6 4.4 2.5 2.5 2.5Skilled trades 0.1 0.1 0.1 0.1 0.1 0.2 0.1 0.1 0.1 0.1 0.1 0.1 0.2Laborer (unskilled) 0.1 0.1 0.1 0.2 0.1 0.1 0.1 0.1 0.2 0.0 0.0 0.0 0.1Semi-skilled worker 0.1 0.1 0.1 0.1 0.1 0.1 0.2 0.1 0.2 0.1 0.1 0.1 0.1Unemployed 1.4 1.6 1.1 1.6 1.5 1.5 1.5 1.5 1.2 1.0 3.2 3.2 3.3Other 9.7 10.2 9.0 10.0 10.3 11.3 8.8 10.2 9.6 7.0 11.5 11.9 11.0Undecided 14.8 13.9 16.2 14.1 13.6 15.8 12.5 12.0 16.1 16.9 5.3 5.1 5.5
2009 CIRP Freshman SurveyWeighted National Norms—Women
Baccalaureate Black Colleges All Bacc Institutions 4-year Colleges Universities and Universities
Institutions 4-yr Coll Universities Public Private Nonsec Catholic Oth Relig Public Private All HBCU Public Private
78

Your father’s occupation:Accountant or actuary 2.5 2.3 3.0 2.1 2.4 2.2 3.2 2.2 2.8 3.7 1.3 0.9 1.8Actor or entertainer 0.1 0.1 0.1 0.1 0.1 0.2 0.1 0.1 0.1 0.1 0.2 0.4 0.1Architect or urban planner 1.0 1.0 1.1 1.0 1.1 1.4 0.8 1.0 1.0 1.1 0.7 0.7 0.7Artist 0.4 0.4 0.3 0.3 0.5 0.9 0.2 0.3 0.3 0.4 0.2 0.1 0.3Business (clerical) 1.3 1.3 1.3 1.3 1.3 1.5 1.2 1.1 1.3 1.2 1.0 0.8 1.4Business executive (management, administrator) 9.9 9.1 11.2 8.7 9.7 10.0 10.4 9.0 10.3 14.6 3.7 3.0 4.7Business owner or proprietor 8.7 8.5 9.2 8.0 9.0 10.2 8.5 8.0 8.9 10.4 4.3 3.5 5.4Business salesperson or buyer 4.4 4.2 4.8 4.4 3.9 4.0 4.5 3.6 4.9 4.3 2.1 2.0 2.3Clergy (minister, priest) 0.6 0.7 0.5 0.4 1.1 0.5 0.3 2.1 0.4 0.6 1.0 0.4 1.9Clergy (other religious) 0.1 0.1 0.1 0.1 0.2 0.1 0.1 0.3 0.1 0.1 0.1 0.1 0.2Clinical psychologist 0.1 0.1 0.1 0.1 0.2 0.2 0.1 0.1 0.1 0.2 0.1 0.0 0.1College administrator/staff 0.3 0.3 0.3 0.2 0.4 0.4 0.4 0.5 0.3 0.4 0.4 0.4 0.3College teacher 0.6 0.5 0.7 0.3 0.8 0.9 0.4 0.8 0.6 1.1 0.4 0.4 0.4Computer programmer or analyst 3.8 3.7 3.9 3.7 3.6 3.8 3.3 3.6 3.9 3.7 2.1 2.0 2.2Conservationist or forester 0.1 0.1 0.1 0.1 0.2 0.2 0.1 0.1 0.1 0.1 0.0 0.0 0.1Dentist (including orthodontist) 0.4 0.3 0.6 0.2 0.4 0.5 0.4 0.3 0.5 1.0 0.2 0.0 0.6Dietitian or nutritionist 0.1 0.1 0.1 0.1 0.1 0.2 0.1 0.1 0.1 0.1 0.2 0.2 0.3Engineer 8.5 7.5 10.1 7.8 7.1 7.4 6.7 6.9 10.5 8.7 4.2 4.1 4.5Farmer or rancher 1.1 0.9 1.5 0.9 0.9 0.6 0.5 1.4 1.7 0.6 0.4 0.5 0.2Foreign service worker (including diplomat) 0.1 0.1 0.1 0.0 0.1 0.2 0.0 0.1 0.1 0.2 0.2 0.1 0.2Homemaker (full-time) 0.3 0.2 0.3 0.2 0.3 0.3 0.2 0.2 0.3 0.2 0.2 0.1 0.3Interior decorator (including designer) 0.0 0.0 0.0 0.0 0.0 0.0 0.1 0.0 0.0 0.0 0.0 0.0 0.0Lab technician or hygienist 0.3 0.3 0.3 0.3 0.2 0.2 0.3 0.3 0.3 0.2 0.2 0.2 0.2Law enforcement officer 1.8 2.1 1.3 2.4 1.8 1.5 2.2 1.9 1.4 1.0 3.1 3.1 3.2Lawyer (attorney) or judge 2.2 1.8 3.0 1.2 2.5 3.4 2.1 1.9 2.3 5.4 0.7 0.4 1.2Military service (career) 1.7 2.0 1.3 2.2 1.7 1.3 1.1 2.5 1.4 0.9 3.8 4.1 3.3Musician (performer, composer) 0.3 0.3 0.2 0.3 0.3 0.3 0.1 0.4 0.2 0.3 0.5 0.4 0.5Nurse 0.5 0.5 0.5 0.5 0.6 0.5 0.8 0.5 0.5 0.3 0.4 0.4 0.4Optometrist 0.1 0.1 0.1 0.1 0.1 0.1 0.0 0.1 0.1 0.1 0.0 0.0 0.0Pharmacist 0.3 0.3 0.4 0.2 0.3 0.3 0.4 0.3 0.4 0.4 0.2 0.1 0.4Physician 2.0 1.4 3.1 0.8 2.2 2.6 1.7 2.0 2.2 6.0 0.7 0.4 1.0Policymaker/Government 0.7 0.8 0.7 0.7 0.8 0.8 0.7 0.8 0.7 0.8 0.7 0.6 0.9School counselor 0.1 0.1 0.1 0.0 0.1 0.1 0.1 0.1 0.1 0.0 0.1 0.1 0.2School principal or superintendent 0.2 0.2 0.2 0.2 0.2 0.2 0.2 0.3 0.2 0.2 0.1 0.2 0.1Scientific researcher 0.7 0.5 1.0 0.4 0.6 1.0 0.3 0.5 0.9 1.6 0.2 0.0 0.4Social, welfare, or recreation worker 0.5 0.5 0.5 0.4 0.6 0.5 0.6 0.6 0.5 0.4 1.0 1.0 0.9Therapist (physical, occupational, speech) 0.3 0.3 0.3 0.3 0.3 0.4 0.3 0.3 0.3 0.3 0.3 0.1 0.5Teacher or administrator (elementary) 0.6 0.7 0.6 0.7 0.7 0.7 0.6 0.7 0.6 0.5 0.6 0.7 0.4Teacher or administrator (secondary) 1.6 1.6 1.6 1.5 1.8 1.7 1.5 2.1 1.6 1.5 1.5 1.5 1.6Veterinarian 0.2 0.1 0.2 0.1 0.1 0.2 0.1 0.1 0.2 0.1 0.4 0.7 0.1Writer or journalist 0.4 0.3 0.4 0.2 0.4 0.5 0.5 0.4 0.4 0.5 0.2 0.1 0.3Skilled trades 6.2 6.9 5.0 7.2 6.5 6.2 7.4 6.4 5.2 4.4 6.5 6.2 7.0Laborer (unskilled) 3.2 3.2 3.0 3.6 2.9 2.3 3.5 3.0 3.4 1.8 3.8 3.4 4.4Semi-skilled worker 2.6 2.7 2.6 2.8 2.4 2.2 2.7 2.5 2.8 1.7 3.9 4.3 3.3Unemployed 5.2 5.6 4.4 5.8 5.4 5.0 6.0 5.5 4.7 3.3 13.5 15.4 10.8Other 23.8 26.1 20.0 27.8 23.9 22.2 25.2 24.9 21.3 15.2 34.4 37.0 30.8
2009 CIRP Freshman SurveyWeighted National Norms—Women
Baccalaureate Black Colleges All Bacc Institutions 4-year Colleges Universities and Universities
Institutions 4-yr Coll Universities Public Private Nonsec Catholic Oth Relig Public Private All HBCU Public Private
79

Your mother’s occupation:Accountant or actuary 4.9 4.8 5.2 5.1 4.3 4.5 4.4 4.2 5.3 4.7 4.1 4.0 4.3Actor or entertainer 0.0 0.0 0.0 0.0 0.0 0.1 0.0 0.0 0.0 0.1 0.1 0.1 0.1Architect or urban planner 0.2 0.2 0.3 0.1 0.2 0.4 0.1 0.1 0.3 0.3 0.0 0.0 0.1Artist 0.7 0.7 0.6 0.5 0.9 1.5 0.3 0.6 0.6 0.7 0.4 0.5 0.4Business (clerical) 3.9 4.0 3.6 4.1 3.9 3.5 4.1 4.2 3.6 3.5 3.7 3.3 4.2Business executive (management, administrator) 6.0 6.0 6.0 6.1 5.9 6.2 5.9 5.5 5.9 6.4 5.6 4.4 7.4Business owner or proprietor 3.2 3.0 3.4 2.8 3.3 3.5 2.7 3.4 3.4 3.7 2.1 1.9 2.5Business salesperson or buyer 2.2 2.1 2.4 2.3 1.9 2.1 1.9 1.6 2.5 1.9 1.4 1.5 1.3Clergy (minister, priest) 0.1 0.1 0.1 0.1 0.2 0.2 0.1 0.4 0.1 0.1 0.2 0.0 0.6Clergy (other religious) 0.1 0.1 0.1 0.1 0.2 0.1 0.1 0.2 0.1 0.1 0.1 0.1 0.0Clinical psychologist 0.2 0.2 0.2 0.1 0.3 0.4 0.1 0.2 0.2 0.3 0.3 0.2 0.3College administrator/staff 0.6 0.6 0.6 0.4 0.8 0.8 0.8 0.8 0.6 0.7 0.7 0.7 0.8College teacher 0.5 0.4 0.5 0.3 0.6 0.8 0.4 0.5 0.4 0.9 0.2 0.3 0.2Computer programmer or analyst 1.4 1.2 1.7 1.2 1.3 1.4 1.2 1.2 1.6 2.0 0.6 0.5 0.9Conservationist or forester 0.1 0.0 0.1 0.0 0.1 0.1 0.0 0.1 0.1 0.0 0.1 0.1 0.0Dentist (including orthodontist) 0.5 0.5 0.5 0.5 0.4 0.4 0.5 0.4 0.5 0.5 0.4 0.4 0.4Dietitian or nutritionist 0.4 0.4 0.4 0.3 0.4 0.4 0.4 0.5 0.5 0.4 0.5 0.6 0.4Engineer 0.9 0.6 1.3 0.6 0.6 0.8 0.4 0.5 1.2 1.4 0.7 0.9 0.5Farmer or rancher 0.1 0.1 0.1 0.1 0.2 0.2 0.1 0.2 0.1 0.1 0.0 0.0 0.0Foreign service worker (including diplomat) 0.1 0.1 0.1 0.1 0.1 0.2 0.1 0.1 0.1 0.1 0.0 0.0 0.1Homemaker (full-time) 8.8 7.8 10.5 6.7 9.3 8.5 9.0 10.3 9.3 14.7 2.1 1.6 2.7Interior decorator (including designer) 0.4 0.4 0.4 0.4 0.5 0.6 0.4 0.4 0.4 0.4 0.1 0.0 0.3Lab technician or hygienist 0.7 0.7 0.8 0.7 0.7 0.7 0.7 0.7 0.9 0.7 0.5 0.5 0.5Law enforcement officer 0.3 0.4 0.3 0.4 0.3 0.3 0.3 0.4 0.3 0.2 1.4 1.6 1.1Lawyer (attorney) or judge 1.0 0.8 1.3 0.6 1.1 1.6 0.7 0.8 0.9 2.6 0.8 0.4 1.4Military service (career) 0.2 0.2 0.2 0.2 0.2 0.2 0.2 0.3 0.2 0.1 0.8 0.8 0.9Musician (performer, composer) 0.2 0.2 0.2 0.1 0.3 0.3 0.1 0.3 0.1 0.2 0.0 0.0 0.1Nurse 8.1 8.2 7.8 8.4 8.1 7.1 9.7 8.3 8.1 7.0 9.8 10.3 9.0Optometrist 0.1 0.2 0.1 0.1 0.2 0.2 0.2 0.2 0.1 0.1 0.1 0.0 0.4Pharmacist 0.4 0.3 0.6 0.3 0.4 0.4 0.4 0.3 0.6 0.6 0.4 0.3 0.4Physician 0.8 0.6 1.3 0.4 0.9 1.2 0.5 0.7 0.9 2.5 0.4 0.3 0.6Policymaker/Government 0.5 0.6 0.5 0.5 0.6 0.7 0.5 0.7 0.5 0.5 1.1 0.8 1.6School counselor 0.3 0.3 0.3 0.3 0.3 0.3 0.3 0.3 0.2 0.4 0.4 0.5 0.3School principal or superintendent 0.2 0.2 0.2 0.2 0.2 0.2 0.2 0.2 0.2 0.2 0.3 0.3 0.2Scientific researcher 0.4 0.3 0.5 0.2 0.3 0.5 0.2 0.2 0.4 0.9 0.0 0.0 0.1Social, welfare, or recreation worker 1.8 1.8 1.6 1.8 1.9 1.8 2.0 2.0 1.6 1.8 4.3 4.1 4.5Therapist (physical, occupational, speech) 1.5 1.5 1.6 1.5 1.6 1.7 1.5 1.4 1.6 1.7 0.9 0.8 1.0Teacher or administrator (elementary) 7.4 7.5 7.3 7.4 7.7 7.1 7.3 8.5 7.5 6.6 5.2 4.8 5.8Teacher or administrator (secondary) 3.6 3.5 3.8 3.4 3.7 3.9 3.2 3.9 3.7 4.0 3.0 3.2 2.8Veterinarian 0.1 0.1 0.1 0.1 0.1 0.2 0.1 0.1 0.1 0.1 0.1 0.0 0.1Writer or journalist 0.4 0.4 0.4 0.3 0.5 0.6 0.3 0.4 0.4 0.8 0.2 0.1 0.3Skilled trades 1.3 1.3 1.2 1.4 1.1 1.1 1.2 1.1 1.3 0.9 1.2 1.4 1.0Laborer (unskilled) 1.6 1.6 1.6 1.8 1.4 1.2 1.7 1.4 1.8 1.0 1.8 1.9 1.7Semi-skilled worker 1.6 1.5 1.8 1.7 1.3 1.0 1.6 1.4 2.0 1.1 2.0 2.1 1.8Unemployed 7.9 8.3 7.3 8.9 7.7 7.8 8.1 7.3 7.4 6.9 12.2 13.0 11.0Other 24.1 26.0 21.1 27.5 24.1 23.4 25.9 23.7 22.6 15.8 29.4 31.5 26.3
2009 CIRP Freshman SurveyWeighted National Norms—Women
Baccalaureate Black Colleges All Bacc Institutions 4-year Colleges Universities and Universities
Institutions 4-yr Coll Universities Public Private Nonsec Catholic Oth Relig Public Private All HBCU Public Private
80

Race/Ethnicity—mark all that apply(total may add to more than 100%)American Indian/Alaska Native 2.6 3.1 1.7 3.3 2.7 2.7 1.8 3.2 1.8 1.6 3.9 3.3 4.7Asian American/Asian 8.6 4.9 14.5 4.2 5.9 8.6 4.7 3.8 14.0 16.4 0.9 0.5 1.5Native Hawaiian/Pacific Islander 1.0 1.0 1.1 1.0 0.8 0.8 1.2 0.7 1.1 0.9 0.3 0.1 0.7African American/Black 11.8 14.5 7.3 14.3 14.8 12.1 13.8 18.2 7.2 8.0 97.1 96.8 97.5Mexican American/Chicano 5.9 5.6 6.6 7.6 2.9 2.3 4.8 2.6 7.1 4.4 0.9 1.0 0.8Puerto Rican 1.6 1.9 1.1 1.7 2.1 2.1 2.7 1.7 1.0 1.7 1.3 1.3 1.2Other Latino 4.5 4.8 4.1 5.4 4.0 4.4 5.1 3.0 3.7 5.3 1.1 0.9 1.4White/Caucasian 72.1 72.9 70.7 71.3 75.0 76.2 72.7 75.1 71.0 69.5 4.6 5.4 3.6Other 3.7 3.9 3.2 4.1 3.7 4.4 3.5 3.2 3.0 3.9 4.0 3.8 4.2
Student “agree strongly” or “agree somewhat”:There is too much concern in the courts for the rights
of criminals 52.5 53.9 50.3 55.7 51.6 47.9 53.8 54.2 51.3 46.5 43.4 44.3 42.2Abortion should be legal 57.1 54.2 61.8 54.9 53.4 67.1 49.2 42.0 61.2 63.9 49.0 48.1 50.3Marijuana should be legalized 40.5 39.6 41.9 40.4 38.6 47.4 35.1 31.6 41.9 42.0 36.2 36.0 36.6Racial discrimination is no longer a major problem
in America 19.2 19.7 18.4 21.4 17.6 16.6 18.5 18.0 18.8 16.8 11.8 13.6 9.3Realistically, an individual can do little to bring about
changes in our society 24.6 26.4 21.6 28.0 24.2 24.5 25.3 23.5 22.4 18.6 35.9 40.3 29.8Same-sex couples should have the right to legal
marital status 71.8 69.7 75.3 70.7 68.5 80.4 71.5 54.9 75.3 75.2 58.5 59.2 57.5Only volunteers should serve in the armed forces 63.7 62.5 65.6 62.0 63.2 68.7 61.0 58.8 64.6 69.0 57.3 56.2 58.9Dissent is a critical component of the political process 58.2 55.1 63.1 53.0 57.8 61.3 55.0 55.8 60.5 72.7 49.9 48.3 52.2Colleges have the right to ban extreme speakers from
campus 38.6 39.1 37.7 38.3 40.0 36.1 39.9 44.1 37.6 38.2 41.7 42.4 40.9Students from disadvantaged social backgrounds
should be given preferential treatment in college admissions 36.1 38.0 32.9 38.3 37.7 37.8 36.3 38.2 33.3 31.4 52.1 52.9 51.1
Colleges should prohibit racist/sexist speech on campus 70.3 70.0 70.8 68.9 71.3 71.9 70.5 71.2 70.2 73.1 58.7 58.2 59.3
How would you characterize your political views?Far left 2.6 2.8 2.4 2.5 3.1 4.4 2.0 2.6 2.3 3.0 3.8 3.6 4.0Liberal 32.5 30.1 36.4 28.9 31.5 39.9 28.8 24.6 35.6 39.2 34.3 30.7 39.3Middle-of-the-road 43.7 44.8 42.0 46.6 42.6 41.4 47.6 41.1 43.2 37.3 42.6 43.1 41.9Conservative 19.8 20.8 18.2 20.5 21.3 13.5 20.2 29.8 17.8 19.5 16.8 19.9 12.3Far right 1.3 1.5 1.0 1.5 1.5 0.9 1.5 2.0 1.0 1.0 2.6 2.6 2.5
The following reasons were “very important” indeciding to go to college:
My parents wanted me to go 44.6 45.8 42.6 48.6 42.2 38.3 47.6 43.4 43.3 40.1 57.2 59.8 53.6To be able to get a better job 85.1 85.1 84.9 86.7 83.1 81.4 88.2 82.2 85.3 83.5 93.2 93.9 92.3To gain a general education and appreciation of ideas 75.9 75.3 76.7 73.8 77.3 78.3 78.2 75.8 75.4 81.6 86.8 85.7 88.3To make me a more cultured person 58.0 56.4 60.6 53.7 59.9 62.6 58.6 57.9 58.3 69.2 68.1 64.1 73.9To be able to make more money 70.6 71.3 69.6 75.1 66.4 64.2 74.3 64.4 71.0 64.6 88.2 90.5 84.9To learn more about things that interest me 85.9 85.4 86.7 84.3 86.8 89.0 84.6 85.8 86.2 88.7 88.4 87.5 89.8
2009 CIRP Freshman SurveyWeighted National Norms—Women
Baccalaureate Black Colleges All Bacc Institutions 4-year Colleges Universities and Universities
Institutions 4-yr Coll Universities Public Private Nonsec Catholic Oth Relig Public Private All HBCU Public Private
81

DURING YOUR LAST YEAR IN HIGH SCHOOL, HOWMUCH TIME DID YOU SPEND DURING A TYPICALWEEK DOING THE FOLLOWING ACTIVITIES?Studying/homework
None 1.1 1.2 0.7 1.4 1.0 1.1 0.8 1.2 0.8 0.6 1.8 2.2 1.4Less than one hour 9.3 10.6 7.2 12.5 8.2 8.1 7.4 8.7 7.9 4.3 15.1 17.1 12.31 to 2 hours 20.9 23.1 17.4 25.7 19.7 17.5 21.1 21.1 19.1 10.9 31.3 34.2 27.33 to 5 hours 29.0 29.5 28.1 30.9 27.7 26.9 28.4 28.1 29.9 21.4 28.0 27.4 29.06 to 10 hours 20.7 19.3 23.0 17.5 21.7 21.5 22.0 21.8 22.5 24.5 12.6 11.2 14.511 to 15 hours 10.0 8.9 12.0 7.1 11.2 12.2 11.0 10.2 10.5 17.2 5.5 4.5 7.016 to 20 hours 5.2 4.3 6.7 3.0 6.1 7.4 5.4 5.2 5.3 11.5 2.8 1.7 4.3Over 20 hours 3.8 3.1 5.0 2.0 4.4 5.3 3.9 3.8 3.8 9.6 2.8 1.7 4.3
Socializing with friendsNone 0.3 0.3 0.2 0.3 0.4 0.4 0.3 0.3 0.2 0.2 0.5 0.6 0.4Less than one hour 1.7 1.9 1.3 2.1 1.6 1.3 1.7 1.9 1.4 1.1 3.4 3.9 2.71 to 2 hours 7.3 7.5 7.1 7.6 7.3 6.6 7.4 8.0 7.3 6.1 11.1 10.6 11.83 to 5 hours 21.2 21.1 21.3 21.1 21.1 20.5 20.2 22.2 21.5 20.8 22.5 21.5 23.96 to 10 hours 27.2 26.2 29.0 25.5 27.1 27.2 28.1 26.5 28.5 30.8 22.4 22.5 22.311 to 15 hours 18.3 17.9 18.9 17.5 18.4 18.9 18.1 18.0 18.7 19.9 13.4 13.5 13.316 to 20 hours 10.7 10.9 10.5 11.0 10.7 11.4 11.1 9.8 10.5 10.7 7.7 7.6 7.7Over 20 hours 13.3 14.3 11.6 15.0 13.4 13.6 13.2 13.3 11.9 10.5 19.1 19.8 18.0
Talking with teachers outside of classNone 8.0 8.4 7.3 9.0 7.5 7.1 7.9 7.8 7.9 5.4 8.1 8.3 7.8Less than one hour 41.1 40.6 42.0 42.1 38.6 36.9 39.7 39.8 43.4 36.8 35.1 37.4 31.91 to 2 hours 32.6 32.0 33.4 31.1 33.3 34.4 32.6 32.5 32.5 36.7 29.4 28.4 30.73 to 5 hours 12.9 13.1 12.5 12.2 14.1 15.2 13.7 13.4 11.9 15.0 15.8 15.1 16.76 to 10 hours 3.5 3.7 3.1 3.6 4.0 4.0 3.8 4.0 2.8 4.1 7.1 6.9 7.411 to 15 hours 1.2 1.3 1.0 1.2 1.4 1.5 1.2 1.5 0.9 1.3 2.2 1.7 2.916 to 20 hours 0.5 0.5 0.4 0.5 0.5 0.5 0.5 0.5 0.4 0.4 1.1 1.1 1.0Over 20 hours 0.3 0.4 0.3 0.3 0.5 0.4 0.5 0.6 0.3 0.3 1.2 0.9 1.7
Exercise or sportsNone 6.6 7.5 5.2 7.7 7.1 6.9 6.2 7.8 5.5 4.2 15.7 16.7 14.4Less than one hour 10.9 11.4 10.1 11.5 11.3 11.2 9.8 12.1 10.4 9.1 14.1 13.5 14.81 to 2 hours 17.0 17.1 16.8 17.7 16.4 16.6 15.8 16.6 17.1 15.6 18.8 18.3 19.43 to 5 hours 19.3 18.8 20.2 19.1 18.5 19.0 18.1 18.2 19.9 21.3 17.2 17.2 17.26 to 10 hours 18.1 17.2 19.7 17.3 17.1 17.2 18.1 16.4 19.4 20.6 13.0 13.5 12.311 to 15 hours 13.0 12.5 13.8 11.7 13.5 13.8 14.3 12.8 13.6 14.5 7.2 6.3 8.616 to 20 hours 7.4 7.4 7.5 7.0 7.9 7.6 8.6 7.7 7.4 7.9 4.5 4.8 4.2Over 20 hours 7.6 8.1 6.8 8.0 8.3 7.7 9.1 8.4 6.8 6.8 9.5 9.8 9.0
PartyingNone 33.7 34.3 32.7 32.1 37.2 33.4 29.4 45.1 33.0 31.6 22.1 21.5 23.0Less than one hour 15.7 15.4 16.3 15.0 15.9 16.4 14.8 15.9 16.4 16.2 12.4 11.4 14.01 to 2 hours 17.1 16.6 17.8 17.2 15.9 15.8 18.6 14.4 17.7 18.2 18.7 18.1 19.63 to 5 hours 17.8 17.5 18.4 18.1 16.7 18.2 20.0 13.4 18.1 19.4 24.3 24.7 23.86 to 10 hours 9.5 9.5 9.5 10.3 8.6 9.8 10.4 6.5 9.4 9.8 10.4 10.8 9.711 to 15 hours 3.5 3.6 3.2 4.0 3.2 3.6 4.0 2.5 3.3 3.1 4.8 5.4 4.016 to 20 hours 1.5 1.6 1.2 1.8 1.4 1.6 1.7 1.2 1.3 0.9 3.6 4.2 2.8Over 20 hours 1.2 1.4 0.9 1.6 1.2 1.3 1.1 1.1 0.9 0.9 3.5 3.8 3.1
2009 CIRP Freshman SurveyWeighted National Norms—Women
Baccalaureate Black Colleges All Bacc Institutions 4-year Colleges Universities and Universities
Institutions 4-yr Coll Universities Public Private Nonsec Catholic Oth Relig Public Private All HBCU Public Private
82

DURING YOUR LAST YEAR IN HIGH SCHOOL, HOWMUCH TIME DID YOU SPEND DURING A TYPICALWEEK DOING THE FOLLOWING ACTIVITIES?Working (for pay)
None 35.4 33.5 38.5 31.2 36.5 39.1 31.8 36.4 36.6 45.5 38.9 36.1 42.8Less than one hour 2.7 2.6 2.9 2.5 2.7 2.7 2.4 2.9 2.8 3.4 1.9 1.8 2.01 to 2 hours 4.3 4.1 4.6 3.8 4.6 4.9 4.1 4.6 4.2 6.0 3.1 3.4 2.63 to 5 hours 8.1 7.8 8.7 7.3 8.4 8.0 8.5 8.9 8.5 9.7 6.4 6.0 6.86 to 10 hours 13.4 13.3 13.6 13.5 13.2 12.1 14.9 13.3 13.9 12.5 11.7 11.9 11.411 to 15 hours 13.2 13.4 13.0 14.2 12.4 11.7 13.9 12.3 13.7 10.2 8.1 8.9 6.916 to 20 hours 12.2 13.2 10.7 14.4 11.6 11.2 13.1 11.3 11.6 7.3 11.3 11.6 10.8Over 20 hours 10.6 12.1 8.0 13.3 10.6 10.4 11.4 10.5 8.7 5.4 18.7 20.1 16.7
Volunteer workNone 21.5 23.7 17.8 25.6 21.4 23.7 19.0 20.4 19.0 13.3 22.6 26.1 17.7Less than one hour 20.9 20.8 21.2 21.5 19.8 20.0 20.2 19.3 21.8 18.8 13.9 14.4 13.21 to 2 hours 26.9 25.6 29.2 24.4 27.1 26.1 27.3 28.0 28.6 31.2 23.4 22.7 24.33 to 5 hours 17.3 16.3 18.9 15.7 17.1 16.0 18.5 17.3 18.0 22.3 17.8 16.9 19.06 to 10 hours 7.0 6.9 7.3 6.5 7.5 7.4 7.5 7.5 7.0 8.4 9.8 9.0 10.911 to 15 hours 2.7 2.7 2.6 2.5 3.0 2.7 3.1 3.1 2.5 3.0 4.5 3.9 5.216 to 20 hours 1.4 1.5 1.2 1.4 1.5 1.6 1.6 1.4 1.2 1.2 2.8 2.3 3.5Over 20 hours 2.3 2.5 1.9 2.4 2.7 2.5 2.9 2.9 1.9 1.8 5.2 4.5 6.2
Student clubs/groupsNone 21.5 24.6 16.4 27.4 21.1 22.1 19.8 20.8 18.1 9.9 22.7 25.3 19.0Less than one hour 13.9 13.8 14.2 14.3 13.0 12.4 13.6 13.4 15.2 10.7 9.9 10.0 9.81 to 2 hours 26.8 25.7 28.5 24.7 27.0 26.7 27.8 26.8 28.6 28.1 23.2 23.6 22.73 to 5 hours 20.0 18.8 22.0 17.3 20.6 20.8 21.3 20.1 20.7 26.9 21.0 20.1 22.36 to 10 hours 9.3 8.7 10.1 8.2 9.5 9.3 9.5 9.6 9.3 13.1 11.1 9.9 12.711 to 15 hours 4.0 3.9 4.3 3.5 4.3 4.1 4.0 4.8 3.9 5.8 4.8 4.2 5.616 to 20 hours 2.0 1.9 2.0 1.9 2.0 2.1 1.8 1.9 1.9 2.7 2.6 2.4 2.9Over 20 hours 2.5 2.6 2.4 2.7 2.5 2.4 2.3 2.6 2.3 2.9 4.7 4.6 5.0
Watching TVNone 7.1 6.9 7.4 6.1 8.0 9.1 6.1 7.8 7.1 8.4 5.9 5.4 6.7Less than one hour 16.8 16.9 16.7 17.3 16.3 16.1 16.7 16.3 17.0 15.8 16.0 15.7 16.41 to 2 hours 26.2 26.0 26.6 26.4 25.5 25.8 25.9 25.0 27.2 24.7 20.6 20.7 20.43 to 5 hours 27.4 26.9 28.1 26.9 26.8 26.6 27.3 26.8 27.9 29.2 21.9 21.6 22.46 to 10 hours 13.8 13.9 13.6 13.7 14.1 13.6 14.8 14.3 13.3 14.4 15.0 15.2 14.611 to 15 hours 4.7 4.9 4.2 5.0 4.9 4.7 4.9 5.1 4.2 4.3 8.0 8.0 7.916 to 20 hours 1.9 2.1 1.5 2.1 2.1 2.1 1.9 2.2 1.5 1.5 4.4 4.8 3.9Over 20 hours 2.2 2.5 1.8 2.6 2.4 2.1 2.4 2.5 1.9 1.7 8.2 8.6 7.7
2009 CIRP Freshman SurveyWeighted National Norms—Women
Baccalaureate Black Colleges All Bacc Institutions 4-year Colleges Universities and Universities
Institutions 4-yr Coll Universities Public Private Nonsec Catholic Oth Relig Public Private All HBCU Public Private
83

DURING YOUR LAST YEAR IN HIGH SCHOOL, HOWMUCH TIME DID YOU SPEND DURING A TYPICALWEEK DOING THE FOLLOWING ACTIVITIES?Household/childcare duties
None 14.0 13.8 14.2 13.1 14.6 17.3 12.8 12.9 13.7 16.2 15.0 15.5 14.4Less than one hour 20.2 18.6 22.7 18.3 19.1 20.1 18.2 18.6 22.6 23.2 14.0 13.2 15.11 to 2 hours 31.8 31.1 33.0 31.2 30.9 30.5 31.4 31.0 33.1 32.5 25.9 26.3 25.53 to 5 hours 20.6 21.3 19.5 21.5 21.1 19.6 22.1 22.0 19.6 18.9 19.7 18.9 20.86 to 10 hours 7.6 8.3 6.3 8.7 7.8 6.8 8.4 8.5 6.5 5.7 10.5 10.9 9.911 to 15 hours 2.8 3.2 2.2 3.3 2.9 2.8 3.2 3.0 2.2 1.9 4.8 4.7 5.016 to 20 hours 1.2 1.5 0.8 1.4 1.5 1.3 1.5 1.7 0.9 0.7 2.6 2.5 2.7Over 20 hours 1.8 2.2 1.2 2.4 2.0 1.6 2.3 2.2 1.3 0.8 7.4 8.0 6.5
Reading for pleasureNone 18.2 19.1 16.7 20.5 17.4 16.6 19.4 17.2 17.3 14.3 20.4 22.8 17.0Less than one hour 22.5 21.5 24.2 21.6 21.3 21.0 23.1 20.6 24.5 23.1 20.2 20.4 19.91 to 2 hours 25.4 24.6 26.7 24.1 25.2 25.5 25.4 24.7 26.3 28.2 24.9 23.4 27.13 to 5 hours 18.7 18.5 19.0 17.9 19.2 19.8 17.5 19.5 18.6 20.6 16.2 15.5 17.16 to 10 hours 8.6 8.9 8.2 8.6 9.3 9.6 8.1 9.7 8.0 8.7 8.1 7.7 8.611 to 15 hours 3.5 3.9 2.8 4.0 3.9 3.8 3.4 4.2 2.8 2.9 4.5 4.5 4.716 to 20 hours 1.5 1.7 1.1 1.6 1.8 1.8 1.5 1.9 1.1 1.0 1.8 1.6 2.1Over 20 hours 1.7 1.9 1.3 1.8 2.0 2.0 1.6 2.2 1.3 1.3 3.9 4.1 3.6
Playing video/computer gamesNone 60.4 58.8 62.9 59.0 58.5 58.3 60.3 57.8 62.3 65.3 54.6 53.3 56.4Less than one hour 20.6 20.9 20.1 21.1 20.7 19.6 21.0 21.6 20.4 18.9 19.1 18.4 20.11 to 2 hours 10.2 10.6 9.3 10.8 10.5 10.3 9.9 11.0 9.5 8.7 12.9 14.1 11.33 to 5 hours 5.2 5.5 4.6 5.2 5.8 6.8 5.1 5.3 4.7 4.3 6.7 6.9 6.46 to 10 hours 2.0 2.3 1.6 2.2 2.4 2.6 2.1 2.2 1.6 1.6 3.5 4.2 2.511 to 15 hours 0.8 0.9 0.7 0.8 1.0 1.2 0.8 1.0 0.7 0.6 1.4 1.2 1.716 to 20 hours 0.4 0.5 0.4 0.4 0.5 0.6 0.3 0.6 0.4 0.2 0.7 0.8 0.5Over 20 hours 0.4 0.5 0.4 0.5 0.5 0.6 0.4 0.5 0.4 0.3 1.1 1.1 1.1
Online social networks (MySpace, Facebook, etc.)None 6.4 6.7 5.9 7.3 6.0 5.3 6.5 6.3 6.2 4.7 7.9 8.7 6.8Less than one hour 16.5 16.1 17.1 17.5 14.4 14.5 15.2 13.8 17.8 14.5 15.0 15.6 14.01 to 2 hours 27.1 26.2 28.7 26.5 25.9 26.2 26.1 25.4 28.9 27.9 22.1 21.7 22.53 to 5 hours 26.6 25.9 27.6 25.0 27.1 27.3 26.8 27.0 27.0 29.7 20.4 20.1 20.96 to 10 hours 12.8 13.1 12.2 12.4 14.0 14.1 13.0 14.5 11.8 13.7 13.5 12.5 14.811 to 15 hours 5.1 5.5 4.5 5.0 6.0 5.8 5.9 6.2 4.3 4.9 7.0 6.8 7.316 to 20 hours 2.4 2.7 1.9 2.6 2.8 2.9 2.5 2.9 1.9 2.2 3.7 3.9 3.5Over 20 hours 3.1 3.7 2.2 3.6 3.9 3.8 3.9 3.9 2.1 2.4 10.5 10.7 10.2
The following reasons were “very important” indeciding to go to this particular college:
My parents wanted me to come here 20.0 21.0 18.4 21.9 19.8 16.6 23.0 21.3 18.4 18.1 27.8 28.8 26.2My relatives wanted me to come here 7.0 7.7 5.9 8.2 7.2 5.6 8.3 8.1 5.9 5.7 17.2 19.5 13.9My teacher advised me 7.9 8.8 6.3 9.1 8.4 9.2 8.7 7.5 6.4 6.2 12.2 13.0 10.9This college has a very good academic reputation 67.1 64.4 71.6 59.5 70.7 71.4 74.9 67.7 68.9 81.7 62.8 52.6 77.2This college has a good reputation for its social
activities 40.8 38.7 44.3 37.7 40.0 37.1 42.1 41.9 45.3 40.5 46.2 44.3 48.8I was offered financial assistance 48.5 52.5 41.8 42.8 64.8 58.5 68.6 69.0 39.2 51.5 56.2 58.8 52.6
2009 CIRP Freshman SurveyWeighted National Norms—Women
Baccalaureate Black Colleges All Bacc Institutions 4-year Colleges Universities and Universities
Institutions 4-yr Coll Universities Public Private Nonsec Catholic Oth Relig Public Private All HBCU Public Private
84

The following reasons were “very important” indeciding to go to this particular college:
The cost of attending this college 45.1 47.2 41.5 56.1 35.7 33.4 41.0 35.2 44.7 29.7 50.1 59.3 36.8High school counselor advised me 10.7 11.8 9.0 12.7 10.6 10.5 13.5 9.2 8.8 9.9 16.5 17.5 15.1Private college counselor advised me 3.6 4.1 2.7 3.0 5.5 5.1 5.8 5.8 2.3 4.2 6.6 6.0 7.5I wanted to live near home 23.3 26.9 17.3 30.4 22.5 18.6 29.6 22.6 18.6 12.5 23.0 26.0 18.8Not offered aid by first choice 9.8 9.9 9.7 10.1 9.6 8.6 12.1 9.3 10.1 8.1 15.2 16.3 13.6Could not afford first choice 13.8 14.1 13.3 16.9 10.6 9.8 12.8 10.1 14.7 8.3 18.6 21.9 13.8This college’s graduates gain admission to top
graduate/professional schools 38.1 34.1 44.6 29.2 40.4 41.2 45.4 36.9 41.9 54.6 45.8 34.3 62.0This college’s graduates get good jobs 59.1 56.7 63.2 51.9 62.8 63.6 69.9 58.1 60.9 71.2 62.9 55.7 73.1I was attracted by the religious affiliation/orientation
of the college 9.0 11.0 5.6 4.8 19.0 5.3 19.9 32.1 3.0 15.2 17.1 13.9 21.6I wanted to go to a school about the size of this
college 45.8 50.6 38.0 43.8 59.1 56.2 58.3 62.5 34.9 49.0 44.2 41.9 47.4Rankings in national magazines 18.3 13.8 25.6 10.7 17.8 20.9 18.1 14.5 23.4 33.5 22.4 13.5 35.0Information from a website 22.3 22.3 22.4 20.5 24.5 28.5 22.3 21.8 20.9 27.6 32.3 29.2 36.7I was admitted through an Early Action or Early
Decision program 14.3 13.8 15.1 11.1 17.3 19.3 17.7 15.2 12.3 25.1 13.3 10.6 17.2The athletic department recruited me 6.2 7.8 3.6 5.6 10.6 9.4 10.5 11.9 3.2 4.9 7.6 9.2 5.3A visit to the campus 46.6 47.7 44.8 42.2 54.6 56.6 51.0 54.6 42.5 53.3 44.2 44.0 44.4Ability to take online courses 2.6 3.0 2.0 3.6 2.2 1.6 2.5 2.6 2.3 1.3 6.4 7.6 4.8
Your probable field of study:Arts and Humanities
Art, fine and applied 4.1 5.1 2.3 3.2 7.7 15.6 2.0 2.8 2.5 1.6 0.7 0.8 0.5English (language and literature) 2.5 2.5 2.4 2.2 2.8 3.1 2.3 2.8 2.3 2.9 1.5 0.9 2.5History 1.1 1.2 1.0 1.0 1.3 1.4 1.0 1.5 0.8 1.5 0.3 0.2 0.5Journalism 1.9 1.7 2.3 1.9 1.5 1.5 1.6 1.6 2.2 2.5 2.3 2.5 1.9Language and Literature (except English) 0.9 0.8 1.1 0.7 0.9 1.0 0.5 1.1 1.0 1.3 0.2 0.2 0.2Music 1.2 1.3 1.0 1.2 1.4 0.8 0.5 2.6 0.9 1.0 0.9 0.8 1.1Philosophy 0.2 0.1 0.2 0.1 0.2 0.3 0.2 0.2 0.2 0.2 0.2 0.1 0.2Speech 0.1 0.1 0.1 0.2 0.1 0.0 0.2 0.1 0.2 0.1 0.2 0.3 0.1Theater or Drama 1.3 1.5 0.9 1.6 1.5 1.9 0.4 1.8 0.8 1.2 0.8 0.5 1.2Theology or Religion 0.2 0.2 0.1 0.0 0.4 0.1 0.3 0.9 0.0 0.2 0.0 0.0 0.0Other Arts and Humanities 1.6 1.7 1.4 1.5 1.9 3.2 0.8 1.2 1.4 1.4 0.8 0.8 0.7
Biological ScienceBiology (general) 6.3 5.3 7.8 4.8 6.0 5.1 8.0 5.8 7.6 8.5 12.6 9.7 16.9Biochemistry or Biophysics 1.3 0.8 2.2 0.6 1.1 1.2 1.0 1.0 2.3 2.1 1.1 0.5 1.9Botany 0.0 0.0 0.1 0.0 0.0 0.0 0.0 0.0 0.1 0.0 0.0 0.0 0.1Environmental Science 0.8 0.7 0.9 0.5 1.0 1.5 0.3 0.9 0.9 0.8 0.3 0.4 0.2Marine (Life) Science 0.5 0.6 0.4 0.7 0.5 0.5 0.2 0.6 0.4 0.3 0.1 0.0 0.1Microbiology or Bacteriology 0.3 0.2 0.5 0.2 0.1 0.2 0.1 0.1 0.5 0.2 0.1 0.1 0.2Zoology 0.5 0.5 0.6 0.4 0.5 0.7 0.2 0.4 0.8 0.2 0.0 0.0 0.1Other Biological Science 0.9 0.6 1.4 0.5 0.7 1.0 0.8 0.4 1.4 1.3 0.4 0.3 0.5
2009 CIRP Freshman SurveyWeighted National Norms—Women
Baccalaureate Black Colleges All Bacc Institutions 4-year Colleges Universities and Universities
Institutions 4-yr Coll Universities Public Private Nonsec Catholic Oth Relig Public Private All HBCU Public Private
85

Your probable field of study (continued):Business
Accounting 1.8 1.8 1.8 1.9 1.7 1.2 2.2 2.0 1.9 1.4 2.5 3.0 1.7Business Administration (general) 2.0 1.9 2.1 2.0 1.8 1.8 1.5 1.9 2.1 1.8 2.5 3.2 1.5Finance 0.6 0.5 1.0 0.5 0.5 0.5 0.6 0.4 0.8 1.7 0.4 0.3 0.5International Business 1.1 1.0 1.4 0.8 1.2 1.4 1.4 0.9 1.1 2.3 0.4 0.2 0.6Marketing 2.2 2.0 2.5 2.1 1.9 1.8 3.2 1.3 2.5 2.5 1.4 1.5 1.3Management 2.0 2.1 1.9 2.2 1.9 1.9 2.0 1.9 2.0 1.6 2.7 2.9 2.4Secretarial Studies 0.0 0.0 0.0 0.0 0.0 0.0 0.0 0.0 0.0 0.0 0.0 0.0 0.0Other Business 0.6 0.5 0.8 0.4 0.7 0.9 0.4 0.6 0.7 0.9 0.4 0.4 0.4
EducationBusiness Education 0.1 0.1 0.1 0.1 0.0 0.0 0.0 0.1 0.1 0.1 0.2 0.1 0.3Elementary Education 6.1 8.2 2.8 9.5 6.5 3.8 6.5 9.1 3.0 1.8 6.3 8.3 3.4Music or Art Education 0.8 1.0 0.4 1.0 0.9 0.7 0.3 1.6 0.4 0.2 0.4 0.5 0.3Physical Education or Recreation 0.4 0.6 0.2 0.7 0.4 0.3 0.3 0.6 0.2 0.1 0.5 0.6 0.4Secondary Education 2.3 2.9 1.4 3.2 2.5 1.5 2.8 3.3 1.5 1.0 2.3 3.4 0.8Special Education 0.8 1.1 0.5 1.3 0.8 0.4 1.3 0.9 0.5 0.4 0.6 0.7 0.3Other Education 0.4 0.5 0.3 0.7 0.3 0.3 0.3 0.4 0.3 0.2 0.5 0.5 0.3
EngineeringAeronautical or Astronautical Engineering 0.2 0.2 0.3 0.3 0.0 0.0 0.1 0.0 0.3 0.2 0.1 0.1 0.2Civil Engineering 0.5 0.2 0.9 0.3 0.2 0.2 0.3 0.2 0.9 0.8 0.2 0.2 0.3Chemical Engineering 0.6 0.2 1.2 0.2 0.2 0.2 0.2 0.1 1.2 1.3 0.2 0.2 0.3Computer Engineering 0.2 0.2 0.3 0.2 0.1 0.1 0.1 0.1 0.4 0.3 0.6 0.8 0.4Electrical or Electronic Engineering 0.2 0.1 0.4 0.1 0.1 0.1 0.1 0.1 0.4 0.3 0.3 0.5 0.1Industrial Engineering 0.1 0.0 0.2 0.0 0.0 0.1 0.0 0.0 0.3 0.1 0.1 0.1 0.0Mechanical Engineering 0.5 0.3 0.8 0.4 0.2 0.3 0.2 0.1 0.8 0.9 0.5 0.6 0.4Other Engineering 1.0 0.4 2.1 0.5 0.3 0.4 0.3 0.2 1.9 2.7 0.4 0.3 0.6
Physical ScienceAstronomy 0.1 0.0 0.1 0.1 0.0 0.0 0.0 0.0 0.1 0.1 0.0 0.0 0.0Atmospheric Science (incl. Meteorology) 0.1 0.1 0.1 0.1 0.0 0.0 0.0 0.1 0.2 0.0 0.0 0.0 0.0Chemistry 1.2 1.2 1.3 1.2 1.2 1.1 1.4 1.2 1.2 1.6 2.6 1.4 4.3Earth Science 0.1 0.1 0.1 0.1 0.1 0.2 0.0 0.1 0.1 0.1 0.0 0.1 0.0Marine Science (incl. Oceanography) 0.2 0.2 0.1 0.3 0.2 0.3 0.0 0.1 0.1 0.1 0.0 0.0 0.0Mathematics 0.8 0.7 0.9 0.7 0.7 0.7 0.6 0.7 0.8 1.1 0.3 0.1 0.5Physics 0.2 0.2 0.3 0.1 0.2 0.3 0.1 0.3 0.2 0.5 0.2 0.2 0.2Other Physical Science 0.2 0.2 0.3 0.2 0.2 0.2 0.2 0.2 0.3 0.2 0.1 0.1 0.1
ProfessionalArchitecture or Urban Planning 0.5 0.3 0.9 0.2 0.3 0.6 0.2 0.1 0.9 0.7 0.2 0.3 0.2Family & Consumer Sciences 0.3 0.2 0.4 0.3 0.1 0.0 0.1 0.2 0.4 0.4 0.2 0.4 0.0Health Technology (medical, dental, laboratory) 0.6 0.6 0.6 0.7 0.5 0.4 0.8 0.5 0.7 0.5 0.3 0.2 0.5Library or Archival Science 0.1 0.1 0.1 0.1 0.1 0.0 0.2 0.1 0.1 0.0 0.2 0.2 0.2Medicine, Dentistry, Veterinary Medicine 4.6 3.7 6.0 3.0 4.6 3.9 5.2 5.1 5.7 7.3 3.8 1.8 6.6Nursing 7.8 9.2 5.6 10.3 7.7 4.5 15.3 6.8 6.1 3.7 10.2 13.2 5.9Pharmacy 1.4 1.4 1.5 1.0 1.9 1.7 2.4 1.9 1.3 2.0 2.8 0.8 5.8Therapy (occupational, physical, speech) 2.8 2.7 2.8 2.7 2.7 1.7 4.0 3.1 3.3 1.2 2.2 3.1 0.8Other Professional 0.9 0.9 0.9 1.0 0.8 0.6 1.4 0.8 0.8 1.1 0.7 0.7 0.7
2009 CIRP Freshman SurveyWeighted National Norms—Women
Baccalaureate Black Colleges All Bacc Institutions 4-year Colleges Universities and Universities
Institutions 4-yr Coll Universities Public Private Nonsec Catholic Oth Relig Public Private All HBCU Public Private
86
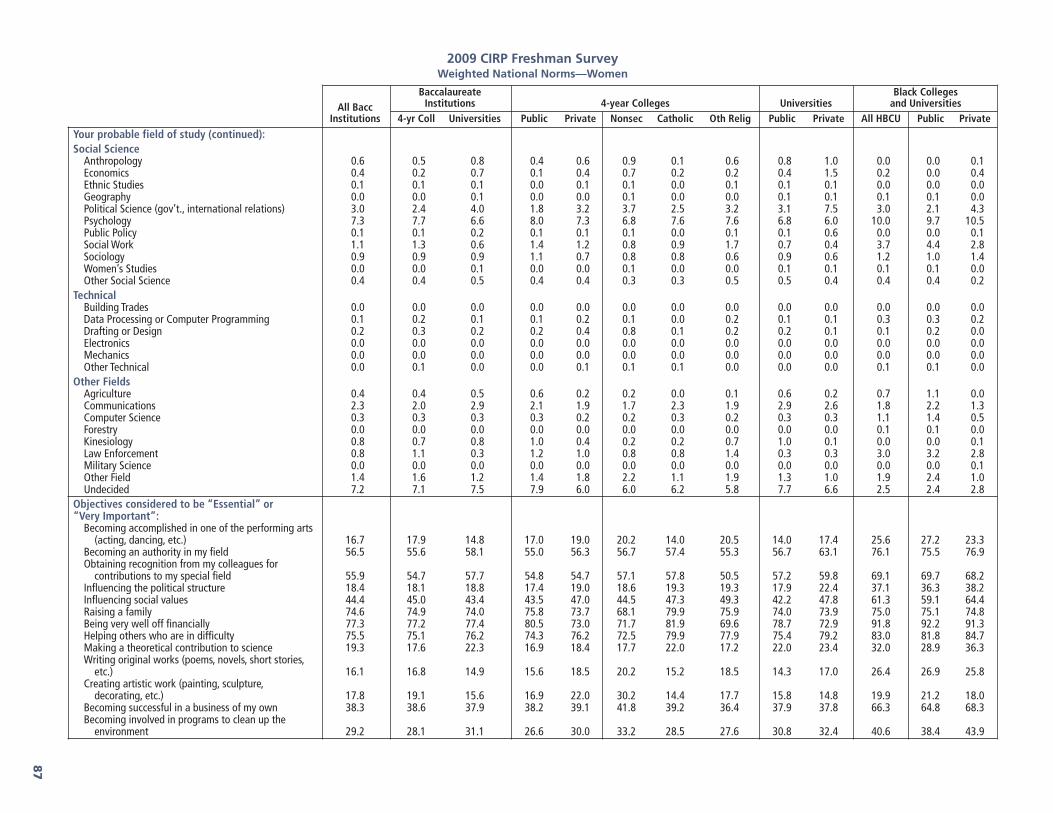
Your probable field of study (continued):Social Science
Anthropology 0.6 0.5 0.8 0.4 0.6 0.9 0.1 0.6 0.8 1.0 0.0 0.0 0.1Economics 0.4 0.2 0.7 0.1 0.4 0.7 0.2 0.2 0.4 1.5 0.2 0.0 0.4Ethnic Studies 0.1 0.1 0.1 0.0 0.1 0.1 0.0 0.1 0.1 0.1 0.0 0.0 0.0Geography 0.0 0.0 0.1 0.0 0.0 0.1 0.0 0.0 0.1 0.1 0.1 0.1 0.0Political Science (gov’t., international relations) 3.0 2.4 4.0 1.8 3.2 3.7 2.5 3.2 3.1 7.5 3.0 2.1 4.3Psychology 7.3 7.7 6.6 8.0 7.3 6.8 7.6 7.6 6.8 6.0 10.0 9.7 10.5Public Policy 0.1 0.1 0.2 0.1 0.1 0.1 0.0 0.1 0.1 0.6 0.0 0.0 0.1Social Work 1.1 1.3 0.6 1.4 1.2 0.8 0.9 1.7 0.7 0.4 3.7 4.4 2.8Sociology 0.9 0.9 0.9 1.1 0.7 0.8 0.8 0.6 0.9 0.6 1.2 1.0 1.4Women’s Studies 0.0 0.0 0.1 0.0 0.0 0.1 0.0 0.0 0.1 0.1 0.1 0.1 0.0Other Social Science 0.4 0.4 0.5 0.4 0.4 0.3 0.3 0.5 0.5 0.4 0.4 0.4 0.2
TechnicalBuilding Trades 0.0 0.0 0.0 0.0 0.0 0.0 0.0 0.0 0.0 0.0 0.0 0.0 0.0Data Processing or Computer Programming 0.1 0.2 0.1 0.1 0.2 0.1 0.0 0.2 0.1 0.1 0.3 0.3 0.2Drafting or Design 0.2 0.3 0.2 0.2 0.4 0.8 0.1 0.2 0.2 0.1 0.1 0.2 0.0Electronics 0.0 0.0 0.0 0.0 0.0 0.0 0.0 0.0 0.0 0.0 0.0 0.0 0.0Mechanics 0.0 0.0 0.0 0.0 0.0 0.0 0.0 0.0 0.0 0.0 0.0 0.0 0.0Other Technical 0.0 0.1 0.0 0.0 0.1 0.1 0.1 0.0 0.0 0.0 0.1 0.1 0.0
Other FieldsAgriculture 0.4 0.4 0.5 0.6 0.2 0.2 0.0 0.1 0.6 0.2 0.7 1.1 0.0Communications 2.3 2.0 2.9 2.1 1.9 1.7 2.3 1.9 2.9 2.6 1.8 2.2 1.3Computer Science 0.3 0.3 0.3 0.3 0.2 0.2 0.3 0.2 0.3 0.3 1.1 1.4 0.5Forestry 0.0 0.0 0.0 0.0 0.0 0.0 0.0 0.0 0.0 0.0 0.1 0.1 0.0Kinesiology 0.8 0.7 0.8 1.0 0.4 0.2 0.2 0.7 1.0 0.1 0.0 0.0 0.1Law Enforcement 0.8 1.1 0.3 1.2 1.0 0.8 0.8 1.4 0.3 0.3 3.0 3.2 2.8Military Science 0.0 0.0 0.0 0.0 0.0 0.0 0.0 0.0 0.0 0.0 0.0 0.0 0.1Other Field 1.4 1.6 1.2 1.4 1.8 2.2 1.1 1.9 1.3 1.0 1.9 2.4 1.0Undecided 7.2 7.1 7.5 7.9 6.0 6.0 6.2 5.8 7.7 6.6 2.5 2.4 2.8
Objectives considered to be “Essential” or “Very Important”:
Becoming accomplished in one of the performing arts(acting, dancing, etc.) 16.7 17.9 14.8 17.0 19.0 20.2 14.0 20.5 14.0 17.4 25.6 27.2 23.3
Becoming an authority in my field 56.5 55.6 58.1 55.0 56.3 56.7 57.4 55.3 56.7 63.1 76.1 75.5 76.9Obtaining recognition from my colleagues for
contributions to my special field 55.9 54.7 57.7 54.8 54.7 57.1 57.8 50.5 57.2 59.8 69.1 69.7 68.2Influencing the political structure 18.4 18.1 18.8 17.4 19.0 18.6 19.3 19.3 17.9 22.4 37.1 36.3 38.2Influencing social values 44.4 45.0 43.4 43.5 47.0 44.5 47.3 49.3 42.2 47.8 61.3 59.1 64.4Raising a family 74.6 74.9 74.0 75.8 73.7 68.1 79.9 75.9 74.0 73.9 75.0 75.1 74.8Being very well off financially 77.3 77.2 77.4 80.5 73.0 71.7 81.9 69.6 78.7 72.9 91.8 92.2 91.3Helping others who are in difficulty 75.5 75.1 76.2 74.3 76.2 72.5 79.9 77.9 75.4 79.2 83.0 81.8 84.7Making a theoretical contribution to science 19.3 17.6 22.3 16.9 18.4 17.7 22.0 17.2 22.0 23.4 32.0 28.9 36.3Writing original works (poems, novels, short stories,
etc.) 16.1 16.8 14.9 15.6 18.5 20.2 15.2 18.5 14.3 17.0 26.4 26.9 25.8Creating artistic work (painting, sculpture,
decorating, etc.) 17.8 19.1 15.6 16.9 22.0 30.2 14.4 17.7 15.8 14.8 19.9 21.2 18.0Becoming successful in a business of my own 38.3 38.6 37.9 38.2 39.1 41.8 39.2 36.4 37.9 37.8 66.3 64.8 68.3Becoming involved in programs to clean up the
environment 29.2 28.1 31.1 26.6 30.0 33.2 28.5 27.6 30.8 32.4 40.6 38.4 43.9
2009 CIRP Freshman SurveyWeighted National Norms—Women
Baccalaureate Black Colleges All Bacc Institutions 4-year Colleges Universities and Universities
Institutions 4-yr Coll Universities Public Private Nonsec Catholic Oth Relig Public Private All HBCU Public Private
87

Objectives considered to be “Essential” or “Very Important”:
Developing a meaningful philosophy of life 47.4 46.1 49.6 44.1 48.6 50.5 46.5 47.9 48.0 55.4 60.3 58.4 63.0Participating in a community action program 34.3 32.9 36.7 30.3 36.3 34.7 38.2 36.9 34.2 45.7 53.6 48.9 60.2Helping to promote racial understanding 35.7 35.0 37.0 33.2 37.3 38.0 37.3 36.6 35.7 41.7 58.4 54.5 64.1Keeping up to date with political affairs 33.4 30.3 38.6 28.0 33.2 35.3 32.2 31.6 36.4 46.9 43.3 40.5 47.3Becoming a community leader 36.1 34.7 38.4 33.3 36.5 35.1 37.8 37.1 36.6 45.1 57.2 54.3 61.3Improving my understanding of other
countries/cultures 53.5 50.7 58.3 46.7 55.8 59.6 51.7 54.3 55.8 67.5 59.0 53.5 66.8Adopting “green” practices to protect the
environment 46.2 43.8 50.2 41.9 46.3 52.7 44.6 40.7 49.7 52.4 43.4 40.9 46.9Student estimates “Very Good Chance” that they will:
Change major field 14.4 13.0 16.8 13.9 11.8 13.0 11.4 10.9 16.7 17.3 8.9 9.4 8.2Change career choice 14.1 12.6 16.6 12.4 12.7 14.6 11.1 11.6 16.0 18.8 7.4 7.7 6.9Participate in student government 7.9 7.6 8.4 7.4 8.0 7.7 8.2 8.2 8.0 10.0 18.6 17.3 20.4Get a job to help pay for college expenses 55.8 55.9 55.5 56.3 55.4 55.2 56.1 55.2 56.9 50.4 48.6 49.6 47.3Work full-time while attending college 7.7 9.1 5.5 11.1 6.5 6.0 7.6 6.2 5.8 4.3 10.8 12.1 9.0Join a social fraternity or sorority 13.1 12.0 15.0 13.9 9.6 7.7 8.0 12.3 14.8 15.9 42.9 42.2 43.9Play club, intramural, or recreational sports 26.6 25.1 29.2 23.7 26.8 26.1 28.5 26.6 28.7 30.8 22.2 21.4 23.5Play intercollegiate athletics (eg NCAA or
NAIA-sponsored) 10.1 12.6 5.9 9.7 16.4 15.3 15.9 17.8 5.3 7.7 12.7 13.1 12.1Make at least a “B” average 67.6 67.1 68.5 65.0 69.8 70.6 70.4 68.7 67.1 73.6 72.9 72.7 73.1Need extra time to complete your degree
requirements 6.8 7.3 5.9 8.2 6.1 5.1 6.2 7.1 6.4 3.8 11.5 13.1 9.2Participate in student protests or demonstrations 6.6 6.4 7.0 5.8 7.2 8.7 6.4 6.1 6.5 8.8 11.6 10.1 13.7Transfer to another college before graduating 7.0 8.4 4.7 10.4 5.7 4.8 5.0 7.0 5.3 2.6 11.7 14.4 7.6Be satisfied with your college 60.0 57.7 63.8 53.1 63.5 64.5 61.7 63.4 62.1 69.8 52.1 44.8 62.5Participate in volunteer or community service work 39.6 36.6 44.7 31.2 43.4 40.5 43.7 46.1 40.7 59.1 47.4 39.0 59.3Seek personal counseling 10.0 9.9 10.1 10.2 9.5 9.8 9.7 9.1 10.4 9.0 16.6 16.2 17.1Communicate regularly with your professors 41.1 41.0 41.2 36.5 46.8 49.3 44.7 45.4 38.4 51.4 53.2 48.3 60.0Socialize with someone of another racial/ethnic group 69.3 67.0 73.3 64.4 70.3 73.1 66.5 69.4 71.4 79.8 62.6 58.6 68.3Participate in student clubs/groups 53.1 49.4 59.4 45.3 54.5 55.5 54.2 53.6 56.0 71.6 54.2 48.8 61.9Participate in a study abroad program 37.7 34.4 43.3 28.7 41.6 45.8 37.7 39.6 39.5 56.9 32.5 26.9 40.6Have a roommate of different race/ethnicity 31.4 29.9 33.8 28.4 31.8 35.3 27.2 30.8 31.2 43.3 20.9 22.0 19.3Discuss course content with students outside of class 51.7 48.1 57.8 43.4 54.0 57.8 50.2 52.3 55.2 67.2 44.1 37.0 54.1Work on a professor’s research project 32.7 34.0 30.6 33.9 34.0 34.3 34.0 33.8 29.6 34.1 51.2 48.9 54.5
Do you give the Higher Education ResearchInstitute (HERI) permission to include your IDnumber should your college request the data foradditional research analyses?
Yes 68.5 70.5 65.0 73.3 66.9 65.4 66.0 68.8 66.5 59.8 70.2 68.9 72.1No 31.5 29.5 35.0 26.7 33.1 34.6 34.0 31.2 33.5 40.2 29.8 31.1 27.9
2009 CIRP Freshman SurveyWeighted National Norms—Women
Baccalaureate Black Colleges All Bacc Institutions 4-year Colleges Universities and Universities
Institutions 4-yr Coll Universities Public Private Nonsec Catholic Oth Relig Public Private All HBCU Public Private
88

CIRP Construct: Habits of MindHigh Construct Score Group 27.8 26.3 30.2 24.2 28.9 31.1 27.9 27.4 27.8 39.5 32.2 29.0 36.8Average Construct Score Group 39.9 39.2 41.1 38.9 39.5 39.3 39.1 39.9 41.5 39.4 38.5 38.5 38.5Low Construct Score Group 32.4 34.6 28.7 36.9 31.5 29.6 33.1 32.7 30.8 21.1 29.3 32.5 24.8Mean Score 50.4 50.0 51.1 49.5 50.6 51.0 50.4 50.2 50.5 53.0 51.1 50.4 52.0
CIRP Construct: Academic Self-ConceptHigh Construct Score Group 19.8 16.2 25.7 14.2 18.8 19.4 16.8 19.2 22.8 36.5 26.3 24.4 29.0Average Construct Score Group 40.4 37.9 44.5 36.7 39.4 39.7 40.0 38.8 44.4 44.9 33.1 31.1 36.0Low Construct Score Group 39.8 45.9 29.8 49.1 41.8 40.9 43.1 42.0 32.8 18.6 40.5 44.4 35.0Mean Score 48.0 46.9 49.8 46.3 47.6 47.7 47.3 47.6 49.1 52.2 49.0 48.5 49.8
CIRP Construct: Social Self-ConceptHigh Construct Score Group 24.3 22.8 26.8 22.4 23.2 21.6 24.2 24.4 25.7 31.2 41.4 40.1 43.1Average Construct Score Group 38.5 37.7 39.8 37.7 37.7 37.7 38.0 37.5 39.7 40.0 35.9 36.7 34.7Low Construct Score Group 37.2 39.5 33.4 39.9 39.1 40.7 37.8 38.2 34.6 28.9 22.8 23.2 22.2Mean Score 48.3 47.8 49.0 47.7 47.9 47.4 48.3 48.2 48.7 50.1 52.2 52.0 52.5
CIRP Construct: Pluralistic OrientationHigh Construct Score Group 26.2 24.6 28.7 23.8 25.7 28.7 24.3 23.4 27.5 33.5 30.2 27.7 33.6Average Construct Score Group 36.6 35.7 38.1 35.6 35.9 36.4 36.1 35.4 37.9 38.9 34.0 33.5 34.6Low Construct Score Group 37.2 39.6 33.2 40.6 38.4 34.9 39.6 41.2 34.6 27.6 35.9 38.8 31.8Mean Score 49.6 49.2 50.4 48.9 49.4 50.2 49.2 48.8 50.1 51.6 50.1 49.4 51.1
CIRP Construct: Social AgencyHigh Construct Score Group 30.7 29.4 32.8 26.9 32.6 31.2 33.4 33.4 30.5 41.2 53.1 48.3 59.9Average Construct Score Group 40.9 40.7 41.3 41.3 39.9 39.2 41.6 39.7 42.0 38.9 34.1 37.2 29.7Low Construct Score Group 28.4 29.9 25.8 31.8 27.6 29.6 25.0 26.9 27.5 19.9 12.8 14.5 10.4Mean Score 49.1 48.8 49.6 48.3 49.4 49.1 49.8 49.6 49.1 51.4 54.3 53.4 55.5
CIRP Construct: College Reputation OrientationHigh Construct Score Group 35.4 31.7 41.6 27.0 37.7 38.5 43.4 34.0 38.9 51.8 42.2 31.6 57.0Average Construct Score Group 25.6 26.8 23.8 26.7 26.9 27.1 28.0 26.1 24.4 21.5 22.8 25.7 18.8Low Construct Score Group 38.9 41.6 34.6 46.4 35.4 34.4 28.7 40.0 36.7 26.6 35.0 42.6 24.2Mean Score 49.3 48.7 50.3 47.8 49.8 50.0 51.0 49.0 49.9 52.0 49.8 48.1 52.1
CIRP Construct: Likelihood of College InvolvementHigh Construct Score Group 36.1 32.2 42.7 26.9 39.0 40.4 36.9 38.8 38.4 58.1 40.5 33.4 50.6Average Construct Score Group 37.7 38.3 36.7 39.4 37.0 37.1 37.6 36.5 38.4 30.5 32.8 34.5 30.5Low Construct Score Group 26.2 29.4 20.6 33.7 24.0 22.5 25.5 24.6 23.2 11.4 26.6 32.1 18.9Mean Score 47.4 46.8 48.6 45.9 47.9 48.2 47.5 47.8 47.9 50.8 47.9 46.6 49.7
Note: CIRP Constructs are scored on a normal curve, a “Low” score represents students who are one-half standard deviation or more below the mean, a “High” score represents students who are one-half standard deviation or more above themean, and an “Average” score represents students whose scores are within one-half standard deviation of the mean.
2009 CIRP Freshman SurveyWeighted National Norms—Women
Baccalaureate Black Colleges All Bacc Institutions 4-year Colleges Universities and Universities
Institutions 4-yr Coll Universities Public Private Nonsec Catholic Oth Relig Public Private All HBCU Public Private
89


2009 National Norms
FirstTime FullTime FreshmenPublic UniversitiesPrivate Universities
Private Nonsectarian FourYear CollegesBy Selectivity Levels


First-time, Full-time Freshmen 10,237 15,037 36,942 10,311 10,856 15,581 3,117 4,956 8,982 13,401How old will you be on December 31 of this year?
17 or younger 1.9 1.1 2.1 2.0 1.7 2.2 1.6 1.4 1.6 1.618 68.0 62.7 70.2 72.4 68.7 67.8 65.2 70.6 65.6 66.319 28.8 35.5 27.1 25.2 28.7 28.9 29.2 26.0 31.2 30.120 or older 1.3 0.7 0.6 0.4 0.8 1.2 3.9 2.0 1.6 2.1
Is English your native language?Yes 84.3 96.4 86.5 88.8 91.7 85.6 94.6 92.1 91.6 89.9No 15.7 3.6 13.5 11.2 8.3 14.4 5.4 7.9 8.4 10.1
In what year did you graduate from high school?2009 98.4 99.1 99.4 99.3 99.0 98.1 96.0 97.6 98.0 96.72008 0.8 0.7 0.5 0.5 0.8 1.6 2.4 1.6 1.4 2.82007 or earlier 0.6 0.2 0.1 0.1 0.2 0.3 1.4 0.7 0.5 0.4Passed G.E.D./Never completed high school 0.1 0.1 0.0 0.0 0.0 0.0 0.2 0.1 0.1 0.1
How many miles is this college from yourpermanent home?
5 or less 4.5 2.5 2.0 5.8 2.6 1.4 3.6 7.0 3.5 1.66 to 10 3.4 3.9 2.7 7.2 3.8 1.8 5.3 8.3 4.0 1.111 to 50 30.0 20.7 19.0 28.4 12.5 7.6 22.2 27.2 19.6 7.151 to 100 26.4 26.0 12.6 14.7 11.1 5.7 18.6 16.4 15.8 8.9101 to 500 28.3 43.2 49.2 30.9 39.6 34.7 29.0 17.2 32.2 38.3Over 500 7.4 3.8 14.5 13.0 30.4 48.8 21.4 24.0 24.9 43.0
What was your average grade in high school?A or A+ 14.5 19.0 40.8 26.8 34.8 60.4 11.1 15.4 24.3 33.3A- 20.7 28.3 36.2 29.6 36.0 31.3 14.7 22.7 28.2 37.3B+ 24.0 25.6 15.1 21.2 19.2 6.8 22.2 25.0 22.8 19.9B 27.3 21.1 6.7 16.6 8.2 1.3 26.4 23.9 17.7 7.9B- 7.9 4.3 1.0 3.6 1.5 0.1 12.9 8.5 4.5 1.3C+ 4.0 1.2 0.2 1.6 0.2 0.0 8.7 3.2 1.9 0.2C 1.5 0.4 0.1 0.5 0.1 0.0 3.8 1.3 0.6 0.0D 0.0 0.0 0.0 0.0 0.0 0.0 0.2 0.1 0.0 0.0
From what kind of high school did you graduate?Public school (not charter or magnet) 86.9 84.3 78.6 69.8 62.4 54.7 77.6 74.6 71.8 58.2Public charter school 1.7 0.9 1.3 1.2 1.3 0.9 2.3 1.6 1.3 1.7Public magnet school 2.6 2.0 4.8 2.5 3.1 5.4 4.7 3.1 2.5 3.3Private religious/parochial school 6.4 9.7 9.2 19.4 20.2 15.8 8.4 13.2 11.7 8.3Private independent college-prep school 2.0 2.8 5.9 6.8 12.6 23.0 6.6 6.9 11.6 28.2Home school 0.3 0.4 0.2 0.2 0.4 0.2 0.5 0.6 1.1 0.4
Prior to this term, have you ever taken courses forcredit at this institution?
No 96.3 96.8 96.2 96.4 95.9 96.1 93.8 95.0 96.4 97.0Yes 3.7 3.2 3.8 3.6 4.1 3.9 6.2 5.0 3.6 3.0
2009 CIRP Freshman SurveyWeighted National Norms—Public/Private Universities and Nonsectarian 4-year Colleges by Selectivity
Public Universities Private Universities Private/Nonsectarian 4-year CollegesLow Medium High Medium High Very High Low Medium High Very High
93

Since leaving high school, have you ever takencourses, whether for credit or not for credit, atany other institution (university, 4- or 2-yearcollege, technical, vocational, or business school)?
No 87.5 89.3 87.2 89.0 88.0 90.3 89.7 89.5 89.1 90.1Yes 12.5 10.7 12.8 11.0 12.0 9.7 10.3 10.5 10.9 9.9
Where do you plan to live during the fall term?With my family or other relatives 11.8 6.7 3.7 16.8 4.9 0.5 11.7 21.0 8.7 0.7Other private home, apartment, or room 5.1 2.2 4.7 0.7 0.4 0.2 3.3 3.6 1.7 0.2College residence hall 76.4 87.6 87.3 81.3 93.6 97.7 83.2 72.4 86.7 97.6Fraternity or sorority house 4.2 1.0 0.1 0.1 0.1 0.1 0.0 0.0 1.6 0.0Other campus student housing 2.2 2.4 3.7 1.0 1.0 1.5 1.4 2.8 1.0 1.4Other 0.3 0.1 0.5 0.1 0.1 0.1 0.3 0.2 0.3 0.1
To how many colleges other than this one did youapply for admission this year?
None 18.0 19.5 9.0 5.5 8.1 10.4 12.7 9.7 13.0 14.3One 10.8 12.8 9.0 6.0 6.1 5.7 9.8 9.5 8.8 5.1Two 12.9 14.4 11.8 9.9 8.0 5.1 12.0 14.3 12.0 5.0Three 14.0 15.2 14.2 14.0 9.7 6.5 18.1 16.8 15.7 6.3Four 12.2 11.9 13.1 15.2 10.3 7.3 15.1 16.2 13.5 8.3Five 9.2 9.1 10.9 13.2 11.5 7.9 12.3 11.5 10.5 9.3Six 7.6 6.1 9.2 11.1 10.6 9.9 7.6 8.2 7.4 10.0Seven to ten 13.5 9.5 18.2 19.7 26.7 32.2 10.3 11.6 14.7 28.9Eleven or more 1.9 1.5 4.6 5.3 8.9 15.1 2.1 2.2 4.4 12.9
Were you accepted by your first choice college?Yes 67.8 85.8 74.8 75.6 68.6 66.8 83.6 83.2 82.5 69.6No 32.2 14.2 25.2 24.4 31.4 33.2 16.4 16.8 17.5 30.4
Is this college your:First choice? 51.5 66.2 63.0 56.6 57.3 62.3 61.1 64.1 66.3 61.7Second choice? 26.2 22.5 24.6 27.9 25.6 20.6 27.2 27.0 23.1 23.4Third choice? 12.5 7.1 8.4 9.9 10.6 10.4 7.8 6.4 7.2 9.5Less than third choice? 9.9 4.2 4.1 5.6 6.5 6.8 3.9 2.6 3.4 5.4
Citizenship status:U.S. citizen 96.3 98.4 94.6 96.6 95.9 89.3 95.7 94.3 94.4 92.5Permanent resident (green card) 2.8 1.3 3.6 2.6 1.8 3.9 1.3 1.9 2.0 1.7Neither 0.9 0.3 1.8 0.8 2.4 6.8 3.0 3.8 3.6 5.8
Are you a veteran?No 99.7 99.8 99.8 99.8 99.8 99.8 99.4 99.8 99.8 99.8Yes 0.3 0.2 0.2 0.2 0.2 0.2 0.6 0.2 0.2 0.2
Are your parents:Both alive and living with each other? 69.3 73.3 77.0 72.4 78.1 83.7 61.5 69.3 73.1 78.2Both alive, divorced or living apart? 26.9 23.6 19.9 23.7 19.0 13.9 34.3 26.9 23.3 19.0One or both deceased? 3.8 3.1 3.0 3.9 2.8 2.4 4.3 3.8 3.5 2.8
2009 CIRP Freshman SurveyWeighted National Norms—Public/Private Universities and Nonsectarian 4-year Colleges by Selectivity
Public Universities Private Universities Private/Nonsectarian 4-year CollegesLow Medium High Medium High Very High Low Medium High Very High
94

Have you had any special tutoring or remedialwork in any of the following subjects?
English 8.5 5.3 5.8 7.0 5.6 5.8 10.4 9.5 8.0 6.5Reading 7.7 5.2 4.6 6.0 4.5 4.6 9.6 8.2 6.9 5.3Mathematics 14.1 11.5 10.8 14.7 13.3 10.8 19.5 20.5 16.8 16.8Social Studies 5.8 3.5 3.3 4.3 3.1 3.0 6.3 5.2 4.4 3.1Science 6.5 4.8 5.0 6.7 5.4 5.6 9.0 7.5 7.1 7.0Foreign Language 6.9 4.6 4.4 5.9 4.9 4.8 8.2 7.0 6.9 6.0Writing 6.8 4.5 4.5 5.8 4.6 5.1 8.1 7.2 6.7 6.1
Do you feel you will need any special tutoring orremedial work in any of the following subjects?
English 12.3 6.7 7.0 6.7 5.6 4.9 12.4 10.8 9.3 7.2Reading 6.9 3.6 4.1 4.1 3.3 3.4 6.0 5.7 4.9 4.5Mathematics 29.6 22.3 17.2 20.3 14.5 10.7 28.6 24.3 19.9 16.6Social Studies 4.5 2.6 3.0 2.9 2.0 2.2 4.6 4.0 3.6 2.4Science 15.3 11.5 10.5 13.4 7.8 7.7 11.1 12.6 11.1 9.3Foreign Language 9.9 10.0 8.5 9.0 9.2 7.5 14.5 8.8 10.4 10.2Writing 14.8 8.2 9.3 10.3 7.7 8.5 16.6 13.9 12.9 13.3
How many Advanced Placement courses did youtake in high school?
Not offered at my high school 5.8 5.1 3.0 3.9 5.0 7.2 6.2 5.9 7.5 9.4None 24.5 30.6 5.8 19.0 7.8 2.0 46.2 37.5 21.5 5.41 to 4 53.7 55.2 46.2 56.9 51.5 27.2 41.4 49.1 56.3 47.15 to 9 15.0 8.5 39.1 18.7 32.0 52.0 5.3 6.9 13.4 34.710 to 14 0.9 0.5 5.5 1.3 3.2 10.8 0.4 0.5 1.1 3.215+ 0.1 0.1 0.4 0.1 0.5 0.8 0.5 0.1 0.2 0.3
How many Advanced Placement exams did youtake in high school?
Not offered at my high school 6.7 5.7 2.9 4.0 4.8 5.6 6.8 6.5 8.0 7.8None 34.3 40.2 8.8 26.1 12.6 3.4 53.4 46.1 29.8 8.91 to 4 46.8 47.6 48.1 54.1 53.7 32.1 34.6 41.8 51.2 50.35 to 9 11.6 6.2 35.6 14.8 26.7 48.7 4.5 5.3 10.1 30.610 to 14 0.5 0.3 4.4 0.9 2.0 9.7 0.2 0.2 0.8 2.315+ 0.1 0.0 0.2 0.1 0.1 0.6 0.4 0.1 0.1 0.2
What is the highest academic degree that youintend to obtain?—Highest Planned
None 0.9 0.6 0.3 0.4 0.4 0.3 2.0 1.3 0.8 0.4Vocational certificate 0.1 0.1 0.0 0.1 0.0 0.0 0.4 0.1 0.1 0.0Associate (A.A. or equivalent) 0.3 0.5 0.1 0.3 0.1 0.2 1.4 0.5 0.3 0.1Bachelor’s degree (B.A., B.S., etc.) 24.2 27.3 13.3 16.0 13.1 8.0 31.2 27.9 20.9 9.3Master’s degree (M.A., M.S., etc.) 38.9 45.0 40.4 41.1 38.7 34.1 36.9 43.7 44.1 40.7Ph.D. or Ed.D. 20.3 14.7 22.5 20.2 19.5 23.7 16.4 14.3 19.0 26.4M.D., D.O., D.D.S., or D.V.M. 10.7 7.6 16.7 12.7 17.0 21.1 5.2 6.8 8.8 12.9J.D. (Law) 3.2 3.3 5.4 6.7 9.7 11.5 4.4 3.4 4.3 8.6B.D. or M.DIV. (Divinity) 0.3 0.1 0.2 0.2 0.2 0.2 0.3 0.1 0.2 0.3Other 1.1 0.8 1.0 2.4 1.0 0.9 1.8 1.9 1.5 1.2
2009 CIRP Freshman SurveyWeighted National Norms—Public/Private Universities and Nonsectarian 4-year Colleges by Selectivity
Public Universities Private Universities Private/Nonsectarian 4-year CollegesLow Medium High Medium High Very High Low Medium High Very High
95

What is the highest academic degree that youintend to obtain?—Highest Planned at ThisCollege
None 1.3 0.7 0.4 0.8 0.4 0.3 1.6 0.9 0.8 0.4Vocational certificate 0.1 0.1 0.0 0.1 0.2 0.1 0.0 0.2 0.1 0.1Associate (A.A. or equivalent) 1.6 1.6 0.4 0.7 0.6 1.0 4.2 1.6 1.0 1.0Bachelor’s degree (B.A., B.S., etc.) 65.5 68.1 62.0 60.0 68.7 73.5 73.0 70.8 72.9 87.1Master’s degree (M.A., M.S., etc.) 21.7 23.5 24.5 24.5 19.7 15.2 16.4 20.0 19.3 8.9Ph.D. or Ed.D. 5.1 3.0 6.1 6.2 3.4 3.5 1.9 3.5 3.7 0.9M.D., D.O., D.D.S., or D.V.M. 2.2 2.0 4.6 3.1 4.1 4.1 0.7 0.4 0.5 0.4J.D. (Law) 0.7 0.3 1.2 2.1 2.1 1.8 0.6 1.0 0.2 0.4B.D. or M.DIV. (Divinity) 0.2 0.1 0.1 0.2 0.2 0.1 0.1 0.1 0.0 0.1Other 1.4 0.6 0.7 2.2 0.7 0.4 1.5 1.6 1.5 0.7
How would you describe the racial composition ofthe high school you last attended?
Completely non-White 5.8 0.5 3.3 2.7 2.2 3.2 4.5 1.9 2.1 2.9Mostly non-White 22.2 3.7 15.8 12.5 10.2 8.6 13.8 9.5 9.1 9.5Roughly half non-White 24.7 17.5 26.3 24.7 22.1 20.7 25.9 24.4 21.8 19.5Mostly White 41.8 66.2 48.6 52.4 57.9 60.5 49.5 56.0 57.9 60.6Completely White 5.5 12.1 6.0 7.7 7.6 7.0 6.4 8.2 9.1 7.4
How would you describe the racial composition ofthe neighborhood where you grew up?
Completely non-White 9.2 1.3 5.1 4.8 3.6 5.5 8.6 4.1 4.1 5.3Mostly non-White 19.4 4.0 12.1 12.2 9.6 8.0 13.0 9.7 8.3 8.5Roughly half non-White 17.0 7.9 14.8 15.6 12.4 12.2 14.5 14.9 11.6 10.8Mostly White 39.4 55.7 53.0 50.1 56.4 57.4 44.6 49.7 53.6 54.0Completely White 15.0 31.1 15.0 17.3 18.1 16.9 19.3 21.7 22.4 21.4
HOW MUCH OF YOUR FIRST YEAR’S EDUCATIONALEXPENSES (ROOM, BOARD, TUITION, AND FEES) DO YOU EXPECT TO COVER FROM:Family resources (parents, relatives, spouse, etc.)
None 22.3 17.0 16.3 16.5 11.9 8.7 25.7 19.4 17.7 9.9Less than $1,000 13.1 10.1 7.9 7.9 5.7 4.3 12.1 9.4 8.8 5.0$1,000–$2,999 15.3 12.4 10.4 10.3 7.4 5.5 13.1 11.7 11.4 6.4$3,000–$5,999 14.6 13.7 11.4 11.1 7.6 6.4 11.8 12.0 11.8 7.1$6,000–$9,999 11.4 13.5 10.8 11.0 8.4 6.6 11.0 10.5 11.7 7.3$10,000 + 23.3 33.3 43.2 43.3 59.1 68.6 26.3 37.1 38.5 64.3
My own resources (savings from work, work-study, other income)
None 30.3 26.7 38.7 33.9 39.9 38.9 39.6 37.7 33.6 36.4Less than $1,000 27.6 26.1 25.4 23.1 22.7 22.3 25.2 24.6 24.0 23.4$1,000–$2,999 27.4 28.6 23.4 24.5 23.1 25.4 21.7 22.0 25.1 27.6$3,000–$5,999 10.0 11.8 8.2 10.9 8.4 8.6 7.4 9.2 10.2 7.8$6,000–$9,999 2.7 3.9 2.4 3.6 2.6 2.2 2.4 3.1 3.5 2.1$10,000 + 1.9 3.0 1.9 3.9 3.2 2.6 3.6 3.4 3.5 2.6
2009 CIRP Freshman SurveyWeighted National Norms—Public/Private Universities and Nonsectarian 4-year Colleges by Selectivity
Public Universities Private Universities Private/Nonsectarian 4-year CollegesLow Medium High Medium High Very High Low Medium High Very High
96

HOW MUCH OF YOUR FIRST YEAR’S EDUCATIONALEXPENSES (ROOM, BOARD, TUITION, AND FEES) DO YOU EXPECT TO COVER FROM:Aid which need not be repaid (grants,scholarships, military funding, etc.)
None 31.5 29.3 34.5 15.7 23.0 41.7 25.2 24.3 18.2 37.7Less than $1,000 8.7 10.8 7.1 2.6 2.6 4.0 4.3 4.4 2.7 2.9$1,000–$2,999 13.6 19.0 14.6 5.8 5.9 7.6 9.0 10.3 5.7 5.6$3,000–$5,999 13.3 14.4 13.2 8.0 7.5 5.0 11.5 10.9 9.4 4.8$6,000–$9,999 12.4 11.5 10.5 11.7 8.6 3.4 12.8 16.2 13.3 6.0$10,000 + 20.4 15.0 20.1 56.1 52.4 38.2 37.2 33.9 50.7 43.0
Aid which must be repaid (loans, etc.)None 41.4 39.7 55.6 34.9 47.5 63.8 32.7 39.7 38.5 58.7Less than $1,000 4.2 3.7 3.3 2.3 2.0 2.1 3.6 2.6 2.2 2.1$1,000–$2,999 10.5 9.5 7.5 6.8 6.8 6.6 8.4 8.6 8.8 8.2$3,000–$5,999 19.4 19.9 14.7 17.5 16.9 12.6 15.2 16.6 17.2 13.8$6,000–$9,999 12.9 12.8 8.5 13.3 9.9 5.2 13.5 11.8 13.2 7.1$10,000 + 11.5 14.5 10.4 25.1 16.9 9.8 26.5 20.7 20.1 10.1
Other than aboveNone 93.0 94.1 94.4 92.1 92.6 94.3 91.7 92.4 93.4 95.0Less than $1,000 2.7 2.3 2.0 2.3 2.2 1.9 2.5 2.5 2.1 1.5$1,000–$2,999 1.7 1.2 1.3 1.4 1.6 1.1 1.3 1.7 1.5 1.0$3,000–$5,999 1.1 1.0 0.9 1.4 0.9 0.8 1.7 1.0 0.9 0.6$6,000–$9,999 0.7 0.5 0.4 0.7 0.7 0.3 0.9 0.8 0.6 0.4$10,000 + 0.7 0.8 0.9 2.1 2.0 1.4 1.8 1.6 1.4 1.4
What is your best estimate of your parents’ totalincome last year?
Less than $10,000 5.2 2.0 2.4 2.9 2.0 1.7 5.8 3.0 3.2 2.7$10,000 to $14,999 3.5 1.5 2.4 2.5 1.7 1.2 3.9 2.8 2.5 1.8$15,000 to $19,999 3.7 1.7 2.2 2.3 1.3 1.1 3.4 2.8 2.0 1.4$20,000 to $24,999 4.9 2.6 3.0 3.2 2.0 1.3 4.1 3.5 2.9 2.1$25,000 to $29,999 4.4 2.8 2.5 2.9 1.9 1.2 4.2 3.7 3.2 2.0$30,000 to $39,999 7.6 5.2 4.7 5.7 3.7 2.9 7.8 5.9 6.0 3.4$40,000 to $49,999 8.9 7.0 5.5 6.8 4.0 3.6 8.4 7.1 7.1 4.5$50,000 to $59,999 8.5 8.9 5.9 7.5 5.3 4.9 8.8 9.4 8.7 5.9$60,000 to $74,999 11.7 12.4 8.5 10.1 7.7 6.5 12.6 11.4 11.9 7.6$75,000 to $99,999 13.6 16.3 13.2 13.9 12.2 10.8 12.9 15.1 13.8 11.5$100,000 to $149,999 15.4 21.4 21.5 18.7 20.3 19.2 13.7 16.4 17.3 17.9$150,000 to $199,999 5.9 8.9 10.6 9.1 11.5 11.0 6.2 7.9 7.8 10.4$200,000 to $249,999 3.1 4.0 6.3 5.4 8.1 9.0 3.3 4.0 4.6 8.2$250,000 or more 3.6 5.1 11.1 8.7 18.2 25.4 4.9 6.9 9.0 20.5
Do you have any concern about your ability tofinance your college education?
None (I am confident that I will have sufficient funds) 24.5 32.7 35.2 26.9 36.5 40.9 30.8 31.6 31.8 41.2Some (but I probably will have enough funds) 59.5 58.9 55.4 58.6 52.6 51.6 53.9 56.9 56.8 51.5Major (not sure I will have enough funds to complete
college) 16.0 8.5 9.4 14.5 11.0 7.4 15.3 11.5 11.5 7.2
2009 CIRP Freshman SurveyWeighted National Norms—Public/Private Universities and Nonsectarian 4-year Colleges by Selectivity
Public Universities Private Universities Private/Nonsectarian 4-year CollegesLow Medium High Medium High Very High Low Medium High Very High
97

Your current religious preference:Baptist 6.8 5.6 6.6 3.6 11.4 3.4 16.8 4.6 7.4 1.8Buddhist 2.8 0.8 2.2 1.3 1.0 1.2 0.9 1.3 1.0 1.6Church of Christ 5.9 4.7 2.7 2.6 1.5 1.6 7.2 5.2 3.8 1.6Eastern Orthodox 0.5 0.6 0.8 1.3 0.9 1.0 0.4 0.8 0.8 0.6Episcopalian 0.4 1.1 1.8 1.1 2.0 2.4 1.1 1.0 1.7 3.6Hindu 1.0 0.4 2.0 2.2 1.0 2.7 0.3 0.4 1.0 0.9Jewish 0.5 2.6 4.9 2.4 5.2 9.2 1.6 3.0 2.8 9.0LDS (Mormon) 0.7 0.1 0.2 0.2 0.1 0.2 0.4 0.3 0.2 0.2Lutheran 8.8 6.4 2.6 3.1 2.3 1.6 1.6 2.8 3.0 2.1Methodist 2.3 5.6 5.5 2.7 3.7 2.9 3.7 3.7 5.0 2.3Muslim 1.1 0.4 1.7 2.5 1.1 1.6 0.7 0.8 1.2 1.0Presbyterian 2.4 1.7 4.5 2.9 3.0 4.3 1.3 2.9 3.2 3.7Quaker 0.1 0.2 0.2 0.2 0.2 0.2 0.2 0.3 0.2 0.6Roman Catholic 27.5 29.6 24.9 39.1 35.0 31.5 19.1 32.9 23.5 16.5Seventh Day Adventist 0.4 0.2 0.2 0.3 0.1 0.2 0.5 0.3 0.3 0.2United Church of Christ/Congregational 0.5 1.4 0.5 0.4 0.6 0.7 0.9 1.0 0.9 1.5Other Christian 13.6 10.9 10.1 10.3 9.2 6.9 13.2 10.7 14.1 6.8Other Religion 2.6 2.5 2.4 2.6 2.0 2.2 3.7 2.8 3.5 4.4None 22.0 25.0 26.3 20.9 19.8 26.2 26.5 25.3 26.5 41.6
Father’s current religious preference:Baptist 6.3 6.6 6.9 3.8 10.7 3.6 17.2 4.7 8.6 2.2Buddhist 4.6 1.0 3.8 2.3 1.6 2.3 1.2 1.0 1.4 2.2Church of Christ 5.9 5.1 2.9 2.6 1.8 1.7 7.9 5.9 4.2 2.0Eastern Orthodox 0.6 0.9 1.0 1.6 1.1 1.2 0.7 0.9 0.9 0.9Episcopalian 0.4 1.3 2.2 1.3 2.5 2.9 1.5 1.7 2.1 4.7Hindu 1.2 0.5 2.4 2.7 1.2 3.4 0.5 0.5 1.3 1.2Jewish 0.7 3.2 5.9 3.4 6.3 10.9 2.1 4.5 3.5 10.8LDS (Mormon) 1.0 0.2 0.2 0.2 0.2 0.2 0.3 0.3 0.2 0.2Lutheran 10.1 7.6 3.3 3.8 3.1 2.3 2.1 3.9 3.6 3.2Methodist 2.8 6.6 6.0 3.3 4.2 3.3 3.7 4.0 6.0 3.1Muslim 1.5 0.6 2.2 2.9 1.4 2.0 1.2 1.2 1.6 1.5Presbyterian 2.5 2.2 4.9 3.3 3.7 4.8 1.6 3.6 4.1 4.9Quaker 0.1 0.2 0.2 0.3 0.2 0.2 0.1 0.2 0.2 0.5Roman Catholic 30.7 33.6 28.3 42.0 37.5 33.0 23.5 36.5 28.0 21.1Seventh Day Adventist 0.4 0.2 0.3 0.4 0.2 0.3 0.4 0.4 0.3 0.2United Church of Christ/Congregational 0.4 1.4 0.6 0.5 0.6 0.7 1.0 0.9 1.0 1.8Other Christian 12.5 11.2 9.5 10.3 8.2 6.8 13.4 10.5 13.4 7.4Other Religion 2.3 1.8 1.9 1.8 1.7 1.5 2.5 2.0 2.3 3.2None 16.1 15.8 17.5 13.6 13.8 18.9 19.0 17.4 17.0 28.7
2009 CIRP Freshman SurveyWeighted National Norms—Public/Private Universities and Nonsectarian 4-year Colleges by Selectivity
Public Universities Private Universities Private/Nonsectarian 4-year CollegesLow Medium High Medium High Very High Low Medium High Very High
98

Mother’s current religious preference:Baptist 7.1 6.9 7.4 4.2 11.3 4.0 18.3 5.7 8.9 2.5Buddhist 4.8 1.1 4.2 2.4 1.5 2.4 1.1 1.5 1.6 2.1Church of Christ 6.3 5.6 3.3 3.0 2.0 2.0 8.6 6.4 4.8 2.3Eastern Orthodox 0.5 0.7 1.0 1.6 1.1 1.3 0.6 0.8 1.0 0.9Episcopalian 0.6 1.7 2.5 1.6 2.7 3.0 1.6 1.8 2.7 5.4Hindu 1.2 0.4 2.4 2.6 1.2 3.2 0.4 0.6 1.4 1.2Jewish 0.7 3.2 5.5 2.9 5.9 9.9 2.2 4.0 3.2 10.6LDS (Mormon) 1.0 0.2 0.2 0.3 0.2 0.2 0.4 0.2 0.3 0.3Lutheran 10.1 7.7 3.3 4.2 2.9 2.3 1.8 3.6 4.0 3.4Methodist 3.3 7.0 6.6 3.8 4.5 3.8 4.2 4.8 6.8 3.7Muslim 1.2 0.5 1.9 2.7 1.2 1.8 0.9 0.9 1.2 1.3Presbyterian 2.7 2.3 5.3 3.5 3.9 5.5 1.9 3.7 4.7 5.6Quaker 0.1 0.3 0.2 0.3 0.3 0.2 0.4 0.3 0.2 0.6Roman Catholic 32.4 35.3 30.4 44.7 40.6 36.1 24.7 38.7 29.2 22.4Seventh Day Adventist 0.5 0.2 0.3 0.5 0.1 0.2 0.4 0.5 0.4 0.3United Church of Christ/Congregational 0.5 1.8 0.7 0.5 0.7 0.9 1.3 1.1 1.1 2.3Other Christian 13.4 12.1 10.4 11.1 8.9 7.4 14.6 11.8 14.3 8.9Other Religion 2.4 2.1 2.1 1.8 1.8 1.8 2.9 2.1 2.3 3.7None 11.0 11.0 12.3 8.3 9.2 13.9 13.7 11.6 12.0 22.5
For the activities below, indicate which ones you“frequently” or “occasionally” did during the past year:
Attended a religious service 73.0 72.3 72.9 77.0 80.3 75.1 66.5 67.1 72.1 62.8Was bored in class* 34.0 45.0 40.2 44.1 35.1 36.9 37.4 38.7 38.4 34.3Participated in political demonstrations 26.2 25.0 27.1 27.8 29.8 27.7 27.9 23.0 26.1 34.4Tutored another student 54.1 46.3 69.4 60.9 65.9 78.0 42.3 44.1 53.9 63.5Studied with other students 88.0 88.0 90.5 87.3 91.2 92.1 82.5 83.3 86.8 92.0Was a guest in a teacher’s home 17.5 19.0 20.0 17.8 23.5 27.4 20.6 18.0 25.0 31.5Smoked cigarettes* 3.8 5.2 2.2 4.3 2.8 1.4 6.2 6.4 4.8 2.9Drank beer 30.0 49.0 38.4 43.6 42.6 45.0 40.7 49.0 42.4 56.0Drank wine or liquor 34.2 51.8 42.8 50.2 46.1 49.0 48.3 53.5 47.7 60.8Felt overwhelmed by all I had to do* 24.7 26.7 25.3 30.0 27.1 26.0 27.8 28.1 30.1 30.3Felt depressed* 5.8 5.5 4.7 6.9 5.1 4.7 6.8 7.1 7.9 6.7Performed volunteer work 82.7 83.2 92.2 88.7 93.1 94.7 80.0 80.8 86.7 91.9Played a musical instrument 44.2 42.4 50.0 45.9 50.2 55.2 37.7 39.4 45.6 52.3Asked a teacher for advice after class* 26.5 23.4 28.7 27.4 32.2 32.1 27.3 25.4 29.8 35.4Voted in a student election* 21.6 17.6 23.7 22.2 27.7 27.7 20.3 20.1 21.5 25.6Socialized with someone of another racial/ethnic
group* 68.3 59.4 73.9 72.4 74.1 75.0 69.1 68.3 67.8 72.0Came late to class 56.6 56.5 58.5 58.5 56.3 59.5 58.0 56.8 54.5 61.6Used the Internet:
For research or homework* 77.4 75.7 82.9 80.7 85.5 88.4 72.5 74.9 78.3 86.3To read news sites* 44.7 40.9 49.1 48.1 53.3 59.0 41.9 43.4 42.7 51.9To read blogs* 26.8 22.5 27.2 28.5 26.4 26.9 26.8 27.6 25.1 24.5To blog* 15.5 12.0 13.6 15.5 12.4 10.2 15.1 15.9 13.9 9.4
*responses for “frequently” only
2009 CIRP Freshman SurveyWeighted National Norms—Public/Private Universities and Nonsectarian 4-year Colleges by Selectivity
Public Universities Private Universities Private/Nonsectarian 4-year CollegesLow Medium High Medium High Very High Low Medium High Very High
99

For the activities below, indicate which ones you“frequently” or “occasionally” did during the past year:
Performed community service as part of a class 57.4 56.9 60.7 63.4 64.8 60.7 55.8 58.8 61.8 60.0Discussed religion* 26.3 26.4 32.1 32.7 41.8 37.4 24.4 23.8 32.6 35.4Discussed politics* 29.8 33.3 39.5 37.1 45.9 47.4 26.7 27.6 33.8 49.1Skipped school/class* 2.1 1.9 2.6 3.2 2.3 2.1 3.2 2.7 2.7 2.6
*responses for “frequently” onlyStudent rated self as “Highest 10%” or “AboveAverage” as compared with the average persontheir age:
Academic ability 64.3 73.6 88.2 78.7 87.4 95.3 53.0 59.1 72.1 87.6Artistic ability 27.4 27.1 30.5 29.8 31.8 32.5 38.7 36.7 35.2 36.7Computer skills 41.1 40.8 43.3 42.6 41.7 43.8 41.2 38.4 38.4 33.1Cooperativeness 73.5 74.7 77.4 76.4 77.7 78.4 70.0 71.9 74.6 75.3Creativity 53.3 54.9 56.3 56.6 60.0 59.3 62.3 59.2 60.7 62.8Drive to achieve 73.9 73.0 82.7 78.0 82.1 90.0 71.1 72.8 76.7 81.1Emotional health 54.9 54.4 62.0 55.7 61.2 65.4 50.1 50.9 52.9 55.7Leadership ability 58.4 61.7 65.6 63.1 69.1 74.0 56.9 56.5 59.7 65.5Mathematical ability 41.4 46.5 62.2 51.3 53.8 71.7 30.9 34.7 43.6 51.0Physical health 53.9 56.4 60.5 54.8 59.5 63.8 49.9 52.8 54.7 59.9Popularity 36.4 39.2 40.9 39.0 43.2 48.0 37.7 37.3 36.3 40.0Public speaking ability 34.6 35.5 41.4 39.3 47.3 54.8 32.6 32.5 35.8 46.8Self-confidence (intellectual) 57.8 58.6 68.2 62.6 69.2 77.6 54.7 52.7 58.7 67.3Self-confidence (social) 53.2 51.0 53.5 52.0 54.4 56.4 50.2 48.4 48.4 49.3Self-understanding 58.2 54.7 62.8 60.1 63.9 68.1 56.5 53.9 59.5 64.5Spirituality 38.6 30.6 37.9 37.7 44.2 40.7 35.4 32.2 38.3 30.9Understanding of others 67.2 64.0 70.0 69.4 72.7 73.0 65.4 65.3 68.0 70.7Writing ability 40.2 45.5 52.0 50.0 58.2 64.9 40.4 42.8 45.8 61.5Ability to see the world from someone else’s
perspective 65.5 64.1 72.5 70.5 74.0 78.0 61.1 62.7 67.8 76.6Tolerance of others with different beliefs 72.7 72.7 80.5 78.4 79.8 84.7 68.5 71.3 76.9 84.2Openness to having my own views challenged 58.8 56.9 63.2 61.8 63.1 69.6 56.0 57.1 61.1 68.0Ability to discuss and negotiate controversial issues 62.1 62.4 69.4 68.2 71.3 76.7 59.3 59.7 64.9 74.0Ability to work cooperatively with diverse people 78.0 77.6 83.7 82.6 83.5 86.7 73.3 77.0 79.3 84.8
What is the highest level of formal educationobtained by your father?
Grammar school or less 7.9 1.9 3.3 3.5 2.4 1.1 4.2 3.6 2.8 1.6Some high school 7.3 3.1 3.9 5.0 2.6 1.5 6.4 5.4 3.7 2.1High school graduate 19.7 18.8 11.9 17.0 9.0 5.4 26.1 23.9 16.9 6.5Postsecondary school other than college 3.4 3.5 2.2 3.1 2.1 1.6 3.4 3.7 3.4 1.5Some college 16.3 14.6 11.7 14.7 10.9 6.7 15.9 14.8 14.1 8.3College degree 26.6 34.9 31.2 29.7 31.9 26.6 27.2 28.4 29.6 27.2Some graduate school 1.6 2.0 3.0 2.2 3.1 3.4 1.5 1.6 2.5 3.6Graduate degree 17.2 21.2 32.9 24.7 38.1 53.7 15.3 18.5 27.0 49.0
2009 CIRP Freshman SurveyWeighted National Norms—Public/Private Universities and Nonsectarian 4-year Colleges by Selectivity
Public Universities Private Universities Private/Nonsectarian 4-year CollegesLow Medium High Medium High Very High Low Medium High Very High
100
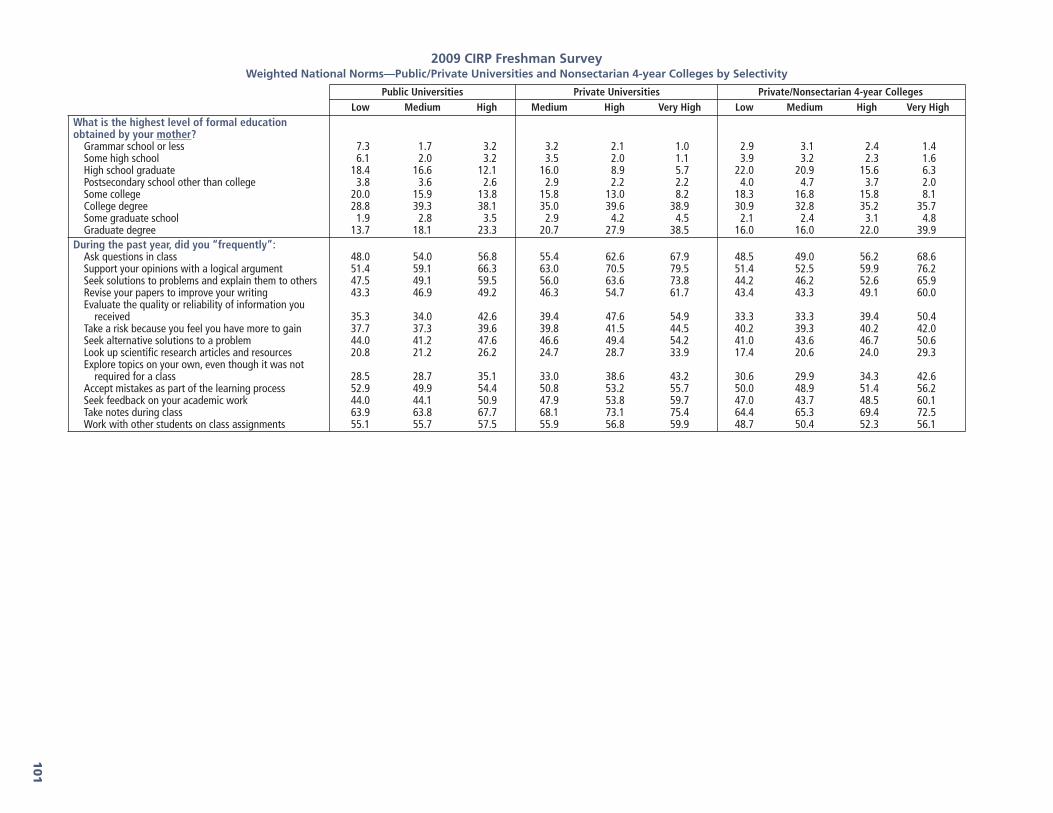
What is the highest level of formal educationobtained by your mother?
Grammar school or less 7.3 1.7 3.2 3.2 2.1 1.0 2.9 3.1 2.4 1.4Some high school 6.1 2.0 3.2 3.5 2.0 1.1 3.9 3.2 2.3 1.6High school graduate 18.4 16.6 12.1 16.0 8.9 5.7 22.0 20.9 15.6 6.3Postsecondary school other than college 3.8 3.6 2.6 2.9 2.2 2.2 4.0 4.7 3.7 2.0Some college 20.0 15.9 13.8 15.8 13.0 8.2 18.3 16.8 15.8 8.1College degree 28.8 39.3 38.1 35.0 39.6 38.9 30.9 32.8 35.2 35.7Some graduate school 1.9 2.8 3.5 2.9 4.2 4.5 2.1 2.4 3.1 4.8Graduate degree 13.7 18.1 23.3 20.7 27.9 38.5 16.0 16.0 22.0 39.9
During the past year, did you “frequently”:Ask questions in class 48.0 54.0 56.8 55.4 62.6 67.9 48.5 49.0 56.2 68.6Support your opinions with a logical argument 51.4 59.1 66.3 63.0 70.5 79.5 51.4 52.5 59.9 76.2Seek solutions to problems and explain them to others 47.5 49.1 59.5 56.0 63.6 73.8 44.2 46.2 52.6 65.9Revise your papers to improve your writing 43.3 46.9 49.2 46.3 54.7 61.7 43.4 43.3 49.1 60.0Evaluate the quality or reliability of information you
received 35.3 34.0 42.6 39.4 47.6 54.9 33.3 33.3 39.4 50.4Take a risk because you feel you have more to gain 37.7 37.3 39.6 39.8 41.5 44.5 40.2 39.3 40.2 42.0Seek alternative solutions to a problem 44.0 41.2 47.6 46.6 49.4 54.2 41.0 43.6 46.7 50.6Look up scientific research articles and resources 20.8 21.2 26.2 24.7 28.7 33.9 17.4 20.6 24.0 29.3Explore topics on your own, even though it was not
required for a class 28.5 28.7 35.1 33.0 38.6 43.2 30.6 29.9 34.3 42.6Accept mistakes as part of the learning process 52.9 49.9 54.4 50.8 53.2 55.7 50.0 48.9 51.4 56.2Seek feedback on your academic work 44.0 44.1 50.9 47.9 53.8 59.7 47.0 43.7 48.5 60.1Take notes during class 63.9 63.8 67.7 68.1 73.1 75.4 64.4 65.3 69.4 72.5Work with other students on class assignments 55.1 55.7 57.5 55.9 56.8 59.9 48.7 50.4 52.3 56.1
2009 CIRP Freshman SurveyWeighted National Norms—Public/Private Universities and Nonsectarian 4-year Colleges by Selectivity
Public Universities Private Universities Private/Nonsectarian 4-year CollegesLow Medium High Medium High Very High Low Medium High Very High
101

Your probable career occupation:Accountant or actuary 3.4 2.2 1.9 2.6 2.2 1.2 2.3 2.5 3.2 0.7Actor or entertainer 0.8 0.8 0.9 1.3 1.3 1.0 1.1 3.1 1.7 1.0Architect or urban planner 0.9 1.0 1.4 0.7 0.8 1.0 0.5 0.4 1.5 0.9Artist 1.5 1.5 1.0 1.5 0.8 0.5 16.7 14.1 9.6 3.0Business (clerical) 0.6 0.7 0.5 0.6 0.5 0.4 0.9 0.7 0.6 0.3Business executive (management, administrator) 6.5 7.2 6.7 7.5 9.2 11.8 7.4 5.7 6.3 7.4Business owner or proprietor 3.0 2.5 2.1 2.5 2.9 2.6 4.1 3.4 2.8 2.4Business salesperson or buyer 0.9 1.2 0.6 0.8 0.7 0.3 1.0 0.7 0.6 0.4Clergy (minister, priest) 0.0 0.0 0.0 0.1 0.2 0.1 0.1 0.1 0.1 0.1Clergy (other religious) 0.0 0.0 0.0 0.0 0.2 0.1 0.1 0.0 0.1 0.0Clinical psychologist 1.4 1.1 1.1 1.4 1.4 0.9 1.5 1.2 1.2 1.6College administrator/staff 0.0 0.1 0.0 0.0 0.0 0.1 0.1 0.0 0.1 0.1College teacher 0.3 0.4 0.5 0.2 0.6 1.0 0.4 0.2 0.6 1.4Computer programmer or analyst 1.9 2.0 2.1 1.8 1.0 0.8 2.3 0.9 1.5 0.7Conservationist or forester 0.3 0.5 0.3 0.1 0.1 0.2 0.3 0.5 0.4 0.7Dentist (including orthodontist) 1.7 1.1 1.6 1.8 1.7 0.8 0.7 0.6 0.7 0.6Dietitian or nutritionist 0.7 1.0 0.6 0.3 0.2 0.2 0.3 0.2 0.2 0.2Engineer 8.8 14.2 15.7 12.1 6.3 9.9 1.5 3.0 7.7 3.5Farmer or rancher 0.2 0.8 0.2 0.1 0.2 0.3 0.0 0.7 0.2 0.3Foreign service worker (including diplomat) 0.3 0.6 0.9 0.9 2.8 2.7 0.4 0.4 1.1 3.4Homemaker (full-time) 0.0 0.0 0.1 0.1 0.1 0.0 0.0 0.0 0.1 0.1Interior decorator (including designer) 0.2 0.4 0.3 0.4 0.1 0.1 1.4 0.3 1.0 0.1Lab technician or hygienist 0.3 0.2 0.1 0.1 0.1 0.1 0.0 0.2 0.2 0.1Law enforcement officer 1.0 0.7 0.2 0.6 0.2 0.1 2.2 1.8 0.5 0.2Lawyer (attorney) or judge 3.5 2.6 4.5 5.4 7.4 7.7 4.0 2.6 3.1 5.9Military service (career) 0.9 0.7 0.7 0.8 0.9 0.3 0.4 1.1 0.4 0.2Musician (performer, composer) 1.3 1.3 0.9 1.4 1.1 0.7 1.2 0.5 1.3 1.3Nurse 6.6 3.0 2.1 3.1 2.5 1.2 2.5 6.0 1.7 0.3Optometrist 0.6 0.2 0.5 0.4 0.2 0.2 0.1 0.3 0.3 0.1Pharmacist 2.6 0.9 2.6 6.4 1.2 0.3 0.5 3.5 4.0 0.4Physician 7.8 4.4 12.5 9.1 13.7 17.1 2.8 2.8 5.2 9.0Policymaker/Government 0.8 0.8 1.3 1.0 2.8 3.2 0.4 0.4 0.9 2.8School counselor 0.5 0.3 0.1 0.2 0.1 0.1 0.3 0.3 0.3 0.2School principal or superintendent 0.0 0.0 0.0 0.1 0.0 0.0 0.1 0.0 0.0 0.0Scientific researcher 1.5 2.2 3.2 1.5 2.7 4.3 0.8 2.4 2.3 5.0Social, welfare, or recreation worker 1.4 0.8 0.6 0.5 0.6 0.3 1.0 0.8 0.7 0.8Therapist (physical, occupational, speech) 4.0 4.0 2.2 2.5 1.7 0.5 3.1 1.7 3.1 1.4Teacher or administrator (elementary) 2.4 2.6 1.2 2.1 1.2 0.6 3.5 3.2 2.7 1.0Teacher or administrator (secondary) 3.7 3.6 2.0 2.1 1.7 1.1 3.1 3.5 3.1 2.8Veterinarian 1.0 2.4 1.1 0.6 0.5 0.8 0.7 2.8 1.7 0.7Writer or journalist 1.8 4.0 2.1 2.6 3.5 3.4 2.0 2.7 2.5 4.5Skilled trades 0.3 0.2 0.1 0.2 0.2 0.2 0.3 0.3 0.2 0.1Laborer (unskilled) 0.2 0.5 0.3 0.2 0.1 0.0 0.3 0.3 0.2 0.1Semi-skilled worker 0.2 0.3 0.2 0.1 0.2 0.1 0.2 0.1 0.2 0.2Unemployed 1.6 0.7 1.2 1.4 1.1 0.7 2.2 1.7 1.3 0.7Other 9.5 8.9 6.4 9.1 6.5 3.4 13.9 11.3 9.0 5.4Undecided 13.1 15.2 15.5 11.8 16.6 17.5 11.4 10.6 13.9 28.1
2009 CIRP Freshman SurveyWeighted National Norms—Public/Private Universities and Nonsectarian 4-year Colleges by Selectivity
Public Universities Private Universities Private/Nonsectarian 4-year CollegesLow Medium High Medium High Very High Low Medium High Very High
102

Your father’s occupation:Accountant or actuary 2.6 3.2 3.3 3.5 4.0 3.6 1.8 2.4 2.7 2.5Actor or entertainer 0.1 0.0 0.1 0.2 0.1 0.1 0.4 0.1 0.1 0.1Architect or urban planner 0.9 1.1 1.2 1.1 1.1 1.1 0.9 1.1 1.3 1.6Artist 0.3 0.3 0.3 0.3 0.3 0.3 1.0 1.1 0.9 1.0Business (clerical) 1.6 1.4 1.3 1.3 1.2 1.2 2.0 1.7 1.5 1.2Business executive (management, administrator) 8.1 12.0 12.6 11.1 15.8 17.9 8.6 10.4 12.2 15.5Business owner or proprietor 8.5 7.9 9.1 9.9 10.7 9.6 9.2 11.2 9.9 9.1Business salesperson or buyer 4.5 5.9 4.6 4.7 4.3 4.1 4.1 4.7 4.3 3.5Clergy (minister, priest) 0.5 0.4 0.5 0.4 0.8 0.6 0.7 0.3 0.6 0.5Clergy (other religious) 0.1 0.0 0.1 0.1 0.1 0.1 0.1 0.1 0.2 0.1Clinical psychologist 0.1 0.1 0.2 0.1 0.2 0.3 0.1 0.1 0.1 0.4College administrator/staff 0.2 0.3 0.3 0.4 0.4 0.5 0.4 0.2 0.4 0.7College teacher 0.4 0.5 0.9 0.6 0.9 2.0 0.6 0.4 0.7 2.5Computer programmer or analyst 3.6 4.4 4.2 3.5 3.4 4.0 3.2 3.0 3.5 4.0Conservationist or forester 0.2 0.1 0.1 0.1 0.1 0.1 0.3 0.1 0.1 0.4Dentist (including orthodontist) 0.5 0.5 0.8 0.9 1.2 1.1 0.3 0.4 0.5 0.7Dietitian or nutritionist 0.1 0.1 0.1 0.1 0.1 0.1 0.2 0.2 0.1 0.1Engineer 8.8 10.1 12.1 8.7 8.3 9.0 7.0 6.2 8.8 6.1Farmer or rancher 2.1 3.0 0.5 0.6 0.7 0.4 0.7 0.6 0.8 0.6Foreign service worker (including diplomat) 0.0 0.0 0.1 0.1 0.2 0.2 0.1 0.2 0.1 0.3Homemaker (full-time) 0.3 0.3 0.3 0.2 0.3 0.2 0.6 0.3 0.3 0.3Interior decorator (including designer) 0.0 0.0 0.0 0.1 0.1 0.0 0.0 0.0 0.0 0.1Lab technician or hygienist 0.5 0.3 0.3 0.3 0.3 0.2 0.3 0.2 0.3 0.1Law enforcement officer 1.7 1.5 1.1 1.8 1.1 0.7 2.2 2.6 1.4 0.6Lawyer (attorney) or judge 1.2 1.8 3.5 2.3 5.6 7.5 1.4 1.9 2.6 8.0Military service (career) 1.3 1.2 1.5 0.9 1.1 0.6 2.1 1.7 1.1 0.5Musician (performer, composer) 0.1 0.2 0.2 0.2 0.2 0.2 0.3 0.3 0.4 0.4Nurse 0.8 0.6 0.5 0.4 0.3 0.3 0.5 0.7 0.5 0.3Optometrist 0.1 0.1 0.2 0.1 0.2 0.1 0.1 0.1 0.1 0.1Pharmacist 0.6 0.4 0.5 0.7 0.4 0.4 0.1 0.4 0.7 0.3Physician 1.2 1.5 3.9 3.1 5.5 9.3 0.8 1.4 2.4 7.0Policymaker/Government 0.5 0.6 0.8 0.7 0.8 0.8 0.9 0.8 0.9 1.1School counselor 0.1 0.1 0.1 0.0 0.1 0.0 0.1 0.0 0.1 0.1School principal or superintendent 0.1 0.2 0.1 0.2 0.2 0.2 0.2 0.1 0.2 0.2Scientific researcher 0.6 0.7 1.3 0.8 1.2 2.4 0.5 0.6 0.7 2.1Social, welfare, or recreation worker 0.4 0.5 0.4 0.6 0.5 0.4 0.5 0.6 0.6 0.6Therapist (physical, occupational, speech) 0.3 0.3 0.3 0.4 0.4 0.2 0.4 0.3 0.3 0.4Teacher or administrator (elementary) 0.7 0.7 0.6 0.7 0.6 0.5 0.3 0.7 0.9 0.8Teacher or administrator (secondary) 1.4 1.9 1.7 1.6 1.5 1.6 1.6 1.5 2.1 2.3Veterinarian 0.2 0.3 0.2 0.1 0.1 0.2 0.1 0.2 0.2 0.2Writer or journalist 0.2 0.3 0.4 0.4 0.6 0.7 0.2 0.4 0.4 1.1Skilled trades 5.8 7.2 4.8 6.8 4.3 3.0 8.4 7.8 7.1 3.5Laborer (unskilled) 4.7 3.0 2.3 2.7 1.5 1.1 3.1 3.0 2.6 1.1Semi-skilled worker 4.5 2.8 2.4 2.6 1.6 1.3 2.4 2.8 2.3 1.6Unemployed 5.5 3.7 3.6 4.1 2.8 2.4 5.8 4.5 4.0 3.1Other 24.5 18.8 16.4 20.7 14.9 9.4 25.5 22.4 19.1 12.9
2009 CIRP Freshman SurveyWeighted National Norms—Public/Private Universities and Nonsectarian 4-year Colleges by Selectivity
Public Universities Private Universities Private/Nonsectarian 4-year CollegesLow Medium High Medium High Very High Low Medium High Very High
103

Your mother’s occupation:Accountant or actuary 5.8 5.6 5.8 4.9 4.5 4.8 5.6 4.8 4.5 3.8Actor or entertainer 0.0 0.0 0.0 0.1 0.1 0.1 0.1 0.1 0.1 0.1Architect or urban planner 0.2 0.2 0.4 0.2 0.3 0.5 0.2 0.2 0.4 0.7Artist 0.4 0.7 0.7 0.5 0.8 0.9 1.3 1.2 1.6 1.8Business (clerical) 3.9 4.3 3.4 4.1 4.0 2.9 4.0 4.5 3.4 2.3Business executive (management, administrator) 5.1 5.7 5.7 6.1 6.9 6.1 6.3 5.5 6.2 6.4Business owner or proprietor 3.3 2.8 3.4 3.5 3.9 3.3 3.5 3.7 3.7 3.0Business salesperson or buyer 2.3 2.9 2.2 2.3 1.9 1.9 2.1 2.6 2.3 1.9Clergy (minister, priest) 0.1 0.1 0.1 0.1 0.1 0.1 0.1 0.1 0.2 0.2Clergy (other religious) 0.0 0.1 0.1 0.1 0.1 0.1 0.1 0.1 0.1 0.2Clinical psychologist 0.1 0.2 0.2 0.1 0.3 0.4 0.1 0.2 0.2 0.6College administrator/staff 0.5 0.6 0.5 0.6 0.7 0.8 0.7 0.8 0.7 1.1College teacher 0.3 0.4 0.6 0.4 0.9 1.4 0.2 0.5 0.7 1.9Computer programmer or analyst 1.1 1.6 2.0 1.5 1.5 2.4 1.5 1.0 1.3 1.5Conservationist or forester 0.0 0.1 0.1 0.0 0.1 0.1 0.1 0.0 0.1 0.2Dentist (including orthodontist) 0.6 0.6 0.6 0.6 0.6 0.7 0.5 0.6 0.4 0.4Dietitian or nutritionist 0.4 0.5 0.4 0.3 0.3 0.4 0.3 0.2 0.4 0.4Engineer 1.0 0.9 1.9 1.0 1.2 1.8 0.6 0.5 0.9 1.0Farmer or rancher 0.2 0.3 0.1 0.1 0.1 0.1 0.2 0.2 0.2 0.2Foreign service worker (including diplomat) 0.0 0.1 0.1 0.1 0.1 0.1 0.2 0.0 0.1 0.2Homemaker (full-time) 7.1 6.1 10.8 9.4 12.8 17.3 3.9 6.3 8.4 12.3Interior decorator (including designer) 0.3 0.4 0.5 0.4 0.6 0.6 0.3 0.6 0.8 0.7Lab technician or hygienist 0.8 0.8 0.8 0.9 0.7 0.7 0.5 1.0 0.7 0.4Law enforcement officer 0.4 0.2 0.2 0.2 0.2 0.1 0.3 0.3 0.3 0.2Lawyer (attorney) or judge 0.5 0.7 1.5 1.1 2.6 3.7 0.7 0.6 1.0 4.4Military service (career) 0.1 0.2 0.2 0.2 0.1 0.0 0.3 0.2 0.2 0.0Musician (performer, composer) 0.1 0.1 0.2 0.1 0.3 0.3 0.2 0.2 0.2 0.4Nurse 7.9 9.8 7.0 8.3 7.2 5.8 8.9 8.9 7.4 5.1Optometrist 0.1 0.1 0.2 0.1 0.1 0.1 0.3 0.3 0.2 0.1Pharmacist 0.5 0.5 0.7 0.9 0.6 0.8 0.6 0.6 0.5 0.4Physician 0.6 0.7 1.5 1.4 2.1 4.0 0.5 0.4 1.1 3.4Policymaker/Government 0.5 0.4 0.5 0.5 0.5 0.5 0.6 0.7 0.6 0.7School counselor 0.2 0.3 0.3 0.3 0.4 0.4 0.4 0.5 0.4 0.4School principal or superintendent 0.1 0.2 0.2 0.2 0.3 0.2 0.2 0.2 0.3 0.3Scientific researcher 0.3 0.5 0.7 0.5 0.7 1.8 0.3 0.3 0.4 1.0Social, welfare, or recreation worker 1.6 1.7 1.6 1.8 1.7 1.6 1.6 1.7 1.8 2.3Therapist (physical, occupational, speech) 1.1 1.9 1.8 1.8 1.7 1.6 1.4 1.7 1.8 2.2Teacher or administrator (elementary) 6.1 9.3 7.5 7.5 7.3 5.9 8.1 7.0 7.6 7.1Teacher or administrator (secondary) 2.8 4.3 4.0 3.5 4.7 3.7 4.4 3.3 4.3 4.5Veterinarian 0.1 0.1 0.1 0.1 0.1 0.2 0.1 0.1 0.2 0.2Writer or journalist 0.2 0.4 0.5 0.3 0.8 1.2 0.3 0.5 0.5 1.5Skilled trades 1.5 1.3 1.4 1.3 0.9 0.9 1.2 1.2 1.4 0.8Laborer (unskilled) 2.9 1.4 1.5 1.5 0.7 0.7 1.5 1.3 1.4 0.8Semi-skilled worker 2.7 2.0 1.9 1.7 1.0 1.0 1.2 1.3 1.5 0.9Unemployed 9.5 6.3 7.6 7.9 7.3 6.8 8.7 8.1 7.6 6.7Other 26.3 22.7 18.3 21.5 16.0 11.5 25.5 25.9 21.7 15.4
2009 CIRP Freshman SurveyWeighted National Norms—Public/Private Universities and Nonsectarian 4-year Colleges by Selectivity
Public Universities Private Universities Private/Nonsectarian 4-year CollegesLow Medium High Medium High Very High Low Medium High Very High
104

Race/Ethnicity—mark all that apply(total may add to more than 100%)American Indian/Alaska Native 2.1 1.8 1.4 1.7 1.7 1.2 3.0 2.3 2.8 1.9Asian American/Asian 17.7 4.4 20.9 15.0 11.3 22.8 3.6 7.6 7.9 12.9Native Hawaiian/Pacific Islander 2.1 0.4 1.1 1.6 1.0 0.6 1.0 0.8 0.7 0.8African American/Black 11.1 4.4 4.4 9.1 5.7 6.7 25.9 8.6 7.1 5.3Mexican American/Chicano 14.0 1.0 5.8 4.3 5.4 2.7 1.9 1.2 2.7 2.7Puerto Rican 1.0 0.7 1.0 2.3 1.4 1.5 2.0 2.8 1.6 1.0Other Latino 4.4 1.5 4.4 5.1 4.7 5.1 3.8 5.0 3.9 4.1White/Caucasian 56.1 90.7 67.7 68.3 76.2 67.0 67.8 78.9 81.7 79.7Other 3.2 1.8 3.5 4.5 3.7 3.2 3.8 4.4 3.6 4.4
Student “agree strongly” or “agree somewhat”:There is too much concern in the courts for the rights of
criminals 57.5 54.2 52.4 52.9 50.0 45.8 53.4 58.5 54.8 37.4Abortion should be legal 55.7 63.2 65.0 62.4 57.7 69.3 63.4 62.5 60.5 82.6Marijuana should be legalized 40.0 51.9 47.7 46.5 44.5 49.7 50.7 48.4 47.0 61.9Racial discrimination is no longer a major problem
in America 21.7 24.3 22.9 21.3 22.1 21.4 22.7 23.8 21.5 15.7Realistically, an individual can do little to bring about
changes in our society 29.3 26.1 23.5 25.4 20.7 21.6 33.5 29.9 26.2 21.3Same-sex couples should have the right to legal
marital status 63.8 70.8 69.4 70.9 66.2 74.3 67.0 72.0 68.7 85.7Only volunteers should serve in the armed forces 61.9 63.4 64.9 65.1 66.2 72.6 64.2 63.4 65.7 75.8Dissent is a critical component of the political process 56.2 62.5 70.8 63.2 73.1 84.1 56.3 57.9 61.1 79.8Colleges have the right to ban extreme speakers from
campus 39.1 41.1 38.6 37.1 43.6 42.6 40.6 40.0 38.7 34.6Students from disadvantaged social backgrounds
should be given preferential treatment in college admissions 40.5 32.3 32.6 34.5 32.9 32.9 43.7 39.5 36.3 40.9
Colleges should prohibit racist/sexist speech on campus 67.2 68.8 67.3 69.0 70.2 70.2 67.5 70.7 69.9 69.3
How would you characterize your political views?Far left 2.1 2.8 2.7 3.2 3.3 3.2 3.3 3.0 3.1 7.5Liberal 29.3 30.3 34.9 34.6 31.9 39.0 29.1 29.4 32.1 52.3Middle-of-the-road 47.3 45.2 40.0 42.0 36.9 36.2 52.1 49.4 42.1 28.3Conservative 19.6 19.9 20.9 18.5 25.9 20.2 13.5 16.8 20.9 11.1Far right 1.9 1.8 1.5 1.7 1.9 1.2 1.9 1.4 1.7 0.8
The following reasons were “very important” indeciding to go to college:
My parents wanted me to go 46.7 40.4 38.1 39.4 38.4 37.8 42.0 40.1 38.3 34.6To be able to get a better job 86.7 85.2 83.4 86.2 81.5 81.6 83.9 83.1 83.3 71.9To gain a general education and appreciation of ideas 70.1 65.8 73.6 70.7 77.2 82.1 71.0 69.5 72.1 84.4To make me a more cultured person 49.3 47.1 56.2 54.1 62.9 67.1 54.3 52.3 54.4 69.6To be able to make more money 76.7 74.9 69.7 74.7 66.1 64.6 76.3 71.9 68.4 52.7To learn more about things that interest me 82.0 81.9 84.5 81.4 86.7 88.1 82.4 83.0 85.4 91.1
2009 CIRP Freshman SurveyWeighted National Norms—Public/Private Universities and Nonsectarian 4-year Colleges by Selectivity
Public Universities Private Universities Private/Nonsectarian 4-year CollegesLow Medium High Medium High Very High Low Medium High Very High
105

DURING YOUR LAST YEAR IN HIGH SCHOOL, HOWMUCH TIME DID YOU SPEND DURING A TYPICALWEEK DOING THE FOLLOWING ACTIVITIES?Studying/homework
None 1.9 2.6 1.5 2.3 1.2 0.9 3.1 2.8 2.0 0.5Less than one hour 11.4 14.8 8.1 10.8 6.6 3.3 16.7 14.5 9.9 3.21 to 2 hours 25.0 24.6 17.0 19.7 14.6 8.1 25.0 24.5 20.3 9.13 to 5 hours 31.3 29.1 27.0 26.7 24.9 18.3 26.5 29.4 27.3 20.76 to 10 hours 18.3 17.7 23.6 20.8 23.9 24.4 16.7 17.4 21.6 25.711 to 15 hours 6.8 6.5 11.9 10.4 14.0 19.5 6.5 6.2 9.7 19.216 to 20 hours 3.1 2.9 6.2 5.3 8.4 13.3 3.2 3.1 5.3 12.4Over 20 hours 2.3 1.7 4.8 3.9 6.3 12.1 2.3 2.2 3.9 9.2
Socializing with friendsNone 0.5 0.3 0.3 0.4 0.3 0.3 0.9 0.5 0.2 0.2Less than one hour 1.8 1.0 1.3 1.3 1.2 1.0 1.9 1.3 1.4 1.21 to 2 hours 9.4 4.9 6.9 6.0 5.9 5.6 6.7 6.2 7.1 5.53 to 5 hours 23.0 17.4 21.6 18.7 19.4 20.1 18.6 17.8 20.3 18.56 to 10 hours 25.7 26.7 29.7 26.5 29.2 32.7 23.3 24.7 26.2 30.211 to 15 hours 16.9 20.6 18.3 18.6 20.1 19.9 17.5 18.3 18.9 20.916 to 20 hours 9.5 12.3 9.9 11.7 11.3 10.2 12.1 11.7 10.8 11.8Over 20 hours 13.2 16.9 11.9 16.7 12.7 10.3 18.9 19.3 15.1 11.6
Talking with teachers outside of classNone 10.9 10.8 9.2 9.8 6.5 5.3 10.9 10.8 8.0 4.6Less than one hour 44.0 48.0 43.4 42.1 37.0 36.7 38.3 40.8 39.6 34.61 to 2 hours 29.5 29.4 32.3 31.1 35.6 38.2 30.6 30.2 33.0 38.43 to 5 hours 10.6 8.9 11.2 11.5 14.4 14.7 12.7 12.7 13.3 16.86 to 10 hours 3.1 1.9 2.6 3.3 4.3 3.6 4.2 3.5 3.9 3.811 to 15 hours 1.0 0.6 0.7 1.2 1.3 0.9 1.9 1.1 1.3 1.016 to 20 hours 0.5 0.2 0.2 0.4 0.4 0.3 0.5 0.4 0.5 0.4Over 20 hours 0.5 0.1 0.3 0.6 0.4 0.3 1.0 0.5 0.5 0.3
Exercise or sportsNone 6.0 3.6 4.0 4.1 3.4 2.8 6.2 6.1 5.0 3.2Less than one hour 10.1 7.5 8.3 7.7 7.7 6.7 10.5 8.7 9.8 7.41 to 2 hours 17.2 13.6 15.4 15.0 14.2 13.1 14.1 15.0 14.4 12.53 to 5 hours 19.4 18.5 20.0 20.8 20.4 20.1 17.2 17.6 17.7 18.36 to 10 hours 18.7 20.7 20.8 19.4 20.6 22.3 15.5 16.6 17.9 20.711 to 15 hours 12.4 16.4 14.8 14.0 15.1 16.9 13.5 13.5 14.2 18.316 to 20 hours 6.5 9.9 8.1 8.6 8.8 9.1 8.0 8.8 9.2 10.1Over 20 hours 9.7 9.8 8.6 10.6 9.8 8.9 14.9 13.7 11.9 9.6
PartyingNone 34.1 27.7 30.3 26.5 30.4 27.5 27.4 26.4 32.3 29.1Less than one hour 16.9 14.7 17.8 14.9 15.9 16.8 13.7 14.9 15.8 16.81 to 2 hours 18.1 16.7 18.8 17.8 18.2 19.2 16.1 15.7 16.5 18.13 to 5 hours 16.4 19.9 18.3 20.0 18.8 21.2 20.1 19.0 17.7 20.26 to 10 hours 8.3 12.7 9.1 11.8 10.5 10.0 11.6 13.1 9.9 10.511 to 15 hours 3.2 5.0 3.3 4.9 3.5 3.1 5.1 5.3 4.3 3.316 to 20 hours 1.5 1.9 1.2 1.9 1.3 1.0 2.5 2.6 1.8 1.1Over 20 hours 1.5 1.4 1.2 2.3 1.3 1.1 3.5 3.0 1.7 0.8
2009 CIRP Freshman SurveyWeighted National Norms—Public/Private Universities and Nonsectarian 4-year Colleges by Selectivity
Public Universities Private Universities Private/Nonsectarian 4-year CollegesLow Medium High Medium High Very High Low Medium High Very High
106
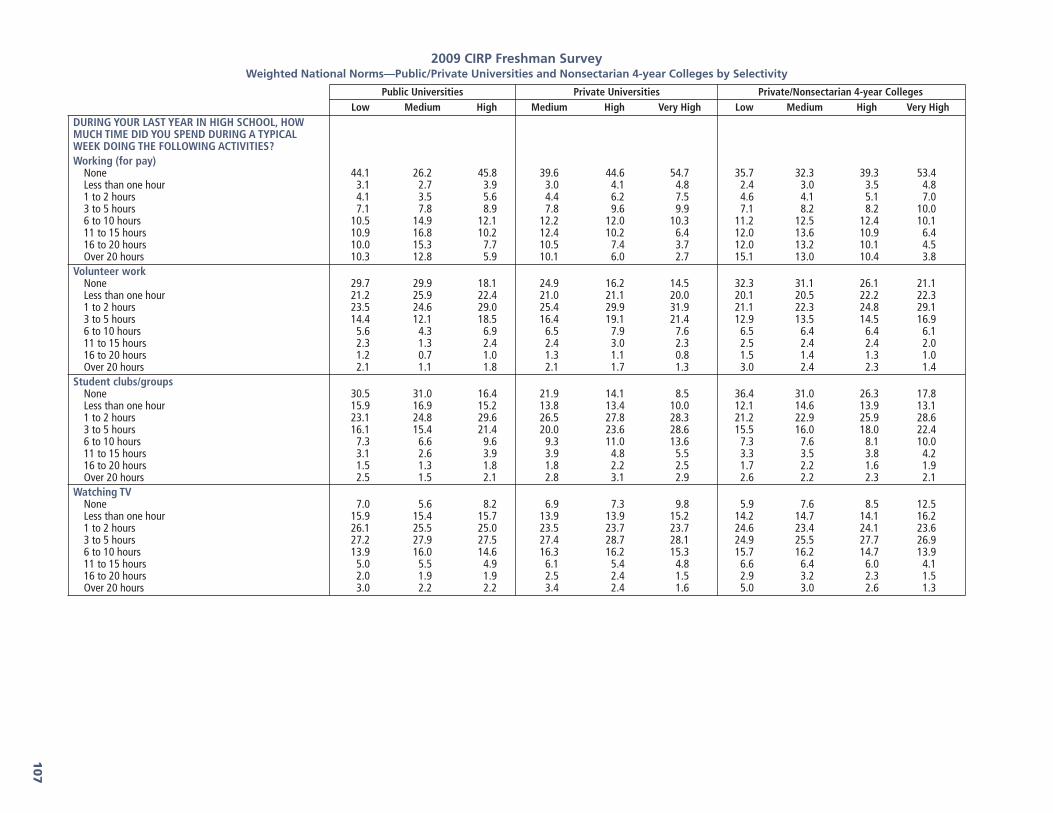
DURING YOUR LAST YEAR IN HIGH SCHOOL, HOWMUCH TIME DID YOU SPEND DURING A TYPICALWEEK DOING THE FOLLOWING ACTIVITIES?Working (for pay)
None 44.1 26.2 45.8 39.6 44.6 54.7 35.7 32.3 39.3 53.4Less than one hour 3.1 2.7 3.9 3.0 4.1 4.8 2.4 3.0 3.5 4.81 to 2 hours 4.1 3.5 5.6 4.4 6.2 7.5 4.6 4.1 5.1 7.03 to 5 hours 7.1 7.8 8.9 7.8 9.6 9.9 7.1 8.2 8.2 10.06 to 10 hours 10.5 14.9 12.1 12.2 12.0 10.3 11.2 12.5 12.4 10.111 to 15 hours 10.9 16.8 10.2 12.4 10.2 6.4 12.0 13.6 10.9 6.416 to 20 hours 10.0 15.3 7.7 10.5 7.4 3.7 12.0 13.2 10.1 4.5Over 20 hours 10.3 12.8 5.9 10.1 6.0 2.7 15.1 13.0 10.4 3.8
Volunteer workNone 29.7 29.9 18.1 24.9 16.2 14.5 32.3 31.1 26.1 21.1Less than one hour 21.2 25.9 22.4 21.0 21.1 20.0 20.1 20.5 22.2 22.31 to 2 hours 23.5 24.6 29.0 25.4 29.9 31.9 21.1 22.3 24.8 29.13 to 5 hours 14.4 12.1 18.5 16.4 19.1 21.4 12.9 13.5 14.5 16.96 to 10 hours 5.6 4.3 6.9 6.5 7.9 7.6 6.5 6.4 6.4 6.111 to 15 hours 2.3 1.3 2.4 2.4 3.0 2.3 2.5 2.4 2.4 2.016 to 20 hours 1.2 0.7 1.0 1.3 1.1 0.8 1.5 1.4 1.3 1.0Over 20 hours 2.1 1.1 1.8 2.1 1.7 1.3 3.0 2.4 2.3 1.4
Student clubs/groupsNone 30.5 31.0 16.4 21.9 14.1 8.5 36.4 31.0 26.3 17.8Less than one hour 15.9 16.9 15.2 13.8 13.4 10.0 12.1 14.6 13.9 13.11 to 2 hours 23.1 24.8 29.6 26.5 27.8 28.3 21.2 22.9 25.9 28.63 to 5 hours 16.1 15.4 21.4 20.0 23.6 28.6 15.5 16.0 18.0 22.46 to 10 hours 7.3 6.6 9.6 9.3 11.0 13.6 7.3 7.6 8.1 10.011 to 15 hours 3.1 2.6 3.9 3.9 4.8 5.5 3.3 3.5 3.8 4.216 to 20 hours 1.5 1.3 1.8 1.8 2.2 2.5 1.7 2.2 1.6 1.9Over 20 hours 2.5 1.5 2.1 2.8 3.1 2.9 2.6 2.2 2.3 2.1
Watching TVNone 7.0 5.6 8.2 6.9 7.3 9.8 5.9 7.6 8.5 12.5Less than one hour 15.9 15.4 15.7 13.9 13.9 15.2 14.2 14.7 14.1 16.21 to 2 hours 26.1 25.5 25.0 23.5 23.7 23.7 24.6 23.4 24.1 23.63 to 5 hours 27.2 27.9 27.5 27.4 28.7 28.1 24.9 25.5 27.7 26.96 to 10 hours 13.9 16.0 14.6 16.3 16.2 15.3 15.7 16.2 14.7 13.911 to 15 hours 5.0 5.5 4.9 6.1 5.4 4.8 6.6 6.4 6.0 4.116 to 20 hours 2.0 1.9 1.9 2.5 2.4 1.5 2.9 3.2 2.3 1.5Over 20 hours 3.0 2.2 2.2 3.4 2.4 1.6 5.0 3.0 2.6 1.3
2009 CIRP Freshman SurveyWeighted National Norms—Public/Private Universities and Nonsectarian 4-year Colleges by Selectivity
Public Universities Private Universities Private/Nonsectarian 4-year CollegesLow Medium High Medium High Very High Low Medium High Very High
107

DURING YOUR LAST YEAR IN HIGH SCHOOL, HOWMUCH TIME DID YOU SPEND DURING A TYPICALWEEK DOING THE FOLLOWING ACTIVITIES?Household/childcare duties
None 18.9 19.2 19.0 19.7 18.4 22.0 23.4 21.5 21.3 24.3Less than one hour 20.0 23.6 23.9 20.4 22.5 24.6 17.9 19.8 20.3 23.71 to 2 hours 30.2 31.6 31.8 31.0 30.9 31.9 26.5 28.8 29.2 30.33 to 5 hours 18.6 17.9 17.1 18.5 19.1 15.6 18.9 17.8 18.6 15.76 to 10 hours 6.9 4.9 5.2 6.0 5.8 3.8 6.5 6.9 6.4 4.011 to 15 hours 2.4 1.6 1.6 2.2 1.9 1.1 3.2 2.4 2.1 1.116 to 20 hours 1.0 0.6 0.6 1.0 0.6 0.4 1.4 1.3 0.9 0.3Over 20 hours 1.9 0.7 0.8 1.2 0.7 0.6 2.3 1.5 1.2 0.5
Reading for pleasureNone 26.8 27.2 21.1 24.5 16.5 17.1 30.4 27.5 24.1 13.9Less than one hour 24.1 25.3 26.1 23.2 23.3 25.6 21.4 22.3 21.0 22.51 to 2 hours 22.8 22.3 26.0 23.6 26.9 28.1 21.1 21.5 23.4 28.23 to 5 hours 14.5 15.0 16.4 16.0 19.7 18.6 13.4 15.4 17.0 21.56 to 10 hours 7.0 6.3 6.5 7.4 8.4 7.1 6.8 7.7 8.0 8.911 to 15 hours 2.4 2.1 2.2 2.6 2.8 2.0 3.0 2.8 3.9 2.916 to 20 hours 1.2 0.8 0.7 1.1 1.1 0.7 1.6 1.3 1.2 1.1Over 20 hours 1.4 1.0 0.8 1.5 1.3 0.8 2.3 1.5 1.4 1.0
Playing video/computer gamesNone 39.4 40.0 42.2 40.6 43.4 46.6 34.5 38.5 40.0 49.8Less than one hour 18.4 20.4 19.4 18.7 19.4 19.3 19.9 19.5 19.3 17.61 to 2 hours 16.2 14.7 15.1 15.5 15.1 14.2 16.1 15.2 15.4 13.53 to 5 hours 12.6 12.3 12.1 11.6 11.1 11.0 12.9 12.3 12.2 10.56 to 10 hours 6.7 6.8 6.1 6.6 6.1 5.3 7.3 7.3 6.5 4.811 to 15 hours 3.0 2.8 2.5 3.4 2.5 2.0 4.0 3.7 3.4 2.116 to 20 hours 1.6 1.2 1.1 1.5 1.0 0.7 2.1 1.7 1.3 0.9Over 20 hours 2.1 1.8 1.6 2.1 1.4 1.0 3.3 1.8 1.8 0.8
Online social networks (MySpace, Facebook, etc.)None 10.9 7.1 7.4 6.8 6.2 5.2 7.8 7.1 6.9 5.9Less than one hour 21.9 19.8 18.9 16.7 16.2 15.6 15.9 16.5 16.4 15.71 to 2 hours 27.2 29.8 29.4 27.3 28.0 29.1 24.9 24.9 27.5 29.83 to 5 hours 21.6 25.4 25.5 24.9 27.6 29.1 23.3 24.0 25.2 28.76 to 10 hours 9.8 10.6 11.0 13.0 12.3 13.3 12.9 13.8 13.3 12.211 to 15 hours 4.2 3.7 3.9 5.3 4.9 4.2 6.5 5.7 5.2 4.316 to 20 hours 1.8 1.7 1.8 2.5 2.2 1.7 3.5 3.2 2.2 1.6Over 20 hours 2.5 1.8 2.2 3.5 2.5 1.9 5.3 4.7 3.2 1.7
The following reasons were “very important” indeciding to go to this particular college:
My parents wanted me to come here 18.8 15.0 17.0 17.9 17.0 17.6 20.7 16.7 17.4 13.0My relatives wanted me to come here 7.1 4.8 6.1 6.0 6.5 6.6 9.5 6.1 5.6 3.6My teacher advised me 7.0 5.1 6.3 6.0 6.6 7.5 11.1 8.4 8.7 7.8This college has a very good academic reputation 50.5 60.2 79.3 69.3 77.5 89.3 60.3 61.4 71.0 79.2This college has a good reputation for its social
activities 34.0 46.9 46.7 35.2 41.4 43.2 37.9 34.6 35.1 38.7I was offered financial assistance 40.9 36.6 30.6 62.1 53.9 35.6 56.9 55.8 63.8 44.2
2009 CIRP Freshman SurveyWeighted National Norms—Public/Private Universities and Nonsectarian 4-year Colleges by Selectivity
Public Universities Private Universities Private/Nonsectarian 4-year CollegesLow Medium High Medium High Very High Low Medium High Very High
108

The following reasons were “very important” indeciding to go to this particular college:
The cost of attending this college 45.1 46.1 35.1 34.8 27.6 22.5 32.7 33.5 31.3 23.6High school counselor advised me 9.8 7.2 7.9 9.6 9.9 10.9 11.8 9.9 10.6 12.3Private college counselor advised me 2.7 1.5 2.6 4.0 4.8 4.9 5.3 4.4 4.9 6.5I wanted to live near home 23.1 15.1 12.2 19.8 11.3 5.8 19.3 22.3 15.9 7.0Not offered aid by first choice 8.9 10.0 8.0 11.5 9.0 4.0 9.2 8.2 8.8 5.8Could not afford first choice 12.6 15.6 10.6 12.1 8.3 3.8 10.5 9.9 9.6 5.7This college’s graduates gain admission to top
graduate/professional schools 29.5 28.4 49.2 42.5 48.7 61.8 32.3 32.0 42.6 45.1This college’s graduates get good jobs 49.2 55.4 66.3 68.3 65.6 73.7 58.1 61.5 67.5 55.1I was attracted by the religious affiliation/orientation
of the college 3.2 1.9 2.9 8.8 21.2 9.8 6.7 3.3 6.8 2.1I wanted to go to a school about the size of this
college 29.0 35.2 29.3 42.0 50.1 40.4 45.3 48.3 47.5 58.0Rankings in national magazines 13.1 15.4 36.3 20.2 30.9 45.9 19.1 13.4 21.1 27.1Information from a website 16.3 14.2 21.8 20.3 23.8 28.6 25.8 23.6 23.0 24.8I was admitted through an Early Action or Early
Decision program 8.0 9.5 13.9 17.6 21.9 30.4 11.8 14.2 14.6 32.1The athletic department recruited me 4.0 3.1 3.1 5.2 5.3 6.6 17.7 11.1 14.8 16.6A visit to the campus 30.5 40.7 36.9 41.7 51.5 50.0 47.9 46.5 53.2 59.9Ability to take online courses 3.1 1.7 1.9 2.3 2.0 1.2 3.1 2.3 2.0 0.7
Your probable field of study:Arts and Humanities
Art, fine and applied 2.0 2.2 1.3 1.9 1.1 0.6 17.0 16.7 12.1 3.8English (language and literature) 1.5 1.7 1.8 1.3 2.4 2.5 1.7 0.7 2.2 5.6History 1.2 1.2 1.0 0.9 1.9 1.8 1.3 0.7 1.4 3.1Journalism 1.0 3.0 0.9 1.7 2.1 1.7 1.0 1.8 1.0 0.9Language and Literature (except English) 0.6 0.9 0.7 0.6 0.8 1.3 0.1 0.1 0.7 2.0Music 1.2 1.3 1.0 1.6 1.1 0.8 0.9 0.4 1.3 1.4Philosophy 0.3 0.2 0.3 0.3 0.5 0.6 0.1 0.2 0.4 1.3Speech 0.1 0.2 0.1 0.1 0.1 0.0 0.0 0.1 0.0 0.1Theater or Drama 0.7 0.7 0.7 0.9 1.1 1.0 1.3 2.3 1.7 1.0Theology or Religion 0.0 0.1 0.0 0.1 0.3 0.2 0.0 0.0 0.2 0.2Other Arts and Humanities 1.4 0.9 0.9 1.5 1.2 0.8 2.9 3.1 2.7 1.2
Biological ScienceBiology (general) 8.1 4.0 8.1 6.7 8.2 8.1 4.7 3.0 4.1 6.4Biochemistry or Biophysics 2.8 0.9 2.9 1.3 2.1 2.5 0.6 0.5 1.5 2.3Botany 0.1 0.1 0.1 0.0 0.0 0.0 0.0 0.1 0.0 0.1Environmental Science 0.5 0.8 1.0 0.5 0.8 0.8 0.7 0.9 1.3 2.9Marine (Life) Science 0.1 0.3 0.4 0.4 0.2 0.2 0.1 1.2 0.5 0.4Microbiology or Bacteriology 0.3 0.4 0.8 0.2 0.3 0.4 0.0 0.1 0.2 0.4Zoology 0.3 0.7 0.6 0.1 0.1 0.2 0.2 1.3 0.5 0.4Other Biological Science 1.1 0.8 1.5 0.3 0.9 1.6 0.2 1.4 0.4 1.1
2009 CIRP Freshman SurveyWeighted National Norms—Public/Private Universities and Nonsectarian 4-year Colleges by Selectivity
Public Universities Private Universities Private/Nonsectarian 4-year CollegesLow Medium High Medium High Very High Low Medium High Very High
109
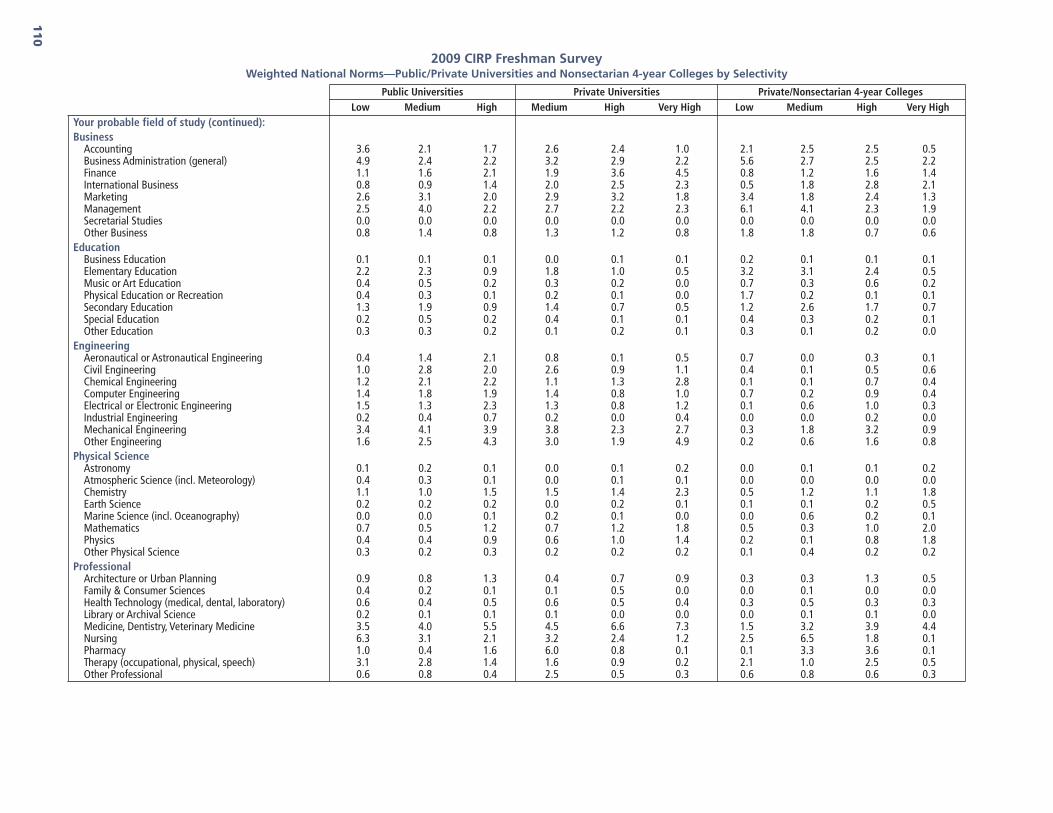
Your probable field of study (continued):Business
Accounting 3.6 2.1 1.7 2.6 2.4 1.0 2.1 2.5 2.5 0.5Business Administration (general) 4.9 2.4 2.2 3.2 2.9 2.2 5.6 2.7 2.5 2.2Finance 1.1 1.6 2.1 1.9 3.6 4.5 0.8 1.2 1.6 1.4International Business 0.8 0.9 1.4 2.0 2.5 2.3 0.5 1.8 2.8 2.1Marketing 2.6 3.1 2.0 2.9 3.2 1.8 3.4 1.8 2.4 1.3Management 2.5 4.0 2.2 2.7 2.2 2.3 6.1 4.1 2.3 1.9Secretarial Studies 0.0 0.0 0.0 0.0 0.0 0.0 0.0 0.0 0.0 0.0Other Business 0.8 1.4 0.8 1.3 1.2 0.8 1.8 1.8 0.7 0.6
EducationBusiness Education 0.1 0.1 0.1 0.0 0.1 0.1 0.2 0.1 0.1 0.1Elementary Education 2.2 2.3 0.9 1.8 1.0 0.5 3.2 3.1 2.4 0.5Music or Art Education 0.4 0.5 0.2 0.3 0.2 0.0 0.7 0.3 0.6 0.2Physical Education or Recreation 0.4 0.3 0.1 0.2 0.1 0.0 1.7 0.2 0.1 0.1Secondary Education 1.3 1.9 0.9 1.4 0.7 0.5 1.2 2.6 1.7 0.7Special Education 0.2 0.5 0.2 0.4 0.1 0.1 0.4 0.3 0.2 0.1Other Education 0.3 0.3 0.2 0.1 0.2 0.1 0.3 0.1 0.2 0.0
EngineeringAeronautical or Astronautical Engineering 0.4 1.4 2.1 0.8 0.1 0.5 0.7 0.0 0.3 0.1Civil Engineering 1.0 2.8 2.0 2.6 0.9 1.1 0.4 0.1 0.5 0.6Chemical Engineering 1.2 2.1 2.2 1.1 1.3 2.8 0.1 0.1 0.7 0.4Computer Engineering 1.4 1.8 1.9 1.4 0.8 1.0 0.7 0.2 0.9 0.4Electrical or Electronic Engineering 1.5 1.3 2.3 1.3 0.8 1.2 0.1 0.6 1.0 0.3Industrial Engineering 0.2 0.4 0.7 0.2 0.0 0.4 0.0 0.0 0.2 0.0Mechanical Engineering 3.4 4.1 3.9 3.8 2.3 2.7 0.3 1.8 3.2 0.9Other Engineering 1.6 2.5 4.3 3.0 1.9 4.9 0.2 0.6 1.6 0.8
Physical ScienceAstronomy 0.1 0.2 0.1 0.0 0.1 0.2 0.0 0.1 0.1 0.2Atmospheric Science (incl. Meteorology) 0.4 0.3 0.1 0.0 0.1 0.1 0.0 0.0 0.0 0.0Chemistry 1.1 1.0 1.5 1.5 1.4 2.3 0.5 1.2 1.1 1.8Earth Science 0.2 0.2 0.2 0.0 0.2 0.1 0.1 0.1 0.2 0.5Marine Science (incl. Oceanography) 0.0 0.0 0.1 0.2 0.1 0.0 0.0 0.6 0.2 0.1Mathematics 0.7 0.5 1.2 0.7 1.2 1.8 0.5 0.3 1.0 2.0Physics 0.4 0.4 0.9 0.6 1.0 1.4 0.2 0.1 0.8 1.8Other Physical Science 0.3 0.2 0.3 0.2 0.2 0.2 0.1 0.4 0.2 0.2
ProfessionalArchitecture or Urban Planning 0.9 0.8 1.3 0.4 0.7 0.9 0.3 0.3 1.3 0.5Family & Consumer Sciences 0.4 0.2 0.1 0.1 0.5 0.0 0.0 0.1 0.0 0.0Health Technology (medical, dental, laboratory) 0.6 0.4 0.5 0.6 0.5 0.4 0.3 0.5 0.3 0.3Library or Archival Science 0.2 0.1 0.1 0.1 0.0 0.0 0.0 0.1 0.1 0.0Medicine, Dentistry, Veterinary Medicine 3.5 4.0 5.5 4.5 6.6 7.3 1.5 3.2 3.9 4.4Nursing 6.3 3.1 2.1 3.2 2.4 1.2 2.5 6.5 1.8 0.1Pharmacy 1.0 0.4 1.6 6.0 0.8 0.1 0.1 3.3 3.6 0.1Therapy (occupational, physical, speech) 3.1 2.8 1.4 1.6 0.9 0.2 2.1 1.0 2.5 0.5Other Professional 0.6 0.8 0.4 2.5 0.5 0.3 0.6 0.8 0.6 0.3
2009 CIRP Freshman SurveyWeighted National Norms—Public/Private Universities and Nonsectarian 4-year Colleges by Selectivity
Public Universities Private Universities Private/Nonsectarian 4-year CollegesLow Medium High Medium High Very High Low Medium High Very High
110

Your probable field of study (continued):Social Science
Anthropology 0.4 0.5 0.6 0.5 0.8 0.7 0.4 0.0 0.6 1.6Economics 0.5 0.3 1.0 0.4 1.5 4.6 0.3 0.2 0.6 4.3Ethnic Studies 0.0 0.0 0.1 0.0 0.2 0.1 0.0 0.1 0.1 0.2Geography 0.1 0.0 0.1 0.1 0.1 0.0 0.0 0.0 0.0 0.2Political Science (gov’t., international relations) 2.7 2.2 4.0 3.4 9.2 8.0 2.5 1.4 3.0 8.9Psychology 5.8 4.4 4.4 4.8 4.8 3.3 5.3 4.0 4.5 6.3Public Policy 0.1 0.0 0.2 0.1 0.2 1.0 0.0 0.1 0.1 0.4Social Work 0.6 0.4 0.3 0.3 0.3 0.1 0.6 0.7 0.3 0.3Sociology 1.2 0.7 0.4 0.4 0.5 0.5 0.6 0.3 0.4 1.1Women’s Studies 0.0 0.0 0.0 0.0 0.0 0.0 0.0 0.0 0.1 0.1Other Social Science 0.3 0.3 0.4 0.3 0.4 0.4 0.3 0.3 0.2 0.5
TechnicalBuilding Trades 0.0 0.0 0.0 0.0 0.0 0.0 0.0 0.0 0.0 0.0Data Processing or Computer Programming 0.5 0.5 0.5 0.5 0.4 0.2 1.0 0.3 0.5 0.3Drafting or Design 0.2 0.2 0.1 0.2 0.0 0.1 1.4 0.4 0.7 0.1Electronics 0.0 0.0 0.0 0.0 0.0 0.0 0.1 0.2 0.1 0.0Mechanics 0.0 0.0 0.0 0.0 0.0 0.0 0.0 0.1 0.0 0.0Other Technical 0.1 0.1 0.0 0.2 0.0 0.0 0.1 0.1 0.1 0.0
Other FieldsAgriculture 0.3 1.6 0.2 0.0 0.0 0.4 0.1 0.8 0.2 0.1Communications 0.8 2.8 2.5 2.7 2.5 1.1 1.8 2.2 1.6 0.3Computer Science 1.3 0.9 1.2 1.0 0.7 0.5 1.2 0.5 0.9 0.5Forestry 0.2 0.1 0.0 0.0 0.0 0.0 0.0 0.0 0.0 0.0Kinesiology 0.5 1.4 0.6 0.1 0.1 0.1 0.3 0.2 0.3 0.2Law Enforcement 0.6 0.7 0.2 0.8 0.3 0.1 3.1 2.3 0.3 0.1Military Science 0.2 0.0 0.0 0.1 0.1 0.0 0.1 0.2 0.0 0.0Other Field 1.8 1.4 0.8 1.5 0.7 0.6 5.0 2.1 1.2 0.4Undecided 6.1 7.2 6.6 5.2 6.3 5.7 3.5 4.1 5.5 11.5
Objectives considered to be “Essential” or “Very Important”:
Becoming accomplished in one of the performing arts(acting, dancing, etc.) 14.3 11.8 13.9 16.4 17.0 16.8 20.8 19.7 17.3 19.4
Becoming an authority in my field 58.4 55.5 60.0 60.8 63.7 68.1 60.8 58.3 57.9 57.3Obtaining recognition from my colleagues for
contributions to my special field 58.0 55.6 59.1 60.2 59.9 62.1 59.0 60.5 57.2 51.8Influencing the political structure 20.9 16.7 20.9 21.7 26.8 26.3 21.8 19.4 19.0 24.8Influencing social values 41.5 35.4 39.8 43.1 48.4 44.0 45.6 41.3 40.3 44.5Raising a family 73.5 76.0 72.9 75.4 74.4 75.2 70.4 69.7 71.7 66.9Being very well off financially 83.4 79.4 78.0 81.4 72.6 72.8 81.3 78.3 74.5 60.2Helping others who are in difficulty 69.9 63.6 69.5 69.4 75.2 74.4 64.6 65.5 67.6 71.2Making a theoretical contribution to science 24.1 20.0 29.4 25.5 25.2 28.5 16.3 20.8 20.8 21.3Writing original works (poems, novels, short stories,
etc.) 14.3 12.5 14.4 15.9 17.5 17.3 20.0 18.3 17.6 23.4Creating artistic work (painting, sculpture,
decorating, etc.) 15.0 12.9 13.6 15.3 15.1 12.6 31.5 25.2 26.1 20.1Becoming successful in a business of my own 45.1 37.6 41.3 44.9 42.3 41.6 54.7 45.9 45.2 34.2Becoming involved in programs to clean up the
environment 27.6 24.3 29.9 29.3 30.7 30.4 30.1 28.6 29.3 36.1
2009 CIRP Freshman SurveyWeighted National Norms—Public/Private Universities and Nonsectarian 4-year Colleges by Selectivity
Public Universities Private Universities Private/Nonsectarian 4-year CollegesLow Medium High Medium High Very High Low Medium High Very High
111

Objectives considered to be “Essential” or “Very Important”:
Developing a meaningful philosophy of life 44.9 44.8 52.9 49.5 57.2 59.3 47.7 44.8 48.7 61.6Participating in a community action program 29.2 22.9 32.7 32.9 41.4 40.3 30.8 26.1 28.4 37.6Helping to promote racial understanding 34.4 26.8 35.0 36.2 38.9 38.0 36.4 31.7 32.7 40.2Keeping up to date with political affairs 33.6 34.5 43.3 37.7 48.9 54.1 32.4 30.6 33.9 54.0Becoming a community leader 34.1 30.8 38.6 36.8 45.7 46.6 36.3 30.9 33.7 40.6Improving my understanding of other
countries/cultures 46.3 44.4 56.6 53.5 61.2 66.5 47.0 47.5 53.6 70.9Adopting “green” practices to protect the
environment 40.9 41.6 47.9 45.9 46.4 49.7 42.7 42.8 44.2 58.6Student estimates “Very Good Chance” that they will:
Change major field 11.9 14.6 17.3 12.8 15.0 17.6 6.9 8.7 10.8 22.2Change career choice 10.8 13.9 15.9 11.8 16.4 20.7 6.7 7.7 12.3 27.8Participate in student government 6.4 4.7 8.5 7.9 9.4 10.6 8.3 5.9 6.2 8.1Get a job to help pay for college expenses 53.5 56.1 45.3 51.2 44.2 41.6 48.7 47.4 51.3 46.5Work full-time while attending college 7.2 4.3 4.2 6.8 4.0 2.4 7.4 6.4 5.7 2.4Join a social fraternity or sorority 14.1 9.8 12.4 12.6 13.8 12.4 9.1 5.6 7.7 7.4Play club, intramural, or recreational sports 28.4 38.8 35.8 31.7 38.7 40.9 28.2 26.3 31.4 39.0Play intercollegiate athletics (eg NCAA or
NAIA-sponsored) 7.6 5.7 5.2 8.5 8.7 9.5 23.8 17.7 21.6 25.4Make at least a “B” average 61.9 67.4 70.4 71.0 75.3 75.5 63.3 66.3 70.6 73.6Need extra time to complete your degree
requirements 7.7 5.1 5.8 5.1 4.2 3.0 5.9 5.8 5.3 3.1Participate in student protests or demonstrations 5.4 4.7 6.8 7.0 8.8 8.2 6.8 5.3 6.6 12.8Transfer to another college before graduating 8.8 4.0 3.0 4.6 2.9 1.9 7.4 5.5 5.0 2.3Be satisfied with your college 48.9 59.1 65.2 54.6 67.7 75.2 55.0 54.3 60.6 71.2Participate in volunteer or community service work 26.8 24.6 37.6 36.2 50.3 52.4 27.3 25.0 32.8 44.2Seek personal counseling 11.3 6.0 9.3 7.6 8.3 7.8 8.4 7.3 8.6 9.8Communicate regularly with your professors 32.4 31.2 38.5 37.4 50.4 51.9 38.1 37.8 44.9 59.8Socialize with someone of another racial/ethnic group 63.2 61.7 73.5 68.7 75.1 81.2 60.5 62.5 67.3 80.7Participate in student clubs/groups 40.9 43.5 57.0 54.3 61.9 72.2 40.3 39.6 47.8 64.3Participate in a study abroad program 22.0 29.3 36.3 38.3 45.9 51.4 25.3 28.2 38.0 59.9Have a roommate of different race/ethnicity 29.3 17.7 34.8 33.6 37.2 45.9 24.5 27.5 32.1 43.2Discuss course content with students outside of class 43.1 45.8 57.6 50.7 60.5 70.9 40.5 41.1 52.8 71.1Work on a professor’s research project 29.0 24.0 30.8 30.8 31.0 35.7 36.1 33.2 31.7 29.0
Do you give the Higher Education ResearchInstitute (HERI) permission to include your IDnumber should your college request the data foradditional research analyses?
Yes 67.2 75.1 59.4 60.3 56.4 61.7 58.5 66.6 67.6 66.2No 32.8 24.9 40.6 39.7 43.6 38.3 41.5 33.4 32.4 33.8
2009 CIRP Freshman SurveyWeighted National Norms—Public/Private Universities and Nonsectarian 4-year Colleges by Selectivity
Public Universities Private Universities Private/Nonsectarian 4-year CollegesLow Medium High Medium High Very High Low Medium High Very High
112

CIRP Construct: Habits of MindHigh Construct Score Group 24.1 24.8 33.3 30.0 38.6 48.2 25.1 24.6 30.1 42.8Average Construct Score Group 38.8 41.7 41.1 40.1 38.8 36.2 34.3 37.6 39.3 39.4Low Construct Score Group 37.1 33.5 25.6 29.8 22.6 15.6 40.6 37.7 30.6 17.9Mean Score 49.5 49.9 51.7 50.9 52.7 54.6 49.2 49.4 50.8 53.7
CIRP Construct: Academic Self-ConceptHigh Construct Score Group 19.3 21.4 39.5 28.7 37.4 59.5 16.5 15.7 22.9 36.8Average Construct Score Group 40.7 45.9 44.6 44.7 44.7 33.3 33.7 38.3 43.8 43.9Low Construct Score Group 40.1 32.7 16.0 26.6 18.0 7.2 49.8 46.0 33.3 19.3Mean Score 48.0 49.0 52.9 50.5 52.4 56.4 46.3 46.8 49.0 52.1
CIRP Construct: Social Self-ConceptHigh Construct Score Group 27.5 26.9 31.7 30.7 35.7 40.8 27.2 25.1 26.3 31.2Average Construct Score Group 37.8 40.2 38.9 37.6 38.0 37.2 35.6 38.1 37.6 39.1Low Construct Score Group 34.7 32.9 29.4 31.8 26.3 22.0 37.1 36.7 36.1 29.6Mean Score 48.9 49.0 50.1 49.7 51.0 52.0 48.5 48.3 48.6 49.9
CIRP Construct: Pluralistic OrientationHigh Construct Score Group 27.0 23.7 32.6 32.1 34.6 39.8 26.0 26.5 29.8 36.1Average Construct Score Group 36.5 38.3 39.0 38.0 37.3 38.0 33.4 34.9 36.4 39.7Low Construct Score Group 36.6 38.1 28.4 29.9 28.0 22.3 40.7 38.6 33.8 24.2Mean Score 49.8 49.2 51.4 51.1 51.7 53.0 49.1 49.5 50.5 52.3
CIRP Construct: Social AgencyHigh Construct Score Group 27.6 21.3 30.6 30.8 39.4 38.4 29.8 24.0 26.3 36.1Average Construct Score Group 40.1 41.1 41.4 40.2 39.6 39.2 36.0 40.8 40.7 39.8Low Construct Score Group 32.2 37.6 28.0 29.0 21.0 22.4 34.2 35.2 33.0 24.1Mean Score 48.2 46.7 49.0 49.0 51.0 50.8 48.3 47.3 48.0 50.3
CIRP Construct: College Reputation OrientationHigh Construct Score Group 26.2 26.4 45.7 40.5 45.4 58.7 30.0 30.3 40.0 40.4Average Construct Score Group 25.3 30.6 23.4 29.2 22.9 17.7 29.9 32.5 29.4 18.6Low Construct Score Group 48.5 43.0 30.9 30.2 31.7 23.7 40.0 37.2 30.6 41.1Mean Score 47.3 48.3 51.2 50.5 51.0 52.9 48.5 49.0 50.4 49.8
CIRP Construct: Likelihood of College InvolvementHigh Construct Score Group 22.4 23.3 37.2 35.2 47.6 55.5 23.5 23.2 31.7 52.6Average Construct Score Group 38.2 39.4 40.2 37.9 35.7 32.7 35.7 38.2 38.7 34.2Low Construct Score Group 39.4 37.3 22.6 26.9 16.7 11.8 40.8 38.6 29.6 13.3Mean Score 44.8 45.2 47.9 47.3 49.3 50.5 44.7 45.0 46.7 50.1
Note: CIRP Constructs are scored on a normal curve, a “Low” score represents students who are one-half standard deviation or more below the mean, a “High” score represents students who are one-half standard deviation or moreabove the mean, and an “Average” score represents students whose scores are within one-half standard deviation of the mean.
2009 CIRP Freshman SurveyWeighted National Norms—Public/Private Universities and Nonsectarian 4-year Colleges by Selectivity
Public Universities Private Universities Private/Nonsectarian 4-year CollegesLow Medium High Medium High Very High Low Medium High Very High
113


2009 National Norms
FirstTime FullTime FreshmenPublic FourYear Colleges
Catholic FourYear CollegesOther Religious FourYear Colleges
By Selectivity Levels


First-time, Full-time Freshmen 11,126 10,728 21,085 3,242 3,601 13,112 2,686 5,017 5,357 14,490How old will you be on December 31 of this year?
17 or younger 1.9 1.8 1.6 2.5 1.8 1.6 2.3 1.3 1.6 1.418 71.3 73.0 66.6 72.7 64.3 70.5 64.4 61.4 62.7 63.319 24.2 23.7 29.9 22.5 32.6 27.1 29.8 35.3 33.8 34.220 or older 2.7 1.5 1.9 2.3 1.3 0.7 3.6 2.0 1.9 1.2
Is English your native language?Yes 86.0 94.7 96.3 88.4 90.5 95.6 96.5 96.7 96.0 94.9No 14.0 5.3 3.7 11.6 9.5 4.4 3.5 3.3 4.0 5.1
In what year did you graduate from high school?2009 96.3 98.2 97.2 97.9 98.8 99.2 96.4 97.7 97.4 98.42008 2.1 1.1 1.7 0.9 0.8 0.7 2.3 1.4 1.5 1.32007 or earlier 1.1 0.5 0.8 0.9 0.4 0.1 0.9 0.6 0.6 0.3Passed G.E.D./Never completed high school 0.5 0.1 0.2 0.2 0.0 0.0 0.4 0.2 0.4 0.1
How many miles is this college from yourpermanent home?
5 or less 12.0 6.3 4.2 12.4 9.6 3.6 4.8 4.8 5.0 3.46 to 10 10.8 11.7 6.2 14.3 12.9 5.7 5.4 4.5 5.4 3.111 to 50 33.4 37.7 23.5 39.5 36.9 24.0 15.3 26.7 22.8 16.451 to 100 16.6 18.1 19.5 12.8 15.5 20.4 19.0 23.3 20.2 14.1101 to 500 21.7 22.1 30.9 12.3 20.6 35.3 41.1 32.0 30.2 37.1Over 500 5.5 4.2 15.7 8.8 4.6 11.0 14.4 8.6 16.4 26.0
What was your average grade in high school?A or A+ 10.1 9.7 22.3 12.3 20.6 20.7 8.4 19.9 23.4 32.0A- 14.7 19.0 27.6 15.1 23.7 29.2 8.7 21.4 24.1 30.1B+ 22.7 26.0 22.5 24.7 21.2 24.5 17.7 21.9 20.4 19.4B 28.9 30.2 18.2 27.1 22.0 19.1 23.4 21.9 19.4 13.5B- 12.4 10.3 5.9 10.5 7.9 4.6 17.7 8.3 7.6 3.5C+ 8.1 3.6 2.5 7.7 3.3 1.4 15.9 4.2 3.5 1.1C 3.1 1.1 0.8 2.5 1.2 0.5 7.8 2.3 1.6 0.4D 0.1 0.0 0.1 0.1 0.1 0.0 0.4 0.1 0.1 0.0
From what kind of high school did you graduate?Public school (not charter or magnet) 81.8 86.8 81.9 60.2 71.4 59.8 83.8 81.5 76.6 67.5Public charter school 4.5 1.6 1.5 4.8 1.1 0.8 2.6 1.2 1.3 1.2Public magnet school 5.0 1.0 2.6 4.5 1.1 1.1 4.6 1.3 2.1 2.4Private religious/parochial school 6.3 7.5 9.2 25.5 20.1 28.0 5.2 10.8 13.1 16.0Private independent college-prep school 2.1 2.7 3.9 4.8 5.9 9.6 3.1 3.3 3.9 11.1Home school 0.3 0.4 0.9 0.2 0.4 0.7 0.7 1.9 3.0 1.8
Prior to this term, have you ever taken courses forcredit at this institution?
No 93.4 97.1 96.2 92.5 95.3 96.5 94.5 96.4 97.3 96.3Yes 6.6 2.9 3.8 7.5 4.7 3.5 5.5 3.6 2.7 3.7
2009 CIRP Freshman SurveyWeighted National Norms—Public, Catholic, and Other Religious 4-year Colleges by Selectivity
Public 4-year Colleges Catholic 4-year Colleges Other Religious 4-year CollegesLow Medium High Low Medium High Very Low Low Medium High
117

Since leaving high school, have you ever takencourses, whether for credit or not for credit, atany other institution (university, 4- or 2-yearcollege, technical, vocational, or business school)?
No 85.6 91.6 91.8 87.7 87.5 91.5 88.3 88.8 88.5 88.4Yes 14.4 8.4 8.2 12.3 12.5 8.5 11.7 11.2 11.5 11.6
Where do you plan to live during the fall term?With my family or other relatives 35.5 31.8 12.9 31.1 26.4 7.3 10.6 9.1 9.3 3.6Other private home, apartment, or room 6.5 2.2 2.2 2.4 1.0 0.5 2.0 0.7 0.6 0.3College residence hall 50.7 64.2 80.9 64.6 71.6 91.1 84.1 86.6 88.6 95.1Fraternity or sorority house 0.1 0.0 0.1 0.0 0.0 0.0 0.1 0.1 0.1 0.0Other campus student housing 6.4 1.6 3.7 1.6 1.0 0.9 2.7 3.2 1.1 0.8Other 0.7 0.2 0.3 0.2 0.1 0.1 0.5 0.3 0.2 0.1
To how many colleges other than this one did youapply for admission this year?
None 17.5 13.5 17.0 9.6 12.2 7.9 12.4 16.8 17.5 12.3One 10.8 12.0 13.9 7.2 11.5 5.9 10.7 12.2 12.5 10.3Two 13.8 16.3 17.1 11.0 15.3 8.4 14.6 16.3 15.6 13.1Three 18.5 18.4 18.1 16.4 19.7 12.8 18.7 20.0 17.9 15.1Four 15.6 14.7 12.9 17.4 15.9 13.2 16.3 13.0 14.4 13.0Five 9.6 10.0 8.5 12.9 10.2 12.7 10.9 8.7 8.4 10.0Six 5.4 6.0 4.7 9.5 6.2 11.3 6.2 4.7 5.4 7.7Seven to ten 7.4 7.7 6.6 12.4 7.2 21.9 7.5 6.8 6.4 14.6Eleven or more 1.5 1.4 1.2 3.7 2.0 5.7 2.7 1.5 1.9 4.0
Were you accepted by your first choice college?Yes 76.6 82.1 85.3 78.2 89.9 77.9 71.8 89.2 89.2 84.6No 23.4 17.9 14.7 21.8 10.1 22.1 28.2 10.8 10.8 15.4
Is this college your:First choice? 52.1 57.1 67.7 51.2 63.1 59.9 38.9 65.1 68.7 70.3Second choice? 31.2 30.1 24.4 32.0 26.1 28.0 31.0 24.6 21.8 20.2Third choice? 11.2 8.7 5.6 11.2 8.0 8.3 17.2 7.2 6.1 6.4Less than third choice? 5.5 4.1 2.3 5.6 2.8 3.8 12.9 3.1 3.3 3.1
Citizenship status:U.S. citizen 97.1 97.8 98.3 96.8 97.6 98.1 98.2 97.9 97.8 96.4Permanent resident (green card) 2.0 1.9 1.2 2.4 1.5 1.2 1.0 0.5 0.7 1.0Neither 0.9 0.4 0.5 0.9 0.8 0.7 0.8 1.6 1.5 2.6
Are you a veteran?No 99.5 99.6 99.6 99.4 99.8 99.7 99.1 99.6 99.7 99.8Yes 0.5 0.4 0.4 0.6 0.2 0.3 0.9 0.4 0.3 0.2
Are your parents:Both alive and living with each other? 55.9 66.6 71.6 55.0 71.3 77.3 46.0 69.2 71.8 78.5Both alive, divorced or living apart? 38.7 29.2 25.1 39.5 24.5 19.6 46.7 26.5 24.4 18.4One or both deceased? 5.4 4.2 3.3 5.5 4.2 3.1 7.3 4.3 3.7 3.1
2009 CIRP Freshman SurveyWeighted National Norms—Public, Catholic, and Other Religious 4-year Colleges by Selectivity
Public 4-year Colleges Catholic 4-year Colleges Other Religious 4-year CollegesLow Medium High Low Medium High Very Low Low Medium High
118

Have you had any special tutoring or remedialwork in any of the following subjects?
English 10.1 7.7 5.6 10.8 8.6 6.5 12.0 8.7 6.7 6.3Reading 9.3 7.1 5.1 10.2 8.2 5.8 10.9 7.4 6.7 5.5Mathematics 16.2 16.8 13.5 19.6 15.2 18.0 17.3 15.7 15.1 15.3Social Studies 7.1 4.7 3.4 7.6 5.5 3.6 8.7 5.1 4.8 3.9Science 7.7 6.1 4.9 8.7 7.0 6.2 9.3 6.8 6.5 6.5Foreign Language 7.4 5.9 5.2 7.7 7.4 6.3 8.8 6.8 6.2 6.3Writing 7.9 6.2 4.7 8.0 6.8 5.4 9.4 6.3 5.4 5.5
Do you feel you will need any special tutoring orremedial work in any of the following subjects?
English 16.6 8.7 7.6 11.0 9.7 6.7 16.8 10.8 9.5 7.3Reading 8.7 5.0 3.9 6.7 5.2 3.9 7.1 5.2 4.7 4.1Mathematics 38.7 26.8 22.8 29.8 27.8 23.5 41.6 26.8 23.0 19.7Social Studies 7.8 3.6 3.3 5.2 4.3 2.7 10.5 4.2 4.1 2.6Science 17.6 10.7 11.4 17.2 17.2 11.2 19.9 15.4 11.9 10.7Foreign Language 14.6 9.9 12.7 12.4 15.8 11.6 20.6 15.5 12.9 13.7Writing 18.4 11.3 10.0 14.2 14.3 9.8 19.8 13.6 12.2 11.0
How many Advanced Placement courses did youtake in high school?
Not offered at my high school 5.5 4.1 4.9 6.6 5.9 4.2 7.9 8.0 9.5 7.7None 37.7 46.3 25.2 48.7 38.3 26.9 52.9 37.2 33.5 17.41 to 4 48.4 45.9 54.3 39.8 48.4 56.4 35.4 47.6 48.6 53.75 to 9 7.1 3.4 14.5 4.3 6.8 11.8 3.2 6.5 7.7 19.010 to 14 0.9 0.3 1.0 0.3 0.6 0.5 0.4 0.4 0.4 1.915+ 0.3 0.0 0.1 0.2 0.1 0.1 0.1 0.2 0.3 0.3
How many Advanced Placement exams did youtake in high school?
Not offered at my high school 6.5 4.7 5.3 7.1 6.8 4.3 9.2 9.2 10.7 7.7None 47.6 55.6 33.2 56.5 49.1 34.5 60.8 48.3 42.5 25.01 to 4 40.6 37.3 49.6 32.8 39.3 51.5 27.9 38.7 40.6 50.55 to 9 4.8 2.2 11.2 3.2 4.3 9.4 1.8 3.6 5.8 15.410 to 14 0.3 0.1 0.6 0.3 0.3 0.3 0.2 0.1 0.3 1.215+ 0.1 0.1 0.1 0.1 0.1 0.0 0.1 0.1 0.2 0.1
What is the highest academic degree that youintend to obtain?—Highest Planned
None 1.6 0.9 0.7 1.5 0.8 0.8 2.7 1.4 0.7 0.5Vocational certificate 0.1 0.1 0.1 0.1 0.3 0.1 0.5 0.1 0.3 0.1Associate (A.A. or equivalent) 0.7 0.6 0.5 1.2 0.3 0.4 1.8 0.6 1.0 0.3Bachelor’s degree (B.A., B.S., etc.) 26.5 28.8 23.6 21.2 19.4 18.3 21.8 29.5 25.9 21.2Master’s degree (M.A., M.S., etc.) 41.4 46.7 46.7 36.9 45.5 46.4 38.4 39.9 42.1 40.2Ph.D. or Ed.D. 18.4 13.8 16.4 20.0 17.9 16.2 19.6 16.1 16.2 20.3M.D., D.O., D.D.S., or D.V.M. 6.1 5.1 7.1 14.1 10.6 9.8 6.9 7.8 7.9 10.7J.D. (Law) 3.0 2.8 3.5 2.9 3.2 6.5 4.9 2.5 3.8 5.0B.D. or M.DIV. (Divinity) 0.4 0.2 0.2 0.2 0.2 0.2 1.0 0.6 0.5 0.5Other 1.7 1.1 1.2 1.8 1.8 1.2 2.4 1.5 1.7 1.2
2009 CIRP Freshman SurveyWeighted National Norms—Public, Catholic, and Other Religious 4-year Colleges by Selectivity
Public 4-year Colleges Catholic 4-year Colleges Other Religious 4-year CollegesLow Medium High Low Medium High Very Low Low Medium High
119

What is the highest academic degree that youintend to obtain?—Highest Planned at This College
None 2.5 1.8 1.6 1.1 1.3 0.9 4.0 1.3 1.5 0.7Vocational certificate 0.4 0.2 0.2 0.3 0.3 0.1 0.6 0.2 0.3 0.2Associate (A.A. or equivalent) 3.0 3.5 2.1 4.4 1.5 1.3 4.9 2.0 4.1 0.9Bachelor’s degree (B.A., B.S., etc.) 64.5 67.8 74.6 66.6 59.0 71.0 68.0 75.1 71.9 85.4Master’s degree (M.A., M.S., etc.) 22.7 22.2 18.3 17.3 29.7 21.6 14.8 16.0 16.6 10.0Ph.D. or Ed.D. 3.7 2.0 1.8 5.8 5.2 2.6 3.0 2.8 2.8 1.3M.D., D.O., D.D.S., or D.V.M. 1.0 0.9 0.4 2.1 1.6 0.8 0.9 0.6 0.6 0.5J.D. (Law) 0.5 0.2 0.2 0.6 0.1 0.5 0.8 0.2 0.6 0.3B.D. or M.DIV. (Divinity) 0.3 0.1 0.1 0.0 0.0 0.1 0.6 0.2 0.2 0.1Other 1.5 1.2 0.8 1.8 1.3 0.9 2.4 1.6 1.3 0.7
How would you describe the racial composition ofthe high school you last attended?
Completely non-White 9.8 2.2 1.2 8.8 2.8 1.4 8.9 1.4 1.5 1.7Mostly non-White 27.0 9.7 7.8 22.3 8.9 6.1 23.6 8.4 8.1 7.6Roughly half non-White 28.7 24.5 26.9 27.1 21.0 16.9 35.4 25.9 25.7 20.9Mostly White 30.8 55.4 56.7 37.2 58.7 66.1 28.6 55.8 55.2 61.3Completely White 3.7 8.2 7.4 4.6 8.6 9.6 3.5 8.5 9.5 8.5
How would you describe the racial composition ofthe neighborhood where you grew up?
Completely non-White 16.9 3.9 2.2 15.9 5.1 2.4 18.7 3.6 3.2 3.3Mostly non-White 23.0 9.1 7.0 22.1 9.1 6.2 23.1 8.0 8.0 6.2Roughly half non-White 19.0 14.0 12.5 17.9 12.4 10.3 17.4 13.5 13.7 10.7Mostly White 31.1 52.0 57.4 32.4 51.3 55.8 29.4 52.7 52.1 56.2Completely White 10.0 20.9 20.8 11.8 22.1 25.2 11.4 22.3 23.0 23.7
HOW MUCH OF YOUR FIRST YEAR’S EDUCATIONALEXPENSES (ROOM, BOARD, TUITION, AND FEES) DO YOU EXPECT TO COVER FROM:Family resources (parents, relatives, spouse, etc.)
None 33.8 23.6 30.8 26.1 20.2 15.9 29.7 22.9 21.8 13.1Less than $1,000 19.9 12.1 11.2 16.1 13.5 7.4 20.2 14.2 12.9 7.3$1,000–$2,999 17.3 15.6 13.5 17.5 16.2 9.6 18.2 16.1 15.8 10.0$3,000–$5,999 11.0 14.1 13.3 14.2 16.8 10.5 13.0 14.6 13.9 11.6$6,000–$9,999 6.5 12.1 11.3 8.9 12.5 10.7 7.7 12.5 12.1 12.3$10,000 + 11.5 22.5 19.9 17.1 20.8 46.0 11.2 19.6 23.4 45.7
My own resources (savings from work, work-study, other income)
None 44.6 34.0 46.5 38.4 30.4 33.6 41.4 35.1 35.2 32.4Less than $1,000 30.4 28.0 26.1 28.2 27.6 22.9 27.5 28.7 26.8 24.8$1,000–$2,999 17.0 24.2 17.7 22.2 26.6 25.7 20.9 23.2 23.8 24.9$3,000–$5,999 5.7 8.8 6.3 6.8 10.0 10.3 6.5 8.3 8.2 10.6$6,000–$9,999 1.3 2.6 1.8 2.0 3.0 4.0 2.4 2.2 3.1 3.8$10,000 + 1.0 2.3 1.6 2.3 2.5 3.6 1.2 2.5 2.8 3.4
2009 CIRP Freshman SurveyWeighted National Norms—Public, Catholic, and Other Religious 4-year Colleges by Selectivity
Public 4-year Colleges Catholic 4-year Colleges Other Religious 4-year CollegesLow Medium High Low Medium High Very Low Low Medium High
120

HOW MUCH OF YOUR FIRST YEAR’S EDUCATIONALEXPENSES (ROOM, BOARD, TUITION, AND FEES) DO YOU EXPECT TO COVER FROM:Aid which need not be repaid (grants,scholarships, military funding, etc.)
None 35.7 37.2 33.0 20.7 12.9 21.9 18.7 15.5 13.7 17.9Less than $1,000 7.3 10.5 7.1 4.2 2.9 3.1 4.8 3.3 2.7 2.6$1,000–$2,999 15.1 16.8 14.9 10.5 8.6 6.7 9.5 9.2 8.5 7.0$3,000–$5,999 18.4 16.5 15.2 13.3 11.6 9.1 16.3 13.1 12.8 8.8$6,000–$9,999 11.0 9.2 9.3 15.1 15.5 11.3 15.6 16.1 15.5 11.6$10,000 + 12.5 9.8 20.6 36.2 48.5 47.9 35.1 42.8 46.9 52.0
Aid which must be repaid (loans, etc.)None 55.8 42.6 57.2 31.1 29.8 38.5 30.6 31.4 33.4 41.9Less than $1,000 5.7 4.7 3.5 4.9 4.1 2.6 7.1 3.5 3.8 2.4$1,000–$2,999 11.8 12.1 9.4 10.6 12.2 8.5 14.4 11.6 10.1 8.7$3,000–$5,999 16.0 18.8 13.9 21.1 24.3 19.2 22.5 22.4 20.7 18.7$6,000–$9,999 5.7 10.4 8.1 14.6 15.4 12.7 13.2 15.2 14.2 13.1$10,000 + 5.0 11.4 7.9 17.7 14.3 18.4 12.1 16.0 17.8 15.2
Other than aboveNone 93.2 92.8 94.9 91.9 90.2 92.2 89.6 91.7 92.1 93.3Less than $1,000 2.8 3.1 2.0 2.9 3.3 2.2 3.6 2.8 2.8 2.3$1,000–$2,999 1.6 1.7 1.0 1.7 2.1 1.7 2.7 2.0 1.6 1.4$3,000–$5,999 1.2 1.0 0.7 1.3 1.4 1.2 1.7 1.0 1.2 0.9$6,000–$9,999 0.5 0.6 0.4 0.9 1.1 0.9 0.9 1.0 0.9 0.7$10,000 + 0.7 0.8 1.0 1.2 2.0 1.8 1.5 1.5 1.4 1.5
What is your best estimate of your parents’ totalincome last year?
Less than $10,000 9.6 3.9 2.5 8.7 4.5 2.2 12.6 4.6 3.7 2.5$10,000 to $14,999 7.0 2.9 2.1 4.9 2.4 1.4 6.9 3.4 3.0 1.8$15,000 to $19,999 5.2 2.9 2.0 4.8 3.0 1.5 4.7 2.6 3.0 1.6$20,000 to $24,999 7.4 3.9 2.7 6.9 3.9 2.3 7.3 4.5 3.9 2.6$25,000 to $29,999 5.6 4.0 3.0 6.2 3.7 2.3 5.8 4.0 4.4 2.5$30,000 to $39,999 9.4 6.5 5.0 9.9 6.7 4.4 10.2 8.1 7.3 4.9$40,000 to $49,999 8.9 8.6 6.5 10.5 8.6 6.1 9.2 9.3 9.5 6.6$50,000 to $59,999 8.4 9.7 8.5 8.7 11.6 7.6 11.1 11.5 10.5 8.2$60,000 to $74,999 9.7 12.0 11.9 10.5 14.0 10.4 11.1 13.3 13.4 11.7$75,000 to $99,999 10.7 15.7 16.0 11.5 15.2 14.3 9.6 14.8 14.6 14.8$100,000 to $149,999 9.7 17.5 21.0 9.6 14.4 19.8 6.2 13.6 14.6 18.3$150,000 to $199,999 3.8 6.5 8.9 3.9 6.5 10.2 2.8 4.8 5.4 8.6$200,000 to $249,999 1.8 2.9 4.5 1.9 2.3 6.6 1.2 2.2 2.6 5.8$250,000 or more 2.8 3.0 5.3 1.9 3.2 11.0 1.5 3.4 4.1 10.2
Do you have any concern about your ability tofinance your college education?
None (I am confident that I will have sufficient funds) 28.6 29.3 44.0 23.9 29.3 34.4 29.6 30.8 31.5 33.1Some (but I probably will have enough funds) 56.0 58.8 47.9 58.1 58.2 55.9 53.4 55.8 56.9 57.0Major (not sure I will have enough funds to complete
college) 15.4 11.9 8.1 18.0 12.5 9.7 17.0 13.4 11.6 10.0
2009 CIRP Freshman SurveyWeighted National Norms—Public, Catholic, and Other Religious 4-year Colleges by Selectivity
Public 4-year Colleges Catholic 4-year Colleges Other Religious 4-year CollegesLow Medium High Low Medium High Very Low Low Medium High
121

Your current religious preference:Baptist 22.5 7.5 14.3 16.3 4.8 2.8 43.7 24.4 16.1 8.6Buddhist 0.8 0.7 0.6 0.9 0.4 0.5 0.3 0.2 0.3 0.7Church of Christ 8.6 5.8 3.9 5.0 4.0 3.0 7.4 5.2 12.2 2.9Eastern Orthodox 0.4 0.8 0.5 0.5 0.7 0.9 0.0 0.3 0.4 0.4Episcopalian 0.6 1.0 1.7 0.8 0.4 1.2 0.9 0.8 0.6 2.5Hindu 0.2 0.4 0.3 0.3 0.5 0.2 0.1 0.1 0.2 0.4Jewish 1.0 2.0 1.8 0.3 0.2 0.5 0.2 0.5 0.5 1.8LDS (Mormon) 0.3 0.1 0.6 0.1 0.0 0.1 0.1 0.2 0.2 0.3Lutheran 1.3 2.7 4.2 1.2 2.9 2.7 0.5 3.4 8.5 8.6Methodist 3.2 2.5 7.1 2.1 4.3 1.8 6.8 7.9 8.0 6.4Muslim 0.6 1.1 0.5 1.2 3.2 0.4 0.4 0.1 0.4 0.7Presbyterian 1.2 2.1 3.5 0.7 1.8 1.7 2.4 4.5 3.2 7.0Quaker 0.1 0.1 0.2 0.1 0.2 0.2 0.0 0.4 0.2 0.5Roman Catholic 23.4 30.8 24.3 44.9 52.2 61.9 5.7 15.5 16.5 14.0Seventh Day Adventist 0.4 0.2 0.2 0.7 0.2 0.2 0.6 0.2 0.3 0.1United Church of Christ/Congregational 0.3 1.1 0.6 0.6 0.9 0.7 0.8 0.9 1.0 1.1Other Christian 15.4 11.4 14.5 9.4 9.6 6.7 18.6 22.7 18.5 23.6Other Religion 3.0 3.1 2.4 2.5 2.3 1.7 2.9 2.0 2.4 2.7None 16.6 26.4 18.9 12.5 11.3 12.8 8.8 10.8 10.5 17.5
Father’s current religious preference:Baptist 20.5 7.8 15.4 16.2 5.1 3.3 42.5 23.3 15.5 9.4Buddhist 1.3 0.6 0.6 0.8 0.3 0.6 0.5 0.2 0.3 0.7Church of Christ 7.8 6.5 4.1 4.4 3.9 3.1 6.0 4.8 11.2 2.7Eastern Orthodox 0.7 0.9 0.7 0.7 1.1 1.0 0.2 0.4 0.5 0.6Episcopalian 0.6 1.2 1.8 0.7 0.6 1.5 0.8 0.9 0.7 3.0Hindu 0.2 0.5 0.3 0.4 0.6 0.3 0.0 0.2 0.3 0.5Jewish 1.5 2.6 2.5 0.6 0.4 1.4 0.2 0.6 0.7 2.6LDS (Mormon) 0.3 0.2 0.6 0.0 0.1 0.2 0.2 0.2 0.1 0.2Lutheran 1.7 3.1 4.9 1.4 3.3 3.4 0.6 4.5 9.6 9.3Methodist 3.1 3.3 7.7 2.5 4.7 2.1 6.3 7.7 7.9 6.9Muslim 1.3 1.5 0.7 2.3 3.4 0.7 1.3 0.3 0.6 1.0Presbyterian 1.3 2.6 4.2 0.9 2.3 2.3 2.8 4.7 3.6 7.6Quaker 0.1 0.1 0.2 0.2 0.2 0.3 0.1 0.3 0.2 0.4Roman Catholic 27.8 35.6 27.7 45.2 52.6 61.3 7.1 17.4 19.3 17.5Seventh Day Adventist 0.6 0.3 0.3 0.8 0.3 0.3 0.4 0.3 0.3 0.3United Church of Christ/Congregational 0.4 1.1 0.6 0.6 0.7 0.6 0.7 0.8 1.0 1.2Other Christian 14.1 11.7 13.1 8.8 8.9 6.6 15.5 20.5 15.8 21.0Other Religion 2.6 2.3 1.5 2.3 1.8 1.3 2.0 1.3 1.8 1.8None 13.9 18.2 13.1 11.3 9.6 9.8 12.6 11.6 10.5 13.1
2009 CIRP Freshman SurveyWeighted National Norms—Public, Catholic, and Other Religious 4-year Colleges by Selectivity
Public 4-year Colleges Catholic 4-year Colleges Other Religious 4-year CollegesLow Medium High Low Medium High Very Low Low Medium High
122

Mother’s current religious preference:Baptist 22.0 8.4 15.5 17.3 5.1 3.5 45.2 24.5 16.6 9.8Buddhist 1.3 0.7 0.6 1.1 0.3 0.5 0.2 0.3 0.2 0.8Church of Christ 8.6 7.1 4.4 5.2 4.4 3.6 7.2 5.2 12.2 3.0Eastern Orthodox 0.6 0.9 0.6 0.5 0.7 0.9 0.1 0.4 0.5 0.5Episcopalian 0.8 1.6 2.1 1.0 0.5 1.5 0.9 0.9 1.0 3.4Hindu 0.2 0.5 0.3 0.4 0.6 0.2 0.0 0.2 0.3 0.5Jewish 1.5 2.5 2.2 0.5 0.3 0.8 0.2 0.4 0.6 2.3LDS (Mormon) 0.5 0.3 0.7 0.1 0.1 0.1 0.2 0.3 0.2 0.3Lutheran 1.6 3.7 5.3 1.5 3.7 3.1 0.7 4.4 10.0 9.8Methodist 3.6 3.3 8.8 2.5 4.8 2.5 6.7 8.8 8.8 7.6Muslim 0.8 1.2 0.6 1.2 3.3 0.5 0.7 0.2 0.4 0.7Presbyterian 1.6 2.7 4.5 1.1 2.3 2.4 2.9 5.0 3.9 8.2Quaker 0.1 0.1 0.2 0.1 0.2 0.3 0.1 0.3 0.2 0.4Roman Catholic 28.7 37.3 28.7 48.5 55.6 65.2 7.3 17.8 19.7 18.4Seventh Day Adventist 0.5 0.3 0.3 0.8 0.3 0.3 0.5 0.3 0.4 0.2United Church of Christ/Congregational 0.4 1.4 0.7 0.6 0.8 0.8 0.9 0.9 1.1 1.4Other Christian 16.0 12.7 14.1 9.5 9.4 6.9 17.7 21.6 16.8 22.1Other Religion 2.6 2.2 1.6 2.2 1.7 1.4 2.5 1.4 1.7 2.0None 8.5 13.2 8.7 5.9 5.9 5.6 6.1 7.1 5.2 8.5
For the activities below, indicate which ones you“frequently” or “occasionally” did during the past year:
Attended a religious service 75.6 67.4 78.0 81.7 82.9 84.8 88.4 85.3 86.5 83.1Was bored in class* 35.0 38.0 42.9 27.3 35.1 36.1 35.1 38.1 38.0 36.1Participated in political demonstrations 27.7 24.3 22.4 27.9 27.0 26.2 33.3 24.8 24.9 27.1Tutored another student 50.7 43.3 54.4 52.7 51.6 52.5 48.6 49.9 51.4 54.8Studied with other students 85.9 84.2 86.6 85.8 87.4 89.7 84.5 85.9 85.8 89.1Was a guest in a teacher’s home 19.7 17.4 21.3 15.6 18.5 19.0 24.0 27.1 27.0 29.6Smoked cigarettes* 4.8 5.9 4.6 4.8 4.6 3.2 5.4 3.1 3.1 3.1Drank beer 32.0 42.5 39.6 30.7 38.1 51.6 24.7 28.7 28.1 34.4Drank wine or liquor 39.8 46.8 43.9 39.7 42.4 54.2 37.1 32.7 33.0 40.3Felt overwhelmed by all I had to do* 25.7 27.7 26.5 28.0 31.0 29.0 26.6 29.1 29.3 31.0Felt depressed* 7.4 7.3 5.0 6.8 6.9 5.1 10.4 6.8 6.7 6.5Performed volunteer work 78.3 80.3 84.8 84.0 84.5 90.4 81.2 84.4 87.2 90.9Played a musical instrument 39.6 39.0 42.8 34.6 37.7 38.7 37.5 43.3 45.0 55.6Asked a teacher for advice after class* 28.3 24.7 25.2 30.3 25.6 29.0 27.2 26.5 26.7 32.3Voted in a student election* 21.8 19.8 19.8 24.5 20.2 24.7 28.6 21.8 21.0 23.2Socialized with someone of another racial/ethnic
group* 68.1 65.9 69.9 74.6 61.6 63.4 74.3 66.8 66.5 67.4Came late to class 59.4 60.0 57.2 52.4 49.3 54.8 57.3 53.4 54.7 55.4Used the Internet:
For research or homework* 69.8 72.7 75.8 76.9 78.3 81.8 71.1 71.7 72.9 79.5To read news sites* 39.1 40.2 40.4 47.3 41.5 44.7 40.1 34.4 36.7 41.5To read blogs* 25.3 25.2 22.9 30.5 26.6 23.7 27.4 23.2 24.5 23.4To blog* 15.6 14.9 13.0 18.2 15.6 12.7 18.2 15.2 15.4 13.1
*responses for “frequently” only
2009 CIRP Freshman SurveyWeighted National Norms—Public, Catholic, and Other Religious 4-year Colleges by Selectivity
Public 4-year Colleges Catholic 4-year Colleges Other Religious 4-year CollegesLow Medium High Low Medium High Very Low Low Medium High
123

For the activities below, indicate which ones you“frequently” or “occasionally” did during the past year:
Performed community service as part of a class 56.9 56.5 57.0 65.7 64.4 68.3 58.4 57.8 62.0 62.5Discussed religion* 25.9 23.2 32.4 29.9 30.1 34.3 32.2 35.3 38.5 43.6Discussed politics* 23.9 26.9 34.0 25.7 29.9 36.0 26.2 27.1 29.6 39.8Skipped school/class* 3.4 2.5 2.4 1.9 2.3 2.0 3.2 2.5 2.7 2.3
*responses for “frequently” onlyStudent rated self as “Highest 10%” or “AboveAverage” as compared with the average persontheir age:
Academic ability 52.5 55.7 71.6 52.3 64.2 70.3 47.7 59.7 64.4 77.9Artistic ability 26.9 28.2 26.6 22.5 23.6 23.5 22.7 24.3 26.4 34.2Computer skills 39.0 38.6 37.3 39.5 36.2 35.5 39.9 34.4 35.0 33.6Cooperativeness 67.3 73.5 75.7 73.6 74.7 77.7 69.9 73.8 74.3 77.0Creativity 52.7 55.7 53.0 51.6 51.3 52.1 55.9 50.7 52.8 59.8Drive to achieve 71.4 68.2 75.1 76.4 76.5 76.4 74.1 74.4 74.3 76.7Emotional health 49.3 50.8 57.4 50.3 52.8 56.7 51.8 54.7 54.0 56.4Leadership ability 57.1 56.5 64.2 57.3 60.0 64.0 63.7 61.6 62.3 63.7Mathematical ability 32.3 32.3 45.5 31.9 37.3 39.8 30.6 36.4 38.9 43.3Physical health 49.0 52.8 58.5 52.0 55.4 61.1 53.2 58.8 54.7 56.3Popularity 37.1 37.1 38.2 36.7 36.8 41.6 44.4 37.9 36.5 36.8Public speaking ability 33.0 32.6 36.7 30.6 34.2 38.2 33.2 34.1 36.2 42.2Self-confidence (intellectual) 57.2 51.8 60.2 55.8 55.1 57.1 64.0 56.3 57.8 62.6Self-confidence (social) 55.0 49.6 52.6 51.8 50.4 51.8 60.7 50.9 50.8 49.9Self-understanding 57.2 54.2 58.6 56.1 54.0 55.8 61.6 55.4 55.9 61.6Spirituality 42.6 32.2 40.9 39.3 39.2 38.0 49.2 47.2 48.9 48.1Understanding of others 64.0 67.2 66.9 65.6 67.3 68.4 65.6 67.0 66.8 70.5Writing ability 38.6 43.0 45.6 39.2 42.1 47.6 39.3 40.2 42.7 53.7Ability to see the world from someone else’s
perspective 59.6 63.1 65.0 59.2 60.7 64.9 57.4 58.8 61.0 69.6Tolerance of others with different beliefs 64.9 69.6 72.6 68.9 69.7 72.9 61.9 63.5 66.2 75.5Openness to having my own views challenged 57.2 56.3 56.6 56.6 56.6 57.3 54.9 51.5 52.6 59.4Ability to discuss and negotiate controversial issues 57.7 60.4 63.6 57.2 58.8 61.9 57.9 55.0 56.8 63.7Ability to work cooperatively with diverse people 72.8 76.5 78.8 75.3 76.0 78.6 75.0 72.8 73.9 79.9
What is the highest level of formal educationobtained by your father?
Grammar school or less 11.7 3.6 2.2 8.9 4.7 2.5 6.4 2.9 3.0 1.6Some high school 11.4 5.8 3.8 9.4 6.1 3.2 13.4 4.9 4.3 2.4High school graduate 26.5 26.8 18.3 30.4 26.7 15.7 36.3 28.3 24.2 12.4Postsecondary school other than college 3.0 4.2 3.8 3.9 5.0 3.3 3.1 4.4 4.5 3.0Some college 18.1 16.3 15.1 16.0 15.5 14.0 15.6 17.7 17.3 12.0College degree 17.9 27.3 31.8 19.2 26.3 32.1 16.7 26.9 27.1 31.7Some graduate school 0.9 1.4 2.2 1.3 1.4 2.8 1.2 1.4 2.0 3.1Graduate degree 10.5 14.6 22.8 10.9 14.4 26.3 7.3 13.5 17.6 33.8
2009 CIRP Freshman SurveyWeighted National Norms—Public, Catholic, and Other Religious 4-year Colleges by Selectivity
Public 4-year Colleges Catholic 4-year Colleges Other Religious 4-year CollegesLow Medium High Low Medium High Very Low Low Medium High
124

What is the highest level of formal educationobtained by your mother?
Grammar school or less 10.7 3.1 1.9 7.2 4.7 2.4 5.9 2.7 2.6 1.5Some high school 8.9 4.1 2.6 7.0 3.8 1.8 6.7 3.3 2.8 1.6High school graduate 22.8 22.9 16.9 25.6 25.5 14.9 28.4 24.5 21.3 11.3Postsecondary school other than college 3.2 4.4 3.5 4.9 4.8 3.8 3.7 4.8 3.7 3.1Some college 21.3 18.3 18.1 16.7 17.0 15.4 21.6 20.0 19.6 14.1College degree 21.2 30.6 36.0 24.6 28.8 37.4 22.5 30.6 33.3 39.6Some graduate school 1.5 2.2 2.7 2.1 2.3 3.4 2.2 2.1 2.3 4.0Graduate degree 10.5 14.4 18.3 11.9 13.2 20.9 9.1 12.1 14.2 24.9
During the past year, did you “frequently”:Ask questions in class 48.6 50.2 54.6 52.4 51.6 57.3 52.1 48.6 51.5 58.4Support your opinions with a logical argument 45.3 52.5 59.5 46.6 52.1 58.8 47.8 47.0 51.6 63.4Seek solutions to problems and explain them to others 42.8 45.7 51.7 45.8 46.8 50.8 44.2 41.6 45.7 56.4Revise your papers to improve your writing 40.8 41.9 44.8 48.6 48.0 50.0 45.0 42.3 45.0 53.6Evaluate the quality or reliability of information you
received 31.4 31.7 36.0 34.9 34.3 36.0 32.5 30.2 34.0 41.8Take a risk because you feel you have more to gain 38.9 39.0 39.8 39.0 39.3 39.6 41.8 38.0 36.1 38.3Seek alternative solutions to a problem 42.1 42.0 44.1 45.4 42.1 43.4 42.9 38.7 41.8 45.6Look up scientific research articles and resources 19.0 18.0 20.6 22.6 21.0 21.7 18.8 17.2 18.1 22.4Explore topics on your own, even though it was not
required for a class 27.2 27.9 30.2 29.2 26.7 27.4 26.5 23.0 27.8 34.0Accept mistakes as part of the learning process 52.2 50.1 51.5 54.1 48.7 49.8 56.0 48.1 48.8 51.5Seek feedback on your academic work 44.5 43.3 46.2 49.0 47.6 49.1 48.1 42.6 44.6 51.1Take notes during class 62.8 63.2 64.9 74.9 73.9 73.2 71.4 67.4 66.2 69.1Work with other students on class assignments 53.3 54.3 53.9 55.6 54.8 56.0 52.5 52.1 51.0 52.9
2009 CIRP Freshman SurveyWeighted National Norms—Public, Catholic, and Other Religious 4-year Colleges by Selectivity
Public 4-year Colleges Catholic 4-year Colleges Other Religious 4-year CollegesLow Medium High Low Medium High Very Low Low Medium High
125

Your probable career occupation:Accountant or actuary 2.5 1.9 2.2 2.5 3.0 3.9 2.3 3.2 2.8 1.6Actor or entertainer 1.7 1.9 1.2 0.6 0.6 0.7 1.7 1.3 1.2 2.4Architect or urban planner 0.6 0.8 0.3 0.2 1.2 0.1 0.6 0.4 0.3 0.3Artist 2.0 3.0 1.6 1.4 1.8 0.8 1.8 1.8 2.4 2.2Business (clerical) 0.8 0.6 0.6 0.6 0.5 0.9 1.0 0.5 0.6 0.5Business executive (management, administrator) 5.2 5.1 5.2 4.2 5.4 9.5 6.4 4.4 6.0 5.9Business owner or proprietor 2.7 2.4 2.5 2.0 2.3 3.5 3.9 2.3 2.8 2.4Business salesperson or buyer 0.6 0.7 0.9 0.8 1.0 1.4 0.2 0.8 0.6 0.4Clergy (minister, priest) 0.1 0.1 0.1 0.0 0.1 0.1 0.7 1.0 1.3 0.5Clergy (other religious) 0.0 0.0 0.1 0.1 0.0 0.1 0.4 0.4 0.5 0.3Clinical psychologist 1.6 1.8 1.4 1.7 1.9 1.7 2.4 1.5 1.5 1.6College administrator/staff 0.1 0.0 0.0 0.0 0.1 0.1 0.1 0.1 0.1 0.1College teacher 0.3 0.3 0.4 0.1 0.4 0.3 0.4 0.4 0.6 1.1Computer programmer or analyst 2.3 1.5 1.8 0.7 2.0 1.0 2.9 1.4 1.6 1.0Conservationist or forester 0.2 0.3 0.3 0.1 0.1 0.1 0.5 0.2 0.2 0.4Dentist (including orthodontist) 1.2 0.8 1.0 1.4 1.4 1.1 0.9 1.2 1.1 0.9Dietitian or nutritionist 0.4 0.8 0.3 0.1 1.2 0.3 0.2 0.6 0.2 0.4Engineer 5.2 3.1 7.9 1.0 1.3 4.3 1.6 2.2 2.2 3.7Farmer or rancher 0.9 0.1 0.1 0.0 0.0 0.2 0.5 0.4 0.2 0.2Foreign service worker (including diplomat) 0.1 0.2 0.9 0.1 0.4 0.8 0.2 0.5 0.6 1.8Homemaker (full-time) 0.0 0.0 0.1 0.0 0.1 0.1 0.0 0.2 0.2 0.1Interior decorator (including designer) 0.2 0.3 0.1 0.4 0.4 0.2 0.2 0.6 0.1 0.2Lab technician or hygienist 0.2 0.2 0.2 0.3 0.2 0.1 0.4 0.2 0.3 0.1Law enforcement officer 2.4 3.0 1.5 1.6 1.8 0.9 3.8 2.1 1.6 0.4Lawyer (attorney) or judge 3.1 2.2 2.6 2.7 2.7 5.2 5.2 2.3 3.0 3.9Military service (career) 0.5 0.4 9.5 0.1 0.3 0.7 0.5 0.5 0.8 0.4Musician (performer, composer) 2.5 1.9 1.4 1.3 0.6 0.6 1.6 1.7 2.2 4.3Nurse 7.4 5.0 6.6 22.2 11.1 5.0 4.7 5.7 5.4 3.2Optometrist 0.5 0.2 0.3 0.4 0.4 0.2 0.2 0.2 0.2 0.3Pharmacist 1.9 1.2 1.3 7.2 2.6 1.1 1.5 2.5 4.6 0.8Physician 3.1 3.4 4.2 9.0 8.4 7.8 4.3 5.3 5.2 7.9Policymaker/Government 0.5 0.6 0.9 0.6 0.7 1.4 0.6 1.0 0.7 1.5School counselor 0.6 0.5 0.3 0.5 0.5 0.5 0.8 0.4 0.5 0.3School principal or superintendent 0.1 0.1 0.1 0.0 0.0 0.0 0.2 0.1 0.1 0.0Scientific researcher 1.1 1.3 2.1 0.9 1.5 1.5 0.9 1.3 1.8 2.9Social, welfare, or recreation worker 2.1 1.3 0.9 1.3 1.3 1.2 2.2 1.4 1.2 1.3Therapist (physical, occupational, speech) 4.1 4.2 3.5 2.7 7.1 4.3 4.2 5.5 4.1 3.6Teacher or administrator (elementary) 5.4 8.9 5.2 3.9 6.1 5.2 7.8 8.1 7.7 3.9Teacher or administrator (secondary) 5.2 8.1 5.3 2.7 6.0 4.6 5.2 8.0 7.7 5.4Veterinarian 1.6 0.5 0.9 0.6 0.7 0.7 1.7 1.9 0.9 1.1Writer or journalist 2.1 3.0 2.1 1.5 2.8 2.9 2.4 2.2 2.6 3.9Skilled trades 0.2 0.5 0.2 0.1 0.3 0.2 0.6 0.3 0.1 0.2Laborer (unskilled) 0.2 0.5 0.3 0.2 0.3 0.3 0.1 0.3 0.3 0.2Semi-skilled worker 0.2 0.2 0.3 0.1 0.1 0.3 0.2 0.1 0.2 0.1Unemployed 2.5 1.1 1.1 2.2 1.4 1.0 1.9 1.7 1.4 1.0Other 10.3 10.3 7.1 9.5 8.3 6.8 11.0 10.6 9.3 8.3Undecided 13.6 15.3 13.3 10.2 9.8 16.4 8.8 11.2 10.6 17.1
2009 CIRP Freshman SurveyWeighted National Norms—Public, Catholic, and Other Religious 4-year Colleges by Selectivity
Public 4-year Colleges Catholic 4-year Colleges Other Religious 4-year CollegesLow Medium High Low Medium High Very Low Low Medium High
126

Your father’s occupation:Accountant or actuary 1.5 2.3 2.7 2.5 2.7 4.1 1.3 1.9 2.2 3.0Actor or entertainer 0.2 0.1 0.1 0.1 0.2 0.0 0.1 0.1 0.1 0.1Architect or urban planner 1.0 1.0 1.0 0.5 0.9 0.9 1.1 0.8 0.8 1.2Artist 0.3 0.4 0.3 0.1 0.1 0.2 0.3 0.1 0.4 0.6Business (clerical) 1.4 1.6 1.4 1.1 1.6 1.4 1.2 0.9 1.0 1.3Business executive (management, administrator) 6.2 9.0 11.6 6.8 9.1 15.0 5.5 9.1 8.9 12.6Business owner or proprietor 7.1 8.3 8.5 6.8 7.7 9.8 6.8 7.3 8.4 8.9Business salesperson or buyer 3.2 4.5 5.4 3.3 4.5 6.2 2.5 4.4 3.9 4.6Clergy (minister, priest) 0.4 0.2 0.7 0.4 0.3 0.2 1.3 1.9 2.4 2.6Clergy (other religious) 0.1 0.0 0.1 0.1 0.1 0.0 0.1 0.3 0.4 0.4Clinical psychologist 0.0 0.1 0.1 0.1 0.1 0.1 0.1 0.1 0.1 0.3College administrator/staff 0.2 0.2 0.4 0.4 0.5 0.4 0.3 0.4 0.4 0.7College teacher 0.2 0.2 0.4 0.3 0.6 0.5 0.4 0.5 0.6 1.6Computer programmer or analyst 2.3 3.6 4.7 2.4 3.1 3.2 2.1 3.0 3.7 3.8Conservationist or forester 0.1 0.1 0.2 0.0 0.1 0.1 0.1 0.0 0.2 0.2Dentist (including orthodontist) 0.2 0.3 0.4 0.2 0.3 0.7 0.1 0.2 0.2 0.6Dietitian or nutritionist 0.2 0.1 0.1 0.1 0.1 0.1 0.2 0.1 0.1 0.1Engineer 6.4 8.6 9.0 5.5 7.7 7.0 4.8 7.0 6.7 7.5Farmer or rancher 1.4 0.5 0.7 0.5 0.6 0.5 1.0 1.4 2.2 1.1Foreign service worker (including diplomat) 0.0 0.0 0.1 0.1 0.0 0.0 0.1 0.1 0.0 0.2Homemaker (full-time) 0.3 0.3 0.3 0.4 0.2 0.3 0.4 0.4 0.3 0.3Interior decorator (including designer) 0.1 0.0 0.0 0.1 0.0 0.1 0.0 0.0 0.0 0.1Lab technician or hygienist 0.3 0.3 0.3 0.4 0.3 0.3 0.2 0.3 0.4 0.2Law enforcement officer 2.1 2.7 2.3 2.8 2.2 2.1 2.0 2.3 2.1 1.2Lawyer (attorney) or judge 0.9 1.4 1.7 0.7 1.3 3.9 0.5 0.8 1.3 3.9Military service (career) 2.3 1.0 3.7 1.5 0.9 0.9 4.9 1.8 2.1 1.1Musician (performer, composer) 0.4 0.3 0.2 0.2 0.1 0.2 0.6 0.3 0.2 0.5Nurse 0.7 0.5 0.5 1.3 0.9 0.5 0.7 0.4 0.4 0.5Optometrist 0.1 0.1 0.1 0.0 0.1 0.1 0.0 0.1 0.1 0.1Pharmacist 0.2 0.3 0.4 0.6 0.6 0.3 0.2 0.3 0.4 0.4Physician 0.5 0.7 1.5 1.1 1.5 2.5 0.4 1.0 1.5 4.0Policymaker/Government 0.5 0.6 1.1 0.7 0.6 0.8 1.0 0.6 0.8 0.7School counselor 0.1 0.1 0.1 0.0 0.1 0.1 0.1 0.2 0.1 0.1School principal or superintendent 0.2 0.2 0.2 0.1 0.2 0.3 0.3 0.4 0.3 0.3Scientific researcher 0.1 0.4 0.7 0.2 0.2 0.4 0.1 0.4 0.2 1.0Social, welfare, or recreation worker 0.6 0.6 0.5 0.6 0.7 0.5 0.5 0.5 0.5 0.7Therapist (physical, occupational, speech) 0.3 0.3 0.3 0.3 0.3 0.3 0.1 0.4 0.3 0.5Teacher or administrator (elementary) 0.8 0.8 0.7 0.6 0.6 0.8 0.7 0.9 0.7 1.1Teacher or administrator (secondary) 1.5 1.6 2.2 1.2 1.7 1.7 1.2 2.3 2.4 2.8Veterinarian 0.2 0.1 0.2 0.0 0.1 0.1 0.1 0.1 0.1 0.2Writer or journalist 0.2 0.3 0.3 0.3 0.5 0.4 0.4 0.2 0.1 0.6Skilled trades 6.7 9.8 7.5 7.2 8.9 6.9 7.4 9.4 8.0 5.3Laborer (unskilled) 5.1 3.5 2.3 4.4 5.0 2.2 4.5 4.2 3.5 1.7Semi-skilled worker 4.1 2.8 2.3 3.3 3.7 1.9 3.5 3.8 3.0 1.8Unemployed 7.2 5.2 3.4 8.6 6.1 3.3 10.7 4.7 4.1 2.8Other 31.9 25.3 19.6 32.1 22.7 18.8 30.2 24.8 24.5 16.6
2009 CIRP Freshman SurveyWeighted National Norms—Public, Catholic, and Other Religious 4-year Colleges by Selectivity
Public 4-year Colleges Catholic 4-year Colleges Other Religious 4-year CollegesLow Medium High Low Medium High Very Low Low Medium High
127

Your mother’s occupation:Accountant or actuary 5.1 5.1 5.9 4.8 4.4 4.5 5.0 5.1 4.5 4.3Actor or entertainer 0.1 0.0 0.0 0.0 0.1 0.1 0.0 0.0 0.0 0.1Architect or urban planner 0.1 0.1 0.2 0.1 0.1 0.2 0.1 0.1 0.1 0.3Artist 0.4 0.5 0.7 0.2 0.2 0.5 0.4 0.3 0.7 1.1Business (clerical) 3.4 4.5 4.5 3.8 5.1 3.9 3.8 4.4 4.6 3.4Business executive (management, administrator) 5.0 5.8 6.2 6.2 5.5 6.4 6.2 5.0 5.2 5.6Business owner or proprietor 2.9 2.7 2.8 2.4 2.4 3.0 3.4 3.0 2.9 3.1Business salesperson or buyer 2.1 2.4 2.5 1.5 1.7 2.4 1.3 1.8 1.9 1.9Clergy (minister, priest) 0.1 0.1 0.1 0.2 0.1 0.0 0.4 0.2 0.3 0.4Clergy (other religious) 0.0 0.1 0.2 0.0 0.0 0.1 0.1 0.2 0.2 0.5Clinical psychologist 0.1 0.1 0.2 0.2 0.1 0.2 0.1 0.1 0.2 0.3College administrator/staff 0.5 0.4 0.4 0.5 0.9 1.0 0.5 1.1 0.7 1.0College teacher 0.2 0.3 0.4 0.1 0.4 0.4 0.1 0.3 0.4 1.1Computer programmer or analyst 0.9 1.3 1.5 1.0 1.2 1.2 1.2 1.2 1.0 1.2Conservationist or forester 0.0 0.0 0.1 0.0 0.0 0.0 0.1 0.1 0.0 0.1Dentist (including orthodontist) 0.5 0.5 0.6 0.6 0.5 0.5 0.4 0.5 0.4 0.5Dietitian or nutritionist 0.3 0.2 0.4 0.5 0.3 0.4 0.5 0.2 0.4 0.5Engineer 0.6 0.6 0.9 0.5 0.4 0.6 0.4 0.4 0.5 0.7Farmer or rancher 0.2 0.1 0.1 0.1 0.1 0.1 0.2 0.2 0.2 0.2Foreign service worker (including diplomat) 0.0 0.0 0.1 0.1 0.0 0.1 0.1 0.1 0.0 0.1Homemaker (full-time) 5.6 4.9 7.7 4.4 7.9 10.3 4.4 7.6 9.1 11.8Interior decorator (including designer) 0.3 0.3 0.5 0.2 0.2 0.6 0.1 0.3 0.4 0.6Lab technician or hygienist 0.6 0.6 0.8 0.9 0.7 0.6 0.6 0.6 0.6 0.6Law enforcement officer 0.5 0.3 0.3 0.5 0.4 0.2 1.1 0.3 0.3 0.1Lawyer (attorney) or judge 0.5 0.6 0.7 0.3 0.5 1.3 0.6 0.4 0.4 1.6Military service (career) 0.3 0.1 0.4 0.3 0.1 0.1 0.6 0.3 0.3 0.1Musician (performer, composer) 0.1 0.1 0.1 0.2 0.1 0.1 0.2 0.3 0.2 0.5Nurse 8.3 9.3 8.9 11.9 9.8 9.2 10.1 8.2 8.6 7.4Optometrist 0.1 0.2 0.1 0.3 0.2 0.2 0.1 0.3 0.1 0.2Pharmacist 0.3 0.4 0.5 0.5 0.5 0.4 0.4 0.3 0.5 0.5Physician 0.3 0.4 0.6 0.5 0.6 0.7 0.1 0.4 0.5 1.4Policymaker/Government 0.5 0.4 0.7 0.4 0.4 0.5 1.4 0.3 0.5 0.6School counselor 0.3 0.3 0.4 0.1 0.3 0.5 0.2 0.5 0.5 0.4School principal or superintendent 0.3 0.2 0.2 0.4 0.2 0.3 0.3 0.2 0.3 0.3Scientific researcher 0.1 0.2 0.4 0.1 0.3 0.3 0.0 0.2 0.2 0.4Social, welfare, or recreation worker 2.1 1.9 1.5 2.3 1.8 1.8 2.3 1.6 1.6 1.9Therapist (physical, occupational, speech) 1.1 1.6 1.9 1.1 1.4 1.9 0.8 1.2 1.4 2.1Teacher or administrator (elementary) 6.4 7.5 8.9 6.6 6.9 8.5 6.4 9.6 8.9 9.1Teacher or administrator (secondary) 3.2 3.4 4.7 2.4 3.2 4.0 3.2 4.5 4.3 4.9Veterinarian 0.1 0.1 0.2 0.1 0.1 0.1 0.2 0.2 0.1 0.2Writer or journalist 0.1 0.2 0.4 0.1 0.5 0.5 0.2 0.2 0.3 0.8Skilled trades 1.5 2.1 1.3 1.0 1.7 1.4 1.8 1.6 1.3 1.0Laborer (unskilled) 2.7 1.8 1.2 1.9 2.4 1.1 2.9 1.9 1.5 0.9Semi-skilled worker 2.5 1.9 1.8 1.4 2.4 1.4 1.9 2.1 1.7 1.2Unemployed 10.7 8.9 6.9 9.4 8.2 6.8 10.2 7.5 6.8 6.1Other 28.9 27.5 21.5 30.1 26.0 21.5 25.3 25.0 25.1 19.1
2009 CIRP Freshman SurveyWeighted National Norms—Public, Catholic, and Other Religious 4-year Colleges by Selectivity
Public 4-year Colleges Catholic 4-year Colleges Other Religious 4-year CollegesLow Medium High Low Medium High Very Low Low Medium High
128

Race/Ethnicity—mark all that apply(total may add to more than 100%)American Indian/Alaska Native 5.3 2.1 2.7 2.0 2.0 1.6 3.9 3.1 3.2 2.3Asian American/Asian 6.2 3.8 4.1 6.4 4.3 3.9 2.0 2.0 2.3 6.2Native Hawaiian/Pacific Islander 1.9 0.8 0.8 1.8 0.7 0.9 0.8 0.5 0.6 0.8African American/Black 26.6 8.9 7.1 33.6 8.5 4.7 56.0 10.6 10.2 5.1Mexican American/Chicano 19.6 2.0 2.7 5.2 6.8 2.5 1.3 4.4 2.4 2.6Puerto Rican 1.0 2.3 1.4 4.9 2.3 1.6 2.7 1.0 1.9 1.0Other Latino 8.2 4.7 2.9 9.5 2.4 3.7 3.6 2.3 2.8 2.5White/Caucasian 42.7 81.8 86.7 44.5 78.0 87.4 38.3 84.0 83.9 87.0Other 5.0 4.0 2.7 4.5 3.6 2.9 4.1 2.7 3.0 2.9
Student “agree strongly” or “agree somewhat”:There is too much concern in the courts for the rights of
criminals 57.4 57.8 59.9 52.2 59.5 55.8 56.0 61.6 62.9 51.1Abortion should be legal 50.9 63.3 53.2 47.9 45.9 52.3 43.0 35.9 37.9 50.2Marijuana should be legalized 42.3 49.7 42.9 37.2 36.8 44.9 41.1 32.1 31.3 41.1Racial discrimination is no longer a major problem
in America 23.6 24.0 27.2 19.0 22.5 22.5 18.4 24.4 23.7 20.5Realistically, an individual can do little to bring about
changes in our society 35.8 30.1 26.9 32.5 30.3 24.1 34.8 28.8 26.7 21.6Same-sex couples should have the right to legal
marital status 59.4 70.5 58.3 65.7 61.8 65.1 46.8 42.6 44.1 57.5Only volunteers should serve in the armed forces 59.4 63.6 60.4 58.2 61.8 61.1 53.6 55.2 55.4 64.6Dissent is a critical component of the political process 51.4 56.5 60.6 51.3 57.0 60.9 50.1 53.5 55.8 66.1Colleges have the right to ban extreme speakers from
campus 38.4 39.0 43.8 38.4 42.5 42.7 42.2 49.1 47.8 43.9Students from disadvantaged social backgrounds
should be given preferential treatment in college admissions 49.1 39.1 31.8 47.6 38.5 33.1 53.1 40.5 37.6 35.3
Colleges should prohibit racist/sexist speech on campus 64.5 68.9 69.8 65.2 69.0 71.3 63.3 70.2 71.7 70.6
How would you characterize your political views?Far left 3.0 2.9 1.9 2.8 2.1 1.8 3.1 1.7 1.6 3.5Liberal 26.5 29.1 21.5 27.8 25.3 25.5 21.8 15.7 17.7 28.0Middle-of-the-road 49.6 48.7 43.9 53.8 48.2 45.2 49.4 46.8 41.7 36.8Conservative 18.7 17.7 29.6 13.8 22.2 25.4 22.9 33.2 35.8 29.5Far right 2.2 1.6 3.1 1.8 2.2 2.0 2.7 2.6 3.3 2.1
The following reasons were “very important” indeciding to go to college:
My parents wanted me to go 55.5 44.9 39.9 50.0 48.1 43.0 54.1 42.5 41.0 36.7To be able to get a better job 89.2 84.7 84.3 89.5 89.4 84.8 88.5 83.6 81.1 76.5To gain a general education and appreciation of ideas 73.7 68.8 66.4 78.8 70.4 73.0 78.4 64.8 66.2 73.9To make me a more cultured person 53.8 49.0 47.2 57.2 49.8 55.9 57.0 44.1 47.8 59.1To be able to make more money 82.2 75.7 70.7 80.9 77.6 72.1 83.5 68.5 67.8 58.1To learn more about things that interest me 82.8 80.8 80.3 82.7 79.9 81.6 81.9 78.3 79.9 86.5
2009 CIRP Freshman SurveyWeighted National Norms—Public, Catholic, and Other Religious 4-year Colleges by Selectivity
Public 4-year Colleges Catholic 4-year Colleges Other Religious 4-year CollegesLow Medium High Low Medium High Very Low Low Medium High
129
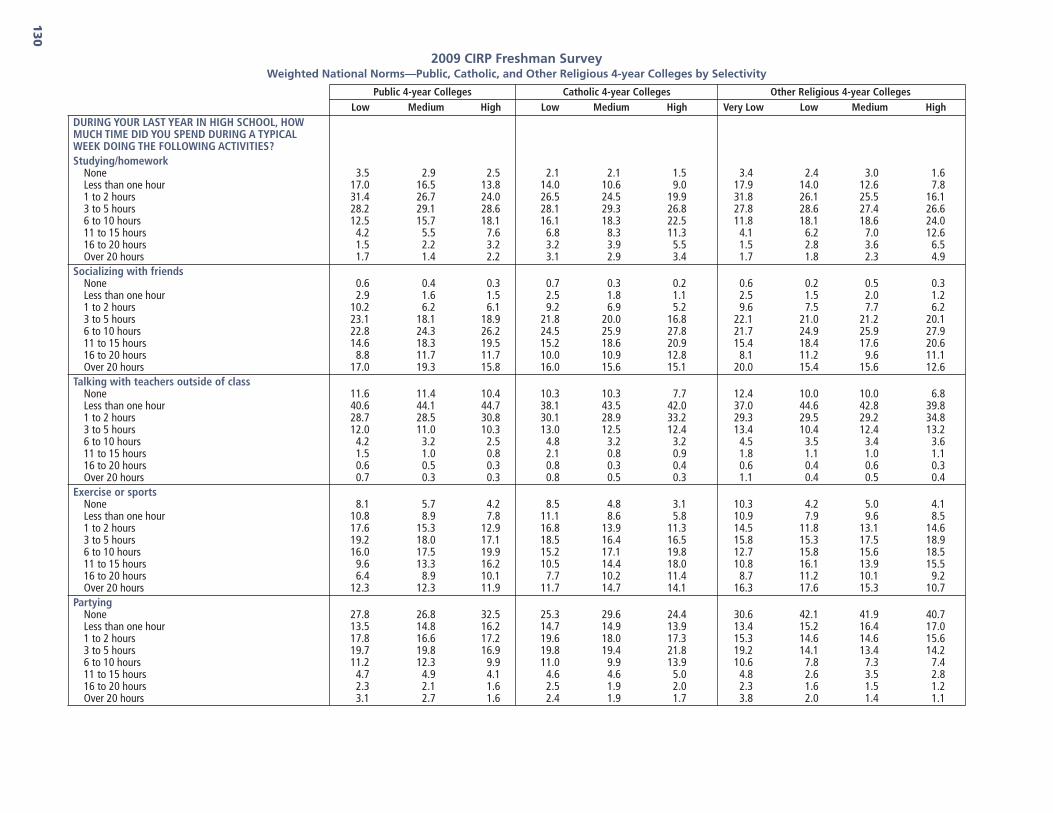
DURING YOUR LAST YEAR IN HIGH SCHOOL, HOWMUCH TIME DID YOU SPEND DURING A TYPICALWEEK DOING THE FOLLOWING ACTIVITIES?Studying/homework
None 3.5 2.9 2.5 2.1 2.1 1.5 3.4 2.4 3.0 1.6Less than one hour 17.0 16.5 13.8 14.0 10.6 9.0 17.9 14.0 12.6 7.81 to 2 hours 31.4 26.7 24.0 26.5 24.5 19.9 31.8 26.1 25.5 16.13 to 5 hours 28.2 29.1 28.6 28.1 29.3 26.8 27.8 28.6 27.4 26.66 to 10 hours 12.5 15.7 18.1 16.1 18.3 22.5 11.8 18.1 18.6 24.011 to 15 hours 4.2 5.5 7.6 6.8 8.3 11.3 4.1 6.2 7.0 12.616 to 20 hours 1.5 2.2 3.2 3.2 3.9 5.5 1.5 2.8 3.6 6.5Over 20 hours 1.7 1.4 2.2 3.1 2.9 3.4 1.7 1.8 2.3 4.9
Socializing with friendsNone 0.6 0.4 0.3 0.7 0.3 0.2 0.6 0.2 0.5 0.3Less than one hour 2.9 1.6 1.5 2.5 1.8 1.1 2.5 1.5 2.0 1.21 to 2 hours 10.2 6.2 6.1 9.2 6.9 5.2 9.6 7.5 7.7 6.23 to 5 hours 23.1 18.1 18.9 21.8 20.0 16.8 22.1 21.0 21.2 20.16 to 10 hours 22.8 24.3 26.2 24.5 25.9 27.8 21.7 24.9 25.9 27.911 to 15 hours 14.6 18.3 19.5 15.2 18.6 20.9 15.4 18.4 17.6 20.616 to 20 hours 8.8 11.7 11.7 10.0 10.9 12.8 8.1 11.2 9.6 11.1Over 20 hours 17.0 19.3 15.8 16.0 15.6 15.1 20.0 15.4 15.6 12.6
Talking with teachers outside of classNone 11.6 11.4 10.4 10.3 10.3 7.7 12.4 10.0 10.0 6.8Less than one hour 40.6 44.1 44.7 38.1 43.5 42.0 37.0 44.6 42.8 39.81 to 2 hours 28.7 28.5 30.8 30.1 28.9 33.2 29.3 29.5 29.2 34.83 to 5 hours 12.0 11.0 10.3 13.0 12.5 12.4 13.4 10.4 12.4 13.26 to 10 hours 4.2 3.2 2.5 4.8 3.2 3.2 4.5 3.5 3.4 3.611 to 15 hours 1.5 1.0 0.8 2.1 0.8 0.9 1.8 1.1 1.0 1.116 to 20 hours 0.6 0.5 0.3 0.8 0.3 0.4 0.6 0.4 0.6 0.3Over 20 hours 0.7 0.3 0.3 0.8 0.5 0.3 1.1 0.4 0.5 0.4
Exercise or sportsNone 8.1 5.7 4.2 8.5 4.8 3.1 10.3 4.2 5.0 4.1Less than one hour 10.8 8.9 7.8 11.1 8.6 5.8 10.9 7.9 9.6 8.51 to 2 hours 17.6 15.3 12.9 16.8 13.9 11.3 14.5 11.8 13.1 14.63 to 5 hours 19.2 18.0 17.1 18.5 16.4 16.5 15.8 15.3 17.5 18.96 to 10 hours 16.0 17.5 19.9 15.2 17.1 19.8 12.7 15.8 15.6 18.511 to 15 hours 9.6 13.3 16.2 10.5 14.4 18.0 10.8 16.1 13.9 15.516 to 20 hours 6.4 8.9 10.1 7.7 10.2 11.4 8.7 11.2 10.1 9.2Over 20 hours 12.3 12.3 11.9 11.7 14.7 14.1 16.3 17.6 15.3 10.7
PartyingNone 27.8 26.8 32.5 25.3 29.6 24.4 30.6 42.1 41.9 40.7Less than one hour 13.5 14.8 16.2 14.7 14.9 13.9 13.4 15.2 16.4 17.01 to 2 hours 17.8 16.6 17.2 19.6 18.0 17.3 15.3 14.6 14.6 15.63 to 5 hours 19.7 19.8 16.9 19.8 19.4 21.8 19.2 14.1 13.4 14.26 to 10 hours 11.2 12.3 9.9 11.0 9.9 13.9 10.6 7.8 7.3 7.411 to 15 hours 4.7 4.9 4.1 4.6 4.6 5.0 4.8 2.6 3.5 2.816 to 20 hours 2.3 2.1 1.6 2.5 1.9 2.0 2.3 1.6 1.5 1.2Over 20 hours 3.1 2.7 1.6 2.4 1.9 1.7 3.8 2.0 1.4 1.1
2009 CIRP Freshman SurveyWeighted National Norms—Public, Catholic, and Other Religious 4-year Colleges by Selectivity
Public 4-year Colleges Catholic 4-year Colleges Other Religious 4-year CollegesLow Medium High Low Medium High Very Low Low Medium High
130

DURING YOUR LAST YEAR IN HIGH SCHOOL, HOWMUCH TIME DID YOU SPEND DURING A TYPICALWEEK DOING THE FOLLOWING ACTIVITIES?Working (for pay)
None 40.3 26.0 33.6 35.5 31.8 32.7 35.7 36.3 33.6 40.6Less than one hour 3.0 2.9 3.3 2.6 2.7 3.3 2.9 3.3 3.6 4.01 to 2 hours 4.0 3.9 4.5 3.6 4.1 5.1 3.0 4.9 5.3 6.13 to 5 hours 7.1 8.2 7.8 7.6 8.1 9.2 8.2 8.3 9.3 9.66 to 10 hours 10.8 14.3 12.8 12.6 13.1 15.5 13.0 12.2 12.8 12.711 to 15 hours 9.3 15.0 13.7 11.3 13.2 14.0 10.0 11.4 13.3 11.416 to 20 hours 10.8 15.0 12.8 12.2 13.6 11.1 10.3 11.4 10.9 8.6Over 20 hours 14.7 14.7 11.6 14.7 13.4 9.1 16.9 12.1 11.2 7.0
Volunteer workNone 33.2 31.9 27.8 26.1 28.6 19.6 31.1 27.9 25.5 20.5Less than one hour 18.8 22.4 25.3 18.3 22.2 22.1 16.2 21.5 22.9 23.51 to 2 hours 20.2 22.2 24.7 22.0 22.5 28.5 21.2 25.0 25.5 28.73 to 5 hours 13.8 13.0 13.2 16.7 14.6 16.9 14.0 14.3 14.8 16.16 to 10 hours 6.6 5.0 5.0 7.4 6.3 7.0 7.4 6.0 6.1 6.111 to 15 hours 2.7 2.2 1.7 3.3 2.3 2.7 3.9 2.2 2.2 2.216 to 20 hours 1.5 1.2 1.0 2.1 1.1 1.1 1.8 1.0 0.9 1.0Over 20 hours 3.1 2.0 1.5 4.0 2.5 2.1 4.3 2.1 2.2 1.8
Student clubs/groupsNone 37.0 36.5 28.2 27.7 28.4 22.8 33.0 32.6 29.6 22.6Less than one hour 12.7 15.2 15.9 13.8 13.2 15.2 13.6 14.4 15.2 14.41 to 2 hours 19.3 21.3 25.9 23.8 25.4 27.0 21.2 23.8 24.2 26.33 to 5 hours 14.5 13.8 16.2 17.4 17.9 19.7 15.8 15.9 16.1 19.46 to 10 hours 7.7 6.4 7.0 9.0 7.7 8.2 7.8 6.8 7.5 9.111 to 15 hours 3.5 2.7 3.1 3.7 3.6 3.8 4.5 3.0 3.5 4.116 to 20 hours 1.8 1.5 1.7 1.9 1.5 1.5 1.1 1.6 1.6 1.8Over 20 hours 3.4 2.6 1.9 2.7 2.2 1.9 3.0 1.8 2.2 2.3
Watching TVNone 6.7 5.9 6.2 5.9 5.3 5.5 6.2 5.0 6.3 9.6Less than one hour 16.3 15.6 15.6 15.5 14.7 14.1 13.9 15.4 14.2 16.31 to 2 hours 24.4 24.4 25.1 23.7 24.8 24.7 22.0 23.9 24.1 23.83 to 5 hours 24.6 27.0 27.4 25.5 27.2 28.0 24.7 27.3 27.1 27.16 to 10 hours 14.3 15.6 15.5 15.4 16.0 17.1 15.5 16.6 16.9 14.611 to 15 hours 6.1 6.1 5.7 6.5 6.7 5.9 7.1 6.3 6.0 4.916 to 20 hours 2.8 2.2 2.1 2.8 2.2 2.4 3.9 2.5 2.6 1.8Over 20 hours 4.7 3.2 2.5 4.7 3.1 2.2 6.8 2.9 2.7 1.9
2009 CIRP Freshman SurveyWeighted National Norms—Public, Catholic, and Other Religious 4-year Colleges by Selectivity
Public 4-year Colleges Catholic 4-year Colleges Other Religious 4-year CollegesLow Medium High Low Medium High Very Low Low Medium High
131

DURING YOUR LAST YEAR IN HIGH SCHOOL, HOWMUCH TIME DID YOU SPEND DURING A TYPICALWEEK DOING THE FOLLOWING ACTIVITIES?Household/childcare duties
None 21.3 17.8 17.9 17.1 16.6 17.7 19.3 19.3 17.7 19.3Less than one hour 17.2 19.0 21.4 16.6 18.2 20.7 14.9 19.3 19.5 22.01 to 2 hours 25.9 29.9 31.7 26.3 30.7 31.6 25.0 29.6 30.2 31.63 to 5 hours 18.8 19.9 18.9 21.3 21.4 19.2 20.9 19.4 19.8 18.46 to 10 hours 8.3 7.6 6.2 9.5 7.5 6.8 10.3 7.2 7.6 5.511 to 15 hours 3.7 3.0 2.1 3.8 2.9 2.1 3.6 2.8 2.4 1.716 to 20 hours 1.5 1.1 0.8 1.8 1.1 0.8 2.1 1.0 1.4 0.7Over 20 hours 3.3 1.7 1.1 3.6 1.7 1.1 3.9 1.4 1.4 0.8
Reading for pleasureNone 31.7 28.5 25.8 25.6 28.6 25.6 34.4 31.6 27.1 18.7Less than one hour 21.8 21.9 23.6 22.5 23.8 24.8 20.5 21.3 21.9 22.21 to 2 hours 21.1 21.6 22.5 24.2 20.5 23.3 18.3 20.1 21.3 25.33 to 5 hours 13.1 15.0 15.8 14.6 14.6 15.2 13.0 14.1 15.5 19.16 to 10 hours 6.3 7.3 7.2 6.6 6.9 6.7 6.7 7.4 7.5 8.811 to 15 hours 3.1 3.2 2.8 3.4 2.8 2.5 3.0 3.0 3.3 3.416 to 20 hours 1.2 1.2 1.2 1.5 1.4 0.9 1.7 1.1 1.6 1.2Over 20 hours 1.7 1.4 1.2 1.7 1.2 1.0 2.3 1.4 1.7 1.2
Playing video/computer gamesNone 41.3 40.3 40.1 43.3 41.7 44.9 37.4 37.3 37.6 44.5Less than one hour 19.6 20.8 20.6 20.5 19.9 19.9 20.0 19.8 21.6 19.71 to 2 hours 15.5 15.3 15.2 15.0 14.9 14.6 16.6 16.1 15.9 14.13 to 5 hours 10.9 11.6 11.3 9.8 11.2 10.6 11.6 13.1 12.7 11.46 to 10 hours 6.0 6.0 6.9 5.3 6.6 5.8 6.2 7.3 5.6 5.711 to 15 hours 2.8 2.7 2.8 3.1 2.7 2.1 3.5 3.0 3.4 2.316 to 20 hours 1.4 1.3 1.2 1.1 1.3 0.8 1.8 1.3 1.4 1.0Over 20 hours 2.5 2.1 1.9 1.9 1.7 1.3 2.9 2.0 1.6 1.3
Online social networks (MySpace, Facebook, etc.)None 11.6 8.4 8.1 9.0 9.8 6.2 9.1 8.3 7.8 6.3Less than one hour 21.2 18.6 18.8 17.5 17.4 16.2 16.1 16.8 15.9 15.31 to 2 hours 24.7 25.9 28.1 24.5 25.1 27.9 23.8 25.1 25.5 27.93 to 5 hours 19.8 23.9 24.7 22.4 24.4 26.6 20.3 25.2 25.2 28.16 to 10 hours 10.4 11.2 11.8 11.5 11.4 12.9 12.9 12.9 13.5 13.011 to 15 hours 4.8 5.5 4.1 6.3 6.2 5.2 6.5 5.6 6.0 5.116 to 20 hours 2.5 2.5 2.0 3.0 2.2 2.2 3.9 2.5 2.6 2.1Over 20 hours 5.0 4.0 2.5 5.8 3.5 2.8 7.4 3.4 3.4 2.3
The following reasons were “very important” indeciding to go to this particular college:
My parents wanted me to come here 26.6 20.0 16.3 25.5 23.8 19.6 25.8 20.5 21.5 17.1My relatives wanted me to come here 13.3 7.2 5.8 11.1 7.6 7.5 12.2 7.7 8.8 5.8My teacher advised me 13.2 8.7 6.2 12.3 7.9 7.4 9.6 6.6 6.6 7.5This college has a very good academic reputation 48.1 53.5 63.9 67.9 68.8 70.7 47.9 63.4 61.7 72.5This college has a good reputation for its social
activities 36.0 35.6 35.7 35.5 35.8 46.4 34.8 39.4 40.4 40.8I was offered financial assistance 43.9 36.7 38.5 64.7 73.9 61.4 67.5 68.1 68.2 61.2
2009 CIRP Freshman SurveyWeighted National Norms—Public, Catholic, and Other Religious 4-year Colleges by Selectivity
Public 4-year Colleges Catholic 4-year Colleges Other Religious 4-year CollegesLow Medium High Low Medium High Very Low Low Medium High
132

The following reasons were “very important” indeciding to go to this particular college:
The cost of attending this college 53.3 54.3 49.3 41.3 46.1 33.2 37.0 34.9 32.4 28.3High school counselor advised me 16.0 12.5 8.4 17.4 11.5 11.5 12.7 7.1 7.9 9.0Private college counselor advised me 5.4 3.0 1.7 7.5 5.7 4.9 7.1 4.6 6.1 5.3I wanted to live near home 32.6 29.6 19.4 33.0 33.0 19.4 21.2 23.0 22.6 14.2Not offered aid by first choice 10.9 9.6 7.2 13.3 12.1 10.0 13.2 8.4 8.0 7.5Could not afford first choice 16.6 16.1 12.4 14.2 13.5 10.0 13.1 9.0 8.5 8.0This college’s graduates gain admission to top
graduate/professional schools 24.8 23.2 30.9 44.4 38.9 39.9 26.1 31.3 32.2 38.4This college’s graduates get good jobs 44.6 46.5 56.9 66.0 65.9 64.1 46.0 57.7 54.0 57.1I was attracted by the religious affiliation/orientation
of the college 6.8 3.1 3.9 14.6 15.0 20.3 23.8 30.1 31.7 25.8I wanted to go to a school about the size of this
college 32.8 38.4 39.3 44.7 53.2 55.6 46.5 56.5 54.2 57.7Rankings in national magazines 8.2 8.2 15.9 16.8 13.8 19.1 7.8 12.4 11.6 21.0Information from a website 17.1 17.3 17.9 23.3 17.3 18.9 21.0 15.3 16.1 20.1I was admitted through an Early Action or Early
Decision program 7.7 8.9 12.3 13.3 9.8 20.5 10.3 10.6 10.8 17.8The athletic department recruited me 7.9 7.9 8.6 12.8 20.9 12.7 21.2 29.5 21.8 14.0A visit to the campus 30.6 38.2 41.6 38.3 45.5 52.7 41.2 50.6 49.6 54.0Ability to take online courses 5.9 2.8 2.0 4.7 3.1 2.1 5.7 3.0 2.6 1.5
Your probable field of study:Arts and Humanities
Art, fine and applied 2.3 3.7 1.9 2.1 2.2 1.1 1.2 2.0 2.8 2.6English (language and literature) 1.3 2.5 1.6 0.9 1.3 2.6 1.1 1.3 1.9 3.7History 0.7 1.5 2.2 0.6 1.2 2.2 1.7 1.4 1.7 2.4Journalism 1.7 1.5 1.2 0.9 1.8 1.6 1.2 1.1 1.2 1.3Language and Literature (except English) 0.3 0.5 0.8 0.1 0.2 0.6 0.2 0.3 0.7 1.5Music 2.6 1.7 1.3 1.2 0.5 0.4 1.3 1.7 2.4 4.7Philosophy 0.1 0.2 0.2 0.2 0.1 0.5 0.2 0.3 0.1 0.6Speech 0.2 0.2 0.1 0.0 0.2 0.2 0.0 0.1 0.1 0.0Theater or Drama 1.2 1.9 1.3 0.3 0.4 0.5 1.1 1.2 1.4 2.0Theology or Religion 0.0 0.0 0.1 0.1 0.3 0.3 0.9 1.5 1.8 1.0Other Arts and Humanities 1.4 1.9 0.8 0.6 0.6 0.6 0.7 0.8 0.8 1.9
Biological ScienceBiology (general) 4.6 3.2 4.5 9.2 6.6 7.2 4.7 4.8 4.7 6.1Biochemistry or Biophysics 0.8 0.6 0.7 0.9 1.2 1.1 0.4 1.3 1.0 1.5Botany 0.0 0.0 0.0 0.0 0.0 0.0 0.0 0.0 0.0 0.1Environmental Science 0.3 0.9 0.8 0.2 0.3 0.6 1.4 0.5 0.6 1.5Marine (Life) Science 0.3 0.4 1.0 0.1 0.3 0.2 0.3 0.4 0.3 0.8Microbiology or Bacteriology 0.1 0.2 0.1 0.1 0.0 0.1 0.1 0.0 0.1 0.2Zoology 0.4 0.4 0.3 0.3 0.1 0.2 0.5 0.3 0.4 0.3Other Biological Science 0.7 0.2 0.5 1.2 0.5 0.4 0.4 0.4 0.4 0.4
2009 CIRP Freshman SurveyWeighted National Norms—Public, Catholic, and Other Religious 4-year Colleges by Selectivity
Public 4-year Colleges Catholic 4-year Colleges Other Religious 4-year CollegesLow Medium High Low Medium High Very Low Low Medium High
133

Your probable field of study (continued):Business
Accounting 2.7 2.0 2.1 2.4 3.0 4.2 2.6 3.3 2.9 1.4Business Administration (general) 2.9 2.7 3.2 2.3 2.1 3.5 4.4 2.5 3.6 2.9Finance 0.7 0.8 0.9 0.4 0.8 2.9 0.5 0.6 0.8 0.9International Business 0.7 0.8 1.2 0.9 1.0 2.2 0.6 0.7 1.3 1.5Marketing 2.3 2.0 2.4 1.4 2.1 5.7 1.9 2.0 1.6 1.6Management 4.1 3.4 3.1 3.9 3.4 4.0 5.4 3.5 3.6 2.2Secretarial Studies 0.0 0.0 0.0 0.0 0.0 0.0 0.0 0.1 0.0 0.0Other Business 0.6 0.6 0.5 0.4 0.6 1.0 0.6 0.6 0.7 1.3
EducationBusiness Education 0.2 0.1 0.1 0.1 0.0 0.0 0.2 0.0 0.1 0.1Elementary Education 5.3 7.3 4.4 3.8 5.1 4.2 7.7 7.0 6.7 3.3Music or Art Education 0.9 1.1 0.8 0.1 0.6 0.2 0.8 1.4 1.6 1.4Physical Education or Recreation 1.3 1.9 0.7 0.3 1.1 0.3 3.1 2.5 1.2 0.6Secondary Education 2.8 4.0 2.5 1.8 4.3 2.8 3.0 4.6 4.1 2.4Special Education 0.6 1.3 0.6 0.6 1.3 0.9 0.4 1.2 0.9 0.4Other Education 0.5 0.8 0.3 0.3 0.5 0.1 0.7 0.4 0.3 0.2
EngineeringAeronautical or Astronautical Engineering 0.1 0.1 2.4 0.1 0.1 0.2 0.1 0.1 0.1 0.1Civil Engineering 1.2 0.3 1.9 0.1 0.3 1.3 0.3 1.0 0.3 0.7Chemical Engineering 0.1 0.1 0.8 0.1 0.2 0.4 0.2 0.0 0.3 0.3Computer Engineering 1.5 0.6 1.1 0.2 0.3 0.6 0.9 0.5 0.4 0.4Electrical or Electronic Engineering 0.9 0.5 1.2 0.1 0.2 0.6 0.2 0.2 0.3 0.4Industrial Engineering 0.2 0.1 0.1 0.0 0.0 0.0 0.1 0.0 0.1 0.0Mechanical Engineering 1.7 0.9 3.3 0.1 0.3 1.5 0.4 0.7 0.5 1.1Other Engineering 0.8 1.2 1.9 0.2 0.4 0.5 0.2 0.3 0.4 0.7
Physical ScienceAstronomy 0.1 0.1 0.1 0.1 0.0 0.0 0.0 0.0 0.1 0.1Atmospheric Science (incl. Meteorology) 0.0 0.0 0.1 0.0 0.0 0.0 0.0 0.0 0.1 0.2Chemistry 0.7 1.0 1.6 2.4 0.9 1.2 0.8 1.3 1.5 1.4Earth Science 0.1 0.2 0.2 0.0 0.0 0.0 0.1 0.0 0.1 0.3Marine Science (incl. Oceanography) 0.0 0.2 0.5 0.0 0.1 0.1 0.1 0.1 0.0 0.2Mathematics 0.5 0.7 0.9 0.4 0.7 0.9 0.4 0.6 0.9 1.0Physics 0.3 0.3 0.9 0.1 0.2 0.4 0.1 0.2 0.6 1.0Other Physical Science 0.3 0.2 0.2 0.4 0.3 0.1 0.4 0.3 0.4 0.2
ProfessionalArchitecture or Urban Planning 0.3 0.6 0.2 0.1 1.2 0.0 0.3 0.2 0.1 0.1Family & Consumer Sciences 0.4 0.1 0.0 0.0 0.3 0.1 0.1 0.3 0.1 0.1Health Technology (medical, dental, laboratory) 0.5 0.8 0.5 1.1 1.1 0.4 0.5 0.4 0.5 0.4Library or Archival Science 0.2 0.1 0.1 0.2 0.2 0.1 0.2 0.1 0.2 0.1Medicine, Dentistry, Veterinary Medicine 2.5 2.3 3.1 4.9 5.7 4.2 4.0 4.3 3.9 5.0Nursing 7.3 5.0 6.6 22.1 11.2 5.0 4.1 5.9 5.2 3.1Pharmacy 1.2 0.8 0.9 5.6 2.1 0.5 1.0 1.9 4.2 0.5Therapy (occupational, physical, speech) 2.2 2.8 2.2 2.0 6.3 3.1 2.9 4.1 3.2 2.4Other Professional 0.7 1.5 0.6 0.9 2.1 0.8 0.7 1.4 0.9 0.5
2009 CIRP Freshman SurveyWeighted National Norms—Public, Catholic, and Other Religious 4-year Colleges by Selectivity
Public 4-year Colleges Catholic 4-year Colleges Other Religious 4-year CollegesLow Medium High Low Medium High Very Low Low Medium High
134

Your probable field of study (continued):Social Science
Anthropology 0.2 0.3 0.4 0.0 0.0 0.2 0.1 0.2 0.2 0.8Economics 0.1 0.1 0.5 0.0 0.1 0.7 0.0 0.1 0.2 1.0Ethnic Studies 0.0 0.1 0.1 0.0 0.0 0.0 0.1 0.0 0.1 0.1Geography 0.1 0.1 0.0 0.0 0.0 0.0 0.0 0.1 0.1 0.1Political Science (gov’t., international relations) 1.7 1.5 3.8 1.9 2.1 4.1 2.8 1.9 2.0 5.0Psychology 6.5 5.9 5.0 5.9 5.3 6.1 7.6 4.9 4.8 5.5Public Policy 0.0 0.1 0.1 0.0 0.0 0.1 0.0 0.1 0.1 0.1Social Work 1.5 0.9 0.5 0.7 0.8 0.6 2.2 1.2 0.9 0.7Sociology 1.4 0.9 0.4 0.9 0.6 0.7 0.5 0.7 0.4 0.7Women’s Studies 0.0 0.0 0.0 0.0 0.0 0.0 0.0 0.0 0.0 0.1Other Social Science 0.3 0.6 0.3 0.2 0.2 0.4 0.2 0.1 0.7 0.4
TechnicalBuilding Trades 0.0 0.1 0.0 0.0 0.0 0.0 0.0 0.0 0.0 0.0Data Processing or Computer Programming 0.8 0.5 0.7 0.2 0.5 0.2 1.1 0.5 0.7 0.5Drafting or Design 0.4 0.2 0.1 0.2 0.3 0.0 0.2 0.6 0.3 0.1Electronics 0.1 0.1 0.1 0.0 0.0 0.0 0.1 0.1 0.0 0.0Mechanics 0.0 0.1 0.0 0.0 0.0 0.0 0.1 0.3 0.1 0.0Other Technical 0.1 0.1 0.1 0.1 0.1 0.0 0.2 0.2 0.1 0.1
Other FieldsAgriculture 2.7 0.1 0.1 0.0 0.1 0.0 0.8 0.2 0.2 0.1Communications 1.6 2.1 1.5 2.1 1.8 2.0 1.5 1.9 1.8 1.6Computer Science 1.2 0.8 1.3 0.4 1.3 0.6 1.2 0.9 0.9 0.6Forestry 0.2 0.1 0.1 0.0 0.1 0.0 0.2 0.0 0.1 0.1Kinesiology 2.0 0.9 0.7 0.1 0.3 0.3 0.3 1.8 0.9 0.6Law Enforcement 2.6 3.0 1.7 2.1 1.9 1.0 5.7 2.1 2.0 0.4Military Science 0.0 0.0 0.7 0.1 0.1 0.2 0.1 0.1 0.1 0.0Other Field 1.6 1.9 1.0 1.1 1.3 1.0 3.4 2.7 1.7 1.3Undecided 6.2 9.2 7.4 4.8 5.2 7.4 4.3 5.4 5.4 7.2
Objectives considered to be “Essential” or “Very Important”:
Becoming accomplished in one of the performing arts(acting, dancing, etc.) 20.9 17.2 12.8 17.3 13.7 12.6 19.8 14.3 17.6 22.8
Becoming an authority in my field 59.6 55.2 57.5 62.4 60.3 56.9 65.6 55.7 55.8 55.9Obtaining recognition from my colleagues for
contributions to my special field 57.6 55.9 51.9 61.7 59.0 55.8 59.0 49.4 50.3 50.2Influencing the political structure 24.9 18.6 18.7 24.7 19.1 21.1 28.7 17.5 19.6 20.5Influencing social values 45.3 41.4 39.7 48.0 44.3 44.9 52.9 42.2 46.3 46.3Raising a family 74.2 75.3 76.2 75.6 81.2 80.9 78.0 79.2 78.2 73.8Being very well off financially 84.6 80.5 76.2 87.6 83.9 78.8 85.3 74.2 72.4 62.2Helping others who are in difficulty 70.5 66.6 67.4 77.4 74.0 72.7 74.0 72.8 72.2 73.2Making a theoretical contribution to science 22.4 16.4 18.1 30.3 21.6 19.4 22.6 16.5 18.1 18.5Writing original works (poems, novels, short stories,
etc.) 19.4 17.2 12.2 19.8 15.1 13.9 20.6 13.4 15.8 20.3Creating artistic work (painting, sculpture,
decorating, etc.) 19.4 17.4 12.0 16.8 14.5 12.3 17.3 13.9 15.5 18.3Becoming successful in a business of my own 52.2 40.1 34.7 51.1 41.6 41.9 56.3 38.4 37.9 34.0Becoming involved in programs to clean up the
environment 29.6 23.9 21.3 32.4 26.4 25.2 32.8 22.5 22.6 27.1
2009 CIRP Freshman SurveyWeighted National Norms—Public, Catholic, and Other Religious 4-year Colleges by Selectivity
Public 4-year Colleges Catholic 4-year Colleges Other Religious 4-year CollegesLow Medium High Low Medium High Very Low Low Medium High
135

Objectives considered to be “Essential” or “Very Important”:
Developing a meaningful philosophy of life 46.2 44.5 44.9 48.8 44.3 47.5 49.0 43.3 43.8 54.0Participating in a community action program 32.3 25.7 23.4 37.9 29.3 34.5 39.5 28.2 28.9 34.1Helping to promote racial understanding 38.0 31.0 26.3 43.8 33.7 32.7 45.5 29.0 30.3 35.2Keeping up to date with political affairs 31.7 28.8 34.6 32.6 31.7 38.2 34.4 27.1 29.6 38.7Becoming a community leader 36.8 30.7 34.3 38.6 33.4 39.6 43.7 33.1 35.5 38.2Improving my understanding of other
countries/cultures 44.4 42.4 46.3 49.7 43.9 50.8 48.5 41.0 44.6 58.9Adopting “green” practices to protect the
environment 39.6 39.4 35.3 42.4 39.8 41.3 37.9 30.2 31.6 43.3Student estimates “Very Good Chance” that they will:
Change major field 12.4 14.2 13.1 7.7 8.7 14.0 7.9 8.9 9.2 14.5Change career choice 10.3 12.2 11.9 5.8 7.3 14.7 7.0 8.3 9.3 16.4Participate in student government 8.5 6.0 5.8 8.9 5.7 7.7 9.7 5.6 6.6 7.3Get a job to help pay for college expenses 48.0 56.6 43.6 49.5 55.3 48.4 47.0 49.3 47.7 50.7Work full-time while attending college 12.0 10.3 7.9 10.0 7.8 4.5 9.4 5.3 4.8 3.9Join a social fraternity or sorority 17.4 8.5 8.7 14.6 4.1 4.9 19.1 5.1 9.7 8.7Play club, intramural, or recreational sports 21.5 28.1 36.3 24.0 30.0 39.8 26.4 34.0 33.1 33.3Play intercollegiate athletics (eg NCAA or
NAIA-sponsored) 12.9 14.1 14.5 18.5 26.8 18.3 29.2 35.5 27.9 21.1Make at least a “B” average 59.5 64.0 63.0 66.1 70.2 69.6 60.8 64.6 65.5 70.7Need extra time to complete your degree
requirements 10.1 7.4 5.4 7.5 7.9 5.0 10.4 7.4 6.8 4.8Participate in student protests or demonstrations 6.5 5.5 3.8 7.2 5.7 5.4 7.2 3.6 4.2 7.0Transfer to another college before graduating 12.3 9.4 8.2 7.2 6.3 4.2 15.0 6.4 7.8 3.8Be satisfied with your college 43.7 49.1 54.9 52.0 55.6 61.8 42.1 57.9 57.8 65.5Participate in volunteer or community service work 22.9 22.6 26.2 32.6 29.5 40.3 31.6 31.7 34.0 42.5Seek personal counseling 11.2 8.8 6.3 10.8 7.8 8.0 10.2 6.4 7.0 8.4Communicate regularly with your professors 31.4 32.4 34.8 40.4 38.8 41.2 36.7 35.7 37.5 47.3Socialize with someone of another racial/ethnic group 54.8 60.3 64.8 63.9 60.7 62.7 62.4 62.2 61.5 69.8Participate in student clubs/groups 34.5 36.9 44.0 43.3 42.3 51.5 41.8 36.0 41.3 52.3Participate in a study abroad program 18.9 22.8 25.9 24.2 23.4 39.2 23.6 21.2 24.4 47.4Have a roommate of different race/ethnicity 26.0 23.9 27.7 30.4 22.2 22.4 34.6 26.2 23.7 29.7Discuss course content with students outside of class 33.9 36.1 45.0 42.6 42.6 45.9 37.0 40.5 41.7 55.8Work on a professor’s research project 36.1 30.7 28.6 44.2 30.6 27.4 42.5 32.8 29.3 27.0
Do you give the Higher Education ResearchInstitute (HERI) permission to include your IDnumber should your college request the data foradditional research analyses?
Yes 76.0 67.6 75.3 64.5 66.7 64.7 68.5 69.2 69.9 66.4No 24.0 32.4 24.7 35.5 33.3 35.3 31.5 30.8 30.1 33.6
2009 CIRP Freshman SurveyWeighted National Norms—Public, Catholic, and Other Religious 4-year Colleges by Selectivity
Public 4-year Colleges Catholic 4-year Colleges Other Religious 4-year CollegesLow Medium High Low Medium High Very Low Low Medium High
136

CIRP Construct: Habits of MindHigh Construct Score Group 22.5 22.9 26.6 26.6 25.0 27.6 24.2 19.1 23.8 31.8Average Construct Score Group 34.9 38.6 40.9 35.3 38.3 39.7 36.6 38.0 38.3 40.1Low Construct Score Group 42.6 38.5 32.6 38.1 36.7 32.7 39.2 42.9 38.0 28.1Mean Score 48.7 49.1 50.2 49.7 49.5 50.4 49.0 48.3 49.2 51.3
CIRP Construct: Academic Self-ConceptHigh Construct Score Group 16.5 13.7 22.8 18.5 19.0 19.6 18.0 17.5 20.8 27.4Average Construct Score Group 33.7 36.2 43.3 33.3 40.1 44.7 30.0 38.2 39.1 43.3Low Construct Score Group 49.8 50.1 33.8 48.2 40.9 35.7 51.9 44.3 40.1 29.2Mean Score 46.6 46.2 49.1 47.0 47.8 48.5 46.7 47.3 48.0 50.1
CIRP Construct: Social Self-ConceptHigh Construct Score Group 28.9 25.3 28.9 29.5 26.7 29.4 35.9 27.6 29.0 29.0Average Construct Score Group 35.3 37.9 39.0 32.9 38.7 40.1 32.5 38.5 36.4 39.2Low Construct Score Group 35.8 36.8 32.1 37.6 34.6 30.4 31.6 33.9 34.7 31.8Mean Score 49.1 48.4 49.4 49.0 48.9 49.8 50.4 49.0 49.2 49.5
CIRP Construct: Pluralistic OrientationHigh Construct Score Group 25.6 24.3 25.9 25.6 24.0 25.3 25.3 20.9 22.4 27.8Average Construct Score Group 33.2 36.5 37.4 34.4 36.0 37.6 32.1 33.9 34.4 38.3Low Construct Score Group 41.3 39.2 36.7 40.0 40.0 37.0 42.7 45.2 43.2 33.9Mean Score 48.9 49.2 49.6 49.2 49.1 49.6 48.8 47.9 48.4 50.2
CIRP Construct: Social AgencyHigh Construct Score Group 30.9 23.9 22.2 35.7 27.8 30.9 40.5 25.1 26.4 31.5Average Construct Score Group 38.9 40.5 41.4 40.6 40.0 42.0 36.2 40.5 42.3 41.5Low Construct Score Group 30.2 35.6 36.4 23.7 32.2 27.1 23.3 34.4 31.4 27.0Mean Score 48.8 47.3 47.0 50.2 48.2 49.2 50.8 47.6 48.1 49.3
CIRP Construct: College Reputation OrientationHigh Construct Score Group 22.0 21.4 29.1 41.4 37.0 38.1 23.1 29.3 29.7 34.8Average Construct Score Group 24.7 26.9 29.1 26.7 30.3 27.4 24.4 30.0 26.1 25.2Low Construct Score Group 53.3 51.8 41.8 32.0 32.8 34.5 52.5 40.7 44.1 40.0Mean Score 46.4 46.8 48.5 50.2 50.1 50.1 46.5 48.5 48.2 49.3
CIRP Construct: Likelihood of College InvolvementHigh Construct Score Group 18.6 19.7 23.8 27.3 24.0 34.8 26.1 21.3 25.1 40.1Average Construct Score Group 35.7 37.6 39.3 37.2 36.8 37.9 35.3 37.2 38.1 37.0Low Construct Score Group 45.7 42.7 37.0 35.5 39.2 27.3 38.6 41.4 36.8 22.9Mean Score 43.7 44.2 45.2 45.5 44.9 47.2 45.2 44.5 45.2 48.1
Note: CIRP Constructs are scored on a normal curve, a “Low” score represents students who are one-half standard deviation or more below the mean, a “High” score represents students who are one-half standard deviation or moreabove the mean, and an “Average” score represents students whose scores are within one-half standard deviation of the mean.
2009 CIRP Freshman SurveyWeighted National Norms—Public, Catholic, and Other Religious 4-year Colleges by Selectivity
Public 4-year Colleges Catholic 4-year Colleges Other Religious 4-year CollegesLow Medium High Low Medium High Very Low Low Medium High
137


APPENDIX A
Research Methodology


RESEARCH METHODOLOGY
141
The data reported here have been weighted toprovide a normative picture of the Americancollege first-year student population for personsengaged in policy analysis, human resource planning, campus administration, educationalresearch, and guidance and counseling, as well as for the general community of students andparents. This Appendix provides a brief overviewof the CIRP methodology and describes theprocedures used to weight the annual freshmansurvey results to produce the national normative estimates.
Historical OverviewFrom 1966 to 1970, approximately 15 percentof the nation’s institutions of higher educationwere selected by sampling procedures andinvited to participate in the program. As theacademic community became aware of the valueof program participation, additional institutionsasked to participate. Beginning in 1971, all institutions that have entering freshman classesand that respond to the U.S. Department of Education’s Higher Education GeneralInformation Survey were invited to participate.A minimal charge plus a unit rate based on thenumber of forms processed helps to defray thedirect costs of the survey.
The National Population for 2009For the purposes of the 2009 CIRP FreshmanSurvey, the population has been defined as all institutions of higher education admittingfirst-time first-year students and granting abaccalaureate-level degree or higher listed in theU.S. Department of Education’s IntegratedPostsecondary Education Data System (IPEDS).An institution is considered eligible if it wasoperating at the time of the IPEDS survey andhad a first-time, full-time first-year class of atleast 25 students. In addition, a small number of institutions or their branches are includedeven though their separate enrollments were notavailable from the IPEDS files. In 2009, thenational population included 1,555 institutions.It should be noted that the population reflectsinstitutions of “higher education,” rather than“postsecondary education.” Most proprietary,special vocational or semiprofessional institutionsare not currently included in the population.

Institutional Stratification DesignThe institutions identified as part of the nationalpopulation are divided into 26 stratificationgroups based on type (four-year college, univer-sity), control (public, private nonsectarian,Roman Catholic, other religious), institutionalrace (predominantly non-black, predominantlyblack), and the “selectivity level” of the institu-tion. Selectivity, defined as the median SATVerbal and Math scores of the entering class (orACT composite score), was made an integralpart of the stratification design in 1968. Theselectivity figures were revised and updated in1975, 2001, and 2008. Table A1 shows thedistribution of institutions across the 26 stratifi-cation cells. The dividing lines between low,medium and high selectivity levels are differentfor different types of institutions and should not be used as a measure of institutional orprogram quality.
A comprehensive restratification of the nationalpopulation was undertaken in 2008, reviewingnot only institutions’ selectivity scores, but alsotheir type, control, and religious affiliation (ifany). All decisions on stratification cell assign-ment were based on data reported to IPEDS bythe institutions themselves. Appendix C lists the current stratification cell assignment of institutions that participated in the 2009 CIRPFreshman Survey.
Having defined the population in terms of thestratification cell scheme, the IPEDS file is usedto compute the male and female first-time, full-time (FTFT) population in each cell. Thesepopulation counts form the target counts of theweighting procedure.
Identifying the Norms SampleGenerally speaking, an institution is included in the national norms if it provided a repre-sentative sample of its FTFT population. Theminimum percentage required of a sample isbased on the type of institution from which it was collected. For four-year colleges theminimum is 75 percent, while for universities,the minimum is 65 percent. Institutions whosesample proportions were less than but close tothese cutoffs are included if the method used to administer the survey showed no systematicbiases in first-year class coverage.
Information about the FTFT population andthe method of survey administration is obtainedfrom participating institutions at the time theyreturn their completed surveys. In the event aninstitution did not return FTFT information,counts from the most recent IPEDS survey areused. This procedure, although not optimal, isadequate unless the institution experienced asubstantial change in its FTFT population sincethe last IPEDS survey.
The 2009 DataAlthough 278,012 respondents at 418 collegesand universities returned their forms in time for their data to be included in the 2008 norms,the normative data presented here are based on responses from 219,864 FTFT first-yearstudents entering 297 baccalaureate institutions.
The normative data presented here werecollected by administering the 2009 CIRPFreshman Survey during registration, first-yearorientation, or the first few weeks of classes (i.e.,before the students have had any substantialexperience with college life). The survey isdesigned to elicit a wide range of biographic and
142

143
Table A1. 2009 CIRP Freshman Survey National Norms Sample and Population
Selectivity Institutions First-time, Full-time Freshmen Cell Weights
Institution Strat Average Norms Unweighted Weighted
Type Cell Level Score Population Survey Sample Number Number Men Women Men Women
Public 1 low 800–1069 43 8 5 10,237 104,790 46.0% 54.0% 8.75 8.81
Universities 2 medium 1070–1149 41 10 5 15,037 146,910 48.8% 51.2% 8.20 8.173 high 1150–1600 43 14 11 36,942 190,485 48.1% 51.9% 4.15 4.19
Private 4 medium 800–1189 22 12 8 10,311 27,852 45.2% 54.8% 2.15 2.38
Universities 5 high 1190–1319 22 10 8 10,856 42,071 46.1% 53.9% 3.36 3.156 very high 1320–1600 27 14 11 15,581 45,347 49.6% 50.4% 2.23 2.30
Public 7,10 low 800–969 127 12 7 8,786 111,851 43.6% 56.4% 11.12 10.654-year 8 medium 970–1129 118 23 12 10,728 159,419 45.0% 55.0% 14.13 11.37Colleges 9 high 1130–1600 126 26 20 21,085 189,848 46.9% 53.1% 6.72 8.15
Private 11,15 low 800–989 137 17 10 1,766 39,861 50.3% 49.7% 20.67 15.67Nonsectarian 12 medium 990–1069 68 18 12 4,956 33,054 43.5% 56.5% 5.71 5.494-year 13 high 1070–1199 77 28 24 8,982 36,316 44.2% 55.8% 3.52 3.66Colleges 14 very high 1200–1600 75 46 33 13,401 35,605 43.7% 56.3% 2.27 2.38
Catholic 16,19 low 800–979 52 14 10 2,689 13,774 31.4% 68.6% 4.36 4.444-year 17 medium 980–1039 49 15 11 3,601 16,831 39.1% 60.9% 4.55 3.98Colleges 18 high 1040–1600 55 26 22 13,112 36,157 42.3% 57.7% 2.52 2.34
Other 20, 24 very low 800–979 102 10 5 1,440 24,414 47.1% 52.9% 12.67 16.14Religious 21 low 980–1029 91 22 17 5,017 24,944 46.8% 53.2% 4.33 4.204-year 22 medium 1030–1089 97 26 19 5,357 34,507 43.3% 56.7% 5.32 5.23Colleges 23 high 1090–1600 104 39 32 14,490 53,404 43.4% 56.6% 3.11 3.16
Predominantly 34 public — 37 8 5 2,340 29,241 43.0% 57.0% 7.10 7.21Black Colleges 35 private — 42 11 10 3,150 19,787 40.8% 59.2% 5.15 4.88
All Institutions 1,555 409 297 219,864 1,416,468 45.9% 54.1%
Note:– The broad categories of Institution Type are defined by data submitted to Integrated Postsecondary Educational Data System (IPEDS).– Selectivity is based on median SAT Verbal + Math scores and/or ACT composite scores of the entering class as reported to IPEDS. Institutions with unknown selectivity are grouped with
the low-selectivity institutions when computing national norms. The stratification design presented here is used to group schools to develop population weights and should not be usedas a measure of institutional or program quality.
– Cell Weights is the ratio between the number of first-time, full-time first-year students enrolled in all colleges and the number of first-time, full-time first-year students enrolled in thenorms sample colleges.
– Two-year colleges are not included in the norms sample. Therefore, the 9 two-year colleges participating in the 2009 CIRP Freshman Survey are not included in this table.

demographic data, as well as data on the highschool background, career plans, educationalaspirations, financial arrangements, high schoolactivities, and current attitudes. In addition tostandard biographic and demographic items that have been administered annually to eachentering class, the survey also contains otherresearch-oriented items that may have beenmodified from previous years. The inclusion of modified items permits a more thoroughcoverage of student characteristics but also repre-sents a compromise between two mutuallyexclusive objectives: (1) comparability of infor-mation from year to year which is required forassessing trends; and (2) flexibility in itemcontent to meet changing information andresearch needs.
The survey, reproduced as Appendix B, has beendeveloped in collaboration with students, profes-sional associations, participating institutions,government agencies, educational researchers,administrators, policy makers, and members ofthe CIRP Advisory Committee. The surveycontent is reviewed annually by the researchdirectors at the Higher Education ResearchInstitute (HERI) at UCLA with the assistance of the CIRP Advisory Committee as well asothers interested in the annual freshman surveyprogram.
First-time, full-time students enrolled at insti-tutions meeting minimal quality requirementsfor inclusion in the norms were differentiallyweighted to represent the national FTFT popu-lation. Part-time students and those who are not first-time college students (i.e., transfers and former enrollees) were excluded from thenormative sample.
Weighting the SampleThose institutions identified as being part of thenorms sample are weighted by a two-step proce-dure. The first weight is designed to adjust forresponse bias within institutions. Counts of themale and female FTFT population for eachinstitution are divided by that institution’s maleand female FTFT respondent count. Theresulting weights, when applied to each respon-dent, bring the male and female respondentcounts up to the corresponding counts for thepopulation at that institution.
The second weight is designed to compensatefor nonparticipating institutions within eachstratification cell. The weighted male and femalecounts for all participating institutions in eachstratification cell are first summed, and then aredivided into the national male and female FTFTcounts for all institutions in that stratificationcell, producing a second set of cell weights (seeTable A1).
The final weight is simply the product of thefirst and second weights. Weighting eachresponse in the norms sample using the finalweight brings the male and female counts up to the national number of first-time full-time freshmen in each stratification cell (see Table A1).
The weighted data are combined separately toform various comparison groups. Comparisongroups are hierarchically organized, allowingparticipating institutions to compare their resultsby type (four-year college, university), control(public, private nonsectarian, Roman Catholic,other religious), and selectivity level.
144

CIRP ConstructsCIRP Constructs represent sets of related surveyitems that measure an underlying trait or aspectof a student’s life. Item Response Theory (IRT),a modern psychometric method that has severaladvantages over methods used in more tradi-tional factor analysis, is used to create a constructscore for each respondent. Computing an indi-vidual’s construct score in IRT involves derivinga maximum likelihood score estimate based onthe pattern of the person’s responses to theentire set of survey items for that construct (orto a sub-set of the items that were answered).Items that tap into the trait more effectively aregiven greater weight in the estimation process(see Table A2). A respondent’s construct score is
thus not a simple arithmetic mean or weightedsum, but rather the estimated score that is mostlikely, given how the student answered the set ofitems. CIRP Constructs are scored on a Z-scoremetric and rescaled for a mean of approximatelyfifty and standard deviation of ten. The low,average, and high construct score group percent-ages and the mean for the construct are reportedhere. Low scores represent students who are one-half standard deviation below the mean. Averagescores represent students whose scores are withinone-half standard deviation of the mean. Highscores represent students who are one-half stan-dard deviation or more above the mean. Pleasevisit HERI’s website for more detailed informa-tion about CIRP Constructs.
145

146
Table A2. List of CIRP Freshman Survey Constructs(including survey items and estimation ‘weights’)
Habits of Mind—a unified measure of the behaviors and traits associated with academic success. These learning behaviors are seen as the foundation for lifelong learning.How often in the past year did you:• Seek solutions to problems and explain them to others (2.29) • Take a risk because you felt you had more to gain (1.30)• Support your opinions with a logical argument (1.97) • Explore topics on your own, even though it was not required for a class (1.28)• Seek alternative solutions to a problem (1.89) • Accept mistakes as part of the learning process (1.08)• Evaluate the quality or reliability of information you received (1.70) • Revise your papers to improve your writing (1.07)• Seek feedback on your academic work (1.38) • Look up scientific research articles and resources (0.96)• Ask questions in class (1.32)
Academic Self-Concept—is a unified measure of students’ beliefs about their abilities and confidence in academic environments.Rate yourself on each of the following traits as compared with the average person your age:• Academic ability (3.01) • Drive to achieve (1.18)• Self-confidence—intellectual (1.51) • Mathematical ability (1.14)
Social Self-Concept—is a unified measure of students’ beliefs about their abilities and confidence in social situations.Rate yourself on each of the following traits as compared with the average person your age:• Leadership ability (2.36) • Popularity (1.77)• Public speaking ability (1.84) • Self-confidence—social (1.69)
Pluralistic Orientation—measures skills and dispositions appropriate for living and working in a diverse society.Rate yourself on each of the following traits as compared with the average person your age:• Ability to work cooperatively with diverse people (2.60) • Ability to discuss and negotiate controversial issues (2.11)• Tolerance of others with different beliefs (2.52) • Ability to see the world from someone else’s perspective (1.99)• Openness to having my views challenged (2.29)
Social Agency—measures the extent to which students’ value political and social involvement as a personal goal.Indicate the importance to you personally of each of the following:• Participating in a community action program (2.64) • Influencing social values (1.62)• Helping to promote racial understanding (2.15) • Keeping up to date with political affairs (1.42)• Becoming a community leader (2.06) • Helping others who are in difficulty (1.36)
College Reputation Orientation—measures the degree to which students value academic reputation and future career potential as a reason for choosing this college.How important was each reason in your decision to come here?• This college’s graduates get good jobs (4.88) • This college has a very good academic reputation (1.56)• This college’s graduates gain admission to top graduate/professional
schools (2.67)
Likelihood of College Involvement—is a unified measure of students’ expectations about their involvement in college life generally.What is your best guess as to the chances that you will:• Socialize with someone of another racial/ethnic group (2.56) • Participate in student government (1.52)• Participate in a study abroad program (1.66) • Participate in student clubs/groups (1.21)• Participate in a volunteer or community service work (1.65)

APPENDIX B
The 2009 CIRP Freshman Survey Instrument


2009 CIRP FRESHMAN SURVEYPLEASE PRINT IN ALL CAPS YOUR NAME AND PERMANENT/HOME ADDRESS (one letter or number per box).
FIRST
NAME:
ADDRESS:
CITY:
MI LAST
STUDENT ID# (as instructed): EMAIL (print letters carefully):
STATE: ZIP: PHONE:
When were you born?
Month(01-12)
Day(01-31)
Year
MARKING DIRECTIONS
• Use a #2 pencil or black or blue pen.• Erase cleanly any answer you wish to change or “X” out mark if in pen.
CORRECT MARK INCORRECT MARKS
SE
RIA
L #
Group Code
A B
1. Your sex: Male Female
2. How old will you be on December 31 of this year? (Mark one)
16 or younger .
17....................
18....................
19....................
20....................
21-24 ........
25-29 ........
30-39 ........
40-54 ........
55 or older .
3. Is English your native language?
Yes No
4. In what year did you graduate from high school? (Mark one)
2009..........
2008..........
2007..........
Did not graduate but
passed G.E.D. test .
Never completed high school ...........
5. Are you enrolled (or enrolling) as a: (Mark one) Full-time student? ......
Part-time student? .....
6. How many miles is this college from your permanent home? (Mark one)
5 or less
6-10
11-50
51-100
101-500
Over 500
7. What was your average grade in high
school? (Mark one)
A or A+
A–
B+
B
B–
C+
C
D
8. What were your scores on the SAT I and/or ACT?
SAT VERBAL ..........................
SAT MATH ..............................
SAT WRITING ........................
9. From what kind of high school did you graduate? (Mark one)
Public school (not charter or magnet)
Public charter school
Public magnet school
Private religious/parochial school
Private independent college-prep school
Home school
10. Prior to this term, have you ever taken courses for credit at this institution?
Yes No
11. Since leaving high school, have you ever taken courses, whether for credit or not for credit, at any other institution (university, 4- or 2-year college, technical, vocational, or business school)?
Yes No
12. Where do you plan to live during the fall term? (Mark one)
With my family or other relatives ...........
Other private home, apartment, or room .
College residence hall ...........................
Fraternity or sorority house ...................
Other campus student housing .............
Other ......................................................
13. To how many colleges other than this one did you apply for admission this year?
None 1
2
3
7-10
11 or more
4
5
6
14. Were you accepted by your first choice college? Yes No
15. Is this college your: (Mark one)
First choice? ..........
Second choice? .....
Third choice? .........
Less than third
choice? .........
16. Citizenship status:
U.S. citizen
Permanent resident (green card)
Neither
19. Have you had, or do you feel you will need, any special tutoring or remedial work in any of the following subjects?(Mark all that apply)
English ...................................................
Reading .................................................
Mathematics ..........................................
Social Studies ........................................
Science ..................................................
Foreign Language .................................
Writing ...................................................
Have H
ad
Will N
eed
21. What is the highest academic degree that you intend to obtain? (Mark one in each column)
None .................................................
Vocational certificate ........................
Associate (A.A. or equivalent) ..........
Bachelor’s degree (B.A., B.S., etc.) ..
Master’s degree (M.A., M.S., etc.) ....
Ph.D. or Ed.D. ...................................
M.D., D.O., D.D.S., or D.V.M..............
J.D. (Law) ..........................................
B.D. or M.DIV. (Divinity) ....................
Other .................................................
Hig
hest
Pla
nn
ed
22. How would you describe the racial composition of the high school you last attended and the neighbor- hood where you grew up? (Mark one in each row)
High school I last attended ....
Neighborhood where I grew up .
Co
mp
lete
lyW
hit
e
Mo
stly W
hit
e
Ro
ug
hly
half
no
n-W
hit
e
Mo
stly
no
n-W
hit
e
Co
mp
lete
lyn
on
-Wh
ite
2006 or earlier
ACT Composite ............................
aaaaa~aa
` `
`````
` `
````
`
`
``
``
``
``
```
```
``
``````
` `
` `
``````
```
```
```
` `
```
`
```
```````
```````
``````````
``````````
``
``
``
``
``
`````
17. Are you a veteran? (Mark one)
Yes No` `
Hig
hest
Pla
nn
ed
at T
his
Co
lleg
e
...
...
...
...
...
...
...
...
...
...
20. How many Advanced Placement courses or exams did you take in high school?(Mark one in each row)
AP Courses ......................
AP Exams .........................
10-1
4
15+
``
``
5-9
1-4
No
ne
No
t o
ffere
d a
t m
y h
igh
sch
oo
l
``
``
``
``
18. Are your parents: (Mark one)
Both alive and living with each other? ...
Both alive, divorced or living apart? ......
One or both deceased? .........................
```
149

150
23. How much of your first year’s educational expenses (room, board, tuition, and fees) do you expect to cover from each of the sources listed below?(Mark one answer for eachpossible source)
Family resources (parents,
relatives, spouse, etc.) ........
No
ne
Les
s th
an $
1,00
0$1
,000
to
2,9
99$3
,000
to
5,9
99$6
,000
to
9,9
99$1
0,00
0+
24.What is your best estimate of your parents’ total income last year? Consider income from all sources before taxes. (Mark one)
Less than $10,000
$10,000-14,999
$15,000-19,999
$20,000-24,999
$25,000-29,999
$30,000-39,999
$40,000-49,999
$50,000-59,999
$60,000-74,999
$75,000-99,999
$100,000-149,999
$150,000-199,999
$200,000-249,999
$250,000 or more
25.Do you have any concern about your ability to finance your college education? (Mark one)
None (I am confident that I will have
sufficient funds) ..............................................
26.Current religious preference:(Mark one in each column) Yo
urs
Fath
er’s
Mo
ther
’s
Baptist ....................................................
Buddhist .................................................
Church of Christ ....................................
Eastern Orthodox ..................................
Episcopalian ..........................................
Hindu .....................................................
Jewish ....................................................
LDS (Mormon) .......................................
Lutheran ................................................
Methodist ...............................................
Muslim ...................................................
Presbyterian ..........................................
Quaker ...................................................
Roman Catholic .....................................
Seventh Day Adventist ..........................
United Church of Christ/Congregational .
Other Christian .............................................
Other Religion ..............................................
None .............................................................
27. For the activities below, indicate which ones you did during the past year. If you engaged in an activity frequently, mark . If you engaged in an activity one or more times, but not frequently, mark (Occasionally). Mark (Not at all)if you have not performed theactivity during the past year.(Mark one for each item)
Fre
qu
ently
Occ
asio
nal
lyN
ot
at A
ll
Attended a religious service .......
Was bored in class .....................
Participated in political
demonstrations .........................
Tutored another student .............
Studied with other students ........
Was a guest in a teacher’s home ...
Smoked cigarettes ......................
Drank beer ..................................
Drank wine or liquor ...................
Felt overwhelmed by all I had to do ...
Felt depressed ............................
Performed volunteer work ..........
Played a musical instrument ......
Asked a teacher for advice
after class .................................
Voted in a student election .........
Socialized with someone of
another racial/ethnic group .......
Came late to class ......................
Used the Internet:
For research or homework .......
To read news sites....................
To read blogs ............................
To blog ......................................
Performed community service
as a part of a class...................
Discussed religion ......................
Discussed politics .......................
Skipped school/class ..................
28. Rate yourself on each of the following traits as compared with the average person your age. We want the most accurate estimate of how you see yourself.(Mark one in each row)
Hig
hes
t 10
%A
bov
e A
vera
ge
Ave
rag
eB
elow
Ave
rag
eL
owes
t 10
%
29. Rate yourself on each of the following traits as compared with the average person your age. We want the most accurate estimate of how you see yourself.(Mark one for each item)
Hig
hes
t 10
%A
bov
e A
vera
ge
Ave
rag
e
Ability to see the world
from someone else’s
perspective ...............
Bel
ow A
vera
ge
Low
est
10%
Tolerance of others
with different beliefs .
Openness to having
my own views
challenged ................
Ability to discuss and
negotiate controversial
issues ........................
Ability to work
cooperatively with
diverse people ..........
31. How often in the past year did you?(Mark one for each item)
Ask questions in class ...........
Support your opinions with
a logical argument ...............
Seek solutions to problems
and explain them to others ...
Revise your papers to
improve your writing ............
Evaluate the quality or
reliability of information
you received ........................
Take a risk because you feel
you have more to gain .........
Seek alternative solutions
to a problem ........................
Look up scientific research
articles and resources .........
Explore topics on your own,
even though it was not
required for a class ..............
Accept mistakes as part of
the learning process ............
Seek feedback on your
academic work ....................
Take notes during class .........
Work with other students
on class assignments ..........
```````
```````
``
`
Y Y
Y Y Y Y Y Y Y Y Y Y Y Y Y Y Y YY
F F
F F F F F F F F F F F F F F F F F
M M
M M M M M M M M M M M M M M M M M
FF
FFFFFFFFFFF
FF
FF
FFFF
FFFF
````````````
````
``
````````````
````
``
````````````
````
``
````````````
````
``
````````````
````
``
F
NO
OO
OOOOOOOOOOO
OO
OO
OOOO
OOOO
NN
NNNNNNNNNNN
NN
NN
NNNN
NNNN
`
`
`
`
`
`
`
`
`
`
`
`
`
`
`
`
`
`
`
`
`
`
`
`
`
F
F
F
F
F
F
F
F
F
F
F
F
F
No
t at
All
O
O
O
O
O
O
O
O
O
O
O
O
O
N
N
N
N
N
N
N
N
N
N
N
N
N
``````
``````
``````
````````````
My own resources (savings
from work, work-study,
other income) ......................
Aid which need not be repaid
(grants, scholarships,
military funding, etc.) ...........
Aid which must be repaid
(loans, etc.)..........................
Other than above ...................
Some (but I probably will have enough funds) ....
Major (not sure I will have enough funds
to complete college) .......................................
Academic ability .........
Artistic ability ..............
Computer skills ...........
Cooperativeness .........
Creativity .....................
Drive to achieve ..........
Emotional health .........
Leadership ability .......
Mathematical ability ....
Physical health ...........
Popularity ....................
Public speaking ability .
Self-confidence
(intellectual) ..............
Self-confidence (social) ..
Self-understanding .....
Spirituality ...................
Understanding of
others .......................
Writing ability ..............
Fre
qu
ently
Occ
asio
nal
ly
30. What is the highest level of formal education obtained by your parents? (Mark one in each column)
Father Mother
```
`````
```
`````
...
...
...
...
...
...
...
...
Grammar school or less .......
Some high school .................
High school graduate ...........
Postsecondary school
other than college ...............
Some college ........................
College degree .....................
Some graduate school .........
Graduate degree ..................

151
32. Mark only three responses, one in each column.
Accountant or actuary ....................
Actor or entertainer ........................
Architect or urban planner ..............
Artist ...............................................
Business (clerical) ..........................
Business executive
(management, administrator) .......
Business owner or proprietor .........
Business salesperson or buyer ......
Clergy (minister, priest) ..................
Clergy (other religious) ...................
Clinical psychologist .......................
College administrator/staff ..............
College teacher ..............................
Computer programmer or analyst ..
Conservationist or forester .............
Dentist (including orthodontist) .......
Dietitian or nutritionist .....................
Engineer .........................................
Farmer or rancher ..........................
Foreign service worker
(including diplomat) ......................
Homemaker (full-time) ....................
Interior decorator (including designer) .
Lab technician or hygienist .............
Law enforcement officer .................
Lawyer (attorney) or judge .............
Military service (career) ..................
Musician (performer, composer) .....
Nurse ..............................................
Optometrist .....................................
Pharmacist .....................................
Physician ........................................
Policymaker/Government ...............
School counselor ............................
School principal or superintendent .
Scientific researcher .......................
Social, welfare, or recreation worker .
Therapist (physical, occupational,
speech) .......................................
Teacher or administrator
(elementary) ................................
Teacher or administrator
(secondary) .................................
Veterinarian ....................................
Writer or journalist ..........................
Skilled trades ..................................
Laborer (unskilled) ..........................
Semi-skilled worker ........................
Unemployed....................................
Other ...............................................
Undecided ......................................
Your mother’s occupation
Your father’s occupation
Your probable career occupation
Y Y Y Y Y Y Y Y Y Y Y Y Y Y Y Y YYY
Y Y Y Y Y Y Y Y Y Y Y Y Y Y Y Y Y Y Y Y Y Y Y Y Y Y Y Y
F F F F F F F F F F F F F F F F F FF F F F F F F F F F F F F F F F F F F F F F F F F F F F
M M M M M M M M M M M M M M M M M MM M M M M M M M M M M M M M M M M M M M M M M M M M M M
34. Mark one in each row:
There is too much concern in the courts for the rights of criminals ...........................
Abortion should be legal.............................................................................................
Marijuana should be legalized ....................................................................................
Racial discrimination is no longer a major problem in America .................................
Realistically, an individual can do little to bring about changes in our society ...........
Same-sex couples should have the right to legal marital status ................................
Only volunteers should serve in the armed forces .....................................................
Dissent is a critical component of the political process..............................................
Colleges have the right to ban extreme speakers from campus ................................
Students from disadvantaged social backgrounds should be given preferential
treatment in college admissions ...............................................................................
Colleges should prohibit racist/sexist speech on campus ..........................................
Disagree Strongly1Disagree Somewhat2
Agree Somewhat3Agree Strongly4
YFM
444 4 4 4 4 4 4
4 4
35. How would you characterize your political views? (Mark one)
Far left
Liberal
Middle-of-the-road
Conservative
Far right
`````
37. During your last year in high school, how much time did you spend during a typical week doing thefollowing activities?
Hours per week:Studying/homework ....
Socializing with friends .
Talking with teachers
outside of class .......
Exercise or sports.......
Partying ......................
Working (for pay) ........
Volunteer work ............
Student clubs/groups ..
Watching TV ...............
Household/childcare
duties .......................
Reading for pleasure ..
Playing video/
computer games .....
Online social networks
(MySpace, Facebook, etc.) .
No
neL
ess
than
1 h
our
1-2
3-5
6-10
11-1
5
16-2
0
`
`
`
Ove
r 20
`
`
`
`
`
`
`
`
`
`
`
`
`
`
`
`
`
`
`
`
`
36. In deciding to go to college, how important to you was each of the following reasons?(Mark one answer for each possible reason)
My parents wanted me to go ...........
To be able to get a better job ..........
To gain a general education
and appreciation of ideas .............
To make me a more cultured
person ..........................................
To be able to make more money ......
To learn more about things that
interest me ...................................
Ver
y Im
po
rtan
t
No
t Im
po
rtan
t
VV
V
VV
V
SS
S SS S
NN
N NN N
So
mew
hat
Im
po
rtan
t
White/Caucasian .............................
African American/Black ...................
American Indian/Alaska Native .......
Asian American/Asian .....................
Native Hawaiian/Pacific Islander .....
Mexican American/Chicano .............
Puerto Rican....................................
Other Latino .....................................
Other ................................................
`````````
33. Are you: (Mark all that apply)
333333333
33
222222222
22
111111111
11
38. Below are some reasons that might have influenced your decision to attend this particular college. How important was each reason inyour decision to come here?(Mark one answer for eachpossible reason)
My parents wanted me to come here ...
My relatives wanted me to come here ..
My teacher advised me .......................
This college has a very good
academic reputation ..........................
This college has a good reputation
for its social activities ........................
I was offered financial assistance........
The cost of attending this college .......
High school counselor advised me .....
Private college counselor advised me .....
I wanted to live near home ..................
Not offered aid by first choice ..............
Could not afford first choice ................
This college’s graduates gain
admission to top graduate/
professional schools ..........................
This college’s graduates get good jobs .
I was attracted by the religious
affiliation/orientation of the college ....
I wanted to go to a school about the
size of this college .............................
Rankings in national magazines .........
Information from a website ..................
I was admitted through an Early
Action or Early Decision program .....
The athletic department recruited me .
A visit to the campus ...........................
Ability to take online courses ...............
Ver
y Im
po
rtan
tS
omew
hat I
mpo
rtan
tN
ot Im
port
ant
V
V
V
V
V
V
V
V
V
V
V
V
V
V
V
V
V
V
V
V
V
V
S
S
S
S
S
S
S
S
S
S
S
S
S
S
S
S
S
S
S
S
S
S
N
N
N
N
N
N
N
N
N
N
N
N
N
N
N
N
N
N
N
N
N
N

4
39. Below is a list of different undergraduate major fields grouped into general categories. Mark only one oval to indicate your probable field of study.
ARTS AND HUMANITIES
Art, fine and applied .............
English (language and
literature) ...........................
History ..................................
Journalism ............................
Language and Literature
(except English) ................
Music ....................................
Philosophy ............................
Speech .................................
Theater or Drama .................
Theology or Religion ............
Other Arts and Humanities ...
BIOLOGICAL SCIENCE
Biology (general) ..................
Biochemistry or
Biophysics .........................
Botany ..................................
Environmental Science .........
Marine (Life) Science ...........
Microbiology or
Bacteriology ......................
Zoology .................................
Other Biological Science ......
BUSINESS
Accounting ............................
Business Admin. (general) ...
Finance .................................
International Business ..........
Marketing ..............................
Management .........................
Secretarial Studies ...............
Other Business .....................
EDUCATION
Business Education ..............
Elementary Education ..........
Music or Art Education .........
Physical Education or
Recreation .........................
Secondary Education ...........
Special Education .................
Other Education ...................
ENGINEERING
Aeronautical or
Astronautical Eng ..............
Civil Engineering ..................
Chemical Engineering ..........
Computer Engineering .........
Electrical or Electronic
Engineering .......................
Industrial Engineering ...........
Mechanical Engineering .......
Other Engineering ................
1
234
56789º¡
™
£¢
§
¶•ª
````````
```
````
````
````
20
21
22
23
24
25
26
27
28
29
30
31
32
33
34
35
36
37
38
39
40
41
42
PHYSICAL SCIENCE
Astronomy ............................
Atmospheric Science
(incl. Meteorology) .............
Chemistry .............................
Earth Science .......................
Marine Science (incl.
Oceanography) ..................
Mathematics .........................
Physics .................................
Other Physical Science ........
PROFESSIONAL
Architecture or Urban
Planning ............................
Family & Consumer Sciences .
Health Technology (medi-
cal, dental, laboratory) ......
Library or Archival Science ..
Medicine, Dentistry,
Veterinary Medicine ...........
Nursing .................................
Pharmacy .............................
Therapy (occupational,
physical, speech) ..............
Other Professional ................
SOCIAL SCIENCE
Anthropology ........................
Economics ............................
Ethnic Studies ......................
Geography ............................
Political Science (gov’t.,
international relations) .......
Psychology ...........................
Public Policy .........................
Social Work ..........................
Sociology ..............................
Women’s Studies ..................
Other Social Sciences ..........
TECHNICAL
Building Trades .....................
Data Processing or
Computer Programming ....
Drafting or Design ................
Electronics ............................
Mechanics ............................
Other Technical .....................
OTHER FIELDS
Agriculture ............................
Communications ...................
Computer Science ................
Forestry ................................
Kinesiology ...........................
Law Enforcement ..................
Military Science ....................
Other Field ............................
Undecided ............................
`
```
````
``
``
```
``
````
```````
`
`````
`````````
43
44
45
46
47
48
49
50
51
52
53
54
55
56
57
58
59
60
61
62
63
64
65
66
67
68
69
70
71
72
73
74
75
76
77
78
79
80
81
82
83
84
85
40.Please indicate the importance to you personally of each of the following: (Mark one for each item)
Becoming accomplished in one of
the performing arts (acting, dancing, etc.) .........................
Becoming an authority in my field ........................................
Obtaining recognition from my colleagues for
contributions to my special field .........................................
Influencing the political structure ..........................................
Influencing social values ......................................................
Raising a family ....................................................................
Being very well off financially ...............................................
Helping others who are in difficulty ......................................
Making a theoretical contribution to science ........................
Writing original works (poems, novels, short stories, etc.) ...
Creating artistic works (painting, sculpture, decorating, etc.) .
Becoming successful in a business of my own ....................
Becoming involved in programs to clean up the environment .
Developing a meaningful philosophy of life ..........................
Participating in a community action program .......................
Helping to promote racial understanding .............................
Keeping up to date with political affairs ................................
Becoming a community leader .............................................
Improving my understanding of other countries and cultures .
Adopting “green” practices to protect the environment ........
Not ImportantNSomewhat ImportantS
Very ImportantVEssentialE
EE E E E E E E E E E E E E E E E E E E
V V V V V V V V V V V V V V V V V V V V
S S S S S S S S S S S S S S S S S S S S
N N N N N N N N N N N N N N N N N N N N
What is your best guess as to the chances that you will:(Mark one for each item)
Change major field? ...................................................................
Change career choice? ..............................................................
Participate in student government? ............................................
Get a job to help pay for college expenses? ..............................
Work full-time while attending college? ......................................
Join a social fraternity or sorority? .............................................
Play club, intramural, or recreational sports? .............................
Play intercollegiate athletics (e.g., NCAA or NAIA-sponsored)? .
Make at least a “B” average? .....................................................
Need extra time to complete your degree requirements? ..........
Participate in student protests or demonstrations? ....................
Transfer to another college before graduating? ..........................
Be satisfied with your college? ...................................................
Participate in volunteer or community service work? .................
Seek personal counseling? ........................................................
Communicate regularly with your professors? ...........................
Socialize with someone of another racial/ethnic group? ............
Participate in student clubs/groups? ..........................................
Participate in a study abroad program? .....................................
Have a roommate of a different race/ethnicity? .........................
Discuss course content with students outside of class? ............
Work on a professor’s research project? ....................................
No ChanceNVery Little ChanceL
Some ChanceSVery Good ChanceV
V V V V V V V V V V V V V V V V V V V V VV
S S S S S S S S S S S S S S S S S S S S SS
N N N N N N N N N N N N N N N N N N N N NN
42.Do you give the Higher Education Research Institute (HERI) permission to include your ID number should your college request the data for additional research analyses? HERI maintains strict standards of confidentiality and would require your college to sign a pledge of confidentiality.
The remaining ovals are provided for questions specifically designed by your college rather than the Higher Education Research Institute. If your college has chosen to use the ovals, please observe carefully the supplemental directions given to you.
Yes No` `
43.
44.
45.
46.
ABCDEABCDEABCDEABCDE
47.
48.
49.
50.
ABCDEABCDEABCDEABCDE
51.
52.
53.
54.
ABCDEABCDEABCDEABCDE
55.
56.
57.
58.
ABCDEABCDEABCDEABCDE
59.
60.
61.
62.
ABCDEABCDEABCDEABCDE
THANK YOU!© Prepared by the Higher Education Research Institute, University
of California, Los Angeles, California 90095-1521 Data Recognition Corp.-6G9044-9312-54321
41.
LLLLLLLLLLLLLLLLLLLLLL
152

APPENDIX C
Institutions Participating in the 2009 CIRP Freshman Survey

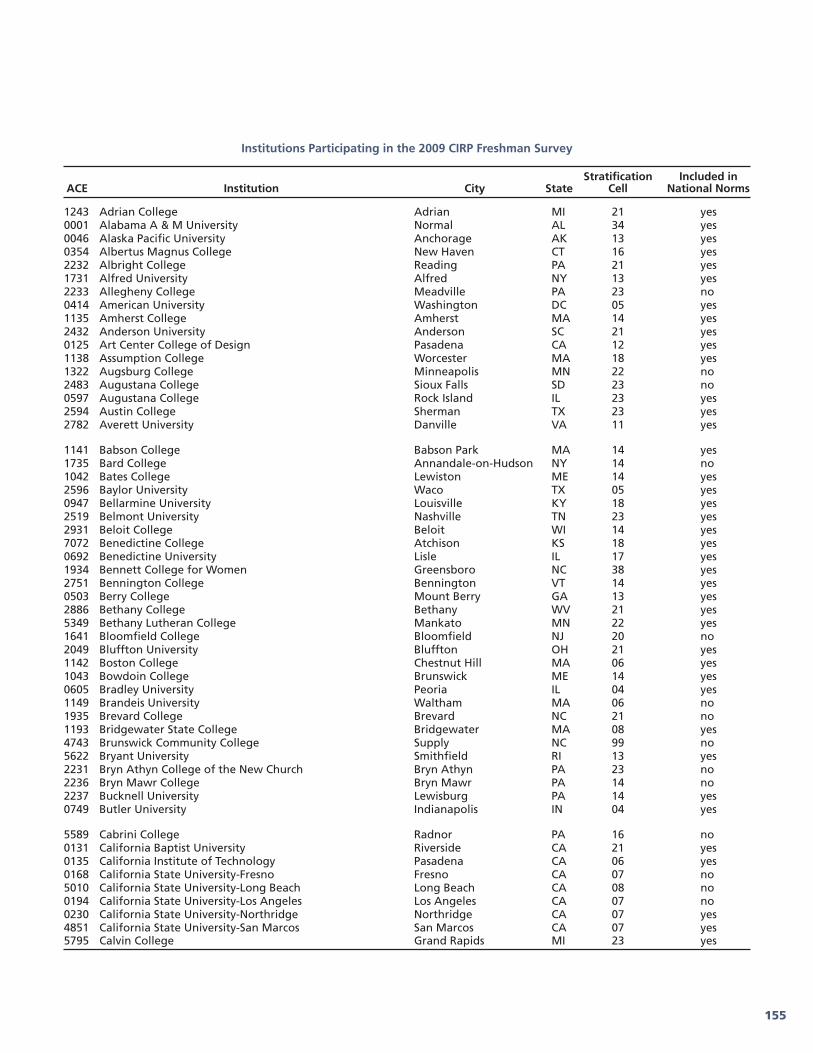
1243 Adrian College Adrian MI 21 yes0001 Alabama A & M University Normal AL 34 yes0046 Alaska Pacific University Anchorage AK 13 yes0354 Albertus Magnus College New Haven CT 16 yes2232 Albright College Reading PA 21 yes1731 Alfred University Alfred NY 13 yes2233 Allegheny College Meadville PA 23 no0414 American University Washington DC 05 yes1135 Amherst College Amherst MA 14 yes2432 Anderson University Anderson SC 21 yes0125 Art Center College of Design Pasadena CA 12 yes1138 Assumption College Worcester MA 18 yes1322 Augsburg College Minneapolis MN 22 no2483 Augustana College Sioux Falls SD 23 no0597 Augustana College Rock Island IL 23 yes2594 Austin College Sherman TX 23 yes2782 Averett University Danville VA 11 yes
1141 Babson College Babson Park MA 14 yes1735 Bard College Annandale-on-Hudson NY 14 no1042 Bates College Lewiston ME 14 yes2596 Baylor University Waco TX 05 yes0947 Bellarmine University Louisville KY 18 yes2519 Belmont University Nashville TN 23 yes2931 Beloit College Beloit WI 14 yes7072 Benedictine College Atchison KS 18 yes0692 Benedictine University Lisle IL 17 yes1934 Bennett College for Women Greensboro NC 38 yes2751 Bennington College Bennington VT 14 yes0503 Berry College Mount Berry GA 13 yes2886 Bethany College Bethany WV 21 yes5349 Bethany Lutheran College Mankato MN 22 yes1641 Bloomfield College Bloomfield NJ 20 no2049 Bluffton University Bluffton OH 21 yes1142 Boston College Chestnut Hill MA 06 yes1043 Bowdoin College Brunswick ME 14 yes0605 Bradley University Peoria IL 04 yes1149 Brandeis University Waltham MA 06 no1935 Brevard College Brevard NC 21 no1193 Bridgewater State College Bridgewater MA 08 yes4743 Brunswick Community College Supply NC 99 no5622 Bryant University Smithfield RI 13 yes2231 Bryn Athyn College of the New Church Bryn Athyn PA 23 no2236 Bryn Mawr College Bryn Mawr PA 14 no2237 Bucknell University Lewisburg PA 14 yes0749 Butler University Indianapolis IN 04 yes
5589 Cabrini College Radnor PA 16 no0131 California Baptist University Riverside CA 21 yes0135 California Institute of Technology Pasadena CA 06 yes0168 California State University-Fresno Fresno CA 07 no5010 California State University-Long Beach Long Beach CA 08 no0194 California State University-Los Angeles Los Angeles CA 07 no0230 California State University-Northridge Northridge CA 07 yes4851 California State University-San Marcos San Marcos CA 07 yes5795 Calvin College Grand Rapids MI 23 yes
155
Institutions Participating in the 2009 CIRP Freshman Survey
Stratification Included inACE Institution City State Cell National Norms

1936 Campbell University Inc Buies Creek NC 22 yes1744 Canisius College Buffalo NY 18 no2933 Cardinal Stritch University Milwaukee WI 17 no1327 Carleton College Northfield MN 14 yes0606 Carthage College Kenosha WI 22 yes2750 Castleton State College Castleton VT 08 yes0416 Catholic University of America Washington DC 04 no1745 Cazenovia College Cazenovia NY 11 no2054 Central State University Wilberforce OH 34 yes0141 Chapman University Orange CA 23 yes1941 Chowan University Murfreesboro NC 20 yes2523 Christian Brothers University Memphis TN 18 yes6332 Christopher Newport University Newport News VA 09 yes2435 Citadel Military College of South Carolina Charleston SC 09 yes0147 Claremont McKenna College Claremont CA 14 yes1151 Clark University Worcester MA 14 yes1748 Clarkson University Potsdam NY 04 yes2438 Coker College Hartsville SC 11 yes1044 Colby College Waterville ME 14 yes1749 Colgate University Hamilton NY 14 no1752 College of Mount Saint Vincent Riverdale NY 16 yes1078 College of Notre Dame of Maryland Baltimore MD 17 yes1329 College of St Catherine Saint Paul MN 18 yes1152 College of the Holy Cross Worcester MA 18 yes7402 Colorado Christian University Lakewood CO 22 yes0319 Colorado College Colorado Springs CO 14 yes0318 Colorado State University Fort Collins CO 02 no1761 Concordia College Bronxville NY 20 no0359 Connecticut College New London CT 14 no4630 Corcoran College of Art and Design Washington DC 12 yes1763 Cornell University Ithaca NY 06 yes1463 Cottey College Nevada MO 99 no5821 Covenant College Lookout Mountain GA 23 no1573 Creighton University Omaha NE 05 yes6430 CUNY Lehman College Bronx NY 07 no7254 CUNY Medgar Evers College Brooklyn NY 34 no
1942 Davidson College Davidson NC 23 yes2244 Delaware Valley College Doylestown PA 12 yes0631 DePaul University Chicago IL 04 no5882 DeSales University Center Valley PA 18 no2247 Dickinson College Carlisle PA 14 yes1005 Dillard University New Orleans LA 38 yes0687 Dominican University River Forest IL 17 yes1646 Drew University Madison NJ 23 yes2251 Drexel University Philadelphia PA 04 yes1943 Duke University Durham NC 06 yes
0753 Earlham College Richmond IN 23 yes0959 Eastern Kentucky University Richmond KY 07 no1281 Eastern Michigan University Ypsilanti MI 08 no2845 Eastern Washington University Cheney WA 08 no0464 Eckerd College Saint Petersburg FL 23 yes1982 Elizabeth City State University Elizabeth City NC 34 no0634 Elmhurst College Elmhurst IL 22 yes5105 Embry Riddle Aeronautical University Daytona Beach FL 13 no
156
Institutions Participating in the 2009 CIRP Freshman Survey
Stratification Included inACE Institution City State Cell National Norms

1158 Emmanuel College Boston MA 18 yes2787 Emory and Henry College Emory VA 21 yes0511 Emory University Atlanta GA 06 yes2444 Erskine College and Seminary Due West SC 22 no5387 Evangel University Springfield MO 22 no
0362 Fairfield University Fairfield CT 18 yes2788 Ferrum College Ferrum VA 20 yes5289 Fisher College Boston MA 15 no2527 Fisk University Nashville TN 35 yes0459 Florida College Temple Terrace FL 22 yes0462 Florida Southern College Lakeland FL 22 yes0463 Florida State University Tallahassee FL 03 yes1773 Fordham University New York NY 05 yes5414 Franklin Pierce University Rindge NH 11 yes2528 Freed-Hardeman University Henderson TN 22 yes2446 Furman University Greenville SC 14 no
2261 Gannon University Erie PA 18 yes0421 Georgetown University Washington DC 06 yes0518 Georgia College & State University Milledgeville GA 09 yes0515 Georgia Institute of Technology—Main Campus Atlanta GA 03 yes2263 Gettysburg College Gettysburg PA 23 yes2892 Glenville State College Glenville WV 07 yes2847 Gonzaga University Spokane WA 18 yes1164 Gordon College-Wenham Wenham MA 23 yes5199 Grace College and Theological Seminary Winona Lake IN 22 yes0833 Grand View University Des Moines IA 20 no0641 Greenville College Greenville IL 22 no0834 Grinnell College Grinnell IA 14 yes1953 Guilford College Greensboro NC 23 yes1338 Gustavus Adolphus College Saint Peter MN 23 yes2265 Gwynedd Mercy College Gwynedd Valley PA 16 yes
1776 Hamilton College Clinton NY 14 yes9107 Harrisburg University of Science and Technology Harrisburg PA 15 no1777 Hartwick College Oneonta NY 13 yes0180 Harvey Mudd College Claremont CA 14 no2267 Haverford College Haverford PA 14 yes5160 Highland Community College Freeport IL 99 no2072 Hiram College Hiram OH 12 yes1755 Hobart William Smith Colleges Geneva NY 13 yes2794 Hollins University Roanoke VA 13 no0152 Holy Names University Oakland CA 16 no0424 Howard University Washington DC 41 no0008 Huntingdon College Montgomery AL 22 yes
0642 Illinois College Jacksonville IL 22 no0644 Illinois Institute of Technology Chicago IL 14 no0835 Iowa State University Ames IA 02 yes0837 Iowa Wesleyan College Mount Pleasant IA 20 yes
0091 John Brown University Siloam Springs AR 13 yes1085 Johns Hopkins University Baltimore MD 06 yes1956 Johnson C Smith University Charlotte NC 35 yes2272 Juniata College Huntingdon PA 13 yes
157
Institutions Participating in the 2009 CIRP Freshman Survey
Stratification Included inACE Institution City State Cell National Norms

1272 Kalamazoo College Kalamazoo MI 14 yes0909 Kansas Wesleyan University Salina KS 21 no1617 Keene State College Keene NH 08 yes6168 Kennesaw State University Marietta GA 09 yes1262 Kettering University Flint MI 13 yes2273 Keystone College La Plume PA 11 no0652 Knox College Galesburg IL 14 no
4621 Laguna College of Art and Design Laguna Beach CA 15 yes0653 Lake Forest College Lake Forest IL 13 yes2945 Lakeland College Plymouth WI 20 no2947 Lawrence University Appleton WI 14 yes5357 Lawson State Community College—Birmingham Campus Birmingham AL 99 no1794 Le Moyne College Syracuse NY 18 yes2277 Lebanon Valley College Annville PA 23 yes1958 Lenoir-Rhyne University Hickory NC 21 no2194 Lewis & Clark College Portland OR 14 yes2539 Lincoln Memorial University Harrogate TN 11 no2279 Lincoln University of Pennsylvania Lincoln University PA 34 yes2796 Longwood University Farmville VA 09 no1086 Loyola College in Maryland Baltimore MD 18 yes0657 Loyola University Chicago Chicago IL 04 yes0841 Luther College Decorah IA 23 yes2283 Lycoming College Williamsport PA 22 yes0079 Lyon College Batesville AR 23 yes
1344 Macalester College Saint Paul MN 23 yes5255 Maine Maritime Academy Castine ME 08 yes0769 Manchester College North Manchester IN 21 yes1796 Manhattan College Riverdale NY 18 yes2077 Marietta College Marietta OH 13 yes2801 Mary Baldwin College Staunton VA 22 yes1804 Marymount Manhattan College New York NY 12 no2543 Maryville College Maryville TN 23 yes1496 Maryville University of Saint Louis Saint Louis MO 13 yes2285 Marywood University Scranton PA 17 yes1197 Massachusetts College of Liberal Arts North Adams MA 08 yes5170 McKendree University Lebanon IL 21 yes0913 McPherson College McPherson KS 21 yes1176 Merrimack College North Andover MA 18 no2290 Messiah College Grantham PA 23 yes2079 Miami University-Oxford Oxford OH 03 yes1278 Michigan Technological University Houghton MI 09 yes2755 Middlebury College Middlebury VT 14 yes0199 Mills College Oakland CA 13 yes1471 Missouri Southern State University Joplin MO 09 yes5475 Molloy College Rockville Centre NY 12 yes1662 Montclair State University Montclair NJ 08 yes2287 Moore College of Art and Design Philadelphia PA 11 yes2289 Moravian College and Moravian Theological Seminary Bethlehem PA 22 yes5796 Morehouse College Atlanta GA 35 yes1094 Morgan State University Baltimore MD 34 no0844 Morningside College Sioux City IA 22 yes1177 Mount Holyoke College South Hadley MA 14 no0203 Mount St Mary’s College Los Angeles CA 16 yes1096 Mount St Mary’s University Emmitsburg MD 18 yes
158
Institutions Participating in the 2009 CIRP Freshman Survey
Stratification Included inACE Institution City State Cell National Norms

6542 Mount Vernon Nazarene University Mount Vernon OH 21 yes0204 Mt San Antonio College Walnut CA 99 no
8602 Naropa University Boulder CO 15 no5888 Neumann College Aston PA 16 yes1818 Niagara University Niagara University NY 18 yes0674 North Central College Naperville IL 23 yes5403 North Central Missouri College Trenton MO 99 no2022 North Dakota State University—Main Campus Fargo ND 02 no0529 North Georgia College & State University Dahlonega GA 09 yes2157 Northeastern State University Tahlequah OK 07 yes1184 Northeastern University Boston MA 05 no0678 Northern Illinois University De Kalb IL 01 yes2216 Northwest Christian University Eugene OR 21 yes0582 Northwest Nazarene University Nampa ID 22 no0679 Northwestern University Evanston IL 06 yes1820 Nyack College Nyack NY 20 yes
1286 Oakland University Rochester MI 08 yes2084 Oberlin College Oberlin OH 14 no0207 Occidental College Los Angeles CA 14 yes2061 Ohio Dominican University Columbus OH 17 no2089 Ohio University—Main Campus Athens OH 02 yes2163 Oklahoma City University Oklahoma City OK 23 yes5566 Oklahoma Wesleyan University Bartlesville OK 22 yes0190 Otis College of Art and Design Los Angeles CA 12 yes4892 Oxford College of Emory University Oxford GA 99 no
0214 Pacific Union College Angwin CA 21 no2207 Pacific University Forest Grove OR 13 no6615 Palm Beach Atlantic University-West Palm Beach West Palm Beach FL 22 yes9106 Patrick Henry College Purcellville VA 99 no0172 Pepperdine University Malibu CA 23 no0104 Philander Smith College Little Rock AR 38 yes5588 Point Park University Pittsburgh PA 12 yes1826 Polytechnic Institute of New York University Brooklyn NY 13 yes1827 Pratt Institute-Main Brooklyn NY 04 no0683 Principia College Elsah IL 13 yes2409 Providence College Providence RI 18 yes
0373 Quinnipiac University Hamden CT 13 no
2825 Radford University Radford VA 08 no7241 Ramapo College of New Jersey Mahwah NJ 09 yes2805 Randolph College Lynchburg VA 23 yes2209 Reed College Portland OR 14 yes1187 Regis College Weston MA 16 yes0534 Reinhardt College Waleska GA 20 no2410 Rhode Island College Providence RI 07 yes2413 Rhode Island School of Design Providence RI 14 yes2554 Rhodes College Memphis TN 23 yes2645 Rice University Houston TX 06 no1667 Rider University Lawrenceville NJ 12 no8430 Ringling College of Art and Design Sarasota FL 15 yes5826 Rock Valley College Rockford IL 99 no0685 Rockford College Rockford IL 11 yes
159
Institutions Participating in the 2009 CIRP Freshman Survey
Stratification Included inACE Institution City State Cell National Norms

0468 Rollins College Winter Park FL 13 yes2309 Rosemont College Rosemont PA 16 no1835 Russell Sage College Troy NY 13 yes1672 Rutgers University-Camden Camden NJ 09 yes1673 Rutgers University-Newark Newark NJ 01 no
5082 Sacred Heart University Fairfield CT 18 yes6101 Sage College of Albany Troy NY 11 yes1838 Saint Bonaventure University Saint Bonaventure NY 17 yes0976 Saint Catharine College Saint Catharine KY 19 yes2313 Saint Francis University Loretto PA 17 yes0374 Saint Joseph College West Hartford CT 17 yes1054 Saint Joseph’s College of Maine Standish ME 16 yes2314 Saint Joseph’s University Philadelphia PA 18 yes781 Saint Mary’s College Notre Dame IN 18 yes
0227 Saint Marys College of California Moraga CA 18 yes1354 Saint Mary’s University of Minnesota Winona MN 17 no2758 Saint Michaels College Colchester VT 18 yes2974 Saint Norbert College De Pere WI 18 yes1675 Saint Peters College Jersey City NJ 16 yes0689 Saint Xavier University Chicago IL 17 yes0238 San Jose State University San Jose CA 08 no0267 Santa Clara University Santa Clara CA 05 yes4639 Savannah College of Art and Design Savannah GA 13 yes7449 School of Visual Arts New York NY 12 yes0246 Scripps College Claremont CA 14 yes2857 Seattle Pacific University Seattle WA 23 yes2564 Sewanee: The University of the South Sewanee TN 23 yes1189 Smith College Northampton MA 14 no0170 Sonoma State University Rohnert Park CA 08 yes2494 South Dakota State University Brookings SD 01 no0700 Southern Illinois University Edwardsville Edwardsville IL 09 no2657 Southern Methodist University Dallas TX 05 no5415 Southern New Hampshire University Manchester NH 11 yes2810 Southern Virginia University Buena Vista VA 12 no2664 Southwestern University Georgetown TX 23 yes0502 Spelman College Atlanta GA 35 yes0019 Spring Hill College Mobile AL 18 no1949 St Andrews Presbyterian College Laurinburg NC 21 yes1842 St John’s University-New York Jamaica NY 04 yes1846 St Lawrence University Canton NY 13 no1110 Stevenson University Stevenson MD 12 yes1885 Stony Brook University Stony Brook NY 03 yes7028 SUNY at Purchase College Purchase NY 09 no1869 SUNY College at Brockport Brockport NY 09 yes1862 SUNY College at Buffalo Buffalo NY 08 yes1878 SUNY College at Postdam Potsdam NY 09 no4894 SUNY Institute of Technology at Utica-Rome Utica NY 09 no2335 Susquehanna University Selinsgrove PA 23 yes2336 Swarthmore College Swarthmore PA 14 no
5239 Tabor College Hillsboro KS 22 yes2674 Tarleton State University Stephenville TX 07 yes783 Taylor University Upland IN 23 yes
2677 Texas A & M University-Kingsville Kingsville TX 07 yes2675 Texas Christian University Fort Worth TX 04 no
160
Institutions Participating in the 2009 CIRP Freshman Survey
Stratification Included inACE Institution City State Cell National Norms

2683 Texas Tech University Lubbock TX 02 no2682 Texas Woman’s University Denton TX 01 yes1753 The College of New Rochelle New Rochelle NY 11 yes0476 The University of Tampa Tampa FL 12 yes2691 The University of Texas at Austin Austin TX 03 yes2304 The University of the Arts Philadelphia PA 12 no7256 Touro College New York NY 12 no1092 Towson University Towson MD 09 yes0435 Trinity Washington University Washington DC 16 no1486 Truman State University Kirksville MO 09 yes1024 Tulane University of Louisiana New Orleans LA 05 yes2561 Tusculum College Greeneville TN 20 yes
1884 Union College-Schenectady Schenectady NY 14 yes2562 Union University Jackson TN 23 no0341 United States Air Force Academy Colorado Springs CO 09 yes0380 United States Coast Guard Academy New London CT 09 yes1893 United States Military Academy West Point NY 09 yes1100 United States Naval Academy Annapolis MD 09 yes0076 University of Arkansas at Pine Bluff Pine Bluff AR 34 yes0382 University of Bridgeport Bridgeport CT 11 no0257 University of California-Los Angeles Los Angeles CA 03 yes0262 University of California-Riverside Riverside CA 01 yes0260 University of California-San Diego La Jolla CA 03 yes1456 University of Central Missouri Warrensburg MO 09 no2147 University of Central Oklahoma Edmond OK 08 no1276 University of Detroit Mercy Detroit MI 17 no0567 University of Hawaii at Manoa Honolulu HI 02 no9109 University of Hawaii-West Oahu Pearl City HI 10 no0584 University of Idaho Moscow ID 01 yes4890 University of Illinois at Springfield Springfield IL 09 yes0984 University of Louisville Louisville KY 02 yes2631 University of Mary Hardin-Baylor Belton TX 21 yes1207 University of Massachusetts Amherst Amherst MA 02 yes5773 University of Massachusetts-Dartmouth North Dartmouth MA 09 yes1294 University of Michigan-Ann Arbor Ann Arbor MI 03 yes6400 University of Michigan-Flint Flint MI 08 no1365 University of Minnesota-Twin Cities Minneapolis MN 03 no0002 University of Montevallo Montevallo AL 08 yes1609 University of Nevada-Reno Reno NV 01 no1623 University of New Hampshire-Main Campus Durham NH 02 yes1984 University of North Carolina at Chapel Hill Chapel Hill NC 03 no1991 University of North Carolina-Wilmington Wilmington NC 09 yes2031 University of North Dakota Grand Forks ND 01 yes0322 University of Northern Colorado Greeley CO 09 yes785 University of Notre Dame South Bend IN 06 yes
2341 University of Pennsylvania Philadelphia PA 06 yes6232 University of Pittsburgh-Bradford Bradford PA 08 yes2340 University of Pittsburgh-Johnstown Johnstown PA 08 no2342 University of Pittsburgh-Pittsburgh Campus Pittsburgh PA 03 yes2844 University of Puget Sound Tacoma WA 14 yes0265 University of Redlands Redlands CA 13 yes1889 University of Rochester Rochester NY 05 yes7274 University of San Diego San Diego CA 04 yes6138 University of South Carolina-Aiken Aiken SC 08 yes2458 University of South Carolina-Columbia Columbia SC 03 no
161
Institutions Participating in the 2009 CIRP Freshman Survey
Stratification Included inACE Institution City State Cell National Norms

0624 University of St Francis Joliet IL 17 yes0157 University of the Pacific Stockton CA 04 yes2302 University of the Sciences in Philadelphia Philadelphia PA 13 yes2731 University of Utah Salt Lake City UT 02 no2764 University of Vermont Burlington VT 03 yes4895 University of South Florida-Saint Petersburg Saint Petersburg FL 08 no
0544 Valdosta State University Valdosta GA 08 no0787 Valparaiso University Valparaiso IN 23 yes2567 Vanderbilt University Nashville TN 06 yes5053 Vanguard University of Southern California Costa Mesa CA 21 no1891 Vassar College Poughkeepsie NY 14 no5517 Villa Maria College Buffalo Buffalo NY 16 yes2347 Villanova University Villanova PA 05 yes2824 Virginia Polytechnic Institute and State University Blacksburg VA 03 yes2828 Virginia Union University Richmond VA 38 yes2459 Voorhees College Denmark SC 38 yes
0789 Wabash College Crawfordsville IN 13 yes1987 Wake Forest University Winston-Salem NC 06 no5562 Walsh University Canton OH 17 yes1988 Warren Wilson College Swannanoa NC 23 yes2348 Washington & Jefferson College Washington PA 13 yes2829 Washington and Lee University Lexington VA 14 yes1588 Wayne State College Wayne NE 08 no2349 Waynesburg University Waynesburg PA 21 yes1894 Webb Institute Glen Cove NY 14 yes1497 Webster University Saint Louis MO 13 yes1895 Wells College Aurora NY 13 yes0545 Wesleyan College Macon GA 22 yes0384 Wesleyan University Middletown CT 14 yes2907 West Virginia Wesleyan College Buckhannon WV 22 yes5035 Western New England College Springfield MA 12 yes2352 Westminster College-New Wilmington New Wilmington PA 22 no1211 Wheaton College-Norton Norton MA 14 yes0707 Wheaton College-Wheaton Wheaton IL 23 yes2909 Wheeling Jesuit University Wheeling WV 17 yes2867 Whitman College Walla Walla WA 14 yes2868 Whitworth University Spokane WA 23 yes2297 Widener University-Main Campus Chester PA 12 no2354 Wilkes University Wilkes-Barre PA 12 yes2215 Willamette University Salem OR 14 yes1213 Williams College Williamstown MA 14 yes2355 Wilson College Chambersburg PA 21 yes1992 Wingate University Wingate NC 21 yes1993 Winston-Salem State University Winston-Salem NC 34 yes2463 Wofford College Spartanburg SC 23 no
1026 Xavier University of Louisiana New Orleans LA 39 yes
162
Institutions Participating in the 2009 CIRP Freshman Survey
Stratification Included inACE Institution City State Cell National Norms

APPENDIX D
The Precision of the Normative Data and Their Comparisons


THE PRECISION OF THE NORMATIVE DATAAND THEIR COMPARISONS
165
A common question asked about sample surveysrelates to the precision of the data, which is typi-cally reported as the accuracy of a percentage“plus or minus x percentage points.” This figure,which is known as a confidence interval, can beestimated for items of interest if one knows theresponse percentage and its standard error.
Given the CIRP’s large normative sample, thecalculated standard error associated with anyparticular response percentage will be small (aswill its confidence interval). It is important tonote, however, that traditional methods of calcu-lating standard error assume conditions which,(as is the case with most real sample surveydata), do not apply here. Moreover, there areother possible sources of error which should beconsidered in comparing data across normativegroups, across related item categories, and overtime. In reference to the precision of the CIRPdata, these concerns include:
1) Traditional methods of calculating standarderror assume that the individuals wereselected through simple random sampling.Given the complex stratified design of theCIRP, where whole institutions participate,it is likely that the actual standard errors willbe somewhat larger than the standard errorestimates produced through traditionalcomputational methods. In addition, whileevery effort has been made to maximize thecomparability of the institutional samplefrom year to year (repeat participation runs
about 90 percent), comparability is reducedby non-repeat participation and year-to-yearvariation in the quality of data collected bycontinuing institutional participants. Whilethe CIRP stratification and weighting procedures are designed to minimize thisinstitutional form of “response bias,” anunknown amount of non-random variationis introduced into the results.
2) The wording of some questions in the surveyinstrument, the text and number of responseoptions, and their order of presentation havechanged over the years. We have found thateven small changes can produce large orderand context effects. Given this, the exactwording and order of items on the surveyinstrument (see Appendix B) should beexamined carefully prior to making compar-isons across survey years.
3) Substantial changes in the institutional strati-fication scheme were made in 1968, 1971,1975, 2001, and 2008. These changesresulted in a revision of the weights appliedto individual institutions. Stratification cellassignments of a few institutions may alsochange from time to time, but the scale ofthese changes and their effect on the nationalnormative results are likely to be small incomparison to other sources of bias.
Since it is impractical to report statistical indi-cators for every percentage in every CIRPcomparison group, it is important for those who

are interested to be able to estimate the precisionof the data. Toward this end, Table D1 providesestimates of standard errors for comparisongroups of various sizes and for different percent-ages1 which can be used to derive confidenceinterval estimates.
For example, suppose the item we are interestedin has a response percentage of 15.7 percentamong students at all nonsectarian four-yearcolleges (a normative group that is 39,525 insize). First, we choose the column that is closestto the observed percentage 15.7—in this case“15%.”2 Next, we select the row closest to theunweighted sample size of 39,525—in this case“40,000.” Consulting Table D1, we find theestimated standard error would be .179.
To calculate the confidence interval at the 95%probability level, we multiply the estimated standard error by the critical value of t for theunweighted sample size (which, for all CIRPcomparison groups, will be equal to 1.96 at the.05 level of probability).3 In this example, wewould multiply the estimated standard error of.179 by 1.96, which yields .350. If we roundthis figure to a single decimal point we wouldthen estimate our confidence interval to be 15.7 ± .4. In practical terms, this confidenceinterval means that if we were to replicate thissurvey using the same size sample, we wouldexpect that the resulting percentage would fallbetween 15.3 percent and 16.1 percent 95 timesout of 100.
166
Table D1. Estimated Standard Errors of Percentages for Comparison Groups of Various Sizes
Unweighted size of Percentage
comparison groups 1% 5% 10% 15% 20% 25% 30% 35% 40% 45% 50%
500 .445 .975 1.342 1.597 1.789 1.936 2.049 2.133 2.191 2.225 2.2361,000 .315 .689 .949 1.129 1.265 1.369 1.449 1.508 1.549 1.573 1.5815,000 .141 .308 .424 .505 .566 .612 .648 .675 .693 .704 .707
10,000 .099 .218 .300 .357 .400 .433 .458 .477 .490 .497 .50020,000 .070 .154 .212 .252 .283 .306 .324 .337 .346 .352 .35440,000 .050 .109 .150 .179 .200 .217 .229 .238 .245 .249 .25055,000 .042 .093 .128 .152 .171 .185 .195 .203 .209 .212 .21370,000 .038 .082 .113 .135 .151 .164 .173 .180 .185 .188 .18990,000 .033 .073 .100 .119 .133 .144 .153 .159 .163 .166 .167
110,000 .030 .066 .090 .108 .121 .131 .138 .144 .148 .150 .151130,000 .028 .060 .083 .099 .111 .120 .127 .132 .136 .138 .139240,000 .020 .044 .061 .073 .082 .088 .094 .097 .100 .102 .102
Note: Assumes simple random sampling.
1 Calculated by √x%(100–x%) where x is the percentage of interest and N is the population count from Table A1.N
2 Since the distribution of the standard errors is symmetrical around the 50 percent mid-point, for percentages over 50simply subtract the percentage from 100 and use the result to select the appropriate column. For example, if the percentagewe were interested in was 59, 100 – 59 percent yields 41, so we would use the column labeled ‘40%.’
3 To calculate the confidence interval at the 99% probability level the critical t value is 2.56.

ABOUT THE AUTHORS
John H. Pryor is Director of the CooperativeInstitutional Research Program (CIRP). He is also the Managing Director of the Higher EducationResearch Institute (HERI), where the CIRP surveys are administered. Mr. Pryor’s specific interests arein college student alcohol use, health issues, at-risk behaviors and survey research methodology. As theDirector of the CIRP surveys, he conducts longitudinal research on the changing nature of collegestudents and the impact of college.
Sylvia Hurtado is Professor and Director of the Higher Education Research Institute at UCLA in theGraduate School of Education and Information Studies. Dr. Hurtado has published numerous articlesand books related to her primary interest in student educational outcomes, campus climates, collegeimpact on student development, and diversity in higher education. She has served on numerous editorial boards for journals in education and served on the boards for the American Association ofHigher Education (AAHE), the Higher Learning Commission, and is past-President of the Associationfor the Study of Higher Education (ASHE). Black Issues in Higher Education named her among thetop 15 influential faculty whose work has had an impact on the academy.
Linda DeAngelo is the Cooperative Institutional Research Program’s (CIRP) Assistant Director forResearch. Dr. DeAngelo’s primary responsibility is conducting and promoting research for educa-tional improvement using CIRP data. In this role she interfaces with educational and institutionalresearchers about the potential uses of CIRP data for studies of educational effectiveness and studentoutcomes and how the use of advanced research methodologies can further our understanding of thecollege experience. Her research interests include diversity issues, student learning and change indiverse environments, post-baccalaureate educational aspirations, graduate school access, and facultydiversity.
Laura Palucki Blake is the Cooperative Institutional Research Program’s (CIRP) Assistant Director.Dr. Palucki Blake’s primary responsibilities include working with institutions both to implement thevarious CIRP surveys and to develop and communicate about effective and innovative ways of usingdata for institutional improvement. Dr. Palucki Blake’s research interests include assessment andaccountability in higher education, the use of institutional data to foster greater understanding ofstudent learning and development, and issues of access and equity during college.
Serge Tran is the Associate Director of Data Management and Analysis at HERI. As the AssociateDirector, he maintains HERI’s research databases; computes the National Norms tables; and producesthe Institutional Profile reports and other specialized reports.
167

PUBLICATIONS LIST
To order call 310-825-1925 or visit the HERI publications webpage: www.gseis.ucla.edu/heri/research-publications.phpSelected titles also available in e-book format: www.ucpress.edu
The American Freshman: National Norms Fall 2009*December, 2009/71 pages $25.00Provides national normative data on the characteristics ofstudents attending American colleges and universities as first-time, full-time freshmen. In 2009, data from approximately219,864 freshmen students are statistically adjusted to reflectthe responses of 1.4 million students entering college. Thisannual report covers financial concerns, political views, socialresponsibility, AP courses, remedial work, and veterans.*Note: Publications from earlier years are also available: each year datingback to 1999 for $25.00; earlier years dating back to 1966 for $5.00 each.
The American Freshman: Forty Year TrendsMarch, 2006/261 pages $30.00Summarizes trends data in the Cooperative InstitutionalResearch Program (CIRP) Freshman Survey between 1966and 2006. The report examines changes in the diversity ofstudents entering college; parental income and students’financial concerns, issues of access and affordability in college.Trends in students’ political and social attitudes are alsocovered.
Degree Attainment Rates at American Colleges and UniversitiesJanuary, 2005/74 pages $15.00Provides latest information on four- and six-year degree attain-ment rates collected longitudinally from 262 baccalaureate-granting institutions. Differences by race, gender, andinstitutional type are examined. The study highlights mainpredictors of degree completion and provides several formulasfor calculating expected institutional completion rates.
The American College Teacher: National Norms for the 2007–08 HERI Faculty Survey*February, 2009/298 pages $25.00Provides an informative profile of teaching faculty atAmerican colleges and universities. The 2007–08 Normscovers two areas: Activities and Beliefs about Under graduateEducation and Faculty Work-Life. Within these two areas thefollowing topics are covered: goals for undergraduate educa-tion, working with underprepared students, teaching andresearch practice and perspectives, engaged scholarship andacademic citizenship, attitudes and beliefs about diversity,institutional values and priorities as faculty perceive them,career satisfaction and perspectives, technology use, and healthand wellness. Results are reported for all faculty, male andfemale faculty, and faculty by academic rank and institutionaltype.*Note: Publications from earlier years are also available: 2004–05,2001–02 for $25.00; 1998–99, 1995–96 for $22.00 each; 1992–93 for$20.00
Advancing in Higher Education: A Portrait of Latina/o College Freshmen at Four-Year Institutions, 1975–2006October, 2008/90 pages $15.00The purpose of this report is to provide a portrait of Latina/ostudents entering four-year colleges and universities from1975–2006. It is intended as a data resource for higher education in understanding the unique characteristics of theincreasing numbers of Latina/o first-time, full-time freshmen.The national data come from the Cooperative InstitutionalResearch Program (CIRP) Freshman Survey. For the firsttime, CIRP trends are disaggregated by specific Latina/oethnic origin group and by gender, to highlight the hetero-geneity in the population unavailable in other national reportson Hispanic college students.
Beyond Myths: The Growth and Diversity of Asian American College Freshmen: 1971–2005September, 2007/63 pages $15.00The first-year student trends examined in this report help toaddress some common characterizations of Asian Americanstudents, particularly with respect to their educational success,that are often overstated and taken out of context. The find-ings suggest that Asian Americans still have to overcome anumber of obstacles, such as levels of family income andfinancial aid, to earn a coveted spot in higher education. This report features data collected from the CooperativeInstitutional Research Program (CIRP) Freshman Survey. It is based on the 361,271 Asian/Asian American first-timefull-time college students from 1971–2005, representing thelargest compilation and analysis of data on Asian Americancollege students ever undertaken.
First in My Family: A Profile of First-Generation College Students at Four-Year Institutions Since 1971February, 2007/62 pages $15.00First-generation college students are receiving increasingattention from researchers, practitioners, and policymakerswith the aim of better understanding their college decision-making process and supporting their progress in highereducation. This report explores the changing dynamicbetween first-generation college students and their non first-generation peers by utilizing longitudinal trends data collectedthrough the CIRP Freshman Survey (1971–2005).
Black Undergraduates From Bakke to GrutterNovember, 2005/41 pages $15.00Summarizes the status, trends and prospects of Black collegefreshmen using data collected from 1971 to 2004 through theCooperative Institutional Research Program (CIRP). Based onmore than half a million Black freshman students, the reportexamines gender differences; socioeconomic status; academicpreparation and aspirations; and civic engagement.
