the ame2012 atomic mass evaluation (i). evaluation of input data...
TRANSCRIPT

CPC(HEP & NP), 2012, 36(12): 1287–1602 Chinese Physics C Vol. 36, No. 12, Dec., 2012
The AME2012 atomic mass evaluation ∗
(I). Evaluation of input data, adjustment procedures
G. Audi1,§, M. Wang1,2,3, A.H. Wapstra4,†, F.G. Kondev5, M. MacCormick6, X. Xu2,7, andB. Pfeiffer8,‡
1 Centre de Spectrometrie Nucleaire et de Spectrometrie de Masse, CSNSM, CNRS/IN2P3, Universite Paris-Sud, Bat. 108, F-91405Orsay Campus, France
2 Institute of Modern Physics, CAS, 509 Nanchang Rd., Lanzhou 730000, China3 Max-Planck-Institut fur Kernphysik, Saupfercheckweg 1, D-69117 Heidelberg, Germany
4 National Institute of Nuclear Physics and High-Energy Physics, NIKHEF, 1009DB Amsterdam, The Netherlands5 Argonne National Laboratory, 9700 S. Cass Avenue, Argonne, IL 60439, USA
6 Institut de Physique Nucleaire, CNRS/IN2P3, Universite Paris-Sud, F-91406 Orsay cedex, France7 Graduate University of Chinese Academy of Sciences, Beijing, 100049, People’s Republic of China
8 GSI Helmholtzzentrum fur Schwerionenforschung, Planckstr. 1, D-64291 Darmstadt, Germany
Abstract This paper is the first of two articles (Part I and Part II) that presents the results of the new atomic mass evaluation,AME2012. It includes complete information on the experimental input data (including not used and rejected ones), as well asdetails on the evaluation procedures used to derive the tables with recommended values given in the second part. This articledescribes the evaluation philosophy and procedures that were implemented in the selection of specific nuclear reaction, decayand mass-spectrometer results. These input values were entered in the least-squares adjustment procedure for determiningthe best values for the atomic masses and their uncertainties. Calculation procedures and particularities of the AME are thendescribed. All accepted and rejected data, including outweighed ones, are presented in a tabular format and compared withthe adjusted values (obtained using the adjustment procedure). Differences with the previous AME2003 evaluation are alsodiscussed and specific information is presented for several cases that may be of interest to various AME users. The secondAME2012 article, the last one in this issue, gives a table with recommended values of atomic masses, as well as tables andgraphs of derived quantities, along with the list of references used in both this AME2012 evaluation and the NUBASE2012one (the first paper in this issue).
AMDC: http://amdc.in2p3.fr/ and http://amdc.impcas.ac.cn/
1 Introduction
The last complete evaluation of experimental atomicmass data AME2003 [1, 2] was published in 2003. Sincethen an uncommonly large amount of new, high quality,data has been published in the scientific literature. This issubstantiated by the fact that as much as 53% of the dataused in the present AME2012 evaluation were not avail-able in 2003.
The large number of new data with high quality thatare continuously produced render updates of the atomicmass table on a regular basis and a frequency of two orthree years necessary. This also corresponds to the de-mand expressed by the extended nuclear research commu-nity. Actually, just after the publication of the AME1993
evaluation [3, 4, 5, 6], the intention was to produce in-terim updates every two years, followed by a full publica-tion every six to eight years. As a result, the AME1995update [7] was indeed published two years later. How-ever, due to the necessity to create the NUBASE evalua-tion (see below), the planned AME updates were not com-pleted. A certain stabilization was reached in 2003, en-couraging the publication of the full AME2003 evalua-tion [1, 2], which was for the first time synchronized withthe complementary evaluation of nuclear structure proper-ties, NUBASE2003.
At the same time, renewal and extension of themanpower devoted to these two evaluations was clearlyneeded, while effective support from institutions was de-clining and the main authors in the AME2003 were com-
* This work has been undertaken with the encouragement of the IUPAP Commission on Symbols, Units, Nomenclature, Atomic Masses andFundamental Constants (SUNAMCO).
§ Corresponding author. E-mail address: [email protected] (G. Audi).† Deceased, December 2006.‡ Present address: II. Physikalisches Institut, Justus-Liebig-Universitat, Heinrich-Buff-Ring 16, D-35392 Gießen.
c©2012 Chinese Physical Society and the Institute of High Energy Physics of the Chinese Academy of Sciences and the Institute of Modern Physicsof the Chinese Academy of Sciences and IOP Publishing Ltd
1288 Chinese Physics C (HEP & NP) Vol. 36
ing close to retirement for one, stopping for the other one.In 2007, the evaluation was about to disappear. Fortu-nately, this work was revived in November 2008 whenthe Institute of Modern Physics at Lanzhou decided to as-certain the future of this long tradition, for the benefit ofthe physics community worldwide. From the dynamicsthus created, other collaborators from all around the worldjoined gradually.
In order to accomodate the strong demand from theinternational physics community, a preliminary versionof AME, the AME2011 preview, was released from theAtomic Mass Data Center website in April 2011. Itwas the first time for the mass tables to be disseminatedthrough internet without an accompanying hardcopy.
In this article, general aspects of the development ofAME2012 are presented and discussed. In doing this,we will mention several local analyses intended, partly,to study points elaborated further below. Other local anal-yses may be found on the AMDC web site [8].
The main AME2012 evaluation table (Table I) is pre-sented in this Part I. All accepted and rejected experimen-tal data are given and compared with the adjusted valuesdeduced using a least-squares fit analysis.
Similarly to the previous AME evaluations, the uncer-tainties quoted in the present tables are one-standard devi-ation (1 σ ).
There is no strict literature cut-off date for the dataused in the present AME2012 evaluation: all data, avail-able to the authors until the material was sent to the pub-lisher (November 18, 2012), were included. Those resultswhich could not be included for particular reasons, such asthe need for a heavy revision of the evaluation at too latea development stage, were added in remarks to the rel-evant data. The final mass-adjustment calculations wereperformed on November 16, 2012.
The present publication updates and includes all theinformation presented in the previous atomic mass eval-uations (since AME1983), including those which are notcontributing to the final adjustment results presented here.
Aaldert H. Wapstra, the founder of AME, is among theco-authors of the AME2012 publication. Unfortunately,he passed away at the end of 2006, but he made enor-mous contributions to the AME2012 development duringthe two years following the publication of the previousAME2003 evaluation. And more than those two years,the present work is composed of his spirit and wisdom.
1.1 Isomers in the AME and the emergence of NUBASE
During the development of the previous atomic massevaluations, a computer file (called Mfile) that contains theapproximate mass values for nuclides in their ground and
selected excited isomeric states was maintained. It wasused as an approximate input to the computer adjustmentprogram, which essentially uses the differences betweenthe input and these approximate values in order to im-prove the precision of the calculations. The other reasonfor the existence of this file was that, where isomers oc-cur, one has to be careful to check which one is involvedin reported experimental data, such as α- and β -decay en-ergies. In fact, several cases exist in the literature wherethe authors were not aware that complications occurreddue to presence of isomers. For that reason, our Mfilecontained known data on such isomeric pairs (half-lives,excitation energies and spin-parities). The issue of iso-merism became even more important, when consideringnew mass-spectrometer methods that were developed tomeasure masses of exotic nuclides far from the valley ofβ -stability, which have, in general, relatively short life-times. Since the mass resolution of such spectrometersis limited, it is often experimentally impossible to sepa-rate isomers. As a consequence, only an average massvalue for a particular isomeric pair can be obtained. Sincethe mass of the ground state is the primary aim of thepresent evaluation, it can be derived only in cases whereone has information on the excitation energies and produc-tion rates of the isomers. When the excitation energy of aparticular isomer is not experimentally known, it was es-timated from trends in neighboring nuclides, as outlinedbelow. Therefore, it was judged necessary to make theMfile as complete as possible, which turned out to be amajor effort. However, the resulting NUBASE evaluation,published for the first time in 1997 [9], was greeted withinterest from many colleagues working in the areas of nu-clear structure physics, nuclear astrophysics and appliednuclear physics, which made the effort worthwhile. In2003, the NUBASE2003 and AME2003 were publishedjointly for the first time. Similarly, accompanying thepresent AME, the NUBASE2012 is published in the firstpart of this issue.
1.2 Highlights
The backbone Nowadays, the highest precision val-ues presently measured for the atomic masses are concur-rently obtained by two different experimental techniques.The first one comprises of direct mass-spectrometry mea-surements using Penning traps, while the second one uti-lizes γ-ray energy measurements following neutron cap-ture reactions.
In the present work, results obtained by both methodsare combined consistently (with a very few exceptions) toimprove considerably the precision of the atomic massesfor nuclides along the line of stability in a diagram of the
No. 12 G. Audi et al: The AME2012 atomic mass evaluation (I). Evaluation of input data, adjustment procedures 1289
atomic number Z versus neutron number N [10], thus re-sulting in a reliable ‘backbone’.
The highest precision of 7× 10⁻¹² presently achievedfor mass measurements has been obtained by the Penningtrap method. The masses of some stable alkali-metal nu-clides and noble-gas nuclides have been determined to10−10 or even better, providing reliable reference stan-dards for other mass measurements.
While most stable nuclides, and some long-lived ones,could have their mass accuracy improved using Penningtraps, the priority was given to cases where there is astrong motivation from the physics point of view. For ex-ample, the Qββ values for some nuclides relevant to neu-trino properties have been determined with very high pre-cision, strengthening at the same time the backbone.
The exotic species The extent of the domain of nuclideswith experimentally known masses has increased impres-sively over the last few years. Penning traps together withstorage rings have played an important role in this exten-sion.
Penning trap mass measurement facilities exist inmany nuclear physics laboratories all around the world.They contribute not only in obtaining precise mass valuesfor nuclides near the stability line, but together with thetwo storage rings facilities, one at the GSI-DARMSTADT
and the other at the IMP-LANZHOU, provide valuable ex-perimental results for a wealth of unstable, short-livednuclides. Until recently, masses of such unstable nu-clides were only known from Qβ end-point measure-ments, which have severe drawbacks owing to the pan-demonium effect [11], more specially for high Qβ -values(see Section 6.7). In the present work, the masses forsuch nuclides have changed considerably compared toAME2003. It can be concluded that the shape of theatomic mass surface, and hence understanding of nuclearinteractions, has changed significantly over the last 10-20years.
It is somewhat ironical, but not unexpected, that thenew results showed that several older data are not as goodas thought earlier, but the reverse is also true. For exam-ple, while reactivating mass-spectrometer measurementsperformed by the group of Demirkhanov (laboratory la-bels R04-R13 in Table I), we were positively surprised tonotice that their accuracy is much better than thought inthe past.
The Isobaric Analogue States - IAS Isobaric Ana-logue States (IAS) have not been considered with the at-tention they require and included in the mass evaluationsince AME1993. In this issue we have updated and in-cluded these masses since they are important states from
the nuclear interaction point of view (see Section 6.4). Asfor any excited state (see also the discussion about isomersin NUBASE, Section 2.2, p. 1161), the mass of an IAS canbe derived either from an internal relation (amongst levelswithin the same nuclide) where the best evaluations are inENSDF, or from external relations (to other nuclides). Inthe latter case, only the AME’s method can treat with ac-curateness the data to derive a mass value. It was thereforeconsidered important and also our duty to have these dataincluded in the main mass table, hence providing the usersof our tables with the best mass values for the IAS.
Recalibrations Gamma-ray energies measured withbent-crystal spectrometers following neutron capture pro-vide highly-accurate energy relations, e.g. the one-neutron separation energies. However, energies deducedin several (p,γ) reactions are also known with a similarprecision. In fact, the accuracies achieved in both casesare so high that one of us [AHW] has re-examined all cal-ibrations. In addition, several α-particle decay energiesare also known with a high precision; and here too it wasfound necessary to harmonize the calibrations.
Differential reactions Another feature near the line ofstability is the increased number of measurements of reac-tion energy differences, which can often be measured witha much higher precision compared to the absolute reactionenergies. The AME2012 computer program accepts thistype of input data which are given in their original shapein the present table of input data (Table I). This may be an-other incentive for presenting primary results in publishedliterature: in later evaluations those results could be cor-rected automatically if calibration values change due tonew experimental results.
Bare and highly ionized atoms As a result of availabil-ity of high-energy accelerators that produce highly ion-ized atoms, the number of nuclides for which experimen-tal mass values are now known is substantially larger com-pared to our previous atomic mass tables. These measure-ments are sometimes made on deeply ionized particles,even up to bare nuclides. The results for masses reportedin the literature are converted by the authors to values forneutral (and un-excited) atoms. The needed electron bind-ing energies are taken from tables, like those of Huanget al. [12] (see also the discussion in Part II, Section 2,p. 1604).
At the proton drip-line A further significant devel-opment of the presented work is the inclusion of manynew data on proton disintegrations that allowed a signif-icant extension of the knowledge of proton binding en-
1290 Chinese Physics C (HEP & NP) Vol. 36
ergies. In several cases such data are also useful in de-termining the excitation energies of isomers, as well asin gaining information about the spins and parities of theparent and daughter states. The latter two developmentsare reasons why it is necessary to pay even more atten-tion to relative positions of isomers than was necessary inour early evaluations. Spatial and time-correlated studiesusing double-sided silicon strip detectors were especiallyuseful in studying long chains of α-decaying nuclides.The measured α-decay energies often provided preciseinformation on mass differences between the individual
chain members. It is fortunate that such new experimen-tal data are produced regularly mainly at laboratories inFinland, Germany, Japan and USA.
Remark: in the following text, several data of generalinterest will be discussed. Mention of references that canbe found in Table I will be avoided. When it is necessaryto provide a specific reference, those will be given usingthe key-numbers (e.g. [2002Aa15]), listed at the end ofPart II, under “References used in the AME2012 and theNUBASE2012 evaluations”, p. 1863.
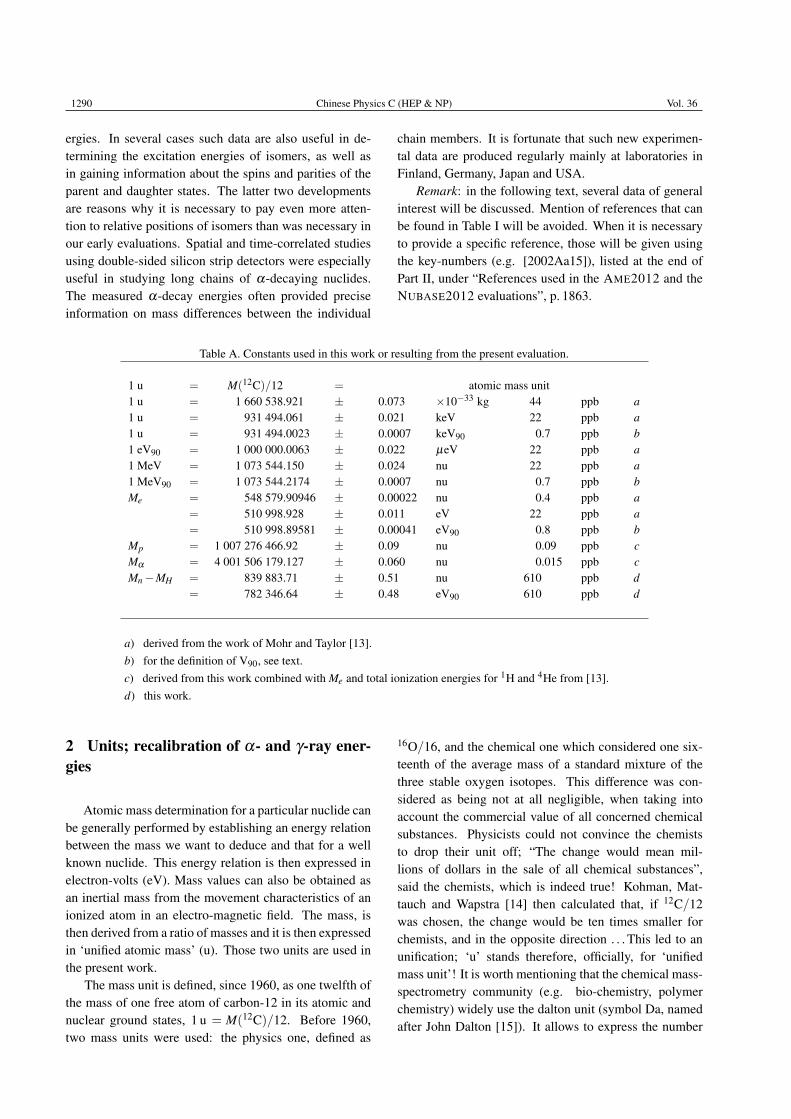
Table A. Constants used in this work or resulting from the present evaluation.
1 u = M(12C)/12 = atomic mass unit1 u = 1 660 538.921 ± 0.073 ×10⁻³³ kg 44 ppb a1 u = 931 494.061 ± 0.021 keV 22 ppb a1 u = 931 494.0023 ± 0.0007 keV90 0.7 ppb b1 eV90 = 1 000 000.0063 ± 0.022 µeV 22 ppb a1 MeV = 1 073 544.150 ± 0.024 nu 22 ppb a1 MeV90 = 1 073 544.2174 ± 0.0007 nu 0.7 ppb bMe = 548 579.90946 ± 0.00022 nu 0.4 ppb a
= 510 998.928 ± 0.011 eV 22 ppb a= 510 998.89581 ± 0.00041 eV90 0.8 ppb b
Mp = 1 007 276 466.92 ± 0.09 nu 0.09 ppb cMα = 4 001 506 179.127 ± 0.060 nu 0.015 ppb cMn−MH = 839 883.71 ± 0.51 nu 610 ppb d
= 782 346.64 ± 0.48 eV90 610 ppb d
a) derived from the work of Mohr and Taylor [13].b) for the definition of V90, see text.c) derived from this work combined with Me and total ionization energies for 1H and 4He from [13].d) this work.
2 Units; recalibration of α- and γ-ray ener-gies
Atomic mass determination for a particular nuclide canbe generally performed by establishing an energy relationbetween the mass we want to deduce and that for a wellknown nuclide. This energy relation is then expressed inelectron-volts (eV). Mass values can also be obtained asan inertial mass from the movement characteristics of anionized atom in an electro-magnetic field. The mass, isthen derived from a ratio of masses and it is then expressedin ‘unified atomic mass’ (u). Those two units are used inthe present work.
The mass unit is defined, since 1960, as one twelfth ofthe mass of one free atom of carbon-12 in its atomic andnuclear ground states, 1 u = M(12C)/12. Before 1960,two mass units were used: the physics one, defined as
16O/16, and the chemical one which considered one six-teenth of the average mass of a standard mixture of thethree stable oxygen isotopes. This difference was con-sidered as being not at all negligible, when taking intoaccount the commercial value of all concerned chemicalsubstances. Physicists could not convince the chemiststo drop their unit off; “The change would mean mil-lions of dollars in the sale of all chemical substances”,said the chemists, which is indeed true! Kohman, Mat-tauch and Wapstra [14] then calculated that, if 12C/12was chosen, the change would be ten times smaller forchemists, and in the opposite direction . . . This led to anunification; ‘u’ stands therefore, officially, for ‘unifiedmass unit’! It is worth mentioning that the chemical mass-spectrometry community (e.g. bio-chemistry, polymerchemistry) widely use the dalton unit (symbol Da, namedafter John Dalton [15]). It allows to express the number

No. 12 G. Audi et al: The AME2012 atomic mass evaluation (I). Evaluation of input data, adjustment procedures 1291
of nucleons in a molecule, at least as it is presently usedin these domains. It is thus not strictly the same as ‘u’.
The unit for energy is the electron-volt. Until the endof last century, the relative precision of M−A expressed inkeV was for several nuclides less accurate than the samequantity expressed in mass units. The choice of the voltfor the energy unit (the electronvolt) is not unambiguous.For example, one may use the international volt V, butother can choose the volt V90 as maintained in nationalmetrology laboratories and defined by adopting an exactvalue for the constant (2e/h) in the relation between fre-quency and voltage in the Josephson effect. Since 1990,by definition 2e/h = 483597.9 (exact) GHz/V90 (see Ta-ble B). Already in 1983, an analysis by Cohen and Wap-stra [16] showed that all precision measurements of re-action and decay energies were calibrated in such a waythat they can be more accurately expressed in maintainedvolt. Also, as seen in Table A, the precision of the con-version factor between mass units and maintained volt(V90) is more accurate than that between the former andinternational volt. In fact, the accuracy is so high thatthe relative precision of M−A expressed in eV90 is thesame as that expressed in mass units. For example,the mass excess of 4He is 2 603 254.13±0.06 nu in massunits, 2 424 915.63±0.06 eV90 in maintained volt unitsand 2 424 915.78±0.08 eV in international volt units. Dueto the increase of precision, the relative precision of M−Aexpressed in keV90 is as good as the same quantity ex-pressed in mass units, whereas the uncertainties expressedin international volts are larger than in V90. Therefore, asalready adopted in our previous mass evaluations, the V90
(maintained volt) unit is used in the present work.In the most recent (2012) evaluation by Mohr et al.
[13], the relation between maintained and internationalvolts is given as V90=[1+6.3(2.2)×10−8]V, that could beexpressed as a difference of 63(22) ppb.
In Table A the relations between maintained and inter-national volts, and several constants of interest, obtainedfrom the evaluation of Mohr et al. [13] are given. Givenalso are the ratio of mass units to electronvolts for the two
Volt units, and also the ratio of the two Volts. In addition,values for the masses of the proton, neutron and α parti-cle, as derived from the present evaluation, are also given,together with the mass difference between the neutron andthe light hydrogen atom.
In earlier mass tables (e.g. AME1993), we used togive values for the binding energies, ZMH + NMn −M.The main reason for this was that the uncertainty (inkeV90) of this quantity was larger than that of the massexcess, M−A. However, due to the increased precisionin the neutron mass, this is no longer important. Similarlyto AME2003, we now give instead the binding energy pernucleon for educational reasons, connected to the Astoncurve and the maximum stability around the ‘Iron-peak’of importance in astrophysics (see also the note in Part II,Section 2, p. 1605).
The defining values and the resulting mass-energyconversion factors are given in Table B. Since 2003 thedefinition has not been modified. Therefore, no recalibra-tion has been necessary in the present AME2012 com-pared to AME2003, except in one case where the preci-cion in the obtained data is better than a few hundred ppb.
This case is the 1H(n,γ)2H reaction which has thehighest energy precision in the input data with rela-tive uncertainty of 180 ppb, where the wave length ofthe emitted γ ray is determined by using the ILL sil-icon crystal spectrometer. In AME2003, the recom-mended value was 2224.5660(4) keV90, based on the workof [1999Ke05] at the NBS. In a later work from thesame group [2006De21], the value was corrected to be2224.55610(44) keV with new evaluation on the latticespacing of the crystal and fundamental constants at thattime. The value of the crystal lattice spacing is used as anadjusted parameter in the new evaluation of Mohr et al.,but not expressed explicitly. Using the same value of thewave length in [2006De21], and the new length-energyconversion coefficient, we derive 2224.55600(44) keV90
as input to our evaluation. Note that the value expressedin eV90 is 0.14 smaller than expressed in international eV,about one third of the uncertainty.
Table B. Definition of Volt units, and resulting mass-energy conversion constants.
2e/h u
1983 483594.21 (1.34) GHz/V 931501.2 (2.6) keV1983 483594 (exact) GHz/V86 931501.6 (0.3) keV861986 483597.67 (0.14) GHz/V 931494.32 (0.28) keV1990 483597.9 (exact) GHz/V90 931493.86 (0.07) keV901999 483597.9 (exact) GHz/V90 931494.009 (0.007) keV902010 483597.9 (exact) GHz/V90 931494.0023 (0.0007) keV90

1292 Chinese Physics C (HEP & NP) Vol. 36
Some more historical points are worth mentioning.It was in 1986 that Taylor and Cohen [17] showed that
the empirical ratio between the two types of volts, whichhad of course been selected to be nearly equal to 1, hadchanged by as much as 7 ppm. For this reason, in 1990 anew value was chosen [18] to define the maintained voltV90. In their 1998 evaluation, Mohr and Taylor [19] hadto revise the conversion constant to international eV. Theresult was a slightly higher (and 10 times more precise)value for V90.
Since older high-precision, reaction-energy measure-ments were essentially expressed in keV86, we had totake into account the difference in voltage definition thatcauses a systematic error of 8 ppm. We were thereforeobliged, for the AME2003 tables, to adjust the older pre-cise data to the new keV90 standard. For α-particle ener-gies, Rytz [20] has taken this change into account, whenupdating his earlier evaluation of α-particle energies. Wehave used his values in the present input data table (Ta-ble I) and indicated this by adding in the reference fieldthe symbol “Z”.
A considerable number of (n,γ) and (p,γ) reactions hasa precision not much worse than 8 ppm. In 1990, one ofus [21] has discussed the need for necessary recalibrationfor several γ rays that are often used as calibration stan-dards. This work has been updated in AME2003 (in a spe-cial file dedicated to this study, available from the AMDC
Web-site [22]) to evaluate the influence of new calibrators,as well as of the new Mohr and Taylor fundamental con-stants on γ-ray and particle energies used in (n,γ), (p,γ)and (p,n) reactions. In doing this, the calibration work ofHelmer and van der Leun [23], based on the fundamen-tal constants at that time, was used. For each of the dataconcerned, the changes were relatively minor. However,we judged it necessary, in AME2003, to make such recali-brations, since otherwise they add up to systematic uncer-tainties that are non-negligible. We also reconsidered thecalibration for proton energies (see below). As in the caseof Rytz’ recalibrations for α-decay energies, such data aremarked by “Z” behind the reference key-number. If it wasnot possible to do so, for example when this position wasused to indicate that a remark was added, the same “Z”symbol was added to the uncertainty value mentioned inthe remark.
The list of input values (Table I) for our calculationsincludes many excitation energies that are derived from γ-ray measurements that are generally evaluated in the Nu-clear Data Sheets (NDS) [24]. Only in exceptional cases,it made sense to change them to recalibrated results.
For higher γ-ray energies, the AME1995 adjustmentused several data recalibrated with results from Pen-ning trap measurements for initial and final atoms in-
volved in (n,γ) reactions. The use of the newer con-stants and of additional, or revised, Penning trap re-sults, made it necessary, in AME2003, to revise againthe recalibrated results. One of the consequences wasthat the energy coming free in the 14N(n,γ)15N reaction,playing a crucial role in these calibrations, was changedfrom 10 833 301.6±2.3 eV90 to 10 833 296.2±0.9 eV90
in AME2003, and 10 833 295.33±0.77 eV90 in presentAME. For more details and discussion, see [22].
Several old neutron binding energies were improved inunexpected ways. For example, a value with a somewhatlarge uncertainty of 650 eV was reported for the neutronbinding energy of 54Cr. Careful examination of the origi-nal article showed that this value was essentially the sumof the energies of two capture γ-rays. For their small en-ergy difference a smaller error was reported. Later workyielded a much improved value for the transition to theground state, allowing to derive a considerably improvedneutron binding energy. Also, in some cases, observedneutron resonance energies could be combined with thelatest measurements of the excitation energies of the res-onance states. Further discussions can be found on theAMDC web site [22].
In AME2003, we also recalibrated proton energies,more particularly those involved in resonance energiesand thresholds. An unfortunate development here was thatthe data for the 991 keV 27Al+p resonance [1994Br37](used frequently for calibration) were reported with higherprecision than older ones, but they differed more thanexpected [22]. The value most often used in earlierwork was 991.88±0.04 keV from the work of Roush etal. [25]. In 1990, Endt et al. [26] averaged it withthe later result by Stoker et al. [27], thus obtaining aslightly modified value of 991.858±0.025 keV. By do-ing this, changes in the values of natural constants usedin the derivation of these values were not taken into ac-count. By correcting for this omission and by criticallyevaluating earlier data, one of us [28] derived in 1993 avalue 991.843±0.033 keV for this standard, and, after the2003 revision, 991.830±0.050 keV [22]. The measure-ment of [1994Br37] yielded 991.724±0.021 keV, whichis two standard deviations from the above adopted value(labeled ‘B’ in Table 1).
3 Input data, representation in a connectionsdiagram
As mentioned above, there are two methods thatare used in measurements of atomic masses: the mass-spectrometry one (often called a “direct method”), wherethe inertial mass is determined from the trajectory of theion in a magnetic field, or from its time-of-flight, and

No. 12 G. Audi et al: The AME2012 atomic mass evaluation (I). Evaluation of input data, adjustment procedures 1293
A
N-Z
0 4 8 12 16 20 24 28 32 36
-8
-4
0
4
8
12
16
0 4 8 12 16 20 24 28 32 36
-8
-4
0
4
8
12
16
-- n
n--
-- H
H --
-- He
He--
-- Li
Li--
-- Be
Be--
-- B
B --
-- C
C --
-- N
N --
-- O
O --
-- F
F --
-- Ne
Ne-- Na--
Mg-
-Al--
Si--
P -- S --
Cl-- Ar-- K --Ca-
-Sc
--
(a)
Figure 1: (a)–(j). Diagram of connections for input data.
For primary data (those checked by other data):� absolute mass-doublet nuclide (i.e. connected to 12C, 35Cl or 37Cl);
(or nuclide connected by a unique secondary relative mass-doublet to aremote reference nuclide);
© other primary nuclide;� ⊙
primary nuclide with relevant isomer;// mass-spectrometer connection;——– other primary reaction connection.
Primary connections are drawn with two different thicknesses. Thickerlines represent the highest precision data in the given mass region(limits: 1 keV for A < 36,
2 keV for A = 36 to 165 and3 keV for A > 165).
For secondary data (cases where masses are known from one type of data and are therefore not checked by a different connection):� secondary experimental nuclide determined from mass-spectrometry;• secondary experimental nuclide determined by a reaction or a decay;◦ nuclide for which mass is estimated from trends in the Mass Surface TMS;– – – – – connection to a secondary nuclide. Note that an experimental connection
may exist between two estimated TMS nuclides when neither of them isconnected to the network of primaries.

1294 Chinese Physics C (HEP & NP) Vol. 36
A
N-Z
32 36 40 44 48 52 56 60 64 68
-8
-4
0
4
8
12
16
20
32 36 40 44 48 52 56 60 64 68
-8
-4
0
4
8
12
16
20
-- F --
Ne -- Na --
Mg --
Al--
Si--
P--
S--
Cl--
Ar
Ar--
-- K
K --
-- Ca
Ca--
-- Sc
Sc--
-- Ti
Ti--
-- V
V --Cr--
Mn-
-
Fe-- Co--
Ni--Cu-
-Zn-
-Ga-
-Ge-- As--
Se-- Br--
(b)
Figure 1 (b). Diagram of connections for input data —- continued.
the so-called ”indirect method” where the reaction energy,i.e. the difference between several masses, is determinedusing a specific nuclear reaction or a decay process. Inthe present work all available experimental data related toatomic masses (both energy and mass-spectrometry data)are considered. The input data are extracted from theavailable literature, compiled in an appropriate format andthen carefully evaluated.
In AME data treatment, we try our best to use the pri-mary experimental information. In this way, the massescan be recalibrated automatically for any future changes,and the original correlation information can be properlypreserved.
One example that illustrates our policy of data treat-ment is the following. In the [1986Ma40] publication,the Q value of the 148Gd(p,t)146Gd reaction was mea-sured relative to that for the 65Cu(p,t)63Cu reference re-action. The latter value was adopted from the AME1995mass table, but it was changed by 1.8 keV in the presentmass table. In AME2003, the corresponding equation was148Gd(p,t)146Gd = –7843±4 keV. However, in the present
work, it is presented and used as a differential reactionequation: 148Gd(p,t)146Gd−65Cu(p,t)63Cu = 1500±4 keV.Strictly speaking, those equations are not exact either.What is measured in the experiment is the energy spec-tra of the ejected particles. Since there are differencesbetween the masses of the measured nuclides and the ref-erence, the response of the ejected particles to the Q val-ues are different for the measured nuclides and the ref-erence, depending also on the angle where the spectra areobtained. While the exact equations are quite complex, webelieve that the treatment by differential reaction equationrepresents the original data more reliably and that most ofthe primary information is preserved.
Nuclear reaction A(a,b)B and decay A(b)B energymeasurements connect the initial (A) and final (B) nu-clides with one or two reaction or decay particles. Withthe exception of some reactions between very light nu-clides, the precision with which the masses of reactionparticles a and b are known is much higher than that ofthe measured reaction and decay energies. Thus, thesereactions and decays can each be represented as a link be-

No. 12 G. Audi et al: The AME2012 atomic mass evaluation (I). Evaluation of input data, adjustment procedures 1295
A
N-Z
60 64 68 72 76 80 84 88 92 96
-8
-4
0
4
8
12
16
20
24
28
60 64 68 72 76 80 84 88 92 96
-8
-4
0
4
8
12
16
20
24
28
-- Sc
-- Ti --
V--
Cr -- M
n -- Fe
-- Co --
Ni -- Cu --
Zn--
Ga -- Ge
-- As
As--
-- Se
Se-- Br-- Kr-- Rb-
-Sr
--Y -- Zr--
Nb--
Mo-
-Tc-- Ru-
-Rh-
-Pd-
-Ag-
-Cd-
-In
--
(c)
Figure 1 (c). Diagram of connections for input data —- continued.
tween two nuclides A and B. Differential reaction energiesA(a,b)B−C(a,b)D are in principle represented by a com-bination of four masses.
Direct mass-spectrometry measurements, again withexception of a few cases between very light nuclides,can be separated in a class of connections between twoor three nuclides, and a class essentially determining anabsolute mass value (see Section 5). Penning trap mea-surements, almost always give a ratio of masses betweentwo nuclides (inversely proportional to their cyclotronfrequencies in the trap). Sometimes these two nuclidescan be very far apart. Thus, those measurements arein most cases best represented as a combination of twomasses. Other types of direct experimental methods, suchas ‘Smith-type’, ‘Schottky’, ‘Isochronous’ and ‘time-of-flight’ mass-spectrometers, are calibrated in a more com-plex way, and are thus published by their authors as abso-
lute mass doublets. They are then presented in Table I asa difference: AEl-u.
For completeness we mention that early mass-spectrometer “triplet” measurements on unstable nuclidescan best be represented as linear combinations of massesof three isotopes, with non-integer coefficients [29].
This situation allows us to represent the input datagraphically in a diagram of (N − Z) versus (N + Z) asshown in Fig. 1. This is straightforward for absolutemass-doublets and for two-nuclide difference cases; butnot for spectrometer triplets and differential reaction en-ergies (see Section 1.2., p. 1289). The latter are in gen-eral more important for one of the two reaction energiesthan for the other one; in the graphs we therefore repre-sent them simply by the former. (For computational rea-sons, these data are treated as primaries even though thediagrams then show only one connection.)

1296 Chinese Physics C (HEP & NP) Vol. 36
A
N-Z
92 96 100 104 108 112 116 120 124 128-4
0
4
8
12
16
20
24
28
32
36
92 96 100 104 108 112 116 120 124 128
-4
0
4
8
12
16
20
24
28
32
36
-- Ge
-- As --
Se -- Br --
Kr--
Rb--
Sr--
Y -- Zr --
Nb--
Mo --
Tc--
Ru--
Rh
Pd--
Ag--
Cd--
In--
Sn--
Sb--
Te-- I --
Xe--Cs-- Ba-
-La-
- Ce-- Pr--Nd-
-Pm--
(d)
Figure 1 (d). Diagram of connections for input data —- continued.
In the present work, all input data are evaluated, i.e.calibrations are checked if necessary, and the data arecompared with other results and with the trends in themass surface (TMS) in the region. As a consequence, sev-eral input data are changed or even rejected. All inputdata, including the rejected ones (not presented in Fig. 1),are given in Table I. As can be seen from Fig.1, the ac-cepted data may allow determination of the mass of a par-ticular nuclide using several different routes; such a nu-clide is called primary. The mass values in the table arethen derived by least squares methods. In the other cases,the mass of a nuclide can be derived only from a connec-tion to another one; it is called a secondary nuclide. Thisclassification is of importance for our calculation proce-dure (see Section 5, p. 1305).
The diagrams in Fig. 1 also show many cases wherethe relation between two atomic masses is accuratelyknown, but not the values of the masses. Since our pol-icy is to include all available experimental results, wehave produced in such cases estimated mass values thatare based on the trends in the mass surface in the neigh-borhood (TMS). In the resulting system of data represen-tations, vacancies occur, which were filled using the sameTMS procedure. Estimates of unknown masses are furtherdiscussed in the next section.
Some care should be taken in the interpretation ofFig. 1, since excited isomeric states and data relations in-volving such isomers are not completely represented onthese drawings. This is not considered a serious defect;those readers who want to update such values can conve-

No. 12 G. Audi et al: The AME2012 atomic mass evaluation (I). Evaluation of input data, adjustment procedures 1297
A
N-Z
120 124 128 132 136 140 144 148 152 156
4
8
12
16
20
24
28
32
36
40
44120 124 128 132 136 140 144 148 152 156
4
8
12
16
20
24
28
32
36
40
44
-- Tc
-- Ru
-- Rh
-- Pd
-- Ag --
Cd--
In -- Sn
-- Sb --
Te--
I -- Xe --
Cs--
Ba--
La
Pr--Nd-
-Pm--
Sm--
Eu-- Gd-
-Tb-
- Dy--Ho-
-Er--
Tm--Yb-
-Lu-
- Hf--Ta-
-W
--
(e)
Figure 1 (e). Diagram of connections for input data —- continued.
niently consult Table I, where all relevant information isgiven.
4 Regularity of the mass-surface and use oftrends in the Mass Surface (TMS)
When atomic masses are displayed as a function ofN and Z, one obtains a surface in a 3-dimensional space.However, due to the pairing energy, this surface is dividedinto four sheets. The even-even sheet lies lowest, the odd-odd highest, the other two nearly halfway in-between, asshown in Fig. 2. The vertical distances from the even-evensheet to the odd-even and even-odd ones are the protonand neutron pairing energies ∆pp and ∆nn. They are nearlyequal. The distances of the last two sheets to the odd-odd
sheet are equal to ∆nn−∆np and ∆pp−∆np, where ∆np isthe proton-neutron pairing energy due to the interactionbetween the two odd nucleons, which are generally not inthe same shell. These energies are represented in Fig. 2,where a hypothetical energy zero represents a nuclide withno pairing among the last nucleons.
Experimentally, it has been observed that: the foursheets run nearly parallel in all directions, which meansthat the quantities ∆nn, ∆pp and ∆np vary smoothly andslowly with N and Z; and that each of the mass sheetsvaries also smoothly, but rapidly with N and Z [30]. Thesmoothness is also observed for first order derivatives(slopes, e.g. the graphs in Part II, p. 1826) and all secondorder derivatives (curvatures of the mass surface). Theyare only interrupted in places by cusps or bumps associ-

1298 Chinese Physics C (HEP & NP) Vol. 36
A
N-Z
152 156 160 164 168 172 176 180 184 188
8
12
16
20
24
28
32
36
40
44
152 156 160 164 168 172 176 180 184 188
8
12
16
20
24
28
32
36
40
44
-- Cs
-- Ba
-- La
-- Ce
-- Pr
-- Nd
-- Pm
-- Sm
-- Eu
-- Gd
-- Tb
-- Dy
-- Ho
-- Er
-- Tm
-- Yb
-- Lu
Lu-- Hf--
Ta--
W --
Re-- Os--Ir-
-Pt-- Au-
-Hg-
-
Tl--Pb-
-
Bi--Po-
-
(f)
Figure 1 (f). Diagram of connections for input data —- continued.
ated with important changes in nuclear structure: shell orsub-shell closures, shape transitions (spherical-deformed,prolate-oblate), and the so-called ‘Wigner’ cusp along theN = Z line.
This observed regularity of the mass sheets in allplaces where no change in the physics of the nucleus areknown to exist, can be considered as one of the BASIC
PROPERTIES of the mass surface. Thus, dependable esti-mates of unknown, poorly known or questionable massescan be obtained by extrapolation from well-known massvalues on the same sheet. In the evaluation of massesthe property of regularity and the possibility to make esti-mates are used for several purposes:
1. Any coherent deviation from regularity, in a region(N,Z) of some extent, could be considered as an in-
dication that some new physical property is beingdiscovered. However, if one single mass violatesthe trends in the mass surface given by neighboringnuclides, then one may seriously question the cor-rectness of the related datum. There might be, forexample, some undetected systematic [31] contri-bution to the reported result of the experiment mea-suring this mass. We then reexamine with extra carethe available experimental information in literaturefor possible errors and often ask the correspondingauthors for additional information. Such a processoften leads to corrections.
2. There are cases where several experimental datadisagree among each other, but no particular reasoncan be found for rejecting one or some of them by

No. 12 G. Audi et al: The AME2012 atomic mass evaluation (I). Evaluation of input data, adjustment procedures 1299
A
N-Z
180 184 188 192 196 200 204 208 212 216
16
20
24
28
32
36
40
44
48
52
56
180 184 188 192 196 200 204 208 212 216
16
20
24
28
32
36
40
44
48
52
56
-- Yb
-- Lu
-- Hf --
Ta--
W
-- Re
-- Os
-- Ir
-- Pt
-- Au
-- H
Bi--Po-
-
At--Rn-
-
Fr-- Ra--
Ac-- Th--
Pa--
U --
(g)
Figure 1 (g). Diagram of connections for input data —- continued.
studying the corresponding papers. In such cases,the measure of agreement with the just mentionedregularity can be used by the evaluators for select-ing which of the conflicting data will be acceptedand used in the evaluation, thus following the samepolicy that was used in our earlier work.
3. There are cases where masses determined fromONLY ONE experiment (or from same experiments)deviate severely from the smooth surface. Suchcases are examined closely and are discussed ex-tensively below (Section 4.1).
4. Finally, drawing the mass surface allows to deriveestimates for the still unknown masses, either frominterpolations or from short extrapolations (see be-
low, Section 4.2).
4.1 Scrutinizing and manipulating the surface ofmasses
Direct representation of the mass surface is not con-venient, since the binding energy varies very rapidly withN and Z. Splitting in four sheets, as mentioned above,complicates even more such a representation. There aretwo ways that allow to observe with some precision thesurface of masses: one of them uses the derivatives ofthis surface, the other is obtained by subtracting a simplefunction of N and Z from the masses.
The derivatives of the mass surface By derivative ofthe mass surface we mean a specified difference between

1300 Chinese Physics C (HEP & NP) Vol. 36
A
N-Z
212 216 220 224 228 232 236 240 244 248
28
32
36
40
44
48
52
56
60
212 216 220 224 228 232 236 240 244 248
28
32
36
40
44
48
52
56
60
-- Au
-- Hg
-- Tl
-- Pb
-- Bi --
Po--
At--
Rn--
Fr--
Ra--
Ac--
Th--
Pa
Pa--
-- U
U --
-- Np
Np--
Pu--
Am--Cm--
Bk--Cf-- Es--
Fm--M
d--
(h)
Figure 1 (h). Diagram of connections for input data —- continued.
the masses of two nearby nuclides. These functions arealso smooth and have the advantage of displaying muchsmaller variations. For a derivative specified in such a waythat differences are between nuclides in the same masssheet, the near parallelism of these leads to an (almost)unique surface for the derivative, allowing thus a singledisplay. Therefore, in order to visualize the trends in themass surface, we found that such estimates could be ob-tained best in graphs such as α- and double-β -decay ener-gies and separation energies of two protons and two neu-trons. These four derivatives are plotted against N, Z or Ain Part II, Figs. 1–36, p. 1826.
However, from the way these four derivatives are cre-ated, they give information only within one of the foursheets of the mass surface (e-e, e-o, o-e or e-e; e-o stand-ing for even-N and odd-Z). When examining the mass sur-face, an increased or decreased spacing of the sheets can-not be observed. Also, when estimating unknown masses,
divergences of the four sheets could be unduly created,which is unacceptable.
Fortunately, other various representations are possible(e.g. separately for odd and even nuclides: one-neutronseparation energies versus N, one-proton separation en-ergy versus Z, β -decay energy versus A, . . . ). We haveprepared such graphs that can be obtained from the AMDC
web site [8].The method of ‘derivatives’ suffers from involving two
masses for each point to be drawn, which means that ifone mass is moved then two points are changed in oppo-site direction, causing confusion in the drawings. Also,reversely, the deviation of one point from regularity couldbe due to either the nuclide it represents or the related onein the difference, rendering the analysis rather complex.
Subtracting a simple function Since the mass surfaceis smooth, one can try to define a function of N and Z as

No. 12 G. Audi et al: The AME2012 atomic mass evaluation (I). Evaluation of input data, adjustment procedures 1301
A
N-Z
240 244 248 252 256 260 264 268 272 276
40
44
48
52
56
60
64240 244 248 252 256 260 264 268 272 276
40
44
48
52
56
60
64
-- Pa
-- U
-- Np
-- Pu
-- Am --
Cm--
Bk--
Cf--
Es--
Fm
Fm--
-- M
d
Md-
-
-- No
No--
-- Lr
Lr--
-- Rf
Rf--
-- Db
Db--
-- Sg
Sg--
-- Bh
Bh-- Hs-- M
t--Ds--
Rg--
Cn--
(i)
Figure 1 (i). Diagram of connections for input data —- continued.
A
N-Z
260 264 268 272 276 280 284 288 292 296
44
48
52
56
60
64
260 264 268 272 276 280 284 288 292 296
44
48
52
56
60
64
-- Fm
-- M
d--
No--
Lr--
Rf--
Db -- Sg
-- Bh
Bh--
-- Hs
Hs--
-- M
t
Mt--
-- Ds
Ds--
-- Rg
Rg--
-- Cn
Cn--
-- Ed
Ed--
-- Fl
Fl--
-- Ef
Ef--
-- Lv
Lv--
-- Eh
Eh--
-- Ei
Ei--
(j)
Figure 1 (j). Diagram of connections for input data —- continued.

1302 Chinese Physics C (HEP & NP) Vol. 36
0
N Z
N ZN Z
N Z
n n
odd odd
even odd
odd even
even even
Δ
Δ
Δ
Δ
Δ
n p
n n
p p
p p
Figure 2: The surface of masses is split into four sheets. This scheme represents the pairing energies responsible for this splitting.The zero energy surface is purely hypothetical with no pairing at all among the outer nucleons.
simple as possible and not too far from the real surface ofmasses. The difference between the mass surface and thisfunction, while displaying reliably the structure of the for-mer, will vary less rapidly, thus improving its observation.
A first and simple approach is the semi-empirical liq-uid drop formula of Bethe and Weizsacker [32] with theaddition of a pairing term in order to fuse more or lessthe four sheets of the mass surface. Another possibility,that we prefer [30], is to use the results of the calcula-tion of one of the modern models. However, we can usehere only those models that provide masses specificallyfor the spherical part, forcing the nucleus to be not de-formed. The reason is that the models generally describequite well the shell and sub-shell closures, and to someextent the pairing energies, but not the locations of defor-mation. If the theoretical deformations were included andnot located at exactly the same position as given by theexperimental masses, the mass difference surface wouldshow two dislocations for each shape transition. Interpre-tation of the resulting surface would then be very difficult.In the present work, we make use of such differences withmodels. The plots we have prepared can also be retrievedfrom the AMDC web site [8].
Manipulating the mass surface In order to make es-timates of unknown masses or to test changes on mea-sured ones, an interactive graphical program was devel-oped [30, 33] that allows a simultaneous observation offour graphs, either from the ‘derivatives’ type or from the‘differences’ type, as a function of any of the variablesN, Z, A, N−Z or N− 2Z, while drawing iso-lines (linesconnecting nuclides having same value for a parameter)of any of these quantities. The mass of a nuclide can bemodified or created in any view and we can determine how
much freedom is left in setting a value for this mass. Atthe same time, interdependence through secondary con-nections (Fig. 1) are taken into account. In cases wheretwo tendencies may alternate, following the parity of theproton or of the neutron numbers, one of the parities maybe deselected.
The replaced values for data yielding the ‘irregularmasses’ as well as the ‘estimated unknown masses’ (seebelow) are thus derived by observing the continuity prop-erty in several views of the mass surface, with all theconsequences due to connections to masses in the samechain. Comparisons with the predictions of 16 nuclearmass-models are presently available in this program.
With this graphical tool, the results of ‘replacement’analyses are felt to be safer; and also the estimation ofunknown masses is more reliable.
All mass values dependent on interpolation proce-dures, and indeed all values not derived from experimen-tal data alone, have been clearly marked with the sharp (#)symbol in all tables, here and in Part II.
Since publication of AME1983 [34], estimates arealso given for the precision of such data derived fromtrends in the mass surface (TMS). These precisions arenot based on a formalized procedure, but on previous ex-perience with such estimates.
In the case of extrapolation however, the uncertainty inthe estimated mass will increase with the distance of ex-trapolation. These uncertainties are obtained by consider-ing several graphs of TMS with a guess on how much theestimated mass may change without the extrapolated sur-face looking too much distorted. This recipe is unavoid-ably subjective, but has proven to be efficient through theagreement of these estimates with newly measured massesin a great majority of cases [35].

No. 12 G. Audi et al: The AME2012 atomic mass evaluation (I). Evaluation of input data, adjustment procedures 1303
4.2 Irregular mass values
When a single mass deviates significantly from regu-larity with no similar pattern for nuclides with same N orwith same Z values, then the correctness of the data deter-mining this mass may be questioned.
Our policy, redefined in AME1995 [7], for those lo-cally irregular masses, and only when they are derivedfrom a unique mass relation (i.e., not confirmed by a dif-ferent experimental method), is to replace them by valuesderived from trends in the mass surface (TMS). There areonly 27 such physical quantities in the present evaluation,compared to 27 in AME2003, 59 in AME1995 and 67in AME1993 that were selected, partly, in order to avoidtoo strongly oscillating plots. Although these numbers re-flects a more strict use of this procedure, the user of our ta-bles should not assume that the remaining 27 items are thesame ones carried on from generation to generation. Theopposite is true, most of the old ones have been replacedby new data showing that we were correct in our choice.Generally, in such unique mass relation, only one mea-surement is reported. But sometimes there are two mea-surements (2 cases) or three (in previous evaluations) thatwe still treat the same way, since use of the same methodand the same type of relation may well lead to the samesystematic uncertainty (for example a mis-assignment orignorance of a final level). Taking into account the con-necting chains for secondaries (Figs. 1a–1j) has the conse-quence that several more ground state masses are affected(and twice as many values in each type of plot of deriva-tives as given in Part II). It should be stressed that onlythe most striking cases have been treated this way, thosenecessary to avoid, as much as possible, confusions in thegraphs in Part II. In particular, as happened previously, theplots of α-decay energies of light nuclides (Fig. 18 and 19in Part II, p. 1844 and 1845) exhibit many overlaps andcrossings that obscure the drawings; no attempt was madeto locate possible origins of such irregularities.
Replacing these few irregular experimental values byones we recommend, in all tables and graphs in thisAME2012, means also that, as explained already inAME1995, we discontinued an older policy that was in-troduced in AME1993, where original irregular experi-mental values were given in all main tables, and ‘recom-mended’ ones given separately in secondary tables. Thispolicy led to confusion for many users of our tables. SinceAME1995, we only give what we consider the “best rec-ommended values”, using, when we felt necessary and asexplained above, ‘values derived from TMS’. Data whichare not used following this policy, can be easily located inTable I where they are flagged ‘D’ and always accompa-nied by a comment explaining in which direction the value
has been changed and by which amount.Such data, as well as the other local irregularities that
can be observed in the figures in Part II could be consid-ered as incentive to remeasure the masses of the involvednuclides, preferably by different methods, in order to re-move any doubt and possibly point out true irregularitiesdue to physical properties.
The present authors insist that only the most strik-ing irregularities have been replaced by estimates. InAME2003, p. 148, we gave as an example the case of112Te, which mass was determined from the reporteddelayed-proton energy measurement from 113Xe with aprecision of 150 keV. However, we felt that it was devi-ating 300 keV from the trends given by neighboring nu-clides, but it was not been replaced by an estimated massvalue. This was felt as an incentive to remeasure themass of 112Te, if possible using a different method. Asa matter of fact, a group using a Penning trap at SHIP-TRAP [2007Ma92], measured the mass of this nuclide andfound its mass was to be moved from -77301±170 keV to-77567.5±8.4 keV, i.e. almost exactly where our estimatelocated it.
4.3 Estimates for unknown masses
Estimates for unknown masses are also made with useof trends in the mass surface, as explained above, by de-manding that all graphs should be as smooth as possible,except where they are expected to show the effects of shellclosures or nuclear deformations effects. Therefore, wewarn the user of our tables that the present extrapolations,based on trends in known masses, will be wrong if un-suspected new regions of deformation or (semi-) magicnumbers occur.
In addition to the rather severe constraints imposedby the requirement of simultaneous REGULARITY of allgraphs, many further constraints result from knowledgeof reaction or decay energies in the regions where theseestimates are made. These regions and these constraintsare shown in Figs. 1a–1j. Two kinds of constraints arepresent. In some cases the masses of (Z, A) and (Z, A+4)are known but not the mass of (Z, A+2). Then, the valuesof S2n(A+2) and S2n(A+4) cannot both be chosen freelyfrom the graphs; their sum is known. In other cases, themass differences between several nuclides (A+4n, Z+2n)are known from α-decays and also those of (A-2+4n,Z+2n). Then, the differences between several successiveS2n(A+4n, Z+2n) are known. Similar situations exist fortwo or three successive S2p’s or Qα ’s.
Also, knowledge of stability or instability against par-ticle emission, or limits on proton or α emission, yieldupper or lower limits on the separation energies.

1304 Chinese Physics C (HEP & NP) Vol. 36
For proton-rich nuclides with N < Z, mass estimatescan be obtained from the charge symmetry. This featuregives a relation between masses of isobars around the onewith N = Z. In several cases, we make a correction byincluding the Thomas-Ehrman effect [36], which makesproton-unstable nuclides more bound than follows fromthe above estimate. For very light nuclides, we can usethe estimates for this effect found by Comay et al. [37].However, since the analysis of proton-unstable nuclides(see Section 6.5) showed that this effect is much smallerfor A = 100 – 210, we use a correction that decreases withincreasing mass number.
Another often good estimate can be obtained from theobservation that masses of nuclidic states belonging to anisobaric multiplet are represented quite accurately by aquadratic equation of the charge number Z (or of the thirdcomponents of the isospin, T3 = 1
2 (N−Z)): the IsobaricMultiplet Mass Equation (IMME). Use of this relationis attractive since, otherwise than the relation mentionedabove, it uses experimental information (i.e. excitation en-ergies of isobaric analogues). The exactness of the IMME
has regularly been a matter of discussion. At regular inter-vals of time, some new mass measurements question thevalidity of the IMME, followed soon by other works show-ing that another member of the same multiplet is to bequestioned. For example, a measurement [2001He29] ofthe mass of 33Ar has questioned the validity of the IMME
at A = 33. The measured mass, with an uncertainty ofabout 4 keV, was 18 keV lower than the value followingfrom IMME, with a precision of 3 keV. One year later, an-other measurement [38] showed that one of the other massvalues entering in this equation was wrong. With the newvalue, the difference is only 3 keV, thus within uncertain-ties.
Up to the AME1983, we indeed used the IMME for de-riving mass values for nuclides for which no, or little in-formation was available. This policy was questioned withrespect to the correctness in stating as ‘experimental’ aquantity that was derived by combination with a calcula-tion. Since AME1993, it was decided not to present anyIMME-derived mass values in our evaluation, but ratheruse the IMME as a guideline when estimating masses ofunknown nuclides. We continue this policy here, and donot replace experimental values by an estimated one fromIMME, even if orders of magnitude more precise. Typi-cal examples are 28S and 40Ti, for which the IMME pre-dicts masses with precisions of respectively 24 keV and22 keV, whereas the experimental masses are known bothwith 160 keV precision, from double-charge exchange re-actions.
The extension of the IMME to higher energy isobaricanalogues has been studied by one of the present authors[39]. The validity of the method, however, is made uncer-tain by possible effects spoiling the relation. In the firstplace, the strength of some isobaric analogues at high ex-citation energies is known to be distributed over severallevels with the same spin and parity. Even in cases wherethis interference effect has not been observed, it remainsa possibility, and as such, it introduces an uncertainty inthe energy level to be attributed to the IAS. In the secondplace, as argued by Thomas and Ehrman [36], particle-unstable levels must be expected to be shifted somewhat.
It also happens that information on excitation energiesof T3 =−T +1 isobaric analogue states is available frommeasurements on proton emission following β -decays oftheir T3 = −T parents. Their authors, in some cases, de-rived from their results a mass value for the parent nuclide,using a formula derived by Antony et al. [40] from a studyof known energy differences between isobaric analogues.We observe, however, that one obtains somewhat differ-ent mass values by combining Antony differences withthe mass of the mirror nuclide of the mother. Also, earlierconsiderations did not take into account the difference be-tween proton-pairing and neutron-pairing energies, whichone of the present authors [AHW] noticed to have a notnegligible influence on the constants in the IMME.
Another possibility is to use a relation proposed byJanecke [41], as done for example by Axelsson et al. [42]in the case of 31Ar. We have in several cases compared theresults of different ways for extrapolating, in order to finda best estimate for the desired mass value.
Enough values have been estimated to ensure that ev-ery nuclide for which there is any experimental Q-valueis connected to the main group of primary nuclides. Inaddition, the evaluators want to achieve continuity of themass surface. Therefore an estimated value is included forany nuclide if it is between two experimentally studied nu-clides on a line defined by either Z = constant (isotopes),N = constant (isotones), N−Z = constant (isodiaspheres),or, in a few cases N + Z = constant (isobars). It wouldhave been desirable to give also estimates for all unknownnuclides that are within reach of the present acceleratorand mass separator technologies. Unfortunately, such anensemble is practically not easy to define. Instead, we es-timate mass values for all nuclides for which at least onepiece of experimental information is available (e.g. iden-tification or half-life measurement or proof of instabilitytowards proton or neutron emission). Then, the ensembleof experimental masses and estimated ones has the samecontour as in the NUBASE2012 evaluation (see p. 1159).

No. 12 G. Audi et al: The AME2012 atomic mass evaluation (I). Evaluation of input data, adjustment procedures 1305
5 Calculation Procedures
The atomic mass evaluation is unique when comparedto the other evaluations of data [30], in a sense that al-most all mass determinations are relative measurements,not absolute ones. Even those called ‘absolute mass dou-blets’ are relative to 12C, 35Cl or 37Cl. Each experimentaldatum sets a relation in mass or in energy among two (ina few cases three or more) nuclides. It can be thereforerepresented by one link among these two nuclides. Theensemble of these links generates a highly entangled net-work. Figs. 1a–1j, in Section 3 above, show a schematicrepresentation of such a network.
The masses of a large number of nuclides are multi-ply determined, entering the entangled area of the canvas,mainly along the backbone. Correlations do not allow todetermine their masses straightforwardly.
To take into account these correlations we use a least-squares method weighed according to the precision withwhich each piece of data is known. This method allows todetermine a set of adjusted masses.
5.1 Least-squares method
Each piece of data has a value qi± dqi with the ac-curacy dqi (one standard deviation) and makes a relationbetween 2, 3 or 4 masses with unknown values mµ . Anoverdetermined system of Q data to M masses (Q > M)can be represented by a system of Q linear equations withM parameters:
M
∑µ=1
kµ
i mµ = qi±dqi (1)
e.g. for a nuclear reaction A(a,b)B requiring an energy qi
to occur, the energy balance writes:
mA +ma−mb−mB = qi±dqi (2)
thus, kAi =+1, ka
i =+1, kbi =−1 and kB
i =−1.In matrix notation, K being the (Q,M) matrix of coef-
ficients, Eq. 1 writes: K|m〉 = |q〉. Elements of matrix Kare almost all null: e.g. for A(a,b)B, Eq. 2 yields a line ofK with only four non-zero elements.
We define the diagonal weight matrix W by its ele-ments wi
i = 1/(dqidqi). The solution of the least-squaresmethod leads to a very simple construction:
tKWK|m〉= tKW|q〉 (3)
the NORMAL matrix A = tKWK is a square matrix of or-der M, positive-definite, symmetric and regular and henceinvertible [43]. Thus the vector |m〉 for the adjustedmasses is:
|m〉= A−1 tKW|q〉 or |m〉= R|q〉 (4)
The rectangular (M,Q) matrix R is called the RESPONSE
matrix.The diagonal elements of A−1 are the squared errors
on the adjusted masses, and the non-diagonal ones (a−1)νµ
are the coefficients for the correlations between massesmµ and mν . Values for correlation coefficients for themost precise nuclides are given in Table B of Part II(p. 1605). Following the advice of B.N. Taylor, we nowalso give on the web-site of the AMDC [8] the full list ofcorrelation coefficients, allowing thus any user to performexact calculation of any combination of masses.
One of the most powerful tools in the least-squares cal-culation described above is the flow-of-information ma-trix, discovered in 1984 by one of us [GAu]. This matrixallows to trace back the contribution of each individualpiece of data to each of the parameters (here the atomicmasses). The AME uses this method since 1993.
The flow-of-information matrix F is defined as fol-lows: K, the matrix of coefficients, is a rectangular (Q,M)
matrix, the transpose of the response matrix tR is also a(Q,M) rectangular one. The (i,µ) element of F is definedas the product of the corresponding elements of tR and ofK. In reference [44] it is demonstrated that such an ele-ment represents the “influence” of datum i on parameter(mass) mµ . A column of F thus represents all the con-tributions brought by all data to a given mass mµ , and aline of F represents all the influences given by a singlepiece of data. The sum of influences along a line is the“significance” of that datum. It has also been proven [44]that the influences and significances have all the expectedproperties, namely that the sum of all the influences on agiven mass (along a column) is unity, that the significanceof a datum is always less than unity and that it alwaysdecreases when new data are added. The significance de-fined in this way is exactly the quantity obtained by squar-ing the ratio of the uncertainty on the adjusted value overthat on the input one, which is the recipe that was used be-fore the discovery of the F matrix to calculate the relativeimportance of data.
A simple interpretation of influences and significancescan be obtained in calculating, from the adjusted massesand Eq. 1, the adjusted data:
|q〉= KR|q〉. (5)
The ith diagonal element of KR represents then the contri-bution of datum i to the determination of qi (same datum):this quantity is exactly what is called above the signifi-cance of datum i. This ith diagonal element of KR is thesum of the products of line i of K and column i of R. Theindividual terms in this sum are precisely the influencesdefined above.

1306 Chinese Physics C (HEP & NP) Vol. 36
The flow-of-information matrix F, provides thus in-sight on how the information from datum i flows into eachof the masses mµ .
The flow-of-information matrix cannot be given in fullin a printed table. It can be observed along lines, dis-playing thus, for each datum, the nuclides influenced bythis datum and the values of these influences. It canbe observed also along columns to display for each pri-mary mass all contributing data with their influence on thatmass.
The first display is partly given in the table of inputdata (Table I) in column ‘Signf.’ for the significance ofprimary data and ‘Main infl.’ for the largest influence.Since in the large majority of cases only two nuclides areconcerned in each piece of data, the second largest influ-ence could easily be deduced. It is therefore not felt nec-essary to give a table of all influences for each primarydatum.
The second display is given in Part II, Table II(p. 1673) for the up to three most important data with theirinfluence in the determination of each primary mass.
5.2 Consistency of data
The system of equations being largely over-determined(Q>>M) offers the evaluator several interesting possibil-ities to examine and judge the data. One might for exam-ple examine all data for which the adjusted values deviatesignificantly from the input ones. This helps to locate er-roneous pieces of information. One could also examine agroup of data in one experiment and check if the uncer-tainties assigned to them in the experimental paper werenot underestimated.
If the precisions dqi assigned to the data qi were in-deed all accurate, the normalized deviations vi betweenadjusted qi (Eq. 5) and input qi data, vi = (qi− qi)/dqi,would be distributed as a Gaussian function of standarddeviation σ = 1, and would make χ2:
χ2 =
Q
∑i=1
(qi−qi
dqi
)2
or χ2 =
Q
∑i=1
v2i (6)
equal to Q−M, the number of degrees of freedom, with aprecision of
√2(Q−M).
One can define as above the NORMALIZED CHI, χn (or‘consistency factor’ or ‘Birge ratio’): χn =
√χ2/(Q−M)
for which the expected value is 1±1/√
2(Q−M).Another quantity of interest for the evaluator is the
PARTIAL CONSISTENCY FACTOR, χpn , defined for a (ho-
mogeneous) group of p data as:
χpn =
√Q
Q−M1p
p
∑i=1
v2i . (7)
Of course the definition is such that χpn reduces to χn if the
sum is taken over all the input data. One can consider forexample the two main classes of data: the reaction and de-cay energy measurements and the mass-spectrometry data(see Section 5.5). One can also consider groups of datarelated to a given laboratory and with a given method ofmeasurement and examine the χ
pn of each of them. There
are presently 269 groups of data in Table I (among which184 have at least one measurement used in determiningthe masses), identified in column ‘Lab’. A high value ofχ
pn might be a warning on the validity of the considered
group of data within the reported uncertainties. We usedsuch analyses in order to be able to locate questionablegroups of data. In bad cases they are treated in such away that, in the final adjustment, no really serious casesoccur. Remarks in Table I report where such correctionshave been made.
5.3 Separating secondary data
In Section 3, while examining the diagrams of con-nections (Fig. 1), we noticed that, whereas the masses ofsecondary nuclides can be determined uniquely from thechain of secondary connections going down to a primarynuclide, only the latter see the complex entanglement thatnecessitated the use of the least-squares method.
In terms of equations and parameters, we consider thatif, in a collection of equations to be treated with the least-squares method, a parameter occurs in only one equation,removing this equation and this parameter will not affectthe result of the fit for all other data. We can thus redefinemore precisely what was called secondary in Section 3:the parameter above is a secondary parameter (or mass)and its related equation a secondary equation. After solv-ing the reduced set, the secondary equation can be used tofind the value and uncertainty for that particular secondaryparameter. The equations and parameters remaining aftertaking out all secondaries are called primary.
Therefore, only the system of primary data is overde-termined, and thus will be improved in the adjustment, sothat each primary nuclide will benefit from all the avail-able information. Secondary data will remain unchanged;they do not contribute to χ2.
The diagrams in Fig. 1 show, that many secondary dataexist. Thus, taking them out simplifies considerably thesystem. More importantly, if a better value is found for asecondary datum, the mass of the secondary nuclide caneasily be improved (one has only to watch since the re-placement can change other secondary masses down thechain, see Fig. 1). The procedure is more complicated fornew primary data.
We define DEGREES for secondary nuclides and sec-

No. 12 G. Audi et al: The AME2012 atomic mass evaluation (I). Evaluation of input data, adjustment procedures 1307
ondary data. They reflect their distances along the chainsconnecting them to the network of primaries. The first sec-ondary nuclide connected to a primary one will be a nu-clide of degree 2; and the connecting datum will be a da-tum of degree 2 as well. Degree 1 is for primary nuclidesand data. Degrees for secondary nuclides and data rangefrom 2 to 18. In Table I, the degree of data is indicatedin column ‘Dg’. In the table of atomic masses (Part II,Table I, p. 1608), each secondary nuclide is marked witha label in column ‘Orig.’ indicating from which other nu-clide its mass value is determined.
To summarize, separating secondary nuclides and sec-ondary data from primaries allow to significantly reducethe size of the system that will be treated by the least-squares method described above. After treatment of theprimary data alone, the adjusted masses for primary nu-clides can be easily combined with the secondary data toyield masses of secondary nuclides.
In the next section we will show methods for reduc-ing further this system, but without allowing any loss ofinformation. Methods that reduce the system of primariesfor the benefit of the secondaries not only decrease com-putational time (which nowadays is not so important), but
allows an easier insight into the relations between data andmasses, since no correlation is involved.
Remark: the word primary used for these nuclides andfor the data connecting them does not mean that they aremore important than the others, but only that they are sub-ject to the special treatment below. The labels primary andsecondary are not intrinsic properties of data or nuclides.They may change from primary to secondary or reverselywhen other information becomes available.
5.4 Compacting the set of data
5.4.1 Pre-averagingTwo or more measurements of the same physical quan-
tities can be replaced without loss of information by theiraverage value and precision, reducing thus the system ofequations to be treated. By extending this procedure, weconsider parallel data: reaction data occur that give es-sentially values for the mass-difference between the sametwo nuclides, except in rare cases where the precision iscomparable to that in the masses of the reaction parti-cles. Example: 14C(7Li,7Be)14B and 14C(14C,14N)14B; or22Ne(t,3He)22F and 22Ne(7Li,7Be)22F.
Table C. Worst pre-averagings. n is the number of data in the pre-average.
Item n χn σe Item n χn σe
249Bk(α)245Am 2 2.55 2.45 223Pa(α)219Ac 2 2.09 10.0133Te-130Xe1.023 2 2.54 4.4 27Pi(2p)25Al 2 2.08 75144Ce(β−)144Pr 2 2.44 2.18 177Pt(α)173Os 2 2.06 697Mo(p,n)97Tc 2 2.40 12.9 244Cf(α)240Cm 2 2.03 4.0220Fr(α)216At 2 2.34 4.7 15N(p,n)15O 2 2.03 1.475As(n,γ)76As 2 2.32 0.17 58Fe(t,p)60Fe 4 2.03 7.4176Au(α)172Ir 2 2.31 17.6 204Tl(β−)204Pb 2 2.03 0.39110In(β+)110Cd 3 2.29 28.4 69Co-u 2 2.02 41343Cl-u 2 2.28 233 167Os(α)163W 4 1.98 3.5166Os(α)162W 2 2.24 10.5 106Ag(ε)106Pd 2 1.98 6.6146Ba(β−)146La 2 2.24 107 78Se(n,γ)79Se 3 1.96 0.28154Eu(β−)154Gd 2 2.22 4.0 46Ca(n,γ)47Ca 2 1.94 0.5640Cl(β−)40Ar 2 2.21 76 145Sm(ε)145Pm 2 1.92 7.9219U(α)215Th 2 2.18 38 234Th(β−)234Pam 3 1.90 2.10153Gd(n,γ)154Gd 2 2.16 0.39 242Pu(α)238U 2 1.89 2.0836S(11B,13N)34Si 3 2.13 32 230Th(d,t)229Th 2 1.89 8.6113Cs(p)112Xe 3 2.11 5.8 99Ag-85Rb1.165 2 1.87 12.6
Such data are represented together, in the main least-squares fit calculations, by one of them carrying their av-erage value. If the Q data to be pre-averaged are stronglyconflicting, i.e. if the consistency factor (or Birge ratio, ornormalized χ) χn =
√χ2/(Q−1) resulting in the calcu-
lation of the pre-average is greater than 2.5, the (internal)precision σi in the average is multiplied by the Birge ratio(σe = σi×χn). There are 2 cases where χn > 2.5, see Ta-ble C (they were 6 in AME2003). The quantity σe is oftencalled the ‘external error’. However, this treatment is not

1308 Chinese Physics C (HEP & NP) Vol. 36
used in the very rare cases where the precisions in the val-ues to be averaged differ too much from one another, sincethe assigned uncertainties lose any significance (only onecase in AME2003, none here.) If such a case occurs,considering policies from the Particle Data Group [45]and some statistical-treatment methods reviewed by Ra-jput and MacMahon [46], we adopt an arithmetic averageand the dispersion of values as an uncertainty, which isequivalent to assigning to each of these conflicting datathe same uncertainty.
In the present evaluation, we have replaced 2961 databy 1182 averages. As much as 23% of those have valuesof χn (Birge ratio) beyond unity, 2.1% beyond two, nonebeyond 3, giving an overall very satisfactory distributionfor our treatment. With the above choice of a thresholdof χ0
n =2.5 for the Birge ratio, only 0.17% of the cases areconcerned by the multiplication by χn. As a matter offact, in a complex system like the one here, many valuesof χn beyond 1 or 2 are expected to exist, and if errorswere multiplied by χn in all these cases, the χ2-test onthe total adjustment would have been invalidated. Thisexplains the choice we made here of a rather high thresh-old (χ0
n = 2.5), compared e.g. to χ0n = 2 recommended
by Woods and Munster [47] or χ0n = 1 used in a differ-
ent context by the Particle Data Group [45], for departingfrom the rule of ‘internal error’ of the weighted average.
Besides the computer-automated pre-averaging, wefound it convenient, in the case of some β+-decays, tocombine results stemming from various capture ratios inan average. These cases are 109Cd(ε)109Ag (average of 3data), 139Ce(ε)139La (average of 10) and 195Au(ε)195Pt (5results), and they are detailed in Table I. Four more casesoccur in our list, but they carry no weight (they are then,as usual, labeled ‘U’ in Table I).Used policies in treating parallel data In averaging β - (orα-) decay energies derived from branches observed in thesame experiment, to or from different levels in the decayof a given nuclide, the uncertainty we use for the averageis not the one resulting from the least-squares, but insteadwe use the smallest occurring one. In this way, we avoiddecreasing artificially the part of the uncertainty that isnot due to statistics. In some cases, however, when it isobvious that the uncertainty is dominated by weak statis-tics, we do not follow the above rule (e.g. 23Ali(p)22Mgof [1997Bl04]).
Some quantities have been reported more than onceby the same group. If the results are obtained by the samemethod in different experiments and are published in reg-ular refereed journals, only the most recent one is usedin the calculation, unless explicitly mentioned otherwise.There are two reasons for this policy. The first is that onemight expect that the authors, who believe their two re-
sults are of the same quality, would have averaged themin their latest publication. The second is that if we acceptand average the two results, we would have no controlon the part of the uncertainty that is not due to statistics.Our policy is different if the newer result is published ina secondary reference (not refereed abstract, preprint, pri-vate communication, conference, thesis or annual report).In such cases, the older result is used in the calculations,except when the newer one is an update of the previousvalue. In the latter case, the original reference in our listmentions the unrefereed paper.
5.4.2 Replacement procedureLarge contributions to χ2 have been known to be
caused by a nuclide G connected to two other ones H andK by reaction links with errors large compared to the errorin the mass difference between H and K, in cases wherethe two disagreed. Evidently, contributions to χ2 of suchlocal discrepancies suggest an unrealistically high valueof the overall consistency parameter. This is avoided by areplacement procedure: one of the two links is replaced byan equivalent value for the other. The pre-averaging pro-cedure then takes care both of giving the most reasonablemass value for G, and of not causing undesirably largecontributions to χ2.
5.4.3 Insignificant dataAnother feature to increase the meaning of the final
χ2 is to not use, in the least-squares procedure, data withweights at least a factor 10 smaller than other data, orthan combinations of all other data giving the same re-sult. They are given in the list of input data but labeled‘U’; comparison with the output values allows to checkour judgment. Earlier, data were labeled ‘U’ if theirweight was 10 times smaller than that of a simple combi-nation of other data. This concept has been extended sinceAME1993 to data that weigh 10 times less than the com-bination of all other accepted data. Until the AME2003evaluation, our policy was not to print data labeled ‘U’ ifthey already appeared in one of our previous tables, re-ducing thus the size of the table of data to be printed. Thispolicy is changed in the present publication, and we tryas much as possible to give all relevant data, includinginsignificant ones. The reason for this is that it often hap-pens that conflicts might appear amongst recent results,then accessibility to older ones might be of help or shedsome light, when evaluating the new data.
5.5 Used policies - treatment of undependable data
The important interdependence of most data, as illus-trated by the connection diagrams (Figs. 1a–1j) allows lo-cal and general consistency tests. These can indicate that

No. 12 G. Audi et al: The AME2012 atomic mass evaluation (I). Evaluation of input data, adjustment procedures 1309
something may be wrong with the input values. We followthe policy of checking all significant data that differ bymore than two (sometimes 1.5) standard deviations fromthe adjusted values. Fairly often, study of the experimen-tal paper shows that a correction is necessary. Possiblereasons could be that a particular decay has been assignedto a wrong final level or that a reported decay energy be-longs to an isomer, rather than to a ground state, or eventhat the mass number assigned to a decay has been shownto be incorrect. In such cases, the values are correctedand remarks are added below the corresponding A-groupof data in Table I, in order to explain the reasons for thecorrections.
It can also happen that a careful examination of a par-ticular paper can lead to serious doubts about the valid-ity of the results within the reported precision, but couldnot permit making a specific correction. Doubts can alsobe expressed by the authors themselves. The results aregiven, however, in Table I and compared with the adjustedvalues. They are labeled ‘F’, and not used in the final ad-justment, but always followed by a comment to explainthe reason for this label. The reader might observe thatin several cases the difference between the experimentaland adjusted values is small compared to the experimen-tal uncertainty: this does not disprove the correctness ofthe label ‘F’ assignment.
It happens quite often that two (or more) pieces of dataare discrepant, leading to important contribution to the χ2.A detailed examination of the papers may not allow cor-rection or rejection, indicating that at least the result of oneof them could not be trusted within the given uncertainties.Then, based on past experience, we use in the calculationsthe value that seems to us to be the most trustable, whilethe other is labeled ‘B’, if published in a regular refereedjournal, or ‘C’ otherwise.
Data with labels ‘F’, ‘B’ or ‘C’ are not used in thecalculations. We do not assign such labels if, as a re-sult, no experimental value published in a regular refereedjournal could be given for one or more resulting masses.When necessary, the policy defined for ‘irregular masses’with ‘D’-label assignment may apply (see Section 4.2). Insome cases, detailed analysis of strongly conflicting datacould not lead to reasons to assume that one of them ismore dependable than the others or could not lead to arejection of a particular data entry. Also, bad agreementwith other data is not the only reason to doubt the cor-rectness of reported data. As in previous AME, and asexplained above (see Section 4), we made use of the prop-erty of regularity of the surface of masses in making achoice, as well as in further checks on the other data.
We do not accept experimental results if informationon other quantities (e.g. half-lives), derived in the same
experiment and for the same nuclide, were in strong con-tradiction with well established values.
5.6 The AME computer program
Our computer program in four phases has to performthe following tasks: i) decode and check the data file;ii) build up a representation of the connections betweenmasses, allowing thus to separate primary masses and datafrom secondary ones, to pre-average same and paralleldata, and thus to reduce drastically the size of the systemof equations to be solved (see Section 5.3 and 5.4), with-out any loss of information; iii) perform the least-squaresmatrix calculations (see above); and iv) deduce the atomicmasses (Part II, Table I), the nuclear reaction and separa-tion energies (Part II, Table III), the adjusted values for theinput data (Table I), the influences of data on the primarynuclides (Table I), the influences received by each primarynuclide (Part II, Table II), and display information on theinversion errors, the correlations coefficients (Part II, Ta-ble B), the values of the χ2s and the distribution of the vi
(see below), . . .
5.7 Results of the calculation
In this evaluation we have 12437 experimental data ofwhich 5376 are labeled ‘U’ (see above), 765 are labeled‘O’ (old result from same group) and 740 are not acceptedand labeled ‘B’, ‘C’, ‘D’ or ‘F’ (respectively 416, 144,29 and 151 items). In the calculation we have thus 5556valid input data, compressed to 3777 in the pre-averagingprocedure. Separating secondary data, leaves a system of1947 primary data, representing 1117 primary reactionsand decays, and 830 primary mass-spectrometer measure-ments. To these are added 821 data estimated from TMStrends (see Section 4, p. 1297), some of which are essen-tial for linking unconnected experimental data to the net-work of experimentally known masses (see Figs. 1a–1j).
In the atomic mass table (Part II, Table I) there is atotal of 3827 masses (including 12C) of which 3353 areground state masses (2438 experimental masses and 915estimated ones), and 464 are excited isomers (336 exper-imental and 128 estimated). Among the 2438 experimen-tal ground state masses, 87 nuclides have a precision bet-ter than 0.1 keV, 315 better than 1 keV and 1438 betterthan 10 keV (respectively 45, 192 and 1020 in AME2003).There are 123 nuclides known with uncertainties largerthan 100 keV (231 in AME2003). Separating secondarymasses in the ensemble of 3827, leaves 1176 primarymasses (12C not included).
Thus, we have to solve a system of 1947 equationswith 1176 parameters. Theoretically, the expectationvalue for χ2 should be 771±39 (and the theoretical χn =

1310 Chinese Physics C (HEP & NP) Vol. 36
1±0.025).The total χ2 of the adjustment is actually 765 (χn =
0.996), thus showing that the ensemble of evaluated datawas of excellent quality, and that the criteria of selectionand rejection we adopted were adequate. In the past thiswas not always the case and in AME2003 we could ob-serve that on average the uncertainties in the input valueswere underestimated by 23%. The distribution of the vi’s(the individual contributions to χ2, as defined in Eq. 6,and given in Table I) is also acceptable. If we considerall the 10531 data that are used in the adjustment plus the‘obsolete’ ones (label ‘O’) and the unweighed ones (label‘U’), the distribution of vi’s yields 21% of the cases be-yond unity, 4% beyond two, and 6 items (0.06%) beyond3.
Considering separately the two main classes of data,the partial consistency factors χ
pn are respectively 1.021
and 0.962 for energy measurements and for mass-spectrometry data, showing that both types of input data,after selection, are of excellent quality.
As in our preceding works [1, 6], we have tried to es-timate the average accuracy for 269 groups of data relatedto a given laboratory and with a given method of mea-surement, by calculating their partial consistency factorsχ
pn (see Section 5.2). In general, the experimental uncer-
tainties appear to be correctly estimated, with as much as37% of the groups of data having χ
pn larger than unity, and
2.6% beyond χpn = 2.
6 Discussion of the input data
In most cases, values as given by authors in the origi-nal publication are accepted, but there are also exceptions.An example is the performed recalibration due to changein the definition of the volt, as discussed in Section 2. Forsomewhat less simple cases, a remark is added in Table Iat the end of the concerned A-group. A curious exampleof combinations of data that cannot be accepted withoutchange follows from the measurements of the Edinburgh-Argonne group. They report decay energies in α-decayseries, where the ancestors are isomers between which theexcitation energy is accurately known from their proton-decay energies. These authors give values for the exci-tation energies between isomeric daughter pairs with con-siderably smaller errors than follow from the errors quotedfor the measured α-decay energies. The evident reason is,that these decay energies are correlated; this means thatthe errors in their differences are relatively small. Unfor-tunately, the presented data do not allow an exact calcula-tion of both masses and isomeric excitation energies. Thiswould have required that, instead of the two Eα values ofan isomeric pair, they would have given the error in their
difference (and, perhaps, a more exact value for the mostaccurate Eα of the pair). Instead, entering all their Qα andE1 (isomeric excitation energies) values in our input filewould yield outputs with too small errors. And acceptingany partial collection makes some errors rather drasticallytoo large. We therefore do enter here a selection of inputvalues, but sometimes slightly changed, chosen in such away that our adjusted Qα and E1 values and errors differas little as possible from those given by the authors. Afurther complication could occur if some of the Qα ’s arealso measured by other groups. But until now, we foundno serious troubles in such cases.
Necessary corrections to recent mass-spectrometerdata are mentioned in Section 6.2.
A change in errors, not values, is caused by the factexplained below that in several cases we do not necessar-ily accept reported α-energies as belonging to transitionsbetween ground states. This also causes uncertainties inderived proton decay energies to deviate from those re-ported by the authors (e.g. in the α-decay chain of 170Au),see also Section 7.10.
6.1 Improvements along the backbone
After the publication of AME2003, only a few newmeasurements for stable nuclides that used the classicalmass-spectrometers were published.
Most of the new mass-spectrometry data were ob-tained from precision measurements of ratios of cyclotronfrequencies of ions in Penning traps. Similarly to theclassical measurements, where ratios of voltages or re-sistances were used, we found that the Penning trap re-sults can be converted to a linear combination of massesof electrically neutral atoms in µu, without any loss of ac-curacy. A special mention is for the MIT-FSU group whogive their original results as linear equations, includingcorrections for electron and molecular binding energies,which can be easily used in our computer code. Othergroups give their results as ratio of cyclotron frequen-cies (see also next paragraph), which we convert to linearequations as described in Appendix C, and finally we addcorrections for electron and molecular binding energies.In such cases, we added a remark to the equation used inthe input data table (Table I), to describe the original dataand our treatment. Some authors publish their results di-rectly as masses, but this is not a recommended practicefor high-precision mass measurements.
6.2 Mass-spectrometry away from β -stability
For the reader interested in the history of mass measure-ments by mass spectrometry, the resolving powers, resolu-tions and the discoveries they rendered possible in nuclear

No. 12 G. Audi et al: The AME2012 atomic mass evaluation (I). Evaluation of input data, adjustment procedures 1311
physics as well as in cosmology, one of us has prepared adocument [48].
6.2.1 Penning trap spectrometersIn addition to ISOLTRAP, the Penning trap spectrom-
eter located at on-line mass separator facility ISOLDE
at CERN, several others Penning traps have been op-erating at the major accelerators facilities around theworld: CPT-Argonne, JYFLTRAP-Jyvaskyla, LEBIT-East-Lansing, SHIPTRAP-Darmstadt, and TITAN-Vancouver.More are presently under construction. They produce ex-perimental atomic masses for nuclides further away fromthe valley of β -stability, by using the cyclotron frequen-cies of charged ions captured in the trap. Such frequen-cies are always compared to that of a well know calibra-tor in order to determine the ratio of two masses, whichis converted, without loss of accuracy, to a linear rela-tion between the two masses (see also Section 6.1 aboveand Appendix C). Experimental methods that utilize mea-surements of cyclotron frequency have an advantage com-pared to volt or magnetic field measurements in a sensethat the parameter that is needed in the former, namelythe frequency, is the physical quantity that can be mea-sured with the highest precision. In fact, very high re-solving power (106) and accuracies (up to 10−8) are rou-tinely achieved for nuclides located quite far from theline of β -stability. Such high resolving power made itpossible in 1991 [49], for the first time in the history ofmass-spectrometry, to resolve nuclear isomers from theirground state (84Rbm) and to determine their excitationenergies. Another beautiful demonstration was given in2003 in [2004Va07] for 70Cu, 70Cum and 70Cun, where inthe same work the masses of the three isomers were deter-mined by mass-spectrometry, and the excitation energiesby βγ spectroscopy. Typically, the precision can reach100 eV or better (60 eV for the difference between 6Heand 7Li at TITAN-Vancouver, [2012Br03]). Even the mostexotic nuclides, such as 11Li (8.75 ms) or 74Rb (64.78 ms),could be measured with precisions of 600 eV and 4 keV atthe TITAN-Vancouver [2008Sm03] and ISOLTRAP-Cern[2007Ke09] facilities, respectively.
In earlier evaluations we found it necessary to mul-tiply uncertainties in values from some groups of mass-spectrometry data [50] with discrete factors (F =1.5, 2.5or 4.0) following the partial consistency factors χ
pn we
found for these groups (see Section 5.2). Such a treat-ment is not necessary in the case of most the Penningtrap which all have F =1 (except for the sub-group ‘Ma8’[2006Mu05] from ISOLTRAP for which F =1.5).
6.2.2 Double-focussing mass-spectrometryFor nuclides far away from the valley of stability,
mass-triplet measurements, in which undetectable system-
atic effects could build-up in large deviations when theprocedure is iterated [1986Au02], could be recalibratedwith the help of the Penning trap measurements. Re-calibration was automatically obtained in the evaluation,since each mass-triplet was originally converted to a lin-ear mass relation among the three nuclides, allowing botheasy application of least-squares procedures, and auto-matic recalibration. In the present adjustment of data,most of the 181 original data, performed in the 80’s, arenow outweighed, except for the most exotic (and thus themost interesting) ones. There are still 12 of them thatcontribute to the present adjustment, essentially for themost exotic nuclides: 91Rb for 12% of the determina-tion of its mass, 95Rb (48%), 99Rb (13%), 143Cs (24%),144Cs (30%), 146Cs (18%), 147Cs (21%) and the most ex-otic 148Cs (100%). In Table I, the relevant equations arenormalized to make the coefficient of the middle isotopeunity, so that they read e.g.
97Rb− (0.490×99 Rb+0.511×95 Rb) = 350±60 keV
145Cs−(0.392×148 Cs+0.608×143 Cs)=−370±90 keV
(the 148Cs symbol representing the mass excess of nuclide148Cs in keV). The other two coefficients are three-digitapproximations of
A2
A3−A1× A2−A1
A3and
A2
A3−A1× A3−A2
A1
We took A instead of M in order to arrive at coefficientsthat do not change if the M-values change slightly. Thedifference is unimportant.
6.2.3 Radio-frequency mass-spectrometryThe Orsay Smith-type mass-spectrometer MISTRAL,
also connected to ISOLDE, has performed quite precisemeasurements of very short-lived light nuclides, beforethe Penning traps could cover all the possibilities that wereoffered by a transmission mass-spectrometer in terms ofinstant measurements. There are still 8 of the measure-ments performed with MISTRAL that are used in thisevaluation for the determination of the masses of 26Ne,26,27,28,29Na and 29Mg.
6.2.4 Classical time-of-flightMass measurements by time-of-flight mass spectrom-
etry technique at SPEG (GANIL) and TOFI (Los Alamos),also apply to very short nuclides, due to instant measure-ments, but the precisions are much lower than with MIS-TRAL. Masses of almost undecelerated fragment prod-ucts, coming from thin targets bombarded with heavy ions[51] or high energy protons [52] are measured from a com-bination of magnetic deflection and time of flight determi-nation. Nuclides in an extended region in A/Z and Z are

1312 Chinese Physics C (HEP & NP) Vol. 36
analyzed simultaneously. Each individual ion, even if veryshort-lived (1µs), is identified and has its mass measuredat the same time. In this way, mass values with accuraciesof (3×10⁻⁶ to 5×10⁻⁵) are obtained for a large numberof neutron-rich nuclides of light elements, up to A = 70.A difficulty is that the obtained value applies to an iso-meric mixture where all isomers with half-lives of the or-der of, or longer than the time of flight (about 1 µs) maycontribute. The resolving power, around 104, and cross-contaminations can cause significant shifts in masses. Themost critical part in these experiments is calibration, sinceobtained from an empirically determined function, which,in several cases, had to be extrapolated rather far from thecalibrating masses. It is possible that, in the future, a fewmass-measurements far from stability may provide bettercalibration points and allow a re-analysis of the concerneddata, on a firmer basis. Such recalibrations require analy-sis of the raw data and cannot be done by the evaluators.With new data from other methods allowing now com-parison, we observed strong discrepancies for one of thetwo groups, and had to increase thus the associated partialconsistency factor to F = 1.5. We noted already earlierthat important differences occurred between ensemble ofresults within this group of data. Using F = 1.5 for datalabeled ‘TO1-TO6’ in the ‘Lab’ column of Table I, allowsto recover consistency.
6.2.5 Cyclotron time-of-flightLonger time-of-flights (50 to 100 µs), thus higher re-
solving powers, can be obtained with cyclotrons. Theaccelerating radio-frequency is taken as reference to en-sure a precise time determination, but this method impliesthat the number of turns of the ions inside the cyclotron,should be known exactly. This was achieved successfullyat SARA-Grenoble for the mass of 80Y. Measurements per-formed at GANIL with the CSS2 cyclotron, could not de-termine the exact number of turns. In a first experimenton 100Sn, a careful simulation was done instead. In a sec-ond experiment on 68Se, 76Sr, 80Sr and 80Y, a mean valueof the number of turns was experimentally determinedfor the most abundant species only, thus mainly the cali-brants. Penning traps measurements at the CPT-Argonne,JYFLTRAP-Jyvaskyla and ISOLTRAP revealed that this lastmethod suffered serious systematic errors. Remeasure-ment at GANIL with the CSS2 cyclotron with improvedmethod confirm the Penning trap data.
6.2.6 Storage ring time-of-flightSimilarly, long flight path can be obtained in a storage
ring. The first set-up of this type is the GSI-ESR at Darm-stadt. The precision of the measurements could be as goodas 90 keV even for nuclides quite far from stability. Thesecond one at the IMP-CSR at Lanzhou could achieve pre-
cision better than 10 keV. The accuracy is excellent forboth yielding partial consistency factors of F = 1.0 forthe IMP-CSR, slightly less for the GSI-ESR set-up withF = 1.5.
6.2.7 Cooled beam cyclotron frequencyStorage rings could also be used with cooled beams
to measure the cyclotron frequency as has been demon-strated since 2003 at the GSI-ESR storage ring, with pre-cisions sometimes as good as a 12 keV. Many of the mea-sured nuclides belong to known α-decay chains. Thus, theavailable information on masses for proton-rich nuclidesis considerably extended.
It must be mentioned that in the first group of mass val-ues as given by GSI authors [2000Ra23], several could notbe accepted without changes. The reason is that in theirderivation α-decay energies between two or more of theoccurring nuclides have been used. Evidently, they couldtherefore not without correction be included in our calcu-lations, where they are again combined with these Qα ’s.Remarks added to the data in Table I warn for this matterwhere important. This point is added here to show a kindof difficulty we meet more often in this work. Fortunately,for this group of data it is only of historical interest sinceall their data are outdated by more recent measurements[2005Li24] with the same instruments and with a muchhigher precision. Since then, a wealth of measurements ofvery high quality were published using this technique, seee.g. [2012Ch19] and references therein.
6.2.8 Isomeric mixturesAs stated above, many mass-spectrometer results yield
an average mass value Mexp for a mixture of isomers.Here, we use a special treatment for the possible mixtureof isomers (see Appendix B) and those changes are dulyincluded in remarks accompanying these data.
The mass M0 of the ground state can be calculated ifboth the excitation energy E1 of the upper isomer, and therelative intensities of the isomers are known. But oftenthis is not the case. If E1 is known but not the intensityratio, one must assume equal probabilities for all possi-ble relative intensities. In the case of one excited iso-mer, see Appendix B, the mass estimate for M0 becomesMexp−E1/2, and the part of the error due to this uncer-tainty 0.29E1 (see Appendix B, Section B.4). This policywas defined and tested first for the GSI-ESR cooled beamcyclotron frequency data and was discussed with the au-thors of the measurements. In eight cases, more than twoisomers contribute to the measured line. They are treatedas indicated in Appendix B.
A further complication arises if E1 is not known. This,in addition to questions related to α-decay chains involv-ing isomers, was a reason for us to consider the matter of

No. 12 G. Audi et al: The AME2012 atomic mass evaluation (I). Evaluation of input data, adjustment procedures 1313
isomers with even more attention than was done before.Part of the results of our estimates (as always, flagged with‘#’) are incorporated in the NUBASE evaluation. In esti-mating the E1 values, we first look at experimental datapossibly giving lower limits: e.g. if it is known that oneof two isomers decays to the other; or if γ rays of knownenergy occur in such decays. If not, we try to interpolatebetween E1 values for neighboring nuclides that can beexpected to have the same spin and configuration assign-ments (for odd A: isotones if Z is even, or isotopes if Z isodd). If such a comparison does not yield useful results,indications from theory were sometimes accepted, includ-ing upper limits for transition energies following from themeasured half-lives. Values estimated this way were pro-vided with somewhat generous errors, dutifully taken intoaccount in deriving final results.
In several of these measurements, an isomer can onlycontribute if its lifetime is relatively long (hundreds ofmilliseconds or longer). However, half-life values givenin NUBASE are those for neutral atoms. For bare nu-clides, where all electrons are fully stripped from theatom, the lifetimes of such isomers can be consider-ably longer, since the decay by conversion electrons isswitched off. Examples are the reported mass mea-surements [2005Li24] of the 580 ms 151Erm isomer atE1=2586.0 keV excitation energy; and of the 103 ms117Tem isomer at E1=296.1 keV.
6.3 Mass of unbound nuclides
In the light mass region, many nuclides beyond thedriplines can be accessed in nowadays experiments. Theycan decay by direct proton or neutron emission. The half-lives of these unbound nuclides are too short for them toacquire their outer electrons (which takes around 10−14 s),and to form atoms. However, we still convert their massesto ”atomic masses” to have them treated consistently withother nuclides and be used conveniently in our tables.It’s an experimental challenge to study these unbound nu-clides far from stability: only very few events can be ob-served. Most often, theoretical calculations are requiredto extract their properties from the experimental data.
On the proton rich side, resonant states could beformed due to the Coulomb barrier. There are differentapproaches to study these states: transfer reaction withmissing mass spectrum, proton scattering, and completekinematic measurement with invariance mass spectrum.For a broad resonant state, the definition of the resonanceenergy and width is not unique. For example, in Ref.[2004Go15], 15F is studied by using the inverse kinemati-cal measurement of proton elastic scattering on 14O. Fromthe same experimental data, the proton decay energy of
15F is obtained to be 1.29+0.08−0.06 MeV where the energy
at which the magnitude of the internal wave function isa maximum, or 1.45+0.16
−0.10 MeV where the nuclear phaseshift has the value δ = π/2. Since the latter value is con-sistent with values obtained by transfer reactions and com-plete kinematic measurements, it is adopted in our evalu-ation.
Some single proton resonant states could be accessedthrough the two proton decay. Their properties canbe used or extracted from the two proton decay stud-ies. In [2008Mu13], the authors quoted the value ofQp = 1560± 130 keV from [2004Le12] as the groundstate of 15F to study the 2p decay of 16Ne; Similarly,Qp = 1300±170 keV for 18Na from [2004Ze05] to studythe 2p decay of 19Mg. In [2012Mu05], the same exper-imental data were reanalyzed and the resonant state of18Na is reconstructed from p+17Ne independently. Theambiguous interpretation of the 18Na states in [2004Ze05]is also clarified.
On the neutron rich side of the nuclear chart, the massof unbound nuclides close to the stability line can be de-termined with missing mass method using transfer reac-tions, or with invariant mass method using radioactive ion(RI) beams. Recently the RI beams and detection tech-niques have been developed impressively and new massesof unbound nuclides in this region are obtained by usinginvariant mass method.
Since there is no Coulomb barrier, it is the centrifu-gal barrier that will play an important role to have a reso-nant state. For an s-wave neutron, no barrier exists, andan asymmetric peak situated at the threshold is a gen-eral feature of spectra obtained in s-wave elastic neutron-nucleus scattering. This state is usually referred to as avirtual state, which has no definite lifetime and thus dif-fers strongly from a real resonance state. The virtual statecan be characterized by the scattering length; its eigen en-ergy is approximately h2/2µas
2, where µ is the reducedmass and as is the scattering length.
In AME2003, a 1/2+ s-state was assigned as theg.s. for 13Be, based on [2001Th01], where this vir-tual state is found unbound with respect to 12Be anda neutron by < 200 keV from the scattering length ofas < −10 fm. Later work of [2008Ch07] seems to sup-port this result with as = −10 fm. However, these re-sults have been questioned by [2010Ko17], where the au-thors state: “a mimic resonant peak may appear in a two-body relative energy spectrum obtained in an experimentwith limited neutron-detection efficiency via a breakup re-action in which more than one neutron can be emitted.The sequential neutron decay spectroscopy measurements[2001Th01], [2008Ch07] where 13Be was produced bythe breakup of 18O and 48Ca may have suffered from this

1314 Chinese Physics C (HEP & NP) Vol. 36
problem.” In [2010Ko17], the reaction 1H(14Be,12Be+n)was studied, which is expected to be a clear way to popu-late the unbound 13Be. A scattering length as=-3.4(0.6) fmwas obtained in this experiment. This result is supportedby [2007Si24], where fragmentation of 14Be on a carbontarget was used and as =−3.2+0.9
−1.1 fm was obtained. Fromthese results, we assign now the 1/2− state to be the g.s.of 13Be, whereas it was the 13Bep state in NUBASE2003.
6.4 Isobaric Analogue states IAS
Definitions and notation For isobars around the N = Zline, and in particular for mirror nuclides, the main differ-ence between their masses can be attributed to the chargesymmetry of the nucleon-nucleon interaction [1971Be29].A more extensive mass relationship can be observed inisobars belonging to the same isospin multiplet aroundN = Z. In this case the ground state of a given nu-clide may be identified as an excited state in the multipletmembers. These isobaric analogue states (IAS) thereforehave, by definition, the same spin-parity and isospin at-tributions. Their relative masses may be used to explorethe charge-symmetry and charge-independence of the nu-clear interaction via the isobaric mass multiplet equation(IMME) [53], and with calculations of the Coulomb Dis-placement Energy (CDE) (see for example [40], and refer-ences therein).
The localization of IAS multiplets on the chart of thenuclides is illustrated in Fig. 3.
T = 1 and T = 2 multipletsIn Fig. 3, the line going from bottom left to top right
designates the N = Z axis. The black line joining 38Ca,38K, and 38Ar are members of the same T=1 isospintriplet. By convention, the IAS multiplet is defined byits lowest Z member, and in this example it is 38Ar. Wetherefore expect to find an excited state in 38K which isthe IAS of ground state 38Ar. To differentiate betweenground states (gs), isomers (m,n,· · · ), and IAS, the IAS islabeled 38Ki.
Members of the A = 38, T = 2 multiplet are shownby the red line extensions to the black line. The IAS ofground state 38Cl should exist in 38Ar, 38K, and 38Ca.Since 38K has levels which could be part of either theT = 1 or T = 2 isospin multiplets for A = 38, extra no-tation is required to distinguish between the two expectedIAS. The triplet and quintuplet IAS in 38K are written as38Ki and 38K j, respectively. The superscripts i and j des-ignating successively higher multiplet members. The jlevels are commonly called double IAS’s.
T = 3/2 and T = 5/2 multipletsTo complete the illustration of the IAS multiplet loca-
tion on the nuclide chart, a case for odd-A is also shown.
The A = 39 IAS quadruplet is composed of Ar, K, Ca, andSc as shown by the blue connecting line. The Ar groundstate should show up as an excited IAS in K and Ca. Thegreen extensions connect the T = 5/2 sextuplet members,Cl and Ti, and so in this IAS multiplet it is the analogueground state of Cl that is looked for in the multiplet mem-bers. The lower T = 3/2 IAS members in both K and Caare denoted with the superscript i (39Ki and 39Cai), andthe T = 5/2 IAS by j (39K j and 39Ca j).
Exceptions
In general, IAS multiplets are naturally delimited byground state mirror nuclides. However, the relationshipbetween ground state masses being the main subject ofthe AME, these configurations have always been naturallyincluded in the evaluation. We do not label these states inany particular way, and they are not included in the IASstatistics of the following paragraphs.
In two cases, 16Nm and 26Alm, it turns out that the IASalso happens to be an excited isomeric state. In these caseswe have given preference to the isomeric notation.
IAS updates The most recent IAS evaluation in theAME dates back to 1993 [3]. In the present edition we re-introduce and update the IAS experimental data. The eval-uation procedure is the same as for ground state massesand isomers, the global mass matrix being minimized in asingle step.
Nuclides from A= 6 to A= 74, and mainly for isospinsT = 1, 3/2, 2, and 5/2 were studied. Roughly 117 nu-clear excited states were retained as being experimentallyidentified IAS, of which around 50 are precise enough tosurvive through to the final evaluated mass table.
In most cases, when reaction data has been evaluated,the precision of IAS masses has been bettered. However,in the case of 73Rbi, even though the excited IAS levelis known to ±40 keV, the ground state has not yet beenmeasured, and can only be estimated. Hence the final es-timate for the excitation energy is given with a precisionof 100# keV.
Only one new IAS has been included in this evalu-ation, 44Vi, from recent experimental measurements ofbeta-delayed proton emission [2007Do17].
Beta-delayed proton emitters In general, when an IASdecays via internal transitions, even with a low branch-ing ratio, the associated gamma measurements will gener-ally provide more precise data than that obtained throughexternal relationships with other nuclides. In the currentevaluation, 33 cases of beta-delayed IAS proton emissionare considered, most of which provide a more precise IASmass evaluation as compared to previous ones.

No. 12 G. Audi et al: The AME2012 atomic mass evaluation (I). Evaluation of input data, adjustment procedures 1315
Figure 3: Excerpt from the chart of nuclides. The ground state spin-parities are given for each nuclide. The ground state isospin T isgiven when it deviates from the expected value based on a charge independent nuclear force. Members of the same multiplet naturallyshow up through the symmetry of the N = Z axis.
The biggest change in precision comes from the re-cently published results on 45Vi [2007Do17] where aproton-gamma coincidence method provides a 9 keV pre-cision on the Q-value, as compared to the previous, firstidentification of this IAS by Jackson et al. in 1974, with a50 keV precision [1974Ja10].
Fragmented states Fragmented IAS levels have beenseen to occur in eleven cases evaluated here. Theyare 8Bei, 44Ti j, 48Cr j, 56Coi, 56Ni j, 57Nii, 58Coi, 59Nii,59Cui, 61Cui, and 64Cui. In these cases the IAS isspread over several isospin mixed levels. The first phe-nomenological description of fragmented IAS was givenby A.M. Lane [54] using a spectral line broadening the-ory; a full description of the experimental application canbe found in [1971Be29] (and references therein).
In this case the simple relationship between isobaricmultiplet members breaks down, since there is no longer
a single IAS level observed, but several isospin impurefragments. The sum of the individual IAS fragments, andtheir relative intensities, are considered in the final IASmass evaluation. Our choice is to use the main experi-mentally observed mass fragment (“strongest fragment”in Table I) in the current evaluation. The excitation ener-gies of the other fragments, along with their relative inten-sity when known, are provided in the associated comment.The original experimental observations are thus reportedas accurately as possible.
6.5 Proton- and α-decays
In some cases, proton-decay energies can be estimatedfrom proton-decay half-lives. Estimates for the followingnuclides could thus be obtained:

1316 Chinese Physics C (HEP & NP) Vol. 36
Nuclide T1/2 Sp (keV) Adopted Sp64As 40±30 ms >−100 20# ± 300#68Br <1.5 µs <−500 -850# ± 300#73Rb <30 ns <−570 -570# ± 100#77Y 63±17 ms >−180 -180# ± 50#
81Nb <80 ns <−1000 -1280# ±1540#89Rh >1.5 µs >−860 -1080# ± 200#
These limits were used as a guide, but not the only one, toset our estimated Sp, thus masses, for these nuclides.
Experimental data are now available for many proton-rich nuclides, from 97
47Ag to 18583Bi; among them for all in-
termediary odd-Z nuclides with the exception of 49In and61Pm.
These results are important for two main reasons.Firstly, knowledge of proton separation energies just be-yond the proton drip line is quite valuable in allowing es-timate of mass values for nuclides for which no experi-mental data is available. Secondly, there are several caseswhere proton-decay energies from both members of anisomeric pair were measured, so one can determine theenergy of a particular excited isomer. In addition, the life-time of a proton-emitting nuclide is sensitive to the l valuecarried out by the proton and this can be used in turn toobtain reliable information about the spins and parities ofthe parent, and daughter states. This feature is even morevaluable, since often the α-decay of both members is ob-served. Combination of long α-decay chains with protondecays offers a somewhat complete view of extended re-gions of the chart in the neighborhood of the proton drip-line. These studies showed that several decays earlier as-signed to ground states do belong in reality to upper iso-mers. Also, these measurements are found to yield goodvalues for the excitation energies of the isomers among thedescendants. We here follow the judgment of the authors,including their judgment about the final levels fed in thoseα-decays.
Often in α-decay studies of odd-N(Z) and odd-oddnuclides, the level fed directly by the α particle is notknown. A comprehensive investigation that we have per-formed some time ago suggested, that in most cases whenthe decay does not go directly to the ground state, the finallevel is relatively close to the ground state. In such cases,we adopted the policy of accepting the measured Eα asfeeding the ground state, but assigning a special label (notgiven in Table I) to indicate that a close-lying excited levelmay be also fed. This label will indicate to our computerprogram that the uncertainty, after possible pre-averagingof data of the same kind (also given in Table I), is to beincreased to 50 keV.
The above mentioned results of proton decay analysishave been a reason to omit the mentioned label in severalcases. One has to be also careful with the use of this la-
bel if mass-spectrometry results with a precision of about50 keV or better are known for the parent and daughter nu-clides. Comparison with theoretical models may also sug-gest to drop the mentioned above label; or just reverselyto not accept a reported α energy.
In some cases, TMS estimates and theoretical predic-tions of α-decay energies indicate that the excitation en-ergy E1 of the final level may be much higher. Then, anestimate for the excited level energy (provided with a gen-erous error) is added as an input value.
In regions where the Nilsson model for deformed nu-clides applies, it is expected that the most intense α tran-sition connects parent and daughter levels that have thesame quantum numbers and configurations. (It is notrarely the only observed α-ray.) In such a case, addingan estimate for E1 is attractive. Frequently, the energy dif-ference between the excited and ground states can be esti-mated by comparison with the energy differences betweenthe corresponding Nilsson levels in nearby nuclides.
Unfortunately, some authors derive a value they callQα from the measured α-particle energy by not only cor-recting for the recoil energy, but also for screening byatomic electrons (see Appendix A). In our calculations,the latter corrections have been removed.
Finally, some measured α-particle energies are af-fected by the coincidence summing between the α par-ticle that feeds an excited level of the daughter nuclideand the conversion electrons that follow the decay of thislevel. This is sometimes apparent from the reported α
spectra, since the width of the observed line is larger thanthat of other ones. In some cases, spurious α peaks can beobserved. When deriving the corresponding Qα values,appropriate (small) corrections are made for the escapingX-rays. Those are mentioned in a remark added to such acase.
6.6 Decay energies from capture ratios and relativepositron feedings
For allowed transitions, the ratio of electron capture indifferent shells is proportional to the ratio of the squaresof the energies of the emitted neutrinos, with a proportion-ality constant dependent on Z and quite well known [55].For (non-unique) first forbidden transitions, the ratio is notnotably different; with few exceptions. The neutrino en-ergy mentioned is the difference of the transition energyQ with the electron binding energy in the pertinent shell.Especially if the transition energy is not too much largerthan the binding energy in, say, the K shell, it can be de-termined rather well from a measurement of the ratio ofcapture in the K and L shells.
The non-linear character of the relation between Q and

No. 12 G. Audi et al: The AME2012 atomic mass evaluation (I). Evaluation of input data, adjustment procedures 1317
the ratio introduces two problems. In the first place, asymmetrical error for the ratio is generally transformedin an asymmetrical one for the transition energy. Sinceour least-squares program cannot handle them, we havesymmetrized the probability distribution by consideringthe first and second momenta of the real probability dis-tribution (see NUBASE2012, Appendix A, p. 1173). Theother problem is related to averaging of several valuesthat are reported for the same ratio. Our policy, sinceAME1993, is to average the capture ratios, and calculatethe decay energy following from that average. An exam-ple is 139Ce(ε)139La (see p. 1482), where the 10 resultsthat are averaged are all given in the following remarks.In this procedure we used the best values [55] of the pro-portionality constant. We also recalculated older reporteddecay energies originally calculated using now obsoletevalues for this constant.
The ratio of positron emission and electron capture inthe transition to the same final level also depends on thetransition energy in a known way (anyhow for allowed andnot much delayed first forbidden transitions). Thus, thetransition energy can be derived from a measurement ofthe relative positron feeding of the level, which is ofteneasier than a measurement of the positron spectrum end-point (e.g. 147Tb(β+)147Gd, now labeled ‘U’, p. 1494).For several cases we made here the same kind of combi-nations and corrections as mentioned for capture ratios.But in this case, a special difficulty must be mentioned.Positron decay can only occur when the transition energyexceeds 2mec2 = 1022 keV. Thus, quite often, a level fedby positrons is also fed by γ-rays coming from higher lev-els fed by electron capture. Determination of the intensityof this side feeding is often difficult. Cases exist wheresuch feeding occurs by a great number of weak γ-rays eas-ily overlooked (the pandemonium effect [11]). Then, thereported decay energy may be much lower than the realvalue. In judging the validity of experimental data, wekept this possibility in our mind.
6.7 Qβ far from β -stability
In the present work, the mass surface for nuclides faraway from the valley of β -stability is observed to be lo-cated much higher than was previously believed. This islargely due to an underestimation of the Qβ decay ener-gies, which were measured in the past using the end-pointenergy method. For nuclides far from the valley of stabil-ity,the decay energies become very large offering acces-sibility to many states in the daughter nuclide. The com-bination of many individual continuous β -decay spectrarenders the analysis very difficult. The maximum energyanalysis method is also not reliable, since there is no guar-antee that the ground state is significantly fed. Also the
β − γ coincidence method can suffer from the ‘pandemo-nium’ effect [11].
As an example, in AME2003 the mass excess of theproton-rich nuclide 85Nb was determined as M − A=-67150±220 keV. This value was derived from the mea-sured Qβ in [1988Ku14], where the authors already no-ticed that their experimental Qβ was “noticeably lowerthan predicted values from mass formulae”. The massesof 85Nb and 85Zr were recently measured with high pre-cision using a Penning trap, and the Qβ value was thusdetermined to be about 900 keV higher than obtained in[1988Ku14]. The masses of 85Nb and 85Zr are now re-spectively 870 keV higher and 25 keV lower than inAME2003 with 2 orders of magnitude higher precisions.
The deduced higher values of atomic masses for ex-otic nuclides in the present work will have important con-sequences for nuclear astrophysics and nuclear energy ap-plications, see the discussion in Ref. [56].
To conclude, for nuclei very far from the valley of sta-bility, results from Qβ end-point measurements should betreated with caution. In such cases, data available fromPenning traps and/or storage rings facilities should alwaysbe given a priority.
6.8 Superheavy nuclides
The search for superheavy nuclides (SHE) and elucida-tion of their properties is one of the prominent areas of themodern nuclear physics research. In the last several yearsthe nuclear chart was extended impressively in the heavi-est mass region up to the element with an atomic numberof Z = 118. However, the exactness of the mass surfacebuilt with the available data is far from being perfect (seePart II, Fig. 9, p. 1835 and also Fig. 36, p. 1862).
Names and symbols At the time when AME2003 waspublished, SHE up to Z = 109 were officially named byThe Commission on Nomenclature of Inorganic Chem-istry of the International Union of Pure and AppliedChemistry (IUPAC) [57]. However and to be complete, ifthe user is to compare AME2012 with some older versionsof AME or NUBASE, he should be aware that in the pastsome confusion occured in the naming of elements, dueto IUPAC revising in 1997 some earlier proposals (see alsoNUBASE2012, Section 2, p. 1159) and changing symbolsand names for Z = 104, 105, 106 and 108 elements as fol-lows:
104 rutherfordium Rf replacing Db105 dubnium Db ” Jl106 seaborgium Sg ” Rf108 hassium Hs ” Hn
Since then, the names of five additional SHE were alsoapproved: the Z = 110, 111 and 112 elements were named

1318 Chinese Physics C (HEP & NP) Vol. 36
Darmstadtium, Roentgenium and Copernicium, respec-tively, as proposed by the SHIP group at GSI; while the el-ements 114 and 116 were named Flerovium and Livermo-rium, respectively, following the proposal by the Dubna-Livermore collaboration. The provisional symbols Ed, Ef,Eh, and Ei are used in AME2012 for the yet unnamed el-ements 113, 115, 117, and 118, respectively.
Experimental methods Since α decay is the dominantdecay mode in the region of super-heavy nuclides, knowl-edge of masses of SHE is most often obtained from mea-sured Eα energy in α decay chains going down to a nu-clide with known mass. Spatial and time-correlated α-decay (and SF) spectroscopy measurements of SHE con-tinue to provide useful information about their properties.However, it often happens that α chains end-up on a nu-clide decaying only by spontaneous fission (SF), offeringthus no link to known masses. For example, the SF de-cay of 266Sg does not allow to determine the mass of thedoubly magic nuclide 270Hs.
A very important development in this mass regionsince AME2003 was the first direct mass measurementsof several isotopes of No (Z = 102) and Lr (Z = 103) atthe SHIPTRAP facility at GSI. Those results provided an-chor points for the values of atomic masses in this remoteregion of the nuclear chart. In general, the newly mea-sured masses agree reasonably well with those deducedfrom known Qα values of long α chains, thus giving con-fidence not only for the reliability of masses for SHE re-ported in the present work, but also for the Qα obtainedup to here and to the treatment and policies we used.
Alpha decay of superheavy nuclides For even-evennuclides, the strongest (favored) decays connect the parentand daughter ground states, and hence, those are directlyrelated to the α-decay Q values. As a result, masses de-termined this way are quite reliable. Unfortunately, even-even nuclides are prone to spontaneous fission decay ren-dering these “good” cases relatively rare.
For many odd-A nuclides, and especially for odd-oddones, the assignments are frequently complicated. In thepresent region of deformed nuclides, α-decays preferen-tially feed levels with the same Nilsson model assign-ments as the mother, which in the daughter are most of-ten excited states, with unknown excitation energies E1.Thus, in order to find the corresponding mass difference,we have to estimate these E1’s. For somewhat lighter nu-clides, one may estimate them, as said above, from knowndifferences in excitation energies for levels with the sameNilsson assignments in other nuclides. But such infor-mation is lacking in the region under consideration. In
its place, one might consider to use values obtained theo-retically [58]. We have not done so, but used their val-ues as a guide-line. Finally, we choose values in sucha way that diagrams of α-energies and the mass surfacelooked acceptable. Important for this purpose were theexperimental α-decay energies for the heaviest isotopesfor Z = 112, 114 and 116, especially for the even-A iso-topes among them. The errors we assigned to values thusobtained may be somewhat optimistic; but we expect themnot to be ridiculous.
This is especially true near sub-shell closures, sincethe favored alpha decay occurs between states that havethe same quantum numbers and configurations. The pres-ence of excited, long-lived isomers can also lead to severecomplications. While many dedicated α − γ coincidencestudies have been performed for nuclides in the light ac-tinide region, such spectroscopy information needs to beextended to the heavier nuclides. In the last several yearsnew results were published in the No-Lr-Rf region, whichresolved some of the ambiguities. However, high qualitydata are still in demand and such studies would be verybeneficial to future determination of masses for SHE.
A weak α-decay branch was recently observed in thedecay of 262Sg [2010Ac.A], which allowed experimentaldetermination of the mass of 270Ds, the heaviest nuclidethat has an experimental mass value in AME2012. Thenew data allowed to establish unambiguously the exis-tence of a significant deformed sub-shell gap at N = 162and Z = 108. This gap appears to be much larger than thewell known one at N = 152 and Z = 100.
In the AME2003 mass table, the heaviest nuclide withknown mass was 265Sg, where the highest α decay groupEa = 8940±30 keV of [1998Tu01] was adopted as gs-gstransition. This is a common policy if the α decay ener-gies spread too much, because even if this group is formeddue to α-electron summing, it is still the closest one to thereal gs-gs Q value. With more events accumulated, thestatus has been changed for 265Sg and the former α de-cay group assigned to 266Sg is reassigned to 265Sgm state.In present evaluation we use the strongest group, whichmay be the unhindered transition, assuming this transitiongoes to one excited state in the daughter nuclide 261Rf withunknown energy, which is estimated from the trends inthe neighboring nuclides. Then in the present mass table,the mass of 265Sg is estimated rather than experimental inAME2003, although the mass value doesn’t change much.
With exception of the nuclide 278113, all of the nu-clides with atomic number from 113 to 118 are producedby using the ”hot fusion” method, decaying with α emis-sion eventually to some fissile nuclides whose masses areunknown experimentally, thus forming a floating islandwith none of the nuclides having known mass.

No. 12 G. Audi et al: The AME2012 atomic mass evaluation (I). Evaluation of input data, adjustment procedures 1319
7 Special cases
In AME2003, some special cases have been discussed.Since new experimental information emerged in recentyears, some of them have been resolved, while for othersnew issues were raised.
7.1 9He and 10He
The knockout reaction on 11Be has been used to pro-duce 9He [2001Ch31] and an l = 0 state has been assignedas its lowest state. An upper limit of the s-wave scat-tering length as=–10 fm has been obtained, correspond-ing to an energy for the virtual state below 0.2 MeV. In[2007Go24], the spectrum of 9He was studied by meansof the 2H(8He,p)9He reaction. The lowest resonant stateof 9He was found at 2.0±0.2 MeV with a width of 2 MeVand has been identified as a 1/2− state. For the virtual 1/2+
state, a lower limit as >−20 fm has been obtained, whichis not inconsistent with the result in [2001Ch31]. Thisassignment has been questioned in [2010Jo06], where9He was studied by using knockout reaction from 11Li.The 8He+n relative-energy spectrum is dominated by astrong peak-like structure at low energy, which may beinterpreted within the effective-range approximation asthe result of an s-wave interaction with a neutron scat-tering length as = −3.17± 0.66 fm, thus conflicting with[2001Ch31]. It is argued that the s-state might not be theg.s. of 9He.
This argument is supported by the structure of 10He,which is highly dependent on the structure of 9He. Ifa virtual state in 9He as seen in [2001Ch31] really ex-isted, a narrow near-threshold 0+ state in 10He with a[s1/2]2 structure would exist in addition to the [p1/2]2
state [59, 60], in contradiction to the available experimen-tal data on 10He.
Based on these experimental results, we adopt the 1/2−
as the ground state of 9He. In earlier work [1987Se05],[1988Bo20], and [1991Bo.B], transfer reactions wereused, yielding values of Er (resonance energy) of thisstate around 1.1 MeV. More recently, [1999Bo26] and[2010Jo06] determined Er ∼ 1.3 MeV. In [2007Go24], the1/2− state of 9He was found at Er = 2.0± 0.2 MeV witha width∼ 2 MeV in this work, significantly higher than inthe other work. The energy resolution of this experimentwas 0.8 MeV (FWHM), which is quite large compared tothe energy difference of ∼1.1 MeV between the 1/2− and3/2− states [1988Bo20], [1999Bo26], [2010Jo06]. There-fore, we suspect this state to be a mixture due to the poorenergy resolution in this experiment.
Finally, we adopt the results of [1999Bo26] and[2010Jo06] to define the resonance energy of the g.s. of9He.
Four experimental results are known concerning themass of 10He, as listed below:
Reference Q2n(in keV) Method of production
1994Os04 1070 ± 70 10Be(14C,14O)10He1994Ko16 1200 ±300 C(11Li,10He)2010Jo06 1420 ±100 1H(11Li,10He)2012Si07 2100 ±200 3H(8He,p)10He
The mass of 10He from [1994Os04] is significantlylower than the others. In this work the statistics are poorcompared to the high background. The values obtained intwo invariant mass measurements agree with each other,both using 11Li to produce 10He. In the most recentwork the value is higher than the others, while the authorsstated that “the results reported in Refs. [1994Ko16] and[2010Jo06] do not contradict the g.s. energy of 10He ob-tained in the present work”, based on the calculations ofRef. [60]. They argued that due to the strong initial stateeffect, the observable g.s. peak position in [1994Ko16]and [2010Jo06] is shifted towards lower energy becauseof the abnormal size of 11Li possessing one of the mostdeveloped known neutron halos.
The argument is based on theoretical calculations in athree-body 8He+n+n model from [60]. The structure of10He is highly dependent on the structure of 9He. Basedon the 9He spectrum from [2007Go24], the 10He g.s.with structure [p1/2]2 is predicted to be at about 2.0−2.3 MeV. However, the result of 9He from [2007Go24] isnot adopted, as discussed earlier. The model has problemsin interpreting all of the experimental data, indicating thestates may have a more complex structure. In the presentevaluation, we choose the result from [2010Jo06] provi-sionally and call for more experiments to clarify this case.
Note added in proof : very recently, a group from MSU
has studied 10He using the fragmentation of 14Be. Theirresult supports our choice. The discrepancy with the resultin [2012Si07] could not be explained simply by the exoticstructure of 11Li, which was the argument used in the pre-vious experiment, since, in the present case, a differentreaction channel is explored.
7.2 The masses of 26Al and 27Al
In AME2012, the mass excess of 26Al is−12210.112± 0.064 keV, which is more than 3 σ awayfrom the AME2003 value of −12210.31± 0.06 keV. Theorigin of this difference lies in the new 26Al-26Mg Penningtrap measurement at JYFLTRAP [2009Er02], which is instrong conflict with the older 26Mg(p,n)26Al measurement[1994Br11] as used in AME2003.
Prior to AME2003, the two results of the 25Mg(n,γ)reaction were not in absolute agreement, either with

1320 Chinese Physics C (HEP & NP) Vol. 36
one another, or when combined with the average ofnon-conflicting values, such as that constructed from25Mg(p,γ) and the two values for 26Mg(p,n)26Al. Theolder Penning trap mass values for 24Mg and 26Mg[2003Be02], combined with the average of the very nicelyagreeing values for the 24Mg(n,γ) reaction, gave a valuehalfway between the ones just mentioned. In AME2003we considered this compromise but concluded that themass of 26Al was not reliable. This situation was thoughtunfortunate, especially because of the special interest ofthe 26Mg(p,n)26Al reaction for problems connected withthe intensity of allowed Fermi β -transitions. Therefore,the new result from JYFLTRAP mentioned above is mostlywelcome in the present adjustment.
This result also helped solving the difficulty we hadwith the mass of 27Al (see AME2003), due to its connec-tions with all the nuclides just mentioned and, also with28Si through the (p,γ) reaction.
The new mass for 26Al fix the problem by discard-ing definitively the 26Mg(p,n)26Al results [1992Ba.A],[1984Ba.B], and [1994Br11], all from the same group.However, no clear explanation can be given here for thesediscrepancies.
7.3 The mass of 32Si
In AME2003, the mass excess of 32Si was−24080.91±0.05 keV. The value was determined, by thePTB group in Braunschweig, from an extraordinarily pre-cise (n,γ) measurement [2001Pa52], originally given witha precision (5 eV) we judged, at that time already, to beexcessively optimistic. Moreover, the publication did notprovide spectra or any other detailed information. Bycomparison to well established (n,γ) from other groups,we could evaluate a calibration error of 30 eV and derivethe above value in AME2003.
However, recently, the MSU group [2009Kw02] mea-sured the masses of several nuclides including 32Si, in aPenning trap. Their result is 3.25 keV away from the PTBresult, and with a precision of 0.30 keV for 32Si. The MSUmeasurements were internally cross-checked by combin-ing various molecules and comparing to different refer-ences.
In general, and until otherwise proven, (n,γ) measure-ments have the reputation of being quite reliable. We havetried to contact the PTB group, but without success, to dis-cuss their measurement. Until this issue is resolved, it hasbeen decided, provisionally at least, not to use the (n,γ)data, but rather the Penning trap values.
7.4 The 35S(β−)35Cl decay energy
This case has been investigated several times in con-nection with the report that a neutrino might exist with amass of 17 keV.
Up until AME2003, the reported decay energies wereso different from each other (with a Birge ratio of χn =
3.07), that we decided at that time to use all nine datasets,irrespective of their claimed precision. We applied thenthe procedure described in Section 5.4.1 to establish thearithmetic average, and uncertainty, derived from the dis-persion of the 9 data, at 167.222±0.095 keV.
A new value, that was unfortunately missed inAME2003 is now adopted, at 167.334 ± 0.027 keV[2000Ho13]. It outweighs all previous 35S(β−)35Clmeasurements. Moreover it agrees quite nicely withthe two accepted 34S(n,γ)35S results in [1983Ra04] and[1985Ke08].
7.5 The masses of 35,37Cl and 36Ar
The SMILETRAP 36Ar result [2003Fr08] was some1.2 keV lower than the value accepted until 2003, forwhich an error of 0.3 keV was claimed. The latter valuewas essentially due to mass-spectrometry results for 35Cland 37Cl, combined with reaction energies for five re-actions. These data agreed quite well if combined in aleast squares analysis: χn = 1.13. Combining with the[2003Fr08] mass value for 36Ar increases χn to 2.00. Butthis value could be reduced to a reasonable 1.35 if, of thetwo available values for the 36Ar(n,γ)37Ar reaction energy,the oldest, not well documented one is no longer used.Also, this removed an earlier hardness in the connectionwith 40Ar, of which the mass was already known with highprecision. This problem is considered definitively settled.
7.6 The masses of 100Sn
Determination of the mass of 100Sn has been subject ofdiscussion in AME2003. This result is particularly inter-esting due to the doubly magic character of 100Sn whichis, moreover, the heaviest known nuclide with N = Z.
The adopted mass in AME2003 was −56780 ±710 keV, due to β+ decay, and is 1060 keV less boundthan indicated by the GANIL result [1996Ch32]. Earlierestimate from trends in the mass surface (TMS), were -56860#(430#) keV in AME1995, and -56460#(450#) keVin AME1993. The differences are not particularily largeas compared to the claimed or estimated precisions. Itis therefore interesting to note that the new result in[2012Hi07], also from β+ decay, yields -57280(300) keV,that is almost half-way between the above values.

No. 12 G. Audi et al: The AME2012 atomic mass evaluation (I). Evaluation of input data, adjustment procedures 1321
Figure 4: Flow of information diagram displaying the three “routes” between 102Pd and 102Ru. Each square box represents anindividual nuclide. Its mass precision (keV) is given in the lower right corner, its degree in the upper right corner. Along eachconnection between two nuclides is the type of relation, its precision and on both sides are arrows indicating the flow of informationto the two connected nuclides.
7.7 The 102Pd double-electron capture energy
The double β or ε energy of some nuclides is an im-portant parameter to study the neutrino properties. In re-cent years this measurement has attracted at lot attention,mainly in high-precision Penning traps. The mass differ-ence between 102Pd and 102Rh, equivalent to the double-electron capture energy of 102Pd, has been measured re-cently by SHIPTRAP yielding Qεε = 1203.27± 0.36 keV[2011Go23]. This result differs from the AME2003 value1173.0±2.4 keV by 30 keV, i.e., more than 10 standarddeviations. Besides this measurement, this Qεε value canbe determined by local links established experimentally,as shown in Fig. 4. The two nuclides involved are notonly linked via 102Rh, but also are connected with highermass isotopes through (n,γ) with lower uncertainty. TheQεε values obtained with these two different links agreewith each other perfectly. All these connections, except102Rh(β−)102Pd, are determined by two or more differ-ent groups, sometimes with different methods. Their re-sults are in good agreement with each other, and no rea-son can be found to suspect any individual measurement.Details of the input data is displayed in Table I. It shouldbe recalled that Penning trap measurements have gener-ally been quite reliable. In the present evaluation, the newPenning trap result is provisionaly not used. We call formore measurements to clarify this issue.
7.8 The mass of 105Sb
The nuclide 105Sb was reported in [1994Ti03] to bea proton emitter with Ep = 478± 15 keV (thus Qp =
482.6± 15 keV) and a branching ratio of 1%. How-ever, the later work of [1997Sh13] and [2005Li47], us-ing different experimental methods, were unable to con-firm the [1994Ti03] result. In fact, the production yieldin the [2005Li47] work was significantly higher than inthe previous studies, yielding an upper limit of 0.1% forthe proton branching ratio (∼150 decay events of 105Sbwere expected, but none were seen), indicating that theactivity observed in [1994Ti03] did not belong to 105Sb.In more recent work, [2007Ma35] reported a weak α-decay branch for the ground state decay of 109I withan energy of Eα = 3774± 20 keV. Because of the exist-ing relationship between proton and α-decay Q values,Qα (109I)+Qp(105Sb)=Qp(109I)+Qα (108Te), one can deter-mine Qp(105Sb) = 322± 22 keV. This value is in severedisagreement with the result (483±15 keV) of [1994Ti03]It is difficult to conclude unambiguously from the trendsin the mass surface alone, which value is correct. Conse-quently, the Qp value deduced from the Qα measurementin [2007Ma35] was adopted in the present evaluation, andwill determine the mass of 105Sb. Direct proton-decaystudies of 105Sb are desirable in order to clarify this case.

1322 Chinese Physics C (HEP & NP) Vol. 36
7.9 The 163Ta(α)159Lu(α)155Tm decay chain
This α-decay chain was discussed in the previousAME2003 publication, because it presented special dif-ficulties.
The chain starts at 179Tl and undergoes a series ofconsecutive α decays from both the ground state and ex-cited isomer, which are associated with the s1/2 and h11/2proton orbitals. It terminates at 147Tb, which decays en-tirely by β+ decay and whose ground state spin is mea-sured directly as J=1/2, with a higher spin isomeric state,Jπ =11/2−, located at 50.6±0.9 keV.
Mass-spectrometer data with precisions ranging from28 to 68 keV are available [2005Li24] for the 147Tb,151Ho, 155Tm, 159Lu and 163Ta members of the chain.The first 3 ones carry no weight, but agree within theirprecision with values deduced from α decays. The di-rectly measured mass of 159Lu, with a precision of 57 keV,agrees with, and is combined with the Qα measurementwithin the adjutment procedure.
Only 163Ta (48 keV precision) strongly disagrees(3.6 σ ) and is not accepted in our calculation. Theα decay of 163Ta yields Q(α)=4749±6 keV whereascombining masses from [2005Li24] one can deriveQ(α)=4656±40 keV. In order to resolve this discrepancy,an isomeric state needs to be introduced in 163Ta, and
which α decays to the 159Lu ground state.In fact, such an isomer is now established at 130#±
20# keV above the ground state from the measured α-decay energies and parent-daughter correlations in decaysof the 179Tlm(α)175Aum(α)171Irm(α)167Regs(α)163Tam
chain nuclides and the estimated excitation energies825#± 10# for the 179Tlm isomer. The latter estimate isderived from interpolation of similar (11/2−) states in Tlisotopes 177, 181 and 183. The isomer in 163Ta is as-signed Jπ = (9/2−), following the favorite α decay fromthe Jπ = (9/2−) 167Re ground state.
To summarize, by combining all available informa-tion, and by discarding only one piece of data, we wereable to build up a scenario for the double (ground statesand excited isomers) 147Tb-179Tl decay chain. Howevermost of the adopted values for excitation energies, andalso for the 167Re ground state are still labeled with the ‘#’flag, due to the estimated excitation energy of 179Tlm. Ex-perimental determination of any of the excitation energyin 159Lu, 163Ta, 167Re, 171Ir, 175Au, or 179Tl will allow toaccess all other ones. Future measurements would be ben-eficial not only in order to firmly establish these excitationenergies, but even more importantly, to provide also use-ful parent-daughter correlations on α decays that feed the159Lu ground state and decays out of the excited isomer.
Figure 5: Loops created by two alpha decay chains interconnected by proton decays. See caption of Fig. 4. ‘m’ stands for the excitedisomer of the nuclide below it.

No. 12 G. Audi et al: The AME2012 atomic mass evaluation (I). Evaluation of input data, adjustment procedures 1323
Table D. Input data and adjusted values around the 170Au-165Os loop.
Item Input AME2003 Output AME2003 Adjusted LSM Input AME2012 adjusted value
166Ir(p)165Os 1152(8) 1152(8) 1150.6(7.1) 1152(8) 1154(6)166Irm(IT)166Ir 171.5(6.1) 172(6) 170.8(5.6) 171.5(6.1) 172(6)169Pt(α)165Os 6846.233(12.869) 6846(13) 6849.8(8.9) 6857.4(5.) 6856(5)170Au(p)169Pt 1473.8(15.) 1474(15) 1475(10) 1471.7(12.) 1470(9)170Aum(p)169Pt 1747.9(6.247) 1748(6) 1748.9(5.7) 1751.356(5.145) 1751(5)170Au(α)166Ir 7174.1(11.) 7168(21) 7173.7(9.3) 7170(12) 7172(9)170Aum(α)166Irm 7277.5(6.) 7271(17) 7276.9(5.6) 7278.5(9.) 7280(7)
7.10 The 170Au(α) and 169Pt(α) decay chains
It has been previously mentioned that some proton-rich nuclides can decay by both α and proton emission.In some cases, a loop of interconnected nuclides can beformed. Two long α-decay chains illustrate this case:
170Au - 166Ir - 162Re - 158Ta - 154Lu and169Pt - 165Os - 161W - 157Hf - 153Yb - 149Er,
which are connected by 170Au(p)169Pt and 166Ir(p)165Os,thus forming a loop as shown in Fig. 5. Unfortunately,none of the masses shown in Fig. 5 has been measured. Ifthe mass of at least one nuclide is measured in the future,then all of the masses along the above two decay chainswill be determined.
The general difficulty here, is that if all of the ex-perimental information is used in the evaluation, then a
closed loop would be formed, and all nuclides involvedwould be primary. The consequence is that some es-timated (non-experimental) values would then automati-cally become primary data. For example, to avoid this,the 170Au(α)166Ir value was not used in AME2003, de-spite its good precision. A local evaluation is carried outin this region, involving all the corresponding nuclides,using least-squares method. The input and adjusted val-ues are listed in Table D. The sources of the input datacan be found in main Table I. As can be seen, the ad-justed value of 170Au(α)166Ir would be 7173.7±9.3 in-stead of 7168±21, as listed in Table I of AME2003, if thefull-scale least-squares method had been employed. Othervalues are also influenced by this new evaluation, as dis-cussed in the following paragraph.
Figure 6: The loop and decay chains from 171Aum down to 150Er, when replacing 171Aum(p)170Pt by an equivalent 167Ir(p)166Os, astreated in AME2003. In the AME2012 treatment, the dotted connection has been restored. See caption of Fig. 4. ‘m’ stands for theexcited isomer of the nuclide below it.

1324 Chinese Physics C (HEP & NP) Vol. 36
Figure 7: The loop and decay chains from 165Irm down to 152Tm, when replacing 165Irm(p)164Os by an equivalent 161Re(p)160W, astreated in AME2003. In the AME2012 treatment, the dotted connection has been restored. See caption of Fig. 4. ‘m’ stands for theexcited isomer of the nuclide below it.
Table E. Input data and adjusted values around the 165Ir-160W loop.
Item Input Value AME2003 Output AME2003 Reference Output AME2012
161Re(p)160W 1199.5 ± 6.0 1197.2 ± 5.3 97Ir01 1197.3 ± 5.3161Re(p)160W 1188.9 ± 11.5 1197.2 ± 5.3 replacement161Rem(IT)161Re 123.8 ± 1.3 123.8 ± 1.3 97Ir01 123.4 ± 1.3164Os(α)160W 6473.2 ± 10.0 6477.2 ± 5.9 96Bi07 6479.4 ± 5.3164Os(α)160W 6479.4 ± 7.0 6477.2 ± 5.9 96Pa01 6479.4 ± 5.3165Irm(p)164Os 1717.5 ± 7.0 1725.9 ± 10.8 97Da07 1720.5 ± 5.9165Irm(α)161Rem 6882.1 ± 7.0 6882.1 ± 7.0 97Da07 6878.9 ± 6.0
Here is a similar, but slightly different exemple. Inour previous adjustments, following our policy of replace-ment to avoid loops, we also replaced in some rare casesa connection that did not obey the conditions defined inSection 5.4.2, by an equivalent connection, accepting a(slight) loss of precision. For example, in AME2003, the1717.5±7.0 for 165Irm(p)164Os was replaced (see Table E)by an equivalent 1188.9±11.5 for 161Re(p)160W, to avoidhaving 7 secondary masses to become primary as illus-trated in Fig. 7. The increase in the uncertainty reflectsthe combination with other connections in the loop whichuncertainties are not negligible.
There is no new experimental data since the publica-tion of AME2003. We however decided in AME2012,taking advantage of computer’s increased power, to re-store original data, making thus all the nuclides in thechain down to 152Tm to become primaries. Table E dis-plays comparison of the two treatments and the restoredprecision of the 165Irm(p)164Os datum.
The only other case of this type is illustrated in Fig. 7.The interested reader will find in the main Table I all de-tails and rebuild easily an equivalent of Table E.

No. 12 G. Audi et al: The AME2012 atomic mass evaluation (I). Evaluation of input data, adjustment procedures 1325
7.11 The problem of the stable Hg isotopes
In our earlier evaluations we did not accept the 1980Winnipeg measurements of the atomic masses of stableHg isotopes, reported with errors of only about 1 keV.Since AME2003 the situation is stabilized. Here we re-call the reasons for this.
In [1980Ko25], mass differences were measured be-tween stable Hg isotopes and 12C2 Cl5 molecules, forA = 199 and 201, or 12C13C Cl5, for A = 200, 202 and204. The resulting Hg masses values were 22 µu high(odd A) and 17 µu high (even-A), compared to values frommass-spectrometry results for both lighter and heavier nu-clides combined with experimental reaction and decay en-ergies, see Fig. 1 in [34]. The difference suggested an in-fluence due to the intensities of the ion beams, since 13Cis much less abundant than 12C. Therefore, both sets ofresults were judged questionable.
In 2003, the Winnipeg group reported a new valuefor 199Hg [2003Ba49], 7 µu lower than their 1980 result.In addition, measurements with the Stockholm Penningtrap spectrometer SMILETRAP gave results for 198Hg and204Hg, essentially agreeing with the 1980 Winnipeg even-mass values. Thus, the latter appear to be reasonable.
We therefore accepted these data, and also includedold and new nuclear reaction and decay results.
The relation with the higher-A mass-spectrometry re-sults (Th and U isotopes) is acceptable, but the differ-ences are nearly equal to the old ones but with a changein sign. With lower-A, Winnipeg provided further infor-mation through new measurements of the mass of 183Wand its difference with 199Hg. These essentially confirmedthe mass values around 183W given in earlier evaluations[3, 7]. For completeness, we observe that the new 183Wresult is 15 µu higher than the 1977 Winnipeg result (error2.7 µu), which was one of the items that helped to suggestthe lower Hg masses.
Closer scrutiny, shows that nuclear reaction energies,in the region between these two nuclides, have discrepan-cies which, as yet, are not resolved. The upshot is, thatthe earlier difficulty in the connection of the stable Hg’sto lower A data appears to be due to errors in the mass-spectrometer data used at the time. We therefore thinkthat the most recent mass values for these Hg isotopes asadopted since 2003 are definitely more dependable thanearlier ones.
7.12 Other special cases
Other special cases are presented and discussed on theAMDC web site [8].
8 General information and acknowledg-ments
The full content of the present issue is accessible on-line at the AMDC website [8]. In addition, on the site,there are several localized mass analyses that were carriedout, but could not be given in the printed version. Also,several graphs representing the mass surface, beyond themain ones in Part II, are also available.
As before, the table of masses (Part II, Table I) and thetable of nuclear reaction and separation energies (Part II,Table III) are available in plain ASCII format to sim-plify their input to computer programs using standard lan-guages. The headers of these files give information on theformats. The first file, named mass rmd.mas12, containsthe table of masses. The next two files correspond to thetable of reaction and separation energies, in two parts of6 entries each, as in Part II, Table III: rct1 rmd.mas12for S2n, S2p, Qα , Q2β , Qε p and Qβn (odd pages in thisissue); and rct2 rmd.mas12 for Sn, Sp, Q4β , Qd,α , Qp,α
and Qn,α (facing even pages). As explained in Section 4.2,since AME2003, we no longer produce any more specialtables for experimental data which we do not recommend.
We wish to thank our many colleagues who answeredour questions about their experiments and those who sentus preprints of their papers. Continuous interest, discus-sions, suggestions and encouragements from K. Blaum,D. Lunney, G. Savard, Zhang Yuhu, Zhongzhou Ren, andCh. Scheidenberger were highly appreciated.
This work was performed in the frame and with thehelp of the French-Chinese collaboration under the PICSprogramme. M.W. acknowledges support from the Max-Planck Society, from the International Atomic EnergyAgency, IAEA-Vienna and from the National Natural Sci-ence Foundation of China through Grant No.10925526,11035007. The work at ANL was supported by the U.S.Department of Energy, Office of Nuclear Physics, underContract No. DE-AC02-06CH1357.
Appendix A The meaning of decay energies
Conventionally, the decay energy in an α-decay is de-fined as the difference in the atomic masses of mother anddaughter nuclides:
Qα = Mmother−Mdaughter−M4He (8)
This value equals the sum of the observed energy of theα particle and the easily calculated energy of the recoil-ing nuclide (with only a minor correction for the fact thatthe cortege of atomic electrons in the latter may be in anexcited state). Very unfortunately, some authors quote asresulting Qα a value ‘corrected for screening’, which es-sentially means that they take for the values M in the above
1326 Chinese Physics C (HEP & NP) Vol. 36
equation the masses of the bare nuclides (the difference isessentially that between the total binding energies of allelectrons in the corresponding neutral atoms).
This bad custom is a cause of confusion; even so muchthat in a certain paper this “correction” was made for somenuclides but not for others.
A similar bad habit has been observed for some protondecay energies. We very strongly object to this custom; atthe very least, the symbol Q should not be used for thedifference in nuclear masses!
Appendix B Mixtures of isomers or of iso-bars in mass-spectrometry
In cases where two or more unresolved lines may com-bine into a single one in an observed spectrum, while onecannot decide which ones are present and in which pro-portion, a special procedure has to be used.
The first goal is to determine what is the most proba-ble value Mexp that will be observed in the measurement,and what is the uncertainty σ of this prediction. We as-sume that all the lines may contribute and that all con-tributions have equal probabilities. The measured massreflects the mixing. We call M0 the mass of the lowestline, and M1,M2,M3, . . . the masses of the other lines. Fora given composition of the mixture, the resulting mass mis given by
m = (1−n
∑i=1
xi)M0 +n
∑i=1
xiMi with
{0≤ xi ≤ 1
∑ni=1 xi ≤ 1
(9)in which the relative unknown contributions x1,x2,x3,
. . . have each a uniform distribution of probability withinthe allowed range.
If P(m) is the normalized probability of measuring thevalue m, then :
M =∫
P(m)mdm (10)
and σ2 =
∫P(m)(m−M)2 dm (11)
It is thus assumed that the experimentally measured masswill be Mexp = M, and that σ , which reflects the uncer-tainty on the composition of the mixture, will have to bequadratically added to the experimental uncertainties.
The difficult point is to derive the function P(m).
B.1 Case of 2 spectral lines
In the case of two lines, one simply gets
m = (1− x1)M0 + x1M1 with 0≤ x1 ≤ 1 (12)
The relation between m and x1 is biunivocal so that
P(m) =
{1/(M1−M0) if M0 ≤ m≤M1,
0 elsewhere(13)
i.e. a rectangular distribution (see Fig. 8a), and one ob-tains :
Mexp =12(M0 +M1) (14)
σ =
√3
6(M1−M0) = 0.290 (M1−M0)
B.2 Case of 3 spectral lines
In the case of three spectral lines, we derive from Eq. 9:
m = (1− x1− x2)M0 + x1M1 + x2M2 (15)
with
0≤ x1 ≤ 1
0≤ x2 ≤ 1
0≤ x1 + x2 ≤ 1
(16)
The relations (15) and (16) may be represented on a x2
vs x1 plot (Fig. 9). The conditions (16) define a triangu-lar authorized domain in which the density of probabilityis uniform. The relation (15) is represented by a straightline. The part of this line contained inside the triangle de-fines a segment which represents the values of x1 and x2
satisfying all relations (16). Since the density of probabil-ity is constant along this segment, the probability P(m) isproportional to its length. After normalization, one gets(Fig. 8b):
P(m) =2k
M2−M0(17)
with
{k = (m−M0)/(M1−M0) if M0 ≤ m≤M1
k = (M2−m)/(M2−M1) if M1 ≤ m≤M2(18)
and finally:
Mexp =13(M0 +M1 +M2) (19)
σ =
√2
6
√M2
0 +M21 +M2
2 −M0M1−M1M2−M2M0
B.3 Case of more than 3 spectral lines
For more than 3 lines, one may easily infer Mexp =
∑ni=0 Mi/(n+ 1), but the determination of σ requires the
knowledge of P(m). As the exact calculation of P(m) be-comes rather difficult, it is more simple to do simulations.

No. 12 G. Audi et al: The AME2012 atomic mass evaluation (I). Evaluation of input data, adjustment procedures 1327
(a) (b)
Figure 8: Examples of probabilities to measure m according to an exact calculation in cases of the mixture of two (a) and three (b)spectral lines.
However, care must be taken that the values of the xi’sare explored with an exact equality of chance to occur. Foreach set of xi’s, m is calculated, and the histogram N j(m j)
of its distribution is built (Fig. 10). Calling nbin the num-ber of bins of the histogram, one gets :
P(m j) =N j
∑nbinj=1 N j
(20)
Mexp =nbin
∑j=1
P(m j)m j
σ2 =
nbin
∑j=1
P(m j)(m j−Mexp)2
A first possibility is to explore the xi’s step-by-step: x1
varies from 0 to 1, and for each x1 value, x2 varies from0 to (1− x1), and for each x2 value, x3 varies from 0 to(1− x1− x2), . . . using the same step value for all.
A second possibility is to choose x1,x2,x3,
. . . randomly in the range [0,1] in an independent way,and to keep only the sets of values which satisfy the rela-tion ∑
ni=1 xi ≤ 1. An example of a Fortran program based
on the CERN library is given below for the cases of two,three and four lines. The results are presented in Fig. 10.
Both methods give results in excellent agreement witheach other, and as well with the exact calculation in thecases of two lines (see Fig. 8a and 10a) and three lines(see Fig. 8b and 10b).
The Fortran program used to produce the histograms in Fig. 10.
program isomers
c-----------------------------------------------------------------
c- October 15, 2003 C.Thibault
c- Purpose and Methods : MC simulation for isomers (2-4 levels)
c- Returned value : mass distribution histograms
c-----------------------------------------------------------------
parameter (nwpawc=10000)
common/pawc/hmemor(nwpawc)
parameter (ndim=500000)
dimension xm(3,ndim)
data e0,e1,e31,e41,e42/100.,1100.,400.,200.,400./
call hlimit(nwpawc)
c histograms 2, 3, 4 levels
call hbook1(200,’’,120,0.,1200.,0.)
call hbook1(300,’’,120,0.,1200.,0.)
call hbook1(400,’’,120,0.,1200.,0.)
call hmaxim(200,6500.)

1328 Chinese Physics C (HEP & NP) Vol. 36
Figure 9: Graphic representation of relations 15 and 16. The length of the segments (full thick lines) inside the triangle are propor-tional to the probability P(m). Three cases are shown corresponding respectively to m < M1, m = M1, and to m > M1. The maximumof probability is obtained when m = M1.
call hmaxim(300,6500.)
call hmaxim(400,2500.)
w=1.
c random numbers [0,1]
ntot=3*ndim
iseq=1
call ranecq(iseed1,iseed2,iseq,’ ’)
call ranecu(xm,ntot,iseq)
do i=1,ndim
c 2 levels :
t=1-xm(1,i)
e = t*e0 + xm(1,i)*e1
call hfill(200,e,0.,w)
c 3 levels :
if ((xm(1,i)+xm(2,i)).le.1.) then
t=1.-xm(1,i)-xm(2,i)
e= t*e0 + xm(1,i)*e31 + xm(2,i)*e1
call hfill(300,e,0.,w)
end if
c 4 levels
if ((xm(1,i)+xm(2,i)+xm(3,i)).le.1.) then
t=1.-xm(1,i)-xm(2,i)-xm(3,i)
e = t*e0 + xm(1,i)*e41 + xm(2,i)*e42 + xm(3,i)*e1
call hfill(400,e,0.,w)
end if
end do
call hrput(0,’isomers.histo’,’N’)
end

No. 12 G. Audi et al: The AME2012 atomic mass evaluation (I). Evaluation of input data, adjustment procedures 1329
(a) (b)
(c)
Figure 10: Examples of Monte-Carlo simulations of the probabilities to measure m in cases of two (a), three (b) and four(c) spectral lines.
B.4 Example of application for one, two or three ex-cited isomers
We consider the case of a mixture implying isomericstates. We want to determine the ground state massM0 ± σ0 from the measured mass Mexp ± σexp and theknowledge of the excitation energies E1±σ1, E2±σ2, . . .
With the above notation, we haveM1 = M0 +E1,M2 = M0 +E2, . . .
For a single excited isomer, Equ. (14) can be written:
M0 = Mexp−12
E1
σ2 =
112
E21 or σ = 0.29E1
σ20 = σ
2exp +(
12
σ1)2 +σ
2
For two excited isomers, Equ. (19) lead to :
M0 = Mexp−13(E1 +E2)
σ2 =
118
(E21 +E2
2 −E1E2)
or σ = 0.236√
E21 +E2
2 −E1E2
σ20 = σ
2exp +(
13
σ1)2 +(
13
σ2)2 +σ
2
If the levels are regularly spaced, i.e. E2 = 2E1,
σ =
√6
12E2 = 0.204E2
while for a value of E1 very near 0 or E2,
σ =
√2
6E2 = 0.236E2

1330 Chinese Physics C (HEP & NP) Vol. 36
For three excited isomers , the example shown inFig. 10c leads to:
M0 = Mexp−14(E1 +E2 +E3) = 450.
σ = 175.
σ20 = σ
2exp +(
14
σ1)2 +(
14
σ2)2 +(
14
σ3)2 +σ
2
Appendix C Converting frequency ratios tolinear equations
In the following, quantities with the subscript r de-scribe the charateristics of the reference ion in the PenningTrap. Equivalent quantities, with no subscript, describecharacteristics of the ion being measured. The ratio R offrequencies f between the reference and newly measuredion is written:
R =fr
f=
M −me q+BMr−me qr +Br
qr
q(21)
where q is the charged state of the given ion, B is the elec-tron binding energy, me is the mass of the electron andM the total atomic mass. All masses and energies are inatomic mass units (u) and so, u=1.
This expression can be written in terms of the mass excessM and atomic mass number A:
A+M − Rqqr
Ar−Rqqr
Mr =
= me q(1−R)+Br Rqqr−B
or, alternatively:
M−Rqqr
Mr = me q(1−R) + Ar
(qqr
R− AAr
)+ Br R
qqr−B
The general aim is to establish some quantity y andits associated precision dy. We define C to be a truncated,three-digit decimal approximation of the ratio A to Ar, andthen we can write:
y = M−C Mr (22)
and soy = y1 + y2 + y3 + y4 (23)
where
y1 = Mr
(R
qqr−C)
(24)
y2 = me q(1−R) (25)
y3 = Ar
(qqr
R− AAr
)(26)
andy4 = Br R
qqr−B (27)
To fix relative orders of magnitude, Mr is generallysmaller than 0.1 u, R−C is a few 10−4, (1−R) is usu-ally smaller than unity (and typically 0.2 for a 20% masschange), R− A
Arvaries from 1 to 100×10−6 and Ar is typ-
ically 100 u for atomic mass A = 100. The four terms y1,y2, y3, and y4 take values of the order of 10 µu, 100 µu,10 to 10000 µu, and 0.1 µu, respectively.
The associated precision dy is written:
dy = dy1 +dy2 +dy3 +dy4 (28)
where
dy1 =qqr
Mr dR+
(R
qqr−C)
dMr ' dR×105µu
(29)dy2 = me q dR' dR×103
µu (30)
dy3 =qqr
Ar dR' dR×108µu (31)
and
dy4 =qqr
Br dR+Rqqr
dBr +dB' dR×10−1µu (32)
Consequently, only the 3rd term contributes signifi-cantly to the precision of the measurement, and so wewrite: dy = dy3
If the two frequencies are measured with a typical pre-cision of 10−7 for ions at A = 100, then the precision onthe frequency ratio R is 1.4× 10⁻⁷ and the precision onthe mass is approximatively 14 µu.
C.1 Program for frequency conversion
Primary data from Penning Trap measurement are typi-cally given in the form of an experimental frequency ra-tio. An example is given here for a series of nuclideswith respect to a various reference nuclides and variouscharge states. Below is the Fortran frequency conversionprogram, followed by sample input file and correspondingoutput file.
No. 12 G. Audi et al: The AME2012 atomic mass evaluation (I). Evaluation of input data, adjustment procedures 1331
The frequency conversion program
c PTrap15publ G.Audi m 06 nov 2012
c
c Conversion of Frequency Ratios to Linear Equations
c
real*8 xzero,mel,mref,smref,mrefk,rap,srap,coef
real*8 prov,membre,sigmem,m118,sm118
integer q118,qref
character txref*4,tx118*4,rev*2
character*30 filea,fileb
c
c mel : electron mass in micro-u
c mref, smref : Mass and uncert. for reference (ref)
c m118, sm118 : Mass and uncert. for mesured (118)
c qref, q118 : charge states of the ions
c
filea=’ptkl.equat ’ ! output file
fileb=’ptkl.freq ’ ! input file
open(unit=1,file=filea,form=’formatted’,status=’new’)
open(unit=3,file=fileb,form=’formatted’,status=’old’,readonly)
c
mel = 548.5799110
xzero = 9.314940090d-1 ! conversion factor micro-u to keV
12 read(3,1001,err=99) iaref,txref,qref,mref,rev,smref ! read reference, mass in micro-u
1001 format(i4,a4,i4,f17.6,a2,f11.6)
mrefk = mref * xzero
c
15 read(3,1001,end=90,err=99) ia118,tx118,q118,rap,rev,srap ! read frequency ratio
if(tx118.eq.’NEW ’) go to 12 ! reset reference
if(rev.eq.’ ’) then ! if reversed freq. ratio: rev=-1
rap = rap / 1.d+6
srap = srap / 1.d+6
else
rap = 1.d+6 / rap
srap = rap*rap * srap/1.d+6
endif
coef = anint(1000.*ia118/iaref) / 1000. ! calculate 3-digit coefficient
c
prov = (ia118*1.d+0)/iaref - rap*q118/qref
membre = mref*(rap*q118/qref-coef) + mel*q118*(1-rap)
* - iaref*1.d+6*prov ! value (in micro-u) for the equation
sigmem = srap * iaref * 1.d+6 * q118/qref ! its uncertainty
write (1,1020) ia118,tx118,iaref,txref,coef,membre,sigmem
1020 format(5x,i6,a4,’-’,i4,a4,’*’,
* f6.3,’ =’, f13.3,’ (’,f9.3,’)’)
m118 = membre + coef*mref
sm118 = sqrt(sigmem**2 + (coef*smref)**2)
write (1,1030) ia118,tx118,m118,sm118
1030 format(13x,i4,a4,’ =’,f14.5,’ +/-’,f10.5,’ micro-u’)
m118 = m118 * xzero
sm118 = sm118 * xzero
write (1,1032) m118,sm118
1032 format(13x,8x,’ =’,f14.5,’ +/-’,f10.5,’ keV’,/)
c
go to 15
c
90 write (1,1990)
1990 format(1H0,’Normal End of Freq.Ratios to Equations Conversion’)
stop
99 write(1,1999)
1999 format(1H0,’Error in File Reading’)
stop
end

1332 Chinese Physics C (HEP & NP) Vol. 36
A typical frequency ratio input file
6Li +1 15122.885 .. 0.029 1st line : reference nuclide
4He +1 665392.8420 0.0077 following lines : frequency ratios
7Li +1 1166409.2053 0.0131 NEW : new set with new ref. follows
8Li +1 1333749.8620 0.0180
NEW .. column 1 : nuclidic name
7Li +1 16003.42560 0.00455 column 2 : ionic charge
10Be +1 700635.628 -1 0.009 column 3 : mass excess for ref. (micro-u)
11Be +1 636546.859 -1 0.036 or frequency ratio *10^6
NEW .. column 5 : -1 for inverse ratio
39K +4 -36293.410 .. 0.085 column 4 : uncertainty
44K +4 886306.8169 -1 0.0444
NEW ..
85Rb +9 -88210.26200 .. 0.00535
74Rb +8 979689.6094 0.0858
76Rb +8 1006067.4141 0.0223
NEW ..
85Rb +13 -88210.26200 .. 0.00535
99Sr +15 1009776.3077 0.0451
Corresponding output file
4He - 6Li * 0.667 = -7483.694 ( 0.046)
4He = 2603.27019 +/- 0.05009 micro-u
= 2424.93058 +/- 0.04665 keV
7Li - 6Li * 1.167 = -1644.991 ( 0.079)
7Li = 16003.41533 +/- 0.08558 micro-u
= 14907.08550 +/- 0.07971 keV
8Li - 6Li * 1.333 = 2327.424 ( 0.108)
8Li = 22486.22932 +/- 0.11471 micro-u
= 20945.78789 +/- 0.10685 keV
10Be - 7Li * 1.429 = -9334.156 ( 0.128)
10Be = 13534.73895 +/- 0.12850 micro-u
= 12607.52825 +/- 0.11970 keV
11Be - 7Li * 1.571 = -3479.829 ( 0.622)
11Be = 21661.55299 +/- 0.62197 micro-u
= 20177.60683 +/- 0.57936 keV
44K - 39K * 1.128 = 2529.206 ( 2.204)
44K = -38409.76074 +/- 2.20643 micro-u
= -35778.46201 +/- 2.05527 keV
74Rb - 85Rb * 0.871 = 21096.382 ( 6.483)
74Rb = -55734.75669 +/- 6.48267 micro-u
= -51916.59195 +/- 6.03857 keV
76Rb - 85Rb * 0.894 = 13930.883 ( 1.685)
76Rb = -64929.09141 +/- 1.68490 micro-u
= -60481.05966 +/- 1.56947 keV
99Sr - 85Rb * 1.165 = 35661.650 ( 4.423)
99Sr = -67103.30571 +/- 4.42327 micro-u
= -62506.32725 +/- 4.12025 keV
0Normal End of Freq.Ratios to Equations Conversion

No. 12 G. Audi et al: The AME2012 atomic mass evaluation (I). Evaluation of input data, adjustment procedures 1333
References such as 1984Sc.A, 1989Sh10 or 2003Ot.1 arelisted under “References used in the AME2012 and theNUBASE2012 evaluations”, p. 1863.
References
[1] A.H. Wapstra, G. Audi and C. Thibault, Nucl. Phys. A 729(2003) 129;http://amdc.in2p3.fr/masstables/Ame2003/Ame2003a.pdf
[2] G. Audi, A.H. Wapstra and C. Thibault, Nucl. Phys. A 729(2003) 337;http://amdc.in2p3.fr/masstables/Ame2003/Ame2003b.pdf
[3] G. Audi and A.H. Wapstra, Nucl. Phys. A 565 (1993) 1;http://amdc.in2p3.fr/masstables/Ame1993/
[4] G. Audi and A.H. Wapstra, Nucl. Phys. A 565 (1993) 66.
[5] C. Borcea, G. Audi, A.H. Wapstra and P. Favaron, Nucl.Phys. A 565 (1993) 158.
[6] G. Audi, A.H. Wapstra and M. Dedieu, Nucl. Phys. A 565(1993) 193.
[7] G. Audi and A.H. Wapstra, Nucl. Phys. A 595 (1995) 409;http://amdc.in2p3.fr/masstables/Ame1995/
[8] The AME2012 files in the electronic distribution andcomplementary documents can be retrieved from theAtomic Mass Data Center (AMDC) through the Web:http://amdc.in2p3.fr/ and http://amdc.impcas.ac.cn/
[9] G. Audi, O. Bersillon, J. Blachot and A.H. Wapstra, Nucl.Phys. A 624 (1997) 1;http://amdc.in2p3.fr/nubase/nubase97.pdf
[10] A.H. Wapstra and K. Bos, At. Nucl. Data Tables 20 (1977)1.
[11] J.C. Hardy, L.C. Carraz, B. Jonson and P.G. Hansen, Phys.Lett. B71 (1977) 307.
[12] K.-N. Huang, M. Aoyagi, M.H. Chen, B. Crasemann andH. Mark, At. Nucl. Data Tables 18 (1976) 243.
[13] P.J. Mohr, B.N. Taylor and David B. Newell,http://arxiv.org/pdf/1203.5425
[14] T.P. Kohman, J.H.E. Mattauch and A.H. Wapstra, J. deChimie Physique 55 (1958) 393.
[15] John Dalton, 1766-1844, who first speculated that ele-ments combine in proportions following simple laws, andwas the first to create a table of (very approximate) atomicweights.
[16] E.R. Cohen and A.H. Wapstra, Nucl. Instrum. Methods211 (1983) 153.
[17] E.R. Cohen and B.N. Taylor, CODATA Bull. 63 (1986),Rev. Mod. Phys. 59 (1987) 1121.
[18] T.J. Quin, Metrologia 26 (1989) 69;B.N. Taylor and T.J. Witt, Metrologia 26 (1989) 47.
[19] P.J. Mohr and B.N. Taylor, J. Phys. Chem. Ref. Data 28(1999) 1713.
[20] A. Rytz, At. Nucl. Data Tables 47 (1991) 205.
[21] A.H. Wapstra, Nucl. Instrum. Methods A292 (1990) 671.
[22] http://amdc.in2p3.fr/masstables/Ame2003/recalib
[23] R.G. Helmer and C. van der Leun, Nucl. Instrum. Methods422 (1999) 525.
[24] Nuclear Data Sheets.
[25] M.L. Roush, L.A. West and J.B. Marion, Nucl. Phys. A147(1970) 235.
[26] P.M. Endt, C.A. Alderliesten, F. Zijderhand, A.A. Woltersand A.G.M. van Hees, Nucl. Phys. A510 (1990) 209.
[27] D.P. Stoker, P.H. Barker, H. Naylor, R.E. White andW.B. Wood, Nucl. Instrum. Methods 180 (1981) 515.
[28] A.H. Wapstra, unpublished.
[29] G. Audi, M. Epherre, C. Thibault, A.H. Wapstra andK. Bos, Nucl. Phys. A378 (1982) 443.
[30] G. Audi, Hyperfine Interactions 132 (2001) 7; Ecole Inter-nationale Joliot-Curie 2000, Spa, p.103;http://amdc.in2p3.fr/masstables/hal.pdf
[31] Systematic errors are those due to instrumental drifts orinstrumental fluctuations, that are beyond control and arenot accounted for in the error budget. They might showup in the calibration process, or when the measurement isrepeated under different experimental conditions. The ex-perimentalist adds then quadratically a systematic error tothe statistical and the calibration ones, in such a way as tohave consistency of his data. If not completely accountedfor or not seen in that experiment, they can still be ob-served by the mass evaluators when considering the massadjustment as a whole.
[32] C.F. von Weizsacker, Z. Phys. 96 (1935) 431;H.A. Bethe and R.F. Bacher, Rev. Mod. Phys. 8 (1936) 82.
[33] C. Borcea and G. Audi, Rev. Roum. Phys. 38 (1993) 455;CSNSM Report 92-38, Orsay 1992:http://amdc.in2p3.fr/extrapolations/bernex.pdf
[34] A.H. Wapstra, G. Audi and R. Hoekstra, Nucl. Phys. A432(1985) 185.
[35] D. Lunney, J.M. Pearson and C. Thibault, Rev. Mod. Phys.75 (2003) 1021.
[36] R.G. Thomas, Phys. Rev. 80 (1950) 136, 88 (1952) 1109;J.B. Ehrman, Phys. Rev. 81 (1951) 412.
[37] E. Comay, I. Kelson and A. Zidon, Phys. Lett. B210 (1988)31.

1334 Chinese Physics C (HEP & NP) Vol. 36
[38] M.C. Pyle, A. Garcıa, E. Tatar, J. Cox, B.K. Nayak,S. Triambak, B. Laughman, A. Komives, L.O. Lamm,J.E. Rolon, T. Finnessy, L.D. Knutson and P.A. Voytas,Phys. Rev. Lett. B88 (2002) 122501.
[39] A.H. Wapstra, Proc. Conf. Nucl. Far From Stabil-ity/AMCO9, Bernkastel-Kues 1992, Inst. Phys. Conf. Se-ries 132 (1993) 125.
[40] M.S. Antony, J. Britz, J.B. Bueb and A. Pape, At. Nucl.Data Tables 33 (1985) 447;M.S. Antony, J. Britz and A. Pape, At. Nucl. Data Tables34 (1985) 279;A. Pape and M.S. Antony, At. Nucl. Data Tables 39 (1988)201;M.S. Antony, J. Britz and A. Pape, At. Nucl. Data Tables40 (1988) 9.
[41] J. Janecke, in D.H. Wilkinson, ‘Isospin in NuclearPhysics’, North Holland Publ. Cy. (1969) eq. 8.97;J. Janecke, Nucl. Phys. 61 (1965) 326.
[42] L. Axelsson, J. Aysto, U.C. Bergmann, M.J.G. Borge,L.M. Fraile, H.O.U. Fynbo, A. Honkanen, P. Hornshøj,A. Jonkinen, B. Jonson, I. Martel, I. Mukha, T. Nils-son, G. Nyman, B. Petersen, K. Riisager, M.H. Smedberg,O. Tengblad and ISOLDE, Nucl. Phys. A628 (1998) 345.
[43] Y.V. Linnik, Method of Least Squares (Pergamon, NewYork, 1961); Methode des Moindres Carres (Dunod, Paris,1963).
[44] G. Audi, W.G. Davies and G.E. Lee-Whiting, Nucl. In-strum. Methods A249 (1986) 443.
[45] Particle Data Group, ‘Review of Particle Properties’, Phys.Rev. D66 (2002) 10001.
[46] M.U. Rajput and T.D. Mac Mahon, Nucl. Instrum. Meth-ods A312 (1992) 289.
[47] M.J. Woods and A.S. Munster, NPL Report RS(EXT)95(1988).
[48] G. Audi, Int. J. Mass Spectr. 251 (2006) 85-94;http://dx.doi.org/10.1016/j.ijms.2006.01.048
[49] G. Bollen, H.-J. Kluge, M. Konig, T. Otto, G. Savard,H. Stolzenberg, R.B. Moore, G. Rouleau and G. AudiPhys. Rev. C46 (1992) R2140.
[50] Each group of mass-spectrometric data is assigned a fac-tor F according to its partial consistency factor χ
pn , due
to the fact that its statistical uncertainties and its internalsystematic error alone do not reflect the real experimentalsituation. From comparison to all other data and more spe-cially to combination of reaction and decay energy mea-surements, we have assigned factors F of 1.5, 2.5 or 4.0to the different labs. Only Penning trap data have almostall been assigned a factor F = 1.0. Example: the groupof data H25 has been assigned F = 2.5, this means thatthe total uncertainty assigned to 155Gd 35Cl−153Eu 37Clis 2.4µu× 2.5. The weight of this piece of data is thenvery low, compared to 0.79µu derived from all other data.This is why it is labelled ”U”.
[51] A. Gillibert, L. Bianchi, A. Cunsolo, A. Foti, J. Gaste-bois, Ch. Gregoire, W. Mittig, A. Peghaire, Y. Schutz andC. Stephan, Phys. Lett. B176 (1986) 317.
[52] D.J. Vieira, J.M. Wouters, K. Vaziri, R.H. Krauss, Jr.,H. Wollnik, G.W. Butler, F.K. Wohn and A.H. Wapstra,Phys. Rev. Lett. 57 (1986) 3253.
[53] E.P. Wigner, in Proceedings of the Robert A. WelchFoundation Conference on Chemical Research, edited byW.0. Milligan (Welch Foundation, Houston, 1958), Vol. 1,p. 88.
[54] A.M. Lane, in D.H. Wilkinson, ‘Isospin in NuclearPhysics’, North Holland Publ. Cy. (1969), p. 509
[55] W. Bambynek, H. Behrens, M.H. Chen, B. Crasemann,M.L. Fitzpatrick, K.W.D. Ledingham, H. Genz, M. Mut-terrer and R.L. Intemann, Rev. Mod. Phys. 49 (1977) 77.
[56] G. Audi, M. Wang, A.H. Wapstra, B. Pfeiffer andF.G. Kondev, J. Korean Phys. Soc. 59 (2011) 1318-1321.
[57] Commission on Nomenclature of Inorganic Chemistry,Pure and Applied Chemistry 69 (1997) 2471.
[58] S. Cwiok, S. Hofmann and W. Nazarewicz, Nucl. Phys.A573 (1994) 356;S. Cwiok, W. Nazarewicz and P.H. Heenen, Phys. Rev.Lett. 63 (1999) 1108.
[59] S. Aoyama, Phys. Rev. Lett. 89 (2002) 052501.
[60] L.V. Grigorenko and M.V. Zhukov, Phys. Rev. C77 (2008)034611.