the alta group global developments in the equipment leasing and financing industry first latin...
Post on 22-Dec-2015
214 views
TRANSCRIPT

The Alta Group
Global developments in the Equipment Leasing and Financing
Industry
First Latin American Leadership Meeting of the Leasing Industry

The Alta Group - 2
How does the World Look Like?
Back to Table of Contents

The Alta Group - 3
How does the World Look Like?
CHINA
INDIA
USA
REST OFTHE WORLD
INDONESIA
BRAZIL
PAKISTAN
POPULATION:While the US holds 5% of the World’s population, China (20%), India (17%), Brazil (3%) and Russia (2%) host 42% of the global inhabitants Europe altogether hosts only 11%, and declines
BANGLADESH
RUSSIA
NIGERIA
JAPAN
Back to Table of Contents

The Alta Group - 4
How does the World Look Like?REAL GDP:While the US holds 21% of the World’s GDP, China produces 13%, India (6%), Brazil (3%) and Russia (3%).The EU produces 15%.80% of global GDP is currently produced by 20 countries
USA
CHINA
JAPANIND
IA
GE
RM
AN
Y
UK
FR
AN
CE
ITA
LY
BR
AZ
ILR
US
SIA
REST OFTHE WORLD
Back to Table of Contents
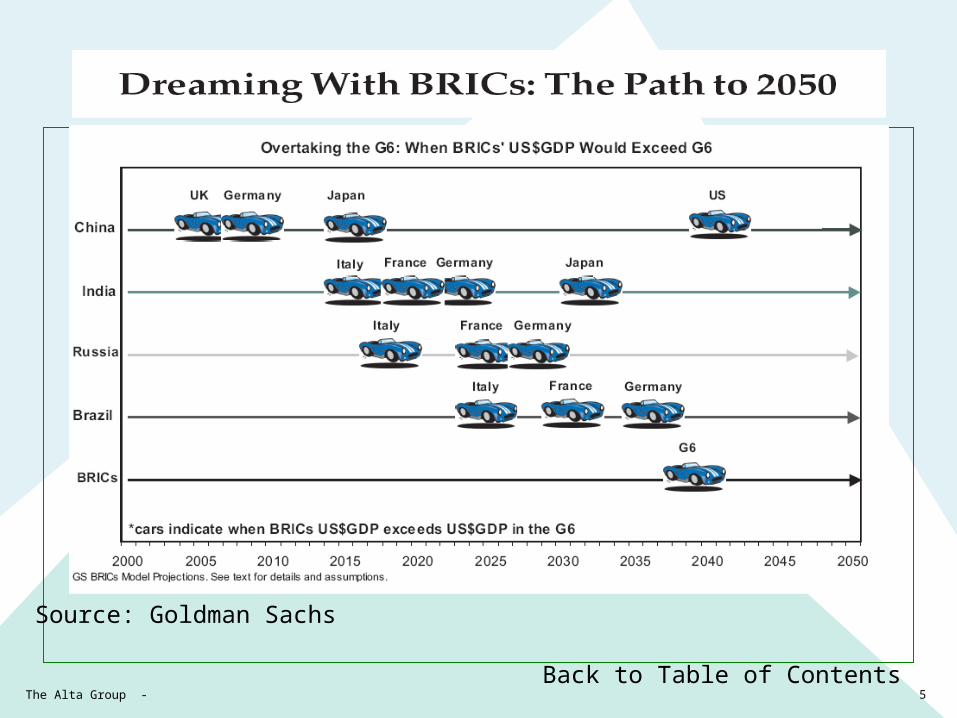
The Alta Group - 5
Source: Goldman Sachs
Back to Table of Contents

The Alta Group - 6
Demographics: Purchasing Power
ASIA PACIFIC
Back to Table of Contents
And the winners are:•China•Japan•India•Korea•Indonesia•Australia•Thailand
LATIN AMERICA
…the winners are:•Brazil•Mexico•Argentina•Colombia•Chile•Venezuela
AFRICA
The winners are:• South Africa• Egypt• Algeria• Nigeria• Morocco• Tunisia
MIDDLE EAST• Iran• Saudi Arabia• Israel• United Arab Emirates• Syria• Kuwait
Go to Statistics

The Alta Group - 7Back to Table of Contents
RANKING EUROPE ASIA PACIFIC AMERICAS MIDDLE EAST AFRICA
1 Norway (5) New Zealand (1) United States (3) Israel (29) Mauritius (23)2 Denmark (8) Singapore (2) Canada (4) Saudi Arabia (38) South Africa (28)3 United Kingdom (9) Australia (6) Puerto Rico (22) Kuwait (47) Namibia (33)4 Ireland (11) Hong Kong, China (7) Chile (25) Oman (51) Botswana (40)5 Iceland (12) Japan (10) Jamaica (43) United Arab Emirates (69) Zambia (67)6 Finland (13) Thailand (20) Panama (57) Jordan (74) Kenya (68)7 Sweden (14) Malaysia (21) Nicaragua (59) Yemen (90) Uganda (72)8 Lithuania (15) Korea (27) Colombia (66) Lebanon (95) Ghana (82)9 Estonia (16) Maldives (31) Peru (71) Iran (108) Moldova (83)
10 Switzerland (17) Fiji (34) Mexico (73) Iraq (114) Nigeria (94)11 Belgium (18) Taiwan, China (35) El Salvador (76) Syria (121) Ethiopia (101)12 Germany (19) Tonga (36) Argentina (77) West Bank and Gaza (125) Morocco (102)13 Netherlands (24) Samoa (39) Uruguay (85) Mozambique (110)14 Latvia (26) Kiribati (45) Paraguay (88) São Tomé and Príncipe (123)15 Spain (30) Armenia (46) Costa Rica (89) Zimbabwe (126)
Missing:
Russia ChinaIndia
Brazil
Go to Global Ranking
Regional Ranking for easiness to do business in…
Alta selected the top 15 of each region (where available)

The Alta Group - 8
What is happening in Europe?
•In 2005, Europe originated more leasing volume than the US (€262.9 billion)•Leaseurope’s new leasing business amounts to 2.37% of GDP and the leasing penetration rate, measured as the amount of investment financed by leasing during the year, rose to 15.94%.• New leasing business grew by almost 14%, far exceeding expectations.• The portfolio of leased assets in the hands of European leasing companies represented via Leaseurope’s members amounted to approximately 600 billion euros at the end of 2005.
Back to Table of Contents

The Alta Group - 9
What is happening in Europe?
Source: Leaseurope
Back to Table of Contents
COUNTRY 2005 %GERMANY 133,200.00 22%GREAT BRITAIN 121,033.93 20%ITALY 100,000.00 17%FRANCE 73,144.00 12%SPAIN 35,364.30 6%AUSTRIA 21,184.53 4%PORTUGAL 11,702.31 2%SWEDEN 10,756.61 2%HUNGARY 10,480.75 2%SWITZERLAND 9,859.63 2%NETHERLANDS 9,838.70 2%GREECE 9,688.00 2%BELGIUM 8,846.67 1%CZECH REPUBLIC 8,400.85 1%DENMARK 7,490.43 1%NORWAY 7,076.61 1%FINLAND 5,497.00 1%POLAND 4,965.80 1%SLOVAKIA 3,757.33 1%SLOVENIA 2,196.50 0%ESTONIA 1,850.11 0%ROMANIA 1,692.97 0%MORROCCO 1,463.27 0%BULGARY 489.61 0%BOSNIA & HERCEGOVINA 141.88 0%RUSSIA N.A. TOTAL 600,121.79

The Alta Group - 10
What is happening in Latin America?
• The Leasing Industry in Latin America grew over 55%, and represents total assets of US$ 26.3 billion.
• In Mexico, the law was reformed to enable lessors to engage in multiple financial services (Consumer lending, factoring and other- SOFOMEs), without Government regulation;
• In Brazil, strong association but consolidation is happening (Bradesco buying American Express and Itau buying BankBoston portfolio GE Capital sold its leasing portfolio in 2005);
• Chile: Banks absorbing leasing subs. Risk of corporate schizophrenia;
• Colombia: Consolidation among Banks;
• Argentina: Banks also dominating the landscape
• Central America: CAFTA and consolidation around banks. GE, Scotiabank and HSBC investing Map Source: AON
Back to Table of Contents
The Alta Group - 11
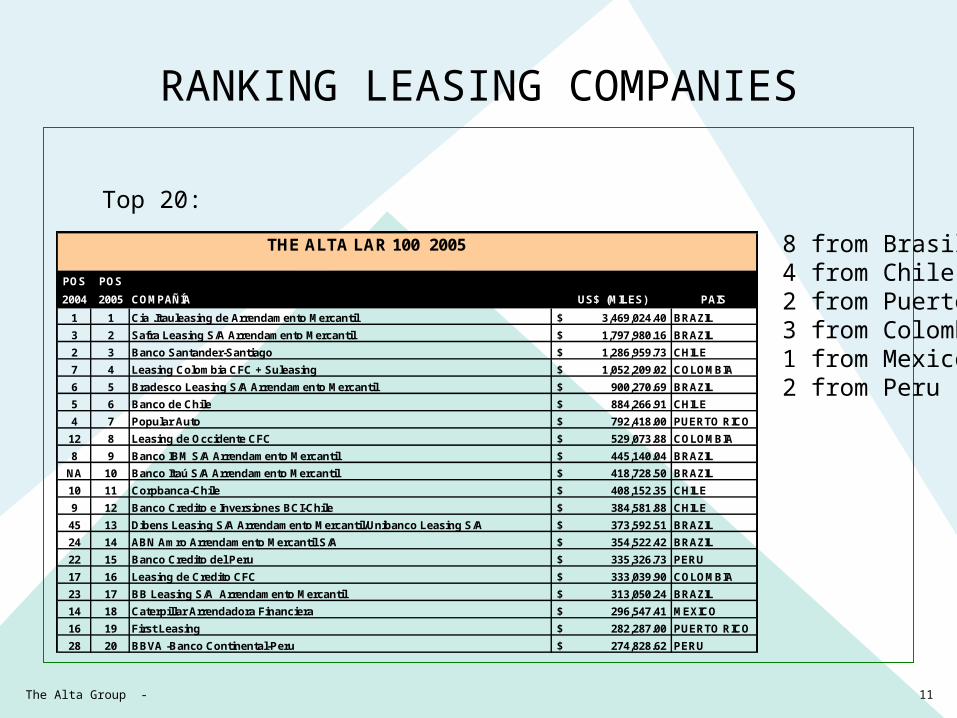
Top 20:
8 from Brasil;4 from Chile;2 from Puerto Rico;3 from Colombia;1 from Mexico;2 from Peru
RANKING LEASING COMPANIES
THE ALTA LAR 100 2005
POS POS
2004 2005 COMPAÑÍA US$ (MILES) PAIS
1 1 Cia .Itauleasing de Arrendamento Mercantil 3,469,024.40$ BRAZIL
3 2 Safra Leasing S/A Arrendamento Mercantil 1,797,980.16$ BRAZIL
2 3 Banco Santander-Santiago 1,286,959.73$ CHILE
7 4 Leasing Colombia CFC + Suleasing 1,052,209.02$ COLOMBIA
6 5 Bradesco Leasing S/A Arrendamento Mercantil 900,270.69$ BRAZIL
5 6 Banco de Chile 884,266.91$ CHILE
4 7 Popular Auto 792,418.00$ PUERTO RICO
12 8 Leasing de Occidente CFC 529,073.88$ COLOMBIA
8 9 Banco IBM S/A Arrendamento Mercantil 445,140.04$ BRAZIL
NA 10 Banco Itaú S/A Arrendamento Mercantil 418,728.50$ BRAZIL
10 11 Corpbanca-Chile 408,152.35$ CHILE
9 12 Banco Credito e Inversiones BCI-Chile 384,581.88$ CHILE
45 13 Dibens Leasing S/A Arrendamento Mercantil/Unibanco Leasing S/A 373,592.51$ BRAZIL
24 14 ABN Amro Arrendamento Mercantil S/A 354,522.42$ BRAZIL
22 15 Banco Credito del Peru 335,326.73$ PERU
17 16 Leasing de Credito CFC 333,039.90$ COLOMBIA
23 17 BB Leasing S/A Arrendamento Mercantil 313,050.24$ BRAZIL
14 18 Caterpillar Arrendadora Financiera 296,547.41$ MEXICO
16 19 First Leasing 282,287.00$ PUERTO RICO
28 20 BBVA -Banco Continental-Peru 274,828.62$ PERU

The Alta Group - 12
HALLAZGOS POR PAÍS
POS. PAIS ACTIVOS(US$000) %
1 Brasil 10,213,311.24$ 44%
2 Chile 4,243,939.53$ 18%
3 Mexico 2,677,088.70$ 12%
4 Colombia 2,670,007.28$ 12%
5 Peru 1,460,583.79$ 6%
6 Puerto Rico 1,193,429.00$ 5%
7 Argentina 450,353.89$ 2%
8 Costa Rica 158,433.97$ 1%
9 Honduras 99,437.73$ 0%
10 Rep. Dominicana 30,814.99$ 0%
11 Bolivia 18,631.94$ 0%
23,216,032.07$ 100%
2005 RANKING POR ACTIVOS EN LEASING
TOTAL REPORTADO
Pos. Pais ?%
1 Argentina 97.84%
2 Brasil 95.81%
3 Mexico 54.64%
4 Colombia 54.05%
5 Puerto Rico 40.36%
6 Costa Rica 28.68%
7 Chile 28.11%
8 Bolivia 4.54%
9 Peru 4.30%
10 Honduras -1.09%
Crecimiento Porcentual por Paises

The Alta Group - 13
PRESENCIA DE MULTINACIONALES
POS COMPAÑIA TOTAL ACTIVOS REPORTADOS PAISES DONDE OPERA
1 SANTANDER 1,296,187.25$ CHILE, BRASIL, ARGENTINA
2 BBVA 784,986.16$ CHILE, BRASIL, ARGENTINA
3 IBM 457,629.04$ BRASIL, PUERTO RICO (Faltan datos de Colombia, Mexico y Centroamerica)
4 BANK OF AMERICA (fka BankBoston) 384,152.85$ BRASIL, CHILE, ARGENTINA
5 CITIBANK 360,337.49$ MEXICO, BRASIL, COLOMBIA, PERU, ARGENTINA
6 ABN AMRO 354,522.42$ BRASIL
7 CATERPILLAR FINANCIAL 351,221.54$ MEXICO, BRASIL (Faltan datos de Chile y Centroamerica)
8 CIT 323,750.65$ MEXICO, BRASIL, COLOMBIA, CHILE
9 HSBC 258,418.16$ BRASIL, ARGENTINA
10 GE COMMERCIAL FINANCE 229,906.96$ MEXICO (Liquido portafolios de leasing en Brasil y Puerto Rico)
11 HP FINANCIAL SERVICES 190,209.33$ BRASIL (Datos no disponibles para Mexico, Argentina y Chile)
12 CSI 111,093.22$ MEXICO, BRASIL, CENTROAMERICA
13 JOHN DEERE CREDIT CO. 99,303.09$ MEXICO, ARGENTINA
14 SCOTIABANK 52,945.38$ COSTA RICA, CHILE
15 GMAC 30,934.54$ COLOMBIA

The Alta Group - 14
What is happening in Africa?
• South Africa has a solid leasing industry dominated by 4 Banks;
• Egypt is growing its leasing industry since the 1995 Leasing Law. Average annual originations: US$ 285 M/year;
• Sub-Saharan Africa is joining the leasing league, procuring for best practices and for investment promotion in their countries. To highlight: Tanzania, Ghana, Madagascar, RDC, Nigeria…
Map Source: AON
Back to Table of Contents

The Alta Group - 15
What is happening in Asia?
• China Leasing Industry: Continuous growth, Leasing Law in process, Foreigners coming blindly. Expect surprises…
• Japan: Mature leasing industry, with weak regulatory framework (?), penetration of 9% of total investment. IT represents 35% of originations;
• India: Growth impaired by an hostile Tax Legislation and funding restrictions;
• Korea: Mature and consolidating players in the industry recovering from the 1998 crisis;
• Australia: Solid Leasing industry• Malaysia, Thailand, Indonesia
and other countries are in the build-up phases.
Map Source: AON
Back to Table of Contents

The Alta Group - 16
What is happening in the Middle East?
• Saudi Arabia, Kuwait, UAE, Bahrain all regulate leasing based upon Sharia Law, on the « Ijara » foundation. Leasing is emerging since 2000 and growing;
• Kuwait lease receivables exceed US$ 2 billion (6 companies);
• Israel leasing industry is highly concentrated in car leasing and financing
• Iran: Emerging leasing industry with investment of IFC (2002). Mostly controlled by State owned Banks
Map Source: AON
Back to Table of Contents