the air quality improvement measures in seoul metropolitan ... · the air quality improvement...
TRANSCRIPT

6th High Level Seminar on Environmentally Sustainable Cities
The Air Quality Improvement Measures in Seoul Metropolitan Area
Ministry of Environment, Republic of Korea
6TH High Level Seminar Environmentally Sustainable CitiesFeb.9-10, 2015, Malaysia
6th High Level Seminar on Environmentally Sustainable Cities 2
Contents
Air Quality Status in Seoul Metropolitan Area
Master Plans for the Metropolitan Air Quality Management
Implementation Measures
Achievements

6th High Level Seminar on Environmentally Sustainable Cities
Air Quality Status in Seoul Metropolitan AreaI.
1. Seoul Metropolitan Area(SMA) 2. Air Pollution status in SMA
• SMA is the highest density area in Korea- 47% of the total population and
automobiles are concentrated in theSMA(only 11% of territory of Korea)
• People density : 17000/km3
• Automobiles: 8.6million• Energy consumption: 5,6 million TOE/year
IncheonSeoulGyeonggi-do • SMA was more serious than Non-SMA
Comparison of air pollution in the SMA and Non-SMA
Annual average in 2003
NO2(ppb) PM10( µg/m3 )
SMA 34(38) 65(69)
Non-SMA 22 53
* () : the number for Seoul
Portion of pollutant emissions in 2003Areas CO NOX SOX PM10 VOC
SMA 11 44.4 31.9 14.2 25.5 38.9
Non-SMA 89 55.6 68.1 85.8 74.5 61.1
Trend of pollutant emissions in the SMA
Emission ofPollutants isIncreasingexcept for SOx.
3
Unit: %
6th High Level Seminar on Environmentally Sustainable Cities
I.
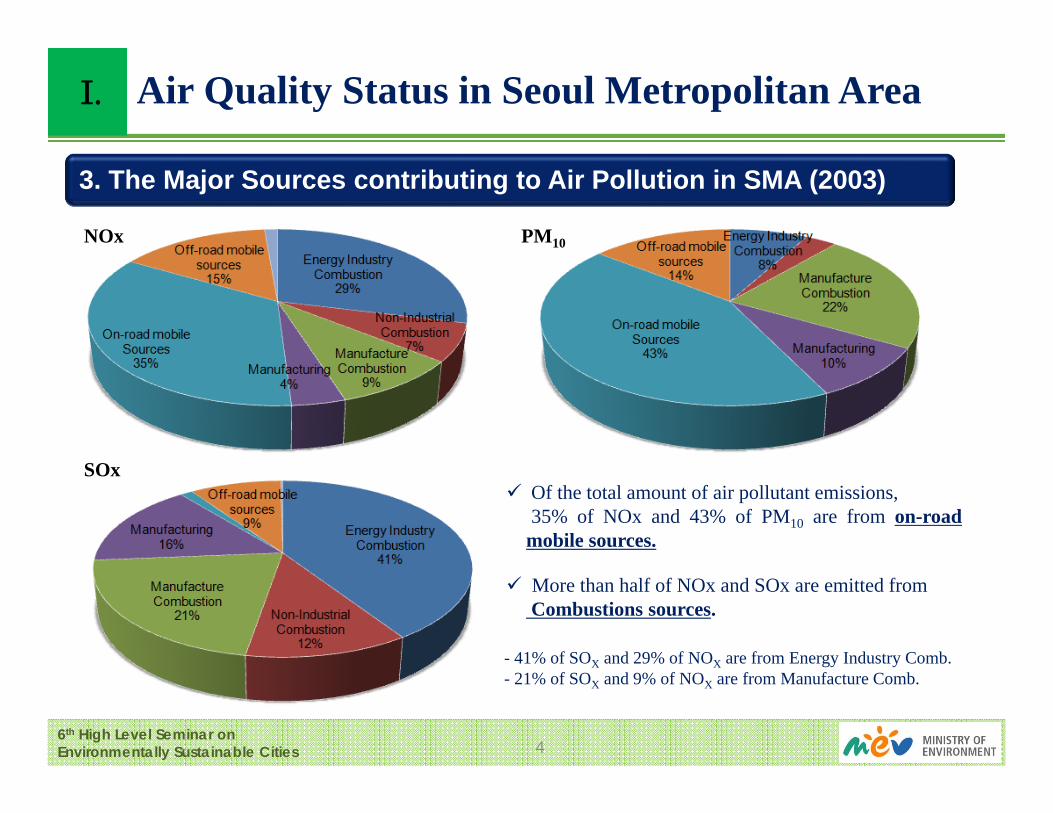
NOx PM10
SOx Of the total amount of air pollutant emissions,
35% of NOx and 43% of PM10 are from on-roadmobile sources.
More than half of NOx and SOx are emitted from Combustions sources.
- 41% of SOX and 29% of NOX are from Energy Industry Comb.- 21% of SOX and 9% of NOX are from Manufacture Comb.
3. The Major Sources contributing to Air Pollution in SMA (2003)
4
Air Quality Status in Seoul Metropolitan Area

6th High Level Seminar on Environmentally Sustainable Cities
Master Plans for the Metropolitan Air Quality ManagementII.
• Adopted in 2003• Implementation
Period : 2005-2014
“Special Act on Seoul Metropolitan Air Quality Improvement”
• Objectives- To Improve the air
quality in SMA to thestandards of cities inthe developed world.
• Needed EmissionReduction (’01 ’14)
- 38.7% of PM 10- 53% of NOX - 38.7% of SOX- 38.7% VOCs
5

6th High Level Seminar on Environmentally Sustainable Cities
50% of PM10 and 20% of NOxreduced from Mobile Sources.
Implementation MeasuresIII.
Measures for Mobile Sources
6
• Adopted Stricter standards for vehicles
Diesel : Euro 5 (2009)( * Beginning with Euro 6 in 2015) Petrol • Natural gas: ULEV (2009)Non-road:
Tier-1(2004), Tier-2(2005), Tier-3(2009)
• Replace Zero-Emission Vehicles
• Refuel Cleaner Fuels- Set Stricter SOx Limit in Fuel
2006 2009
Gasoline 50 10
Diesel 30 10
LPG 100 40
• Retrofit Emission Filters/ CatalystsSupplied 300,000 Vehicles
• 89% of Diesel Buses in SMA has been replaced to ULEV
Supplied 14,000Vehicles
Unit: ppm
6th High Level Seminar on Environmentally Sustainable Cities
Implementation MeasuresIII.
Measures for Stationary Sources (Cap and Trading program )
7
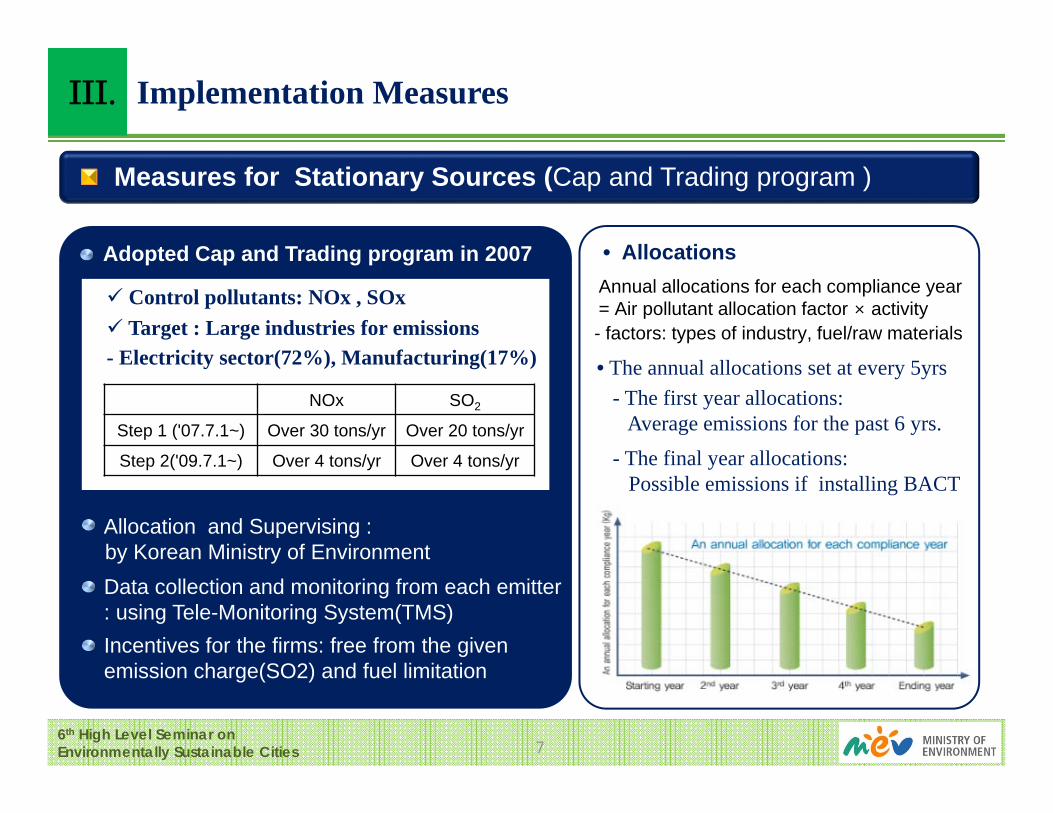
• Adopted Cap and Trading program in 2007
Target : Large industries for emissions Control pollutants: NOx , SOx
NOx SO2
Step 1 ('07.7.1~) Over 30 tons/yr Over 20 tons/yr
Step 2('09.7.1~) Over 4 tons/yr Over 4 tons/yr
• Allocations
Allocation and Supervising : by Korean Ministry of Environment Data collection and monitoring from each emitter: using Tele-Monitoring System(TMS)Incentives for the firms: free from the given emission charge(SO2) and fuel limitation
• The annual allocations set at every 5yrs- The first year allocations:
Average emissions for the past 6 yrs.- The final year allocations:
Possible emissions if installing BACT
- Electricity sector(72%), Manufacturing(17%)
Annual allocations for each compliance year= Air pollutant allocation factor × activity- factors: types of industry, fuel/raw materials

6th High Level Seminar on Environmentally Sustainable Cities
Implementation MeasuresIII.
Measures for Stationary Sources (Cap and Trading program)
8
43% of NOx and 14% of SOxemissions are reduced by the Cap and Trade system.
• Management • Tools Penalty : Charge for excess emissions Control :
- Can use the unused permit for the next year- Can trade to other firms(No limitation for trade amount)
The Emission Management System - www. n-sky.or.kr The Emission Trade System
- www. emissiontrade.go.kr
6th High Level Seminar on Environmentally Sustainable Cities
AchievementsIV.
Improvement of air quality in metropolitan area
9
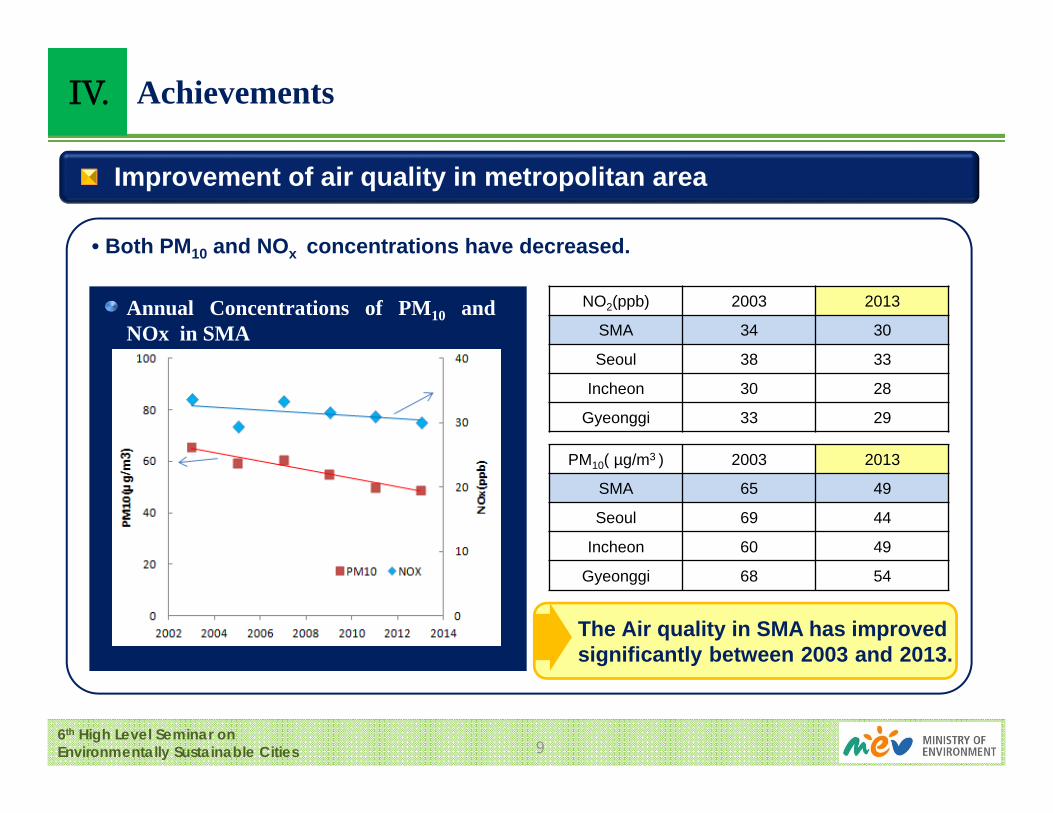
• Both PM10 and NOx concentrations have decreased.
• Annual Concentrations of PM10 andNOx in SMA
NO2(ppb) 2003 2013
SMA 34 30
Seoul 38 33
Incheon 30 28
Gyeonggi 33 29
PM10( µg/m3 ) 2003 2013
SMA 65 49
Seoul 69 44
Incheon 60 49
Gyeonggi 68 54
• The Air quality in SMA has improvedsignificantly between 2003 and 2013.


6th High Level Seminar on Environmentally Sustainable Cities 11
6th High Level Seminar on Environmentally Sustainable Cities 12
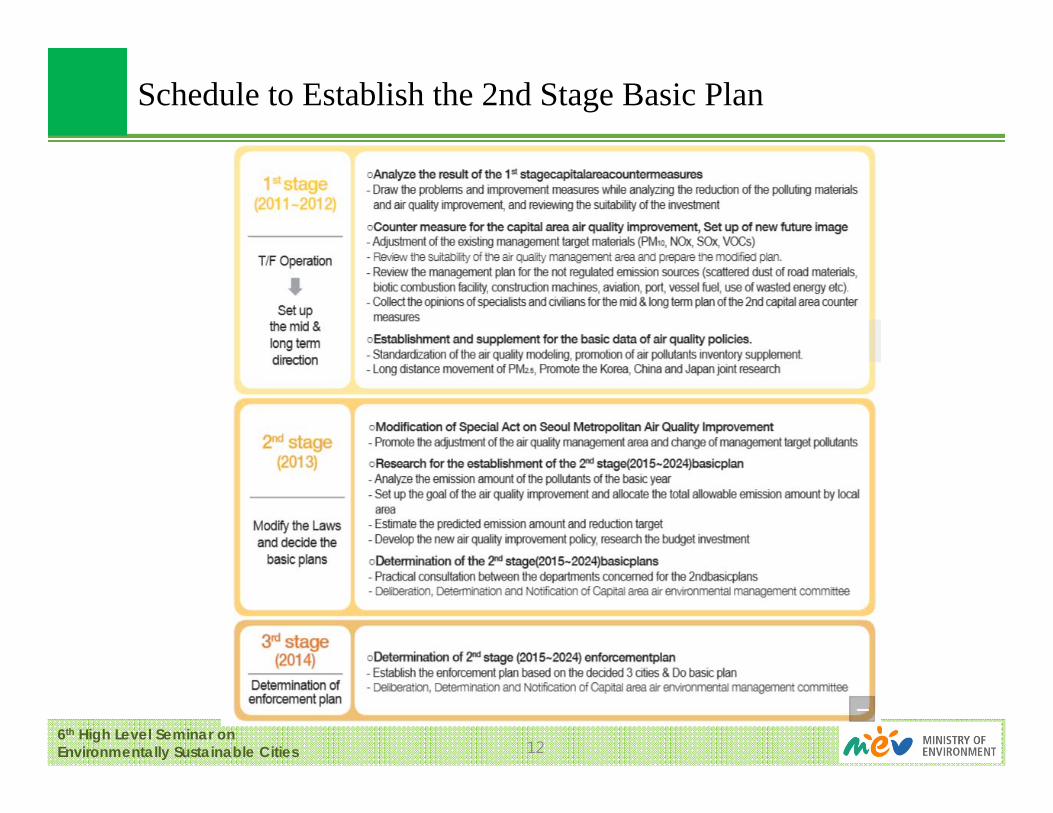
Schedule to Establish the 2nd Stage Basic Plan
6th High Level Seminar on Environmentally Sustainable Cities
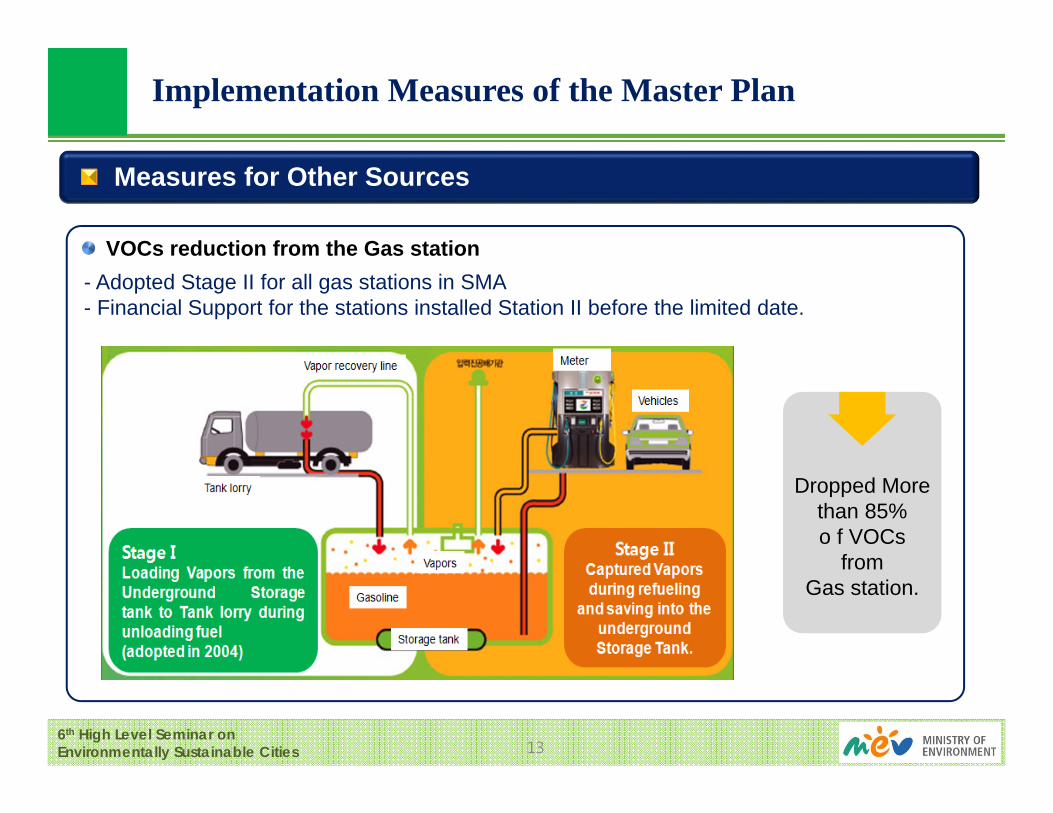
• VOCs reduction from the Gas station
Implementation Measures of the Master Plan
Measures for Other Sources
13
- Adopted Stage II for all gas stations in SMA - Financial Support for the stations installed Station II before the limited date.
Dropped More than 85%o f VOCs
from Gas station.