the agency group australia ltd · the agency group australia ltd (the agency group or the company)...
TRANSCRIPT
September 2018
April 2019
The Agency Group Australia LtdASX:AU1

Contents
Introduction 3
Real estate market 6
Company overview and business model 7
Key assets 10
Financials and operational metrics – LTM 11
Key management 13
2
Executive summary
Notes: (1) Company figures include Illawarra region acquisition. (2) Value of properties exchanged in the LTM to March 2019. (3) Properties Under Management (“PUM”) (4) Gross Commission Income (“GCI”) (5) Calculated on a blended valuation multiple of 3.5x on annualised management fee calculated from March 2019 quarterly management fee. (6) Calculated on a valuation multiple of 2.4x on annualised trail income calculated from March 2019 monthly trail income.
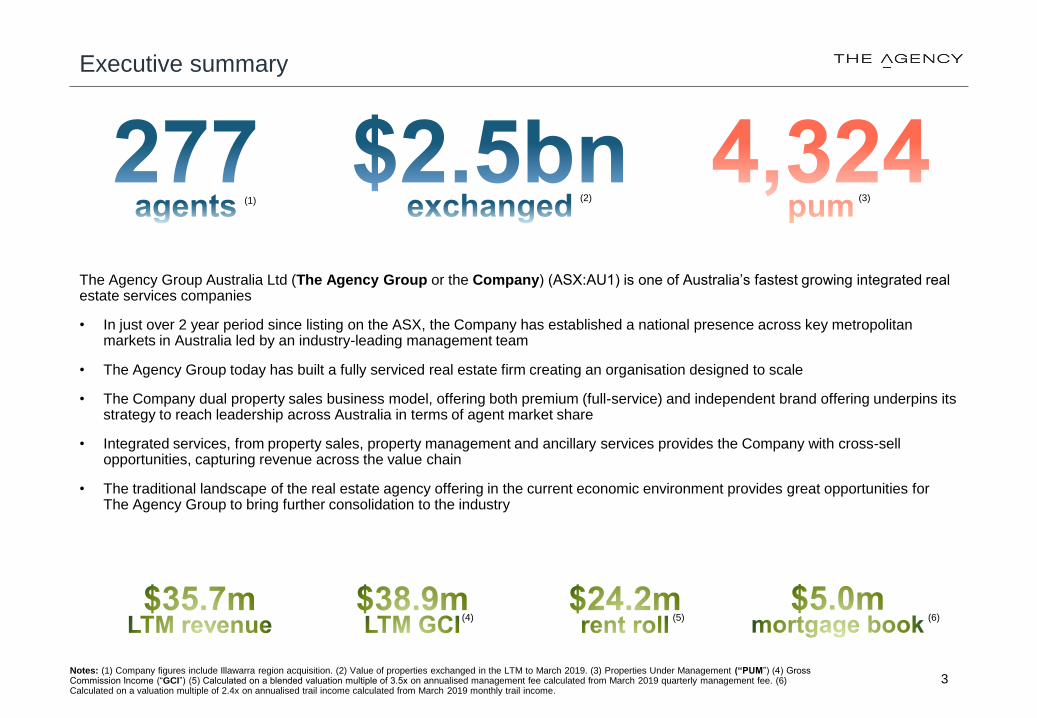
The Agency Group Australia Ltd (The Agency Group or the Company) (ASX:AU1) is one of Australia’s fastest growing integrated real estate services companies
• In just over 2 year period since listing on the ASX, the Company has established a national presence across key metropolitan markets in Australia led by an industry-leading management team
• The Agency Group today has built a fully serviced real estate firm creating an organisation designed to scale
• The Company dual property sales business model, offering both premium (full-service) and independent brand offering underpins its strategy to reach leadership across Australia in terms of agent market share
• Integrated services, from property sales, property management and ancillary services provides the Company with cross-sell opportunities, capturing revenue across the value chain
• The traditional landscape of the real estate agency offering in the current economic environment provides great opportunities for The Agency Group to bring further consolidation to the industry
3
(2)(1)
(4) (5)
(3)
(6)
Unique business model
4
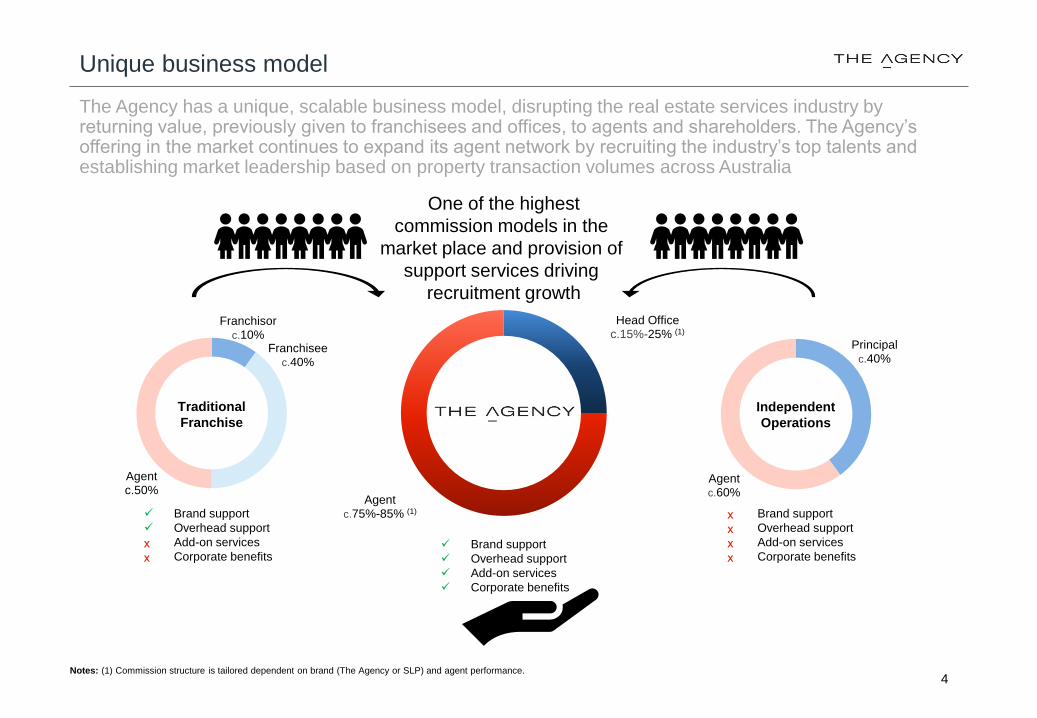
The Agency has a unique, scalable business model, disrupting the real estate services industry by returning value, previously given to franchisees and offices, to agents and shareholders. The Agency’s offering in the market continues to expand its agent network by recruiting the industry’s top talents and establishing market leadership based on property transaction volumes across Australia
Franchisorc.10%
Franchiseec.40%
Agentc.50%
Traditional
Franchise
Independent
Operations
Principalc.40%
Agentc.60%
✓ Brand support
✓ Overhead support
✓ Add-on services
✓ Corporate benefits
✓ Brand support
✓ Overhead support
ₓ Add-on services
ₓ Corporate benefits
ₓ Brand support
ₓ Overhead support
ₓ Add-on services
ₓ Corporate benefits
One of the highest
commission models in the
market place and provision of
support services driving
recruitment growth
Head Officec.15%-25% (1)
Agentc.75%-85% (1)
Notes: (1) Commission structure is tailored dependent on brand (The Agency or SLP) and agent performance.
Accelerating national presence
5
The Agency Bondi Junction
17-25 Spring Street
Bondi Junction NSW 2022
The Agency Gold Coast
Suite 301, The Wave, 89-91 Surf Parade
Broadbeach QLD 4218
The Agency Eastern Suburbs
180 Campbell Parade
Bondi Beach NSW 2026
The Agency Inner West
103 Johnston Street
Annandale NSW 2038
The Agency Albert Park
89 Victoria Avenue
Albert Park VIC 3206The Agency Neutral Bay
Level 1, 3 Young Street
Neutral Bay NSW 2089
The Agency Wollongong
2/63 Burelli Street
Wollongong NSW 2500
The Agency Perth
68 Milligan Street
Perth WA 6000
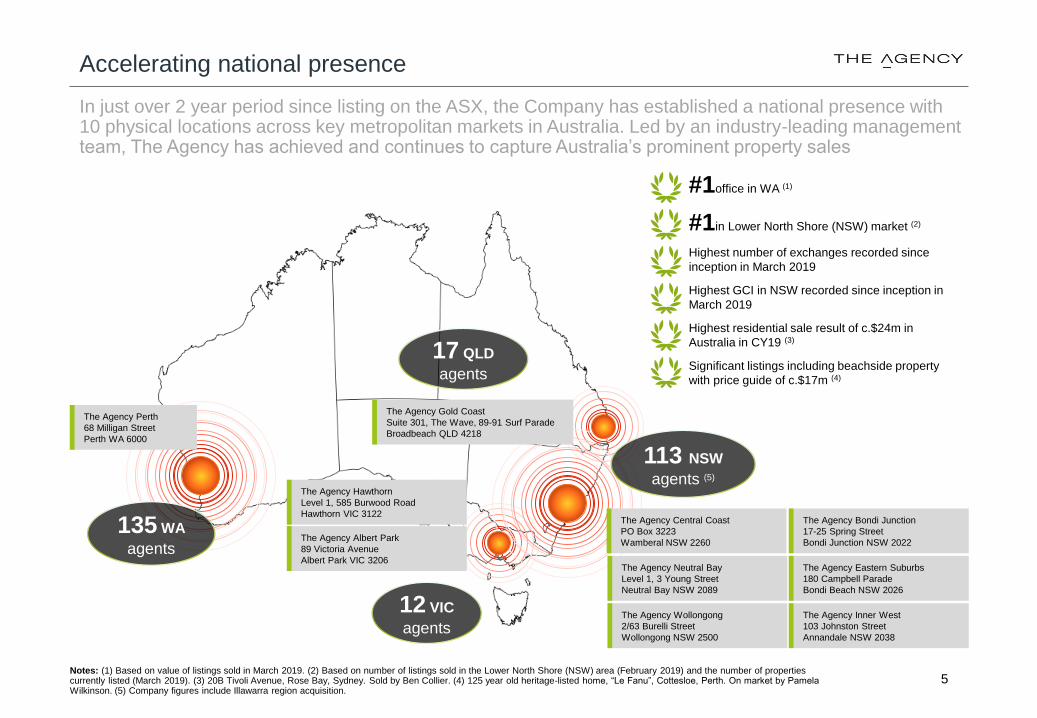
In just over 2 year period since listing on the ASX, the Company has established a national presence with 10 physical locations across key metropolitan markets in Australia. Led by an industry-leading management team, The Agency has achieved and continues to capture Australia’s prominent property sales
Notes: (1) Based on value of listings sold in March 2019. (2) Based on number of listings sold in the Lower North Shore (NSW) area (February 2019) and the number of properties currently listed (March 2019). (3) 20B Tivoli Avenue, Rose Bay, Sydney. Sold by Ben Collier. (4) 125 year old heritage-listed home, “Le Fanu”, Cottesloe, Perth. On market by Pamela Wilkinson. (5) Company figures include Illawarra region acquisition.
Highest residential sale result of c.$24m in
Australia in CY19 (3)
Significant listings including beachside property
with price guide of c.$17m (4)
135 WA
agents
17 QLD
agents
113 NSW
agents (5)
12 VIC
agents
The Agency Central Coast
PO Box 3223
Wamberal NSW 2260
The Agency Hawthorn
Level 1, 585 Burwood Road
Hawthorn VIC 3122
#1office in WA (1)
Highest number of exchanges recorded since
inception in March 2019
Highest GCI in NSW recorded since inception in
March 2019
#1in Lower North Shore (NSW) market (2)

6
Real estate services market
Notes: (1) L6720 Real Estate Services in Australia, IBISWorld October 2018. (2) Real Estate Industry Report, Macquarie Bank.
Technology disruption
• Technology disruption improving efficiencies of services processes tocomplement real estate agents:
‒ Reducing the need for offices
‒ Improving compliance, communication and marketing
‒ Increasing dominance of online websites such as Domain and REA
‒ Use of data analytics to generate property valuations
‒ Use of virtual reality in property inspections
Industry consolidation
• Market decline is putting pressure on small offices as decreased salescommission and reducing management fees due to oversupply ofrentals is reducing profit margins or offices – majority of real estateoffices have less than 15 agents (2).
• Fair Work Australia’s new legislation has introduced a minimum $55,000earnings that has added further pressure to smaller agencies and seenan exiting of poor performing agents
• Increasing trend of independent real estate agents joining largerorganisations providing back office support in order to combat reducedmargins
• Reduced margins have encouraged M&A activity as synergistic costsavings become increasingly required
Market trends
The Agency’s unique business model is disrupting the $24.9bn real estate services industry (1). The Agency capitalises on both expansion and contraction markets, opportunistically capturing sales agents and supported by its growing national property management business
Business scalability
• Attractive commission rates against a backdrop of declining margins isattracting agents, both independent and from other agencies, to TheAgency
• Opportunistic acquisitions to drive scale of The Agency during a periodof low business valuations
Defensive business in a contracting market
• Geographical diversity across metro and rural areas, with 10 physicallocations across WA, NSW, VIC and QLD, as well as a national virtualpresence
• Cross-sell opportunities between property sales, property managementand ancillary services
• Reduced overall exposure to residential property real estate pricesthrough property management and ancillary services
• Stable revenue and cash flow generated from property managementbusiness
Capitalising on market trends

7
Company overview
The Agency Group’s divisions
Notes: (1) Calculated from March 2019 monthly trail income.
Property sales
Conducts sales of residentialproperties on behalf of propertyvendors.
Operates a unique agent recruitmentmodel that delivers high growth tothe company while generating valuefor customers.
Disrupting the Australian real estatebrokerage market with its twodifferentiated offerings under thebrands The Agency and Sell LeaseProperty (SLP).
Property management
Manages residential properties on behalf of property owners.
Operates a unique agent incentive model that encourages agent performance and in turn generating stable, recurring revenue for the business.
The Agency Group’s property management division operates under The Agency brand.
Ancillary services
Provision of ancillary services provides cross-sell opportunities
• Mortgage financing services:mortgage loan book with c.4,400 loans and $2.1m in annualised trail income (1)
• Financial planning: provision of risk products and advice to clients undertaking new mortgages
• Conveyancing: settlement services
The Agency Group is comprised of three service categories, including property sales, property management and ancillary services
Premium, full service offering
Value, SaaS support offering
Property salesRevenue model
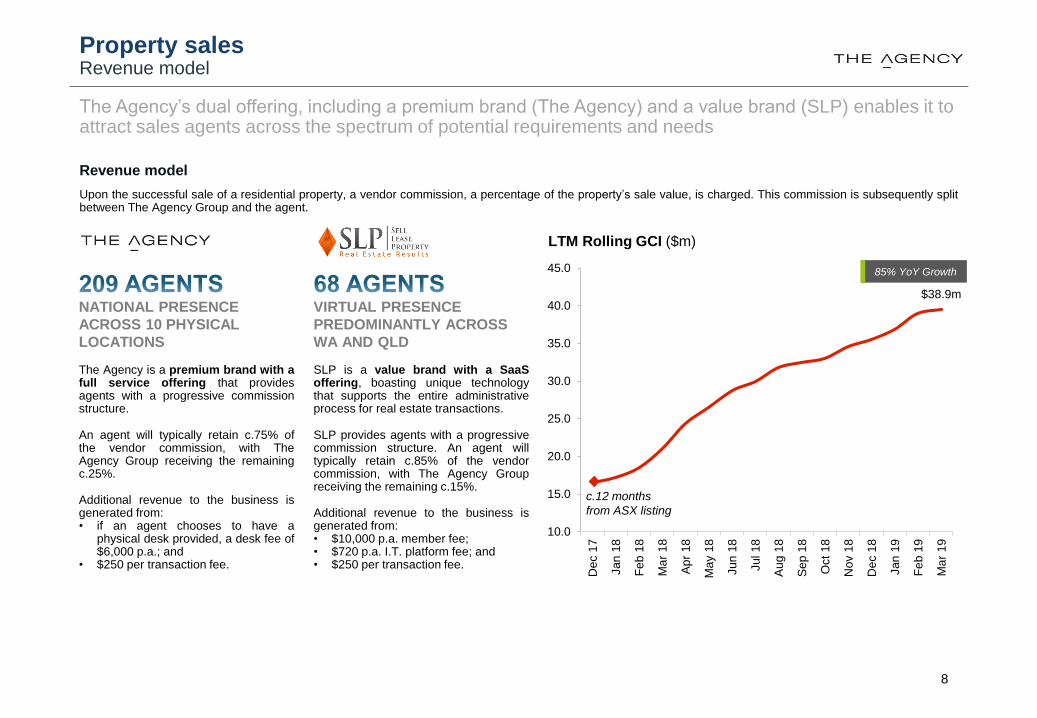
Upon the successful sale of a residential property, a vendor commission, a percentage of the property’s sale value, is charged. This commission is subsequently splitbetween The Agency Group and the agent.
Revenue model
8
NATIONAL PRESENCE
ACROSS 10 PHYSICAL
LOCATIONS
The Agency is a premium brand with afull service offering that providesagents with a progressive commissionstructure.
An agent will typically retain c.75% ofthe vendor commission, with TheAgency Group receiving the remainingc.25%.
Additional revenue to the business isgenerated from:• if an agent chooses to have a
physical desk provided, a desk fee of$6,000 p.a.; and
• $250 per transaction fee.
VIRTUAL PRESENCE
PREDOMINANTLY ACROSS
WA AND QLD
SLP is a value brand with a SaaSoffering, boasting unique technologythat supports the entire administrativeprocess for real estate transactions.
SLP provides agents with a progressivecommission structure. An agent willtypically retain c.85% of the vendorcommission, with The Agency Groupreceiving the remaining c.15%.
Additional revenue to the business isgenerated from:• $10,000 p.a. member fee;• $720 p.a. I.T. platform fee; and• $250 per transaction fee.
The Agency’s dual offering, including a premium brand (The Agency) and a value brand (SLP) enables it to attract sales agents across the spectrum of potential requirements and needs
Graph of GCI over time
$38.9m
10.0
15.0
20.0
25.0
30.0
35.0
40.0
45.0
Dec 1
7
Jan
18
Fe
b 1
8
Ma
r 1
8
Ap
r 18
Ma
y 1
8
Jun
18
Jul 18
Au
g 1
8
Se
p 1
8
Oct
18
Nov 1
8
Dec 1
8
Jan
19
Fe
b 1
9
Ma
r 1
9
85% YoY Growth
LTM Rolling GCI ($m)
c.12 months
from ASX listing

Property salesMarket position
Whilst franchised based brand networks dominate the Australian brokerage market, it creates significant fee leakage away from agents with multiple layers ofadministration and costs that sit above an agent, including the franchisee and the franchisor.
The primary alternative for agents has been to establish their own operations, either standalone or with peers. In exchange for a higher share or their fee incomeagents take on significant overhead cost and administrative burden.
The Agency and SLP brands provide overall larger profits to the agent than a traditional franchise or an independent operations, respectively:
• The Agency brand returns previously leaked fees to the agent, with the same level of support as a traditional franchise
• The SLP brand enables agents to operate an independent operation with a highly sophisticated cost efficient technology platform
Enhanced fee offering across the market
9
Portion of
commission
to an agent
Level of support to agent
Independent
Operations
Traditional
Franchise
The Agency’s offerings across both brands boast a superior financial and non-financial value to sales agents above independent operations and traditional franchises
4,324
3,900
4,000
4,100
4,200
4,300
4,400
4,500
Ap
r 18
Ma
y 1
8
Jun
18
Jul 18
Au
g 1
8
Se
p 1
8
Oct
18
Nov 1
8
De
c 1
8
Jan
19
Fe
b 1
9
Ma
r 1
9
Key financial assets
Notes: (1) Calculated from March 2019 quarterly management fee. (2) Calculated on occupied properties under management. (3) Calculated on a blended valuation multiple of 3.5x. (4) Calculated on a valuation multiple of 2.4x on annualised trail income calculated from March 2019 monthly trail income. (5) Calculated from March 2019 monthly trail income. 10
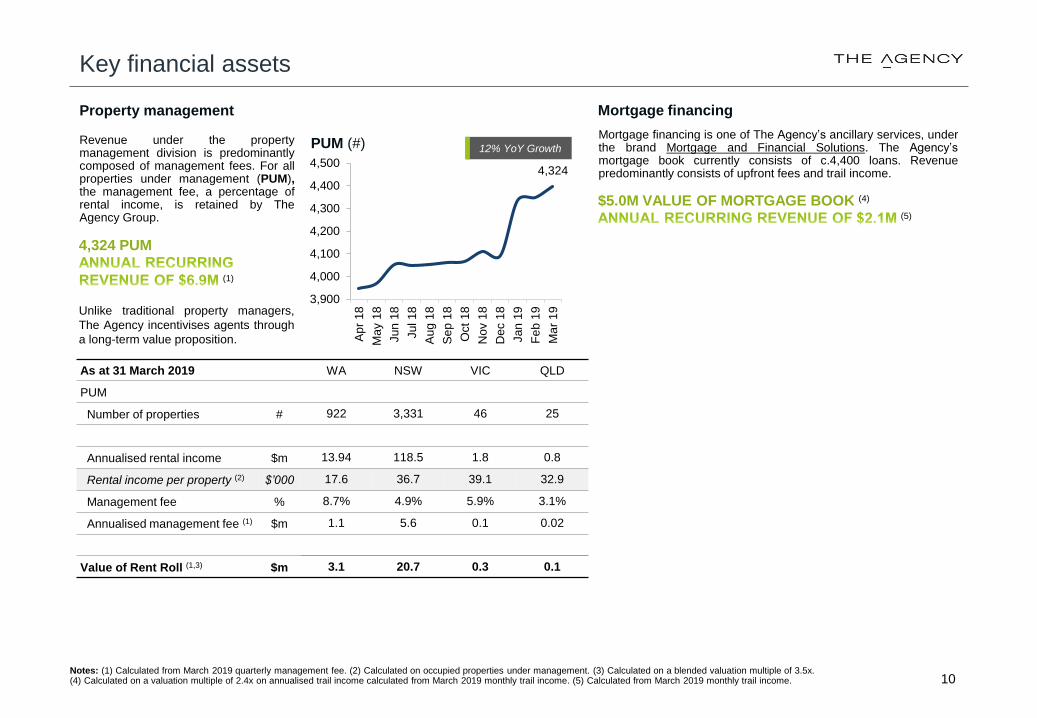
Revenue under the propertymanagement division is predominantlycomposed of management fees. For allproperties under management (PUM),the management fee, a percentage ofrental income, is retained by TheAgency Group.
Property management
4,324 PUM
(1)
Unlike traditional property managers,
The Agency incentivises agents through
a long-term value proposition.
As at 31 March 2019 WA NSW VIC QLD
PUM
Number of properties # 922 3,331 46 25
Annualised rental income $m 13.94 118.5 1.8 0.8
Rental income per property (2) $’000 17.6 36.7 39.1 32.9
Management fee % 8.7% 4.9% 5.9% 3.1%
Annualised management fee (1) $m 1.1 5.6 0.1 0.02
Value of Rent Roll (1,3) $m 3.1 20.7 0.3 0.1
Mortgage financing
Mortgage financing is one of The Agency’s ancillary services, underthe brand Mortgage and Financial Solutions. The Agency’smortgage book currently consists of c.4,400 loans. Revenuepredominantly consists of upfront fees and trail income.
$5.0M VALUE OF MORTGAGE BOOK (4)
12% YoY GrowthPUM (#)
(5)
(2.4)
(1.0)
(2.4)
(0.2)
(0)
(0)
(0)
(0)
0.0
0.0
0.0
4Q FY18 1Q FY19 2Q FY19 3Q FY19
Financials – LTM
Notes: (1) COGS excludes non-cash Future Fund item.
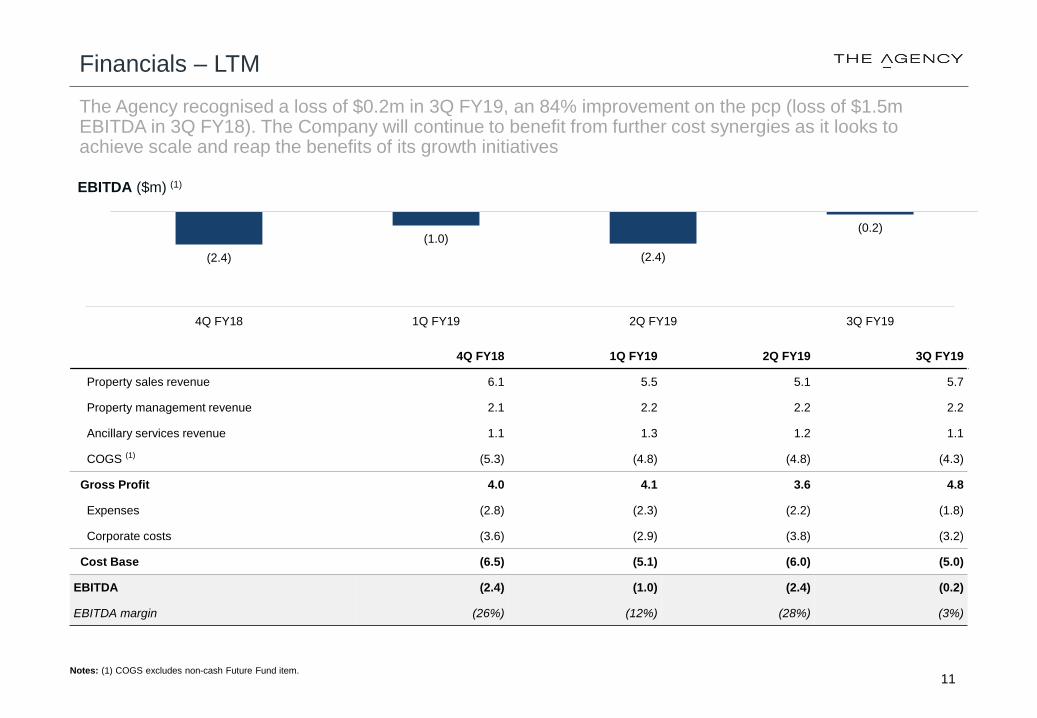
4Q FY18 1Q FY19 2Q FY19 3Q FY19
Property sales revenue 6.1 5.5 5.1 5.7
Property management revenue 2.1 2.2 2.2 2.2
Ancillary services revenue 1.1 1.3 1.2 1.1
COGS (1) (5.3) (4.8) (4.8) (4.3)
Gross Profit 4.0 4.1 3.6 4.8
Expenses (2.8) (2.3) (2.2) (1.8)
Corporate costs (3.6) (2.9) (3.8) (3.2)
Cost Base (6.5) (5.1) (6.0) (5.0)
EBITDA (2.4) (1.0) (2.4) (0.2)
EBITDA margin (26%) (12%) (28%) (3%)
The Agency recognised a loss of $0.2m in 3Q FY19, an 84% improvement on the pcp (loss of $1.5m EBITDA in 3Q FY18). The Company will continue to benefit from further cost synergies as it looks to achieve scale and reap the benefits of its growth initiatives
EBITDA ($m) (1)
11

186 188 193 209
100 97 90 68
286 285 283 277
-
0.0
0.0
0.0
0.0
0.0
0.0
4Q FY18 1Q FY19 2Q FY19 3Q FY19
The Agency SLP
832739
914
1,040
-
0.0
0.0
0.0
0.0
0.0
0.0
4Q FY18 1Q FY19 2Q FY19 3Q FY19
680630
596 613
-
0.1
0.2
0.3
0.4
0.5
0.6
0.7
0.8
4Q FY18 1Q FY19 2Q FY19 3Q FY19
9.17.0 7.5
8.9
1.8
2.0 1.2
1.4
11.0
9.0 8.7
10.3
-
0.0
0.0
0.0
0.0
0.0
0.0
0.0
4Q FY18 1Q FY19 2Q FY19 3Q FY19
The Agency SLP
Number of new listings (#)
Value of exchanges ($m)
Operational metrics – LTM
Notes: (1) Company figures include Illawarra region acquisition from 3Q FY19. (2) Following Fair Work Australia’s recent legislative changes the Company have performed a strategic review of the SLP agent network. (3) Calculated from quarterly management fee.
Number of agents (#) (1,2) Number of PUM (#)
GCI ($m) Annualised management fee ($m) (3)
The Company, has experienced a strong improvement in GCI in the last quarter despite maintaining agent numbers as its strategic transformation of SLP has removed poor producing agents. The Agency continues to be supported by a strong property management division
12
592 604 639 922
3,355 3,375 3,3233,331
3,966 4,013 4,0204,324
-
0.0
0.0
0.0
0.0
0.0
0.0
0.0
0.0
0.0
0.0
4Q FY18 1Q FY19 2Q FY19 3Q FY19
WA NSW VIC QLD
0.8 0.8 0.9 1.1
5.7 5.7 5.7 5.6
6.6 6.5 6.6 6.9
-
0.0
0.0
0.0
0.0
0.0
0.0
0.0
0.0
4Q FY18 1Q FY19 2Q FY19 3Q FY19
WA NSW VIC QLD

Paul Niardone
Managing DirectorPreviously Executive Director and founder of Professional Public Relations (WA),
the largest PR and communications firm in the State until he sold the business to
WPP. Experience in marketing and strategic planning for clients in both
Government and the private sector and over 15 years experience with public
companies.
Andrew Jensen
ChairmanAndrew, formerly CFO of Top Level Real Estate (acquired by The Agency), has
extensive knowledge in the management of all aspects of finance with strong
commercial, strategic, M&A, and change management experience. He has
financially led companies engaged in various fields including real estate and
ancillary services sectors globally. Fellow of IPA and member of the AICD.
Matt Lahood
Chief Executive Officer – The AgencyMore than 30 years in real estate sales; 2,000+ property sales worth over $2bn.
Previously Director of Sales for McGrath Real Estate, responsible for market entry
strategies and management of 22 company owned offices and more than 250
people.
Paul Niardone
Executive Director
Steven Chen
Director of ProjectsOver 20 years’ experience in real estate sales delivering over 3,000 properties
worth in excess of A$2.5bn. Ranked 16 in the top 100 agents of 2016 by REB.
Previously Head of Projects for McGrath Real Estate where he was responsible for
a team of eight Associate Directors and over 50 agents and support staff across
Sydney, Brisbane and Gold Coast.
x
Matt Lahood
Executive Director
Maria Carlino
Director of Property ManagementOver 27 years of real estate experience in key markets incl. Sydney, Brisbane and
the Gold Coast. Previous senior roles at RUN Property, Ray White and McGrath
Real Estate where she was responsible for the management and growth strategies
of the rental portfolio and team across all company owned offices.
John Kolenda
Non-Executive DirectorJohn is the co-founder and Managing Director of Finsure Group, one of Australia's
fastest growing retail finance brokerages, writing over $1 Billion in new mortgages
every month across 1300 brokers. He formed the Loan Market Group with Ray
White and before that worked as the General Manager of Sales & Distribution of
Aussie Home Loans.
Adam Davey
Non-Executive DirectorAdam is Director, Private Clients and Institutional at Patersons Securities. His
expertise spans over 25 years and includes capital raising (both private and public),
mergers and acquisitions, ASX listings, asset sales and purchases, transaction due
diligence and director duties.
13
Key management
Senior management Board of directors
