the age of reason - brookings institution
TRANSCRIPT

51
XAVIER GABAIXNew York University
DAVID LAIBSONHarvard University
The Age of Reason: Financial Decisionsover the Life Cycle and Implications
for Regulation
ABSTRACT Many consumers make poor financial choices, and older adultsare particularly vulnerable to such errors. About half of the population betweenages 80 and 89 have a medical diagnosis of substantial cognitive impairment. Westudy life-cycle patterns in financial mistakes using a proprietary database withinformation on 10 types of credit transactions. Financial mistakes include sub-optimal use of credit card balance transfer offers and excess interest rate and feepayments. In a cross section of prime borrowers, middle-aged adults made fewerfinancial mistakes than either younger or older adults. We conclude that finan-cial mistakes follow a U-shaped pattern, with the cost-minimizing performanceoccurring around age 53. We analyze nine regulatory strategies that may helpindividuals avoid financial mistakes. We discuss laissez-faire, disclosure, nudges,financial “driver’s licenses,” advance directives, fiduciaries, asset safe harbors,and ex post and ex ante regulatory oversight. Finally, we pose seven questionsfor future research on cognitive limitations and associated policy responses.
Most households in the United States have accumulated a substantialpool of wealth by the time they retire. Among households with a head
aged 65–74, median net worth—including net home equity but excludingpublic and private defined-benefit claims—was $239,400 in 2007, accord-ing to the 2007 Survey of Consumer Finances (SCF).1 Moreover, household
SUMIT AGARWALFederal Reserve Bank of Chicago
JOHN C. DRISCOLLBoard of Governors
of the Federal Reserve System
1. For this group of households, mean net worth, again excluding defined-benefitaccounts, was $1,015,700 in 2007. However, the mean is dominated by the right tail of thedistribution, and saving for these households is motivated by many considerations other thanretirement (particularly the desire to make bequests and the need for capital in ongoing pri-vately held businesses).
11941-03_Agarwal_rev2.qxd 1/26/10 11:30 AM Page 51

wealth is likely to grow much more quickly than income in the next threedecades, as more and more households experience a full career’s worth ofaccumulation in defined-contribution pension accounts such as 401(k)s.2
In addition to their accumulated assets, households with a head aged65–74 often have a complex set of balance sheet liabilities: the SCF reportsthat in 2007, 47.9 percent had debt secured by a residential property,26.1 percent had installment loans, and 37 percent carried credit cardbalances from month to month. Nearly two-thirds (65.5 percent) of house-holds in this age range had at least one form of debt.
In this paper we seek to raise a red flag about the increasingly large andcomplex balance sheets of older adults. Substantial retirement savings arecritical for the well-being of this group in light of the increasing averagelength of retirement, the rising expectation of independent living throughmost of retirement, and more modest defined-benefit flows for most retirees.However, many older adults are not in a good position to manage theirfinances, or even to delegate that management safely to others. We docu-ment this concern in four ways.
First, we review the literature on age-based patterns in cognitive func-tion. Performance on novel cognitive tasks—what psychologists call fluidintelligence—declines dramatically over one’s adult life. In the cross section,the fluid intelligence of the average individual falls by about 1 percentileunit each year from age 20 to age 80 (Salthouse forthcoming and authors’calculations). Many mechanisms contribute to explaining this pattern,including (confounding) cohort effects, normal aging effects, and dementia.The prevalence of dementia explodes after age 60, doubling with every fiveyears of age to more than 30 percent after age 85 (Ferri and others 2005).Moreover, many older adults without a strict diagnosis of dementia stillexperience substantial cognitive impairment. For example, the prevalenceof the diagnosis “cognitive impairment without dementia” is nearly 30 per-cent between ages 80 and 89.3 Drawing these facts together, about half thepopulation aged 80–89 have a diagnosis of either dementia or cognitiveimpairment without dementia.
Second, we supplement these existing findings with new longitudinalevidence from the University of Michigan’s Health and Retirement Study(HRS). Our new evidence eliminates the confound of cohort effects by
52 Brookings Papers on Economic Activity, Fall 2009
2. Poterba, Venti, and Wise (2008). Today fewer than half of the private sector workforcehave a defined-contribution plan at their current employer. However, current legislativeproposals are likely to expand coverage.
3. Plassman and others (2008). They define cognitive impairment without dementia as aDementia Severity Rating Scale score between 6 and 11.
11941-03_Agarwal_rev2.qxd 1/26/10 11:30 AM Page 52

estimating age effects that control for person fixed effects. When we do this,we find even stronger age-based patterns. Our results imply that age-basedselection effects are very strong—the most impaired subjects tend to dropout of these surveys—explaining why cross-sectional patterns of cognitivedecline understate the true age-based decline.
Third, using a new dataset, we document a link between age and thequality of financial decisionmaking in debt markets. In a cross section ofprime borrowers, middle-aged adults borrow at lower interest rates andpay less in fees than do either younger or older adults. Averaging resultsacross 10 different types of credit transactions, we find that fee and interestpayments are minimized around age 53. These measured effects are notexplained by differences in observed risk characteristics. Combiningmultiple datasets, neither do we find evidence that selection effects or cohorteffects explain our results. The leading explanation for the patterns that weobserve is that experience and acquired knowledge rise with age, but fluidintelligence declines with it.
Fourth, we review the contributions of other authors who have studiedage effects on financial decisionmaking. A small but rapidly growing body ofconvergent research highlights the cognitive vulnerabilities of older adults.Questions remain about the identification of age, cohort, and time effects.Moreover, even if we were certain that older adults make many suboptimalfinancial decisions, it is not clear what society should do about it.
We next present a discussion of mutually compatible policy options foraddressing the identified problems. Although some of our field evidencesuggests that younger adults are also at risk, our regulatory analysis empha-sizes older adults, for four reasons. First, older adults have much more atstake, since they control far more financial resources, both absolutely andas a fraction of their total net worth, than people in their 20s. Second, olderadults cannot as easily bounce back from their financial mistakes, sincetheir cognitive and physical disabilities frequently make it difficult to returnto work. Third, younger adults may make frequent financial mistakes,but they rarely have severe cognitive incapacity. The behavior of a foolish20-year-old credit card user bears little comparison to that of an 80-year-old suffering from dementia. For example, one regularly hears storiesabout friends’ aging relatives who lend or give a substantial fraction oftheir wealth to con artists (see, for example, Choi-Allum 2009). Fourth, inthe United States at least, retirees effectively have fewer regulatory pro-tections than do most workers. This is an unintended consequence of thenation’s system of defined-contribution retirement savings. Defined-contribution pension accounts are stringently regulated by the Employee
AGARWAL, DRISCOLL, GABAIX, and LAIBSON 53
11941-03_Agarwal_rev2.qxd 1/26/10 11:30 AM Page 53

Retirement Income Security Act (ERISA).4 However, almost all retireeseventually roll their accumulated balances out of ERISA-regulated accountsinto Individual Retirement Accounts (IRAs), which are regulated with amuch lighter touch. For example, the broker-dealer securities firms thatmanage most IRAs have no fiduciary duty toward their customers. Thus,the system currently provides the least regulation for precisely the age groupwith the greatest vulnerability.
We identify and discuss nine policy options, listed here in approximateorder from least to most paternalistic:
—Laissez-faire—Increased disclosure—“Libertarian paternalism” (the greater use of advice, defaults, and
other nudges)—Financial “driver’s licenses”—Advance directives (instructions set out today against a future loss
of competence)—Expanded fiduciary requirements—Protection of assets through sequestration in known safe investments
(“safe harbors”)—Default regulatory approval of financial products, with ex post sanc-
tions for violation of standards—Mandatory ex ante regulatory review of financial products.
We discuss the pros and cons of each of these different regulatory models,without arguing for the adoption of any one of them. We believe that naturalexperiments are needed to determine their efficacy, and we recognize thatthe stronger interventions have the potential to generate large social costsas well as benefits.
Finally, we identify seven critical research questions that need to beanswered before policymakers can identify an optimal regulatory design.These questions highlight how little is currently known about the financialchoices of older adults.
The paper is organized as follows. Section I discusses medical andpsychological evidence on changes in cognitive function over the life cycle.Section II discusses evidence from the HRS on age-based changes in
54 Brookings Papers on Economic Activity, Fall 2009
4. ERISA requires plans to provide participants with information about the plan, includingimportant information about plan features and funding; establishes fiduciary responsibilitiesfor those who manage and control plan assets; requires plans to establish a grievance andappeals process for participants; and gives participants the right to sue for benefits andover breaches of fiduciary duty. (See the U.S. Department of Labor’s webpage on ERISA atwww.dol.gov/dol/topic/health-plans/erisa.htm.)
11941-03_Agarwal_rev2.qxd 1/26/10 11:30 AM Page 54

cognitive function, controlling for person fixed effects. Section III discussesthe evidence on errors made by older adults in debt markets. Section IVdiscusses the broader literature on economic decisionmaking over thelife cycle. Section V analyzes the nine policy approaches listed above.Section VI concludes by posing our seven questions for future research.
I. Psychological and Medical Evidence on Cognitive Declineamong Older Adults
Fluid intelligence (performance on novel tasks) can be measured alongmany different dimensions, including working memory, reasoning, spatialvisualization, and cognitive processing speed. Figure 1, from a forthcomingpaper by Timothy Salthouse, illustrates each of these kinds of tasks.
Fluid intelligence shows a robust age pattern in cross-sectional datasetsof adults (Cattell 1987; Salthouse 2005; Salthouse forthcoming). Adults intheir early 20s score on average about 0.7 standard deviation above theadult mean, and adults in their early 80s about 1.0 standard deviation below
AGARWAL, DRISCOLL, GABAIX, and LAIBSON 55
Source: Salthouse (forthcoming). Reprinted with permission.
Memory Reasoning
Spatial Visualization Perceptual Speed
GoatDoorFishDeskRopeLakeBootFrogSoupMule
Study the following words and then write as many as you can remember
Select the best completion of the missing cell in the matrix
Classify the pairs as same (S) or different (D) as quickly as possible
Select the object on the right that corresponds to the pattern on the left
Figure 1. Examples of Memory and Analytical Tests
11941-03_Agarwal_rev2.qxd 1/26/10 11:30 AM Page 55
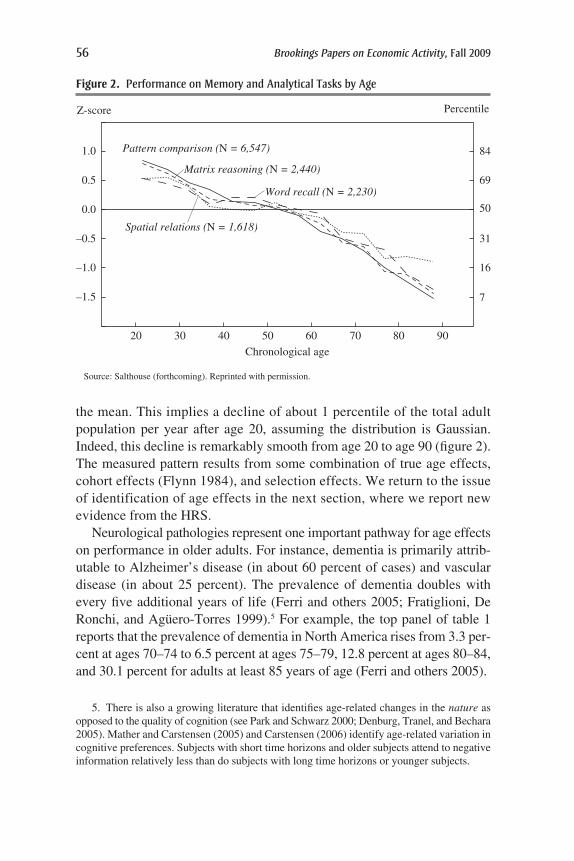
Figure 2. Performance on Memory and Analytical Tasks by Age
Source: Salthouse (forthcoming). Reprinted with permission.
Chronological age
20 30 40 50 60 70 80 90
Z-score
–1.5
–1.0
–0.5
0.0
0.5
1.0
Word recall (N = 2,230)
Matrix reasoning (N = 2,440)
Spatial relations (N = 1,618)
Pattern comparison (N = 6,547) 84
69
50
31
16
7
Percentile
56 Brookings Papers on Economic Activity, Fall 2009
5. There is also a growing literature that identifies age-related changes in the nature asopposed to the quality of cognition (see Park and Schwarz 2000; Denburg, Tranel, and Bechara2005). Mather and Carstensen (2005) and Carstensen (2006) identify age-related variation incognitive preferences. Subjects with short time horizons and older subjects attend to negativeinformation relatively less than do subjects with long time horizons or younger subjects.
the mean. This implies a decline of about 1 percentile of the total adultpopulation per year after age 20, assuming the distribution is Gaussian.Indeed, this decline is remarkably smooth from age 20 to age 90 (figure 2).The measured pattern results from some combination of true age effects,cohort effects (Flynn 1984), and selection effects. We return to the issueof identification of age effects in the next section, where we report newevidence from the HRS.
Neurological pathologies represent one important pathway for age effectson performance in older adults. For instance, dementia is primarily attrib-utable to Alzheimer’s disease (in about 60 percent of cases) and vasculardisease (in about 25 percent). The prevalence of dementia doubles withevery five additional years of life (Ferri and others 2005; Fratiglioni, DeRonchi, and Agüero-Torres 1999).5 For example, the top panel of table 1reports that the prevalence of dementia in North America rises from 3.3 per-cent at ages 70–74 to 6.5 percent at ages 75–79, 12.8 percent at ages 80–84,and 30.1 percent for adults at least 85 years of age (Ferri and others 2005).
11941-03_Agarwal_rev2.qxd 1/26/10 11:30 AM Page 56

AGARWAL, DRISCOLL, GABAIX, and LAIBSON 57
6. Experience may be acquired directly, or it may be acquired indirectly through commu-nication with peers. As people build up their social networks over their lifetime, their externalsources of experience become better and better developed. However, these networks tend tofray as individuals retire and leave well-developed work-based relationships. Peer mortalityalso contributes to a late-life decline of social networks. These channels suggest that the expe-riential knowledge derived from social networks follows a concave life-cycle pattern.
Table 1. Prevalence of Cognitive Impairment by Age in North AmericaPercent
Age Prevalence 95 percent confidence interval
Dementia60–64 0.8 0.6–1.065–69 1.7 1.5–1.970–74 3.3 2.7–3.975–79 6.5 5.5–7.580–84 12.8 11.8–13.885 and over 30.1 27.9–32.3
Cognitive impairment without dementia71–79 16.0 11.5–20.580–89 29.2 24.3–34.190 and over 38.8 25.6–52.0All ages 22.0 18.5–22.5
Sources: Ferri and others (2005); erratum to Plassman and others (2008).
Many older adults suffer from a less severe form of cognitive impairment,which is diagnosed as cognitive impairment without dementia. The preva-lence of this diagnosis rises from 16.0 percent at ages 71–79 to 29.2 percentat ages 80–89 (bottom panel of table 1). All told, about half of adults in their80s suffer from either dementia or cognitive impairment without dementia.
Age-driven declines in fluid intelligence, however, are partly offsetby age-related increases in crystallized intelligence (sometimes calledexperience or knowledge).6 Most day-to-day tasks, such as buying the rightamount of milk at the grocery store, rely on both fluid and crystallizedintelligence. For most tasks we hypothesize that net performance is hump-shaped with respect to age. Formally, this would result from the followingconditions: general task performance is determined by the sum of fluidand crystallized capital, crystallized capital accumulates with diminishingreturns (for m < n, the nth learning experience generates less crystallizedcapital than the mth), and fluid capital falls linearly (or perhaps concavely)over the life cycle (figure 3). Consequently, middle-aged adults may be ata decisionmaking sweet spot: they have substantial practical experience andhave not yet suffered significant declines in fluid intelligence. Supporting this
11941-03_Agarwal_rev2.qxd 1/26/10 11:30 AM Page 57
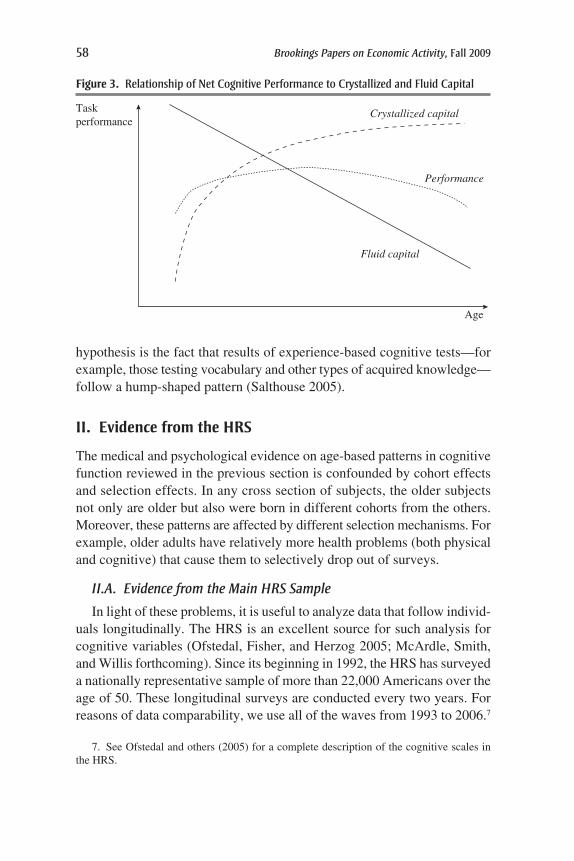
hypothesis is the fact that results of experience-based cognitive tests—forexample, those testing vocabulary and other types of acquired knowledge—follow a hump-shaped pattern (Salthouse 2005).
II. Evidence from the HRS
The medical and psychological evidence on age-based patterns in cognitivefunction reviewed in the previous section is confounded by cohort effectsand selection effects. In any cross section of subjects, the older subjectsnot only are older but also were born in different cohorts from the others.Moreover, these patterns are affected by different selection mechanisms. Forexample, older adults have relatively more health problems (both physicaland cognitive) that cause them to selectively drop out of surveys.
II.A. Evidence from the Main HRS Sample
In light of these problems, it is useful to analyze data that follow individ-uals longitudinally. The HRS is an excellent source for such analysis forcognitive variables (Ofstedal, Fisher, and Herzog 2005; McArdle, Smith,and Willis forthcoming). Since its beginning in 1992, the HRS has surveyeda nationally representative sample of more than 22,000 Americans over theage of 50. These longitudinal surveys are conducted every two years. Forreasons of data comparability, we use all of the waves from 1993 to 2006.7
58 Brookings Papers on Economic Activity, Fall 2009
Figure 3. Relationship of Net Cognitive Performance to Crystallized and Fluid Capital
Age
Taskperformance
Fluid capital
Crystallized capital
Performance
7. See Ofstedal and others (2005) for a complete description of the cognitive scales inthe HRS.
11941-03_Agarwal_rev2.qxd 1/26/10 11:30 AM Page 58

Our analysis proceeds in two parallel ways. First, we undertake a “naive”analysis (mirroring the methods described in the previous section) that sim-ply plots mean performance by age (in integer years), ignoring the potentialrole of cohort and selection effects. Second, we conduct a “controlled”analysis that traces out the performance trajectory using only intra-individualdifferences. To do this, we calculate the slope at age a as the average slopefor all subjects who are observed in adjacent survey waves straddling age a.8
In other words, the slope at integer age a is calculated as
where xi,w is the task performance of subject i in HRS wave w, Ai,w is thedecimal age of subject i in wave w, Ω(a) is the set of subjects who appear inadjacent waves at ages straddling age a, and N is the cardinality of Ω. Notethat this average slope implicitly controls for person fixed effects, since theslope is calculated by averaging individual slopes.
We then trace out the life-cycle trajectory using these average slopes,starting from the value of the naive analysis at an initial age. To reducesampling noise, the initial age is chosen as the first age for which we have atleast 1,000 observations in our combined sample (including all of the HRSwaves from 1992 to 2006).
The top left panel of figure 4 plots naive and controlled performance inthe immediate word recall task. The interviewer reads a list of 10 simplenouns, and the respondent is immediately asked to recall as many of themas possible, in any order. At age 51 the average performance is 6.2 words outof 10. By age 90 the average (controlled) performance is 3.0 words out of 10.
The top right panel of figure 4 plots naive and controlled performance inthe delayed word recall task. This is the same as the previous task exceptthat a second task taking about five minutes intervenes between recitationand recall. At age 51 the average performance is 5.4 words out of 10. Byage 90 the average (controlled) performance is 2.1 words out of 10.
The middle left panel of figure 4 plots naive and controlled perfor-mance in the serial sevens task, in which the respondent is asked to count
1 1
1N
x x
A Aa
i w i w
i w i wi aΩ Ω( )
+
+∈ ( )
−−∑ , ,
, ,
,
AGARWAL, DRISCOLL, GABAIX, and LAIBSON 59
8. In our notation, responses at dates t and t′ are adjacent if⎟ t′ − t⎟ < 5 years and therespondent does not answer the same question at another date t″ between t and t′. For exam-ple, if a specific question was not included in the 2004 wave but was included in the 2002and 2006 waves (and the respondent answered the question in both those waves), then theadjacent responses would be in 2002 and 2006. Two decimal ages A < A′ straddle integer agea iff A < a < A′.
11941-03_Agarwal_rev2.qxd 1/26/10 11:30 AM Page 59

60 Brookings Papers on Economic Activity, Fall 2009
Figure 4. Performance by Age on Six Tasks in the Health and Retirement Studya
3
4
5
4
5
2.5
3.0
8.0
8.5
9.0
6
50
60
70
20
50
40
30
Controlled b
Delayed word recallImmediate word recallScore Score
Score
Percent givingcorrect answer
Percent givingcorrect answer
Score
50 60 70 80 90
Age
50 60 70 80 90
Age
50 60 70 80 90
Age
50 60 70 80 90
Age
50 60 70 80 90
Age
Naive
Serial sevens
60 70 80 90
Age
Telephone Interviewof Cognitive Status
Chance of disease question Split lottery question
Sources: HRS data and authorsí calc ulations.a. See the text for descriptions of the tasks.b. Controlling for cohort and selection effects.
11941-03_Agarwal_rev2.qxd 1/26/10 11:30 AM Page 60
backward by 7 from 100. The respondent is scored on a 1-to-5 scale, with1 point awarded for each successful subtraction. At age 51 the averagescore is 3.2 out of 5. By age 90 the average (controlled) score is 2.2 out of 5.
The middle right panel of figure 4 plots naive and controlled perfor-mance in the Telephone Interview of Cognitive Status (TICS) task. Theresearcher asks the respondent the following 10 questions and assigns 1 point for each correct answer: What is the current year? What is thecurrent month? What is the current day of the month? What is the currentday of the week? What do you usually use to cut paper? What do youcall the kind of prickly plant that grows in the desert? Who is the currentpresident? Who is the current vice president? Count backward from 20 to10 (twice). At age 63 the average score is 9.2 out of 10. By age 90 the aver-age (controlled) score is 7.5.
Finally, we present two measures of practical numeracy. The bottomleft panel of figure 4 plots naive and controlled performance in response tothe following question: If the chance of getting a disease is 10 percent, howmany people out of 1,000 would be expected to get the disease? At age 53,79 percent of subjects answer correctly. By age 90, 50 percent answercorrectly.
The bottom right panel of figure 4 plots naive and controlled performancein response to the following question: If five people all have the winningnumbers in the lottery and the prize is $2 million, how much will each ofthem get? We believe that this question is imprecisely posed, since thelogical answer could be either $2 million or $400,000. However, the resultsare still interesting, since the fraction answering $400,000 (the officialcorrect answer) drops precipitously with age. At age 53, 52 percent answer$400,000. By age 90, only 10 percent do.
II.B. Evidence from ADAMS Data
The Aging, Demographics, and Memory Study (ADAMS) of theNational Institute on Aging conducts in-person clinical assessments ofcognitive function and dementia for a subsample of HRS respondents(Langa and others 2005). The ADAMS uses a much smaller sample thanthe HRS. Only 856 respondents were surveyed in the initial 2002 ADAMSwave. We use both the 2002 wave and a follow-up wave in 2006.
Figure 5 plots naive and controlled Clinical Dementia Ratings (CDRs)for the ADAMS sample (using just the 2000 wave), using sampling weightsto correct for overrepresentation of certain groups. The CDR score is on a0-to-4 scale, where 0 is healthy. A score of 1⁄2 represents very mild dementia;1 represents mild dementia; 2 represents moderate dementia; 3 represents
AGARWAL, DRISCOLL, GABAIX, and LAIBSON 61
11941-03_Agarwal_rev2.qxd 1/26/10 11:30 AM Page 61

62 Brookings Papers on Economic Activity, Fall 2009
9. See “Clinical Dementia Rating (CDR) Scale,” Washington University, St. Louis(alzheimer.wustl.edu/cdr/PDFs/CDR_OverviewTranscript-Revised.pdf) for a description.
Figure 5. Clinical Dementia Ratings by Age from the Aging, Demographics, andMemory Study (ADAMS)
Controlled
75 80 85
1.0
1.5
0.5
2.0
2.5
3.0
CDR (4 = maximum)
Severe
Moderate
Mild
Very mild
90
Age
Naive
Source: ADAMS data and authors’ calculations.
severe dementia; 4 is the highest dementia rating on the scale.9 Scoring isdone by a panel of clinicians who base their judgments on the entire batteryof tests in the ADAMS. Hence, the CDR has a very high signal-to-noiseratio, since the CDR score is derived from hundreds of survey questionsposed to a respondent and his or her caregivers. At age 75 the average scoreis 0.4, which is near the threshold for “very mild” dementia. At age 99 theaverage (control) score is 3.2, implying that the average respondent hassevere dementia.
Note that figure 5 shows a large gap between the naive average and thecontrolled average CDR scores. The naive averages are highly misleading,since they are affected by selection bias.
II.C. Summary of Evidence from the HRS
The HRS data paint a clear picture of declining cognitive function withage. They also suggest that selection effects may be more important thancohort effects. Cohort effects are predicted to cause the naive profiles tofall more steeply than the control profiles, since older cohorts have fewereducational advantages. Selection effects, in contrast, should cause the
11941-03_Agarwal_rev2.qxd 1/26/10 11:30 AM Page 62

naive profiles to fall less steeply than the control profiles, since the indi-viduals with the poorest cognitive function tend to exit the sample. Selec-tion bias seems to be more important in the HRS data, since our controlledprofiles are steeper than our naive profiles.
III. Financial Services and Age: Evidence on the Inverse U-Shape of Performance
In this section we document a U-shaped curve with age in the prices peoplepay in 10 different types of credit transactions: credit card balance transferoffers, home equity loans, home equity lines of credit, automobile loans,mortgages, personal credit cards, small business credit cards, credit card latepayment fees, credit card overlimit fees, and credit card cash advance fees.We discuss three forms of prices paid: interest rates (measured as annualpercentage rates, or APRs), fee payments, and balance transfer costs.
In each case we conduct a regression analysis that identifies age effectsand controls for observable factors that might explain the patterns by age.Thus, unless otherwise noted, in each context we estimate a regression ofthe following type:
where F is a measure of the price paid by the borrower (for example, the APR), “controls” is a vector of control variables intended to capturealternative explanations in each context (for example, measures of creditrisk), and “spline(age)” is a piecewise linear function that takes the con-sumer’s age as its argument, with knot points at ages 30, 40, 50, 60, and 70.We then plot the fitted values for the spline on age, computing the interceptusing the sample means for the controls. The regressions are either pooledpanel or cross-sectional regressions, depending on the context.10
Below we discuss the nature of the products and the prices paid, pre-sent graphs of fitted values on the spline coefficients, and discuss possibleexplanations for our findings. We describe the data in the appendix andprovide summary statistics for the datasets and the regression results in theonline appendix.11
( ) ( ) ,1 F = + × + × +α β γ εspline age controls
AGARWAL, DRISCOLL, GABAIX, and LAIBSON 63
10. As variants, we tried having knot points at every five years, and replacing the splinewith a set of dummy variables for age. The results were qualitatively and quantitatively sim-ilar, also showing a U-shaped pattern by age.
11. Online appendices for all papers in this issue may be found on the Brookings Paperswebpage (www.brookings.edu/economics/bpea) under “Conferences and Papers.”
11941-03_Agarwal_rev2.qxd 1/26/10 11:30 AM Page 63
III.A. Three Financial Choices
We first examine three of the above financial transactions: credit cardbalance transfer offers, home equity loans, and home equity lines of credit.The U-shaped pattern by age for suboptimal balance transfer behavior is arelatively clean example and thereby merits special emphasis. In the othertwo cases we are able to tease out the mechanism leading to higher interestpayments for younger and older borrowers, namely, mistakes made in esti-mating the value of one’s home.
EUREKA MOMENTS: OPTIMIZING THE USE OF CREDIT CARD BALANCE TRANSFERS.
Credit card holders frequently receive offers to transfer account balancesfrom an existing card to a new card charging a substantially lower APR foran initial period from six months to a year or more (a “teaser” rate). Thecatch is that all payments on the new card are applied first to the transferredbalance, and to new purchases (which are subject to a higher APR) onlyafter the transferred balance has been paid off.
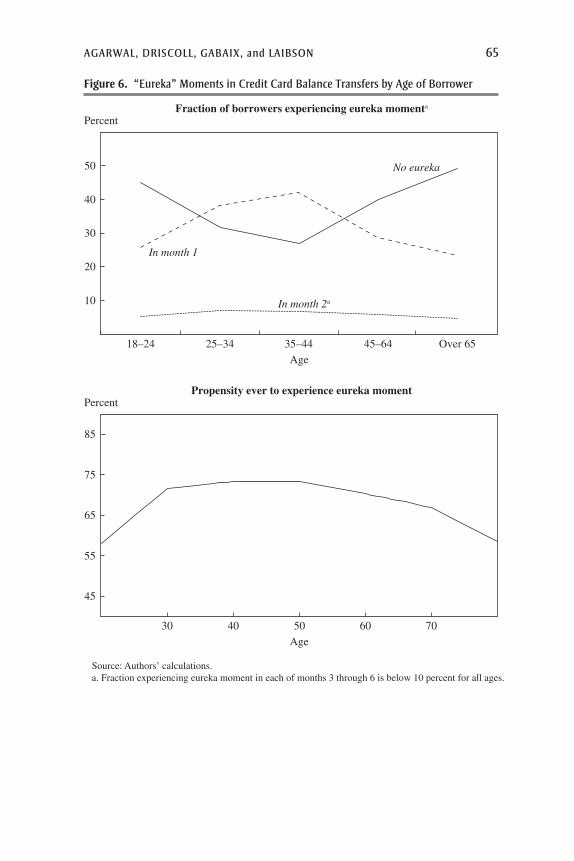
The optimal strategy for the cardholder during the teaser-rate period,then, is to make all new purchases on the old credit card and none on thenew card until all the transferred balances have been paid off. We catego-rize cardholders in our dataset by the speed with which they converge onthis optimal strategy. Some (about one-third) identify this optimal strat-egy immediately, before making any purchases with the new card. Others(slightly more than one-third) never identify the optimal strategy during theteaser rate period. The remaining third discover it after one or more billingcycles as they observe their surprisingly high interest charges. These bor-rowers make purchases for one or more months and then have a “eureka”moment, after which they implement the optimal strategy.12
The top panel of figure 6 plots the frequency of eureka moments foreach of five age groups. The plot of those who never experience a eurekamoment shows a pronounced U-shape by age; in contrast, the plot of thosewho implement the optimal strategy immediately has a pronounced invertedU-shape. Plots for eureka moments in the interior of the time space (that is,those that occur strictly after the first month) are flat.13 The “No eureka” lineimplies that the groups with the greatest frequency of maximal confusion
64 Brookings Papers on Economic Activity, Fall 2009
12. We thank Robert Barro of Harvard University for drawing our attention to this type ofpotentially tricky financial product. We also note that changes in regulation proposed in May2008 by the Federal Reserve, the National Credit Union Administration, and the Office ofThrift Supervision would forbid banks from applying payments solely to transferred balances.
13. Although the average share of borrowers in each of the intermediate categories issmall—on the order of 5 percent—summing over all the months yields a fraction of borrow-ers equal to one-third of the total.
11941-03_Agarwal_rev2.qxd 1/26/10 11:30 AM Page 64
AGARWAL, DRISCOLL, GABAIX, and LAIBSON 65
Figure 6. “Eureka” Moments in Credit Card Balance Transfers by Age of Borrower
In month 1
No eureka
10
20
30
40
50
PercentFraction of borrowers experiencing eureka momenta
Age
In month 2a
Source: Authors’ calculations.a. Fraction experiencing eureka moment in each of months 3 through 6 is below 10 percent for all ages.
18–24 Over 6545–6435–4425–34
45
65
55
75
85
PercentPropensity ever to experience eureka moment
Age
60 70504030
11941-03_Agarwal_rev2.qxd 1/26/10 11:30 AM Page 65

are younger adults and older adults. The group most likely to adopt theoptimal strategy immediately is adults aged 35–44.
The bottom panel of figure 6 plots the fitted values of the age splines forthe propensity ever to experience a eureka moment. Note that unlike in theother figures, higher values here indicate a smaller propensity to make mis-takes. Consistent with the evidence so far, a performance peak occurs inmiddle age.14 In section III.C we discuss possible explanations for this andthe other age-related differences we observe.15
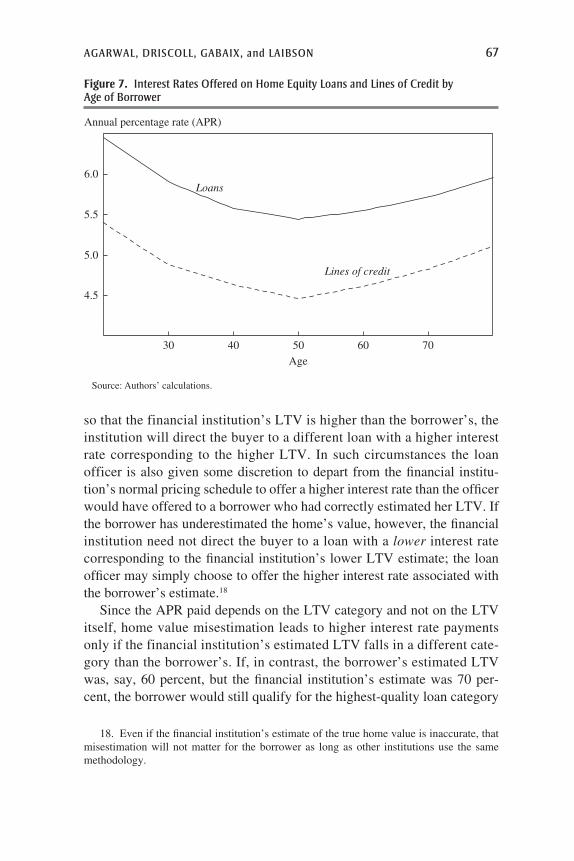
HOME EQUITY LOANS AND LINES OF CREDIT. Figure 7 plots the fitted valueson the splines for age for interest rates paid on home equity loans and linesof credit. The lines have a pronounced U-shape: the relatively young andthe relatively old face APRs that can be 50 basis points or more higher thanwhat the middle-aged pay.
For these two examples, we believe we understand the mechanism lead-ing to the differences by age: misestimation of the value of one’s home.The amount of collateral offered by the borrower, as measured by the loan-to-value (LTV) ratio, is an important determinant of loan APRs. HigherLTV ratios imply higher APRs, since the fraction of collateral is lower.At the financial institution that provided our data, borrowers first esti-mate their home’s value and then apply for a loan or credit line falling intoone of three categories depending on the implied LTV estimate: 80 per-cent or less, between 80 and 90 percent, and 90 percent or greater. Thefinancial institution then independently verifies the home’s value usingan industry-standard methodology and constructs its own LTV measure,which can therefore differ from the borrower’s.16
The pricing of the loan or credit line depends on the LTV category thatthe borrower falls into, and not on where precisely the LTV falls withinthat category.17 If the borrower has overestimated the value of the home,
66 Brookings Papers on Economic Activity, Fall 2009
14. We also check for the possibilities that the relatively old and the relatively youngmight have lower levels of debt or less access to credit than the middle-aged. We find thatneither credit card debt nor the number of open credit cards varies in economically or statis-tically significant ways with age.
15. The online appendix presents a formal hypothesis test for the U-shaped curves; wereject the null hypothesis of a flat age-based pattern in 9 out of the 10 cases.
16. Agarwal (2007) provides evidence that younger households are more likely to over-state, and older households to understate, their home’s value. Bucks and Pence (2006) presentevidence that many borrowers do not accurately estimate their home’s value.
17. We have verified this practice in our dataset by regressing the APR on both thebank’s estimated LTV and dummy variables for whether the bank’s LTV falls into one ofthe three categories. Only the coefficients on the dummy variables were statistically and eco-nomically significant. Ben-David (2008) also shows that there are discrete jumps in lendingrates at LTV cutoff points.
11941-03_Agarwal_rev2.qxd 1/26/10 11:30 AM Page 66
AGARWAL, DRISCOLL, GABAIX, and LAIBSON 67
18. Even if the financial institution’s estimate of the true home value is inaccurate, thatmisestimation will not matter for the borrower as long as other institutions use the samemethodology.
Figure 7. Interest Rates Offered on Home Equity Loans and Lines of Credit by Age of Borrower
Loans
4.5
5.0
5.5
6.0
Annual percentage rate (APR)
Lines of credit
Source: Authors’ calculations.
Age
60 70504030
so that the financial institution’s LTV is higher than the borrower’s, theinstitution will direct the buyer to a different loan with a higher interestrate corresponding to the higher LTV. In such circumstances the loanofficer is also given some discretion to depart from the financial institu-tion’s normal pricing schedule to offer a higher interest rate than the officerwould have offered to a borrower who had correctly estimated her LTV. Ifthe borrower has underestimated the home’s value, however, the financialinstitution need not direct the buyer to a loan with a lower interest ratecorresponding to the financial institution’s lower LTV estimate; the loanofficer may simply choose to offer the higher interest rate associated withthe borrower’s estimate.18
Since the APR paid depends on the LTV category and not on the LTVitself, home value misestimation leads to higher interest rate paymentsonly if the financial institution’s estimated LTV falls in a different cate-gory than the borrower’s. If, in contrast, the borrower’s estimated LTVwas, say, 60 percent, but the financial institution’s estimate was 70 per-cent, the borrower would still qualify for the highest-quality loan category
11941-03_Agarwal_rev2.qxd 1/26/10 11:30 AM Page 67

(LTV < 80 percent) and would not suffer an effective interest rate penalty.We define a rate-changing mistake (RCM) to have occurred when theborrower’s LTV falls in a different category from the financial institution’s,for instance when the borrower estimates an LTV of 85 but the financialinstitution calculates an LTV of 75 percent (or vice versa). We find that, onaverage, making an RCM increases the APR by 125 basis points for loans and150 basis points for credit lines (controlling for other variables, but not age).
To examine the importance of RCMs, we first study the APRs offered toconsumers who do not make an RCM. The top panel of figure 8 plots thefitted values from reestimating the regressions of APRs on borrower char-acteristics and age splines, but now conditioning on borrowers who do notmake an RCM. The plots show only slight differences in APR paid by age.For home equity loans, the difference in APR between a borrower at age 70and a borrower at age 50 has shrunk from 36 basis points to 8 basis points;for home equity lines of credit, it has shrunk from 28 basis points to 4 basispoints. For a borrower at age 20, the APR difference over a borrower atage 50 has shrunk to 3 basis points for both loans and lines of credit. Weconclude that among borrowers who do not make an RCM, the APR isessentially flat with age. Therefore, the U-shape of the APR age curve isprimarily driven by RCMs.
We next investigate who makes RCMs. The bottom panel of figure 8 plotsthe propensity to make an RCM by age for home equity loans and creditlines. The figure shows U-shapes for both. Borrowers at age 70 have a16-percentage-point greater chance of making a mistake on a home equityloan than borrowers at age 50 (the difference for lines of credit is 19 per-centage points); the comparable numbers for borrowers at age 20 relative toage 50 are 35 and 41 percentage points. The unconditional average probabil-ity of making an RCM is 24 percent for loans and 18 percent for credit lines.
This age effect is consistent with the cost of an RCM calculated aboveand the additional probability of making an RCM with age. For example,as noted, a 70-year-old has a 16-percentage-point additional chance ofmaking an RCM on a home equity loan. Multiplying this by the averageAPR cost of an RCM for home equity loans of about 125 basis points givesan expected incremental APR paid of about 26 points. The analogous dif-ference for lines of credit is 23 basis points. These differences are veryclose to the estimated differences of about 23 and 28 basis points.
We conclude that in this example we have identified the reason forthe U-shape of home equity APRs as a function of age (as always, control-ling for other characteristics). Younger and older consumers have a greatertendency to misestimate the value of their home, which leads them to make
68 Brookings Papers on Economic Activity, Fall 2009
11941-03_Agarwal_rev2.qxd 1/26/10 11:30 AM Page 68

AGARWAL, DRISCOLL, GABAIX, and LAIBSON 69
Figure 8. Rate-Changing Mistakes in Home Equity Loan and Line of Credit Applicationsby Age of Borrower
Loans
Loans
4.50
4.25
90
80
70
60
50
40
30
20
10
5.00
4.75
5.50
5.25
5.75
PercentAPRs for borrowers who do not make an RCMa
Lines of credit
Lines of credit
Source: Authors’ calculations.a. A rate-changing mistake (RCM) occurs when the borrower’s estimate of the value of the home
differs from the lender’s estimate by enough to place the borrower’s implied loan-to-value (LTV) ratio in a different interest rate category from the lender’s implied LTV. The categories are LTV ≤ 80 percent, 80 percent < LTV< 90 percent, and LTV ≥ 90 percent; loans in higher LTV categories may be charged higher interest rates.
Age
60 70504030
PercentPropensity to make an RCM
Age
60 70504030
11941-03_Agarwal_rev2.qxd 1/26/10 11:30 AM Page 69

an RCM, which in turn results in their borrowing at a higher APR thanthey could have obtained. On the other hand, for consumers who do notmake an RCM, the APR is essentially independent of age.
Given the large costs associated with an RCM, one might ask why bor-rowers do not make a greater effort to accurately estimate the value of theirhome. One possibility is that potential borrowers are not aware that creditterms will differ by LTV category or, if they are aware of this fact, they maynot know by how much the terms differ. This feature of loan pricing maythus be a shrouded attribute, in the sense of Gabaix and Laibson (2006).
III.B. Seven Other Financial Choices
In this section we present results on the seven other credit prices westudied: interest rates on personal credit cards, auto loans, mortgages, andsmall business credit cards (figure 9), and three types of credit card fees(late payment, overlimit, and cash advance; figure 10). In all seven cases,plots of fitted values on the coefficients on the age splines are U-shaped by
70 Brookings Papers on Economic Activity, Fall 2009
Figure 9. Interest Rates Paid by Type of Loan and Age of Borrower
9.259.00
8.75
8.50
8.25
17.75
17.50
17.25
12.75
14.75
15.2515.50
18.00
Automobile loansPersonal credit card loansAnnual percentage rate Annual percentage rate
Annual percentage rate Annual percentage rate
12.50
12.25
12.0011.75
30 40 50 60 70
Age
30 40 50 60 70
Age
30 40 50 60 70
AgeAge
30 40 50 60 70
AgeAge
Mortgages
15.00
15.75
Small business credit card loans
Source: Authors’ calculations.
11941-03_Agarwal_rev2.qxd 1/26/10 11:30 AM Page 70

age, although the amplitudes vary. In each case, in the underlying regres-sions we have tried to control for other variables that might explain dif-ferences in the cost of suboptimal financial choices by age. Data andregression results are presented in the online appendix.
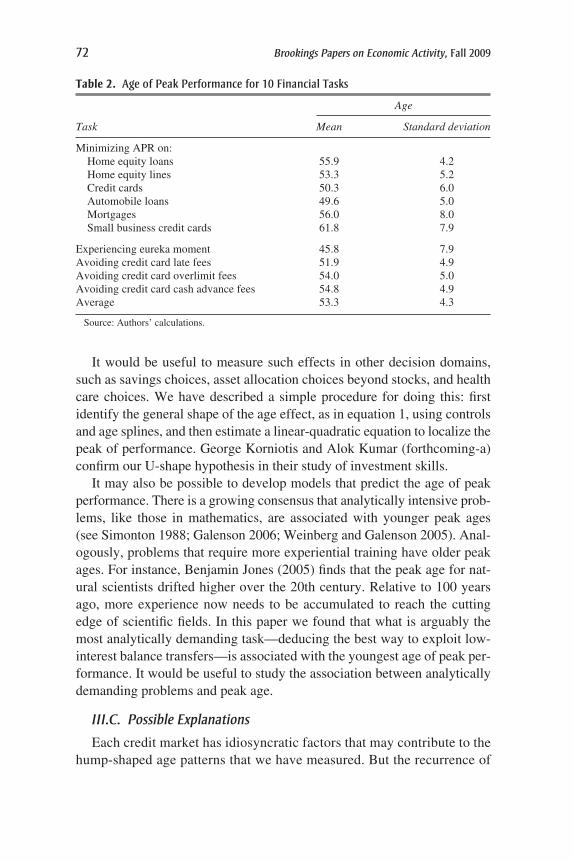
Visual inspection of the age splines in all cases suggests that fees andinterest rates paid are lowest for customers in their late 40s or early 50s. Toestimate the minimum more precisely, we reestimate each model, replac-ing the splines from age 40 to 50 and from age 50 to 60 with a single splinerunning from age 40 to 60 and the square of that spline. Table 2 reports ourestimates of the “age of reason,” the point in the life span at which finan-cial mistakes are minimized, for each type of transaction. The mean age ofreason in these estimates is 53.3 years, and the standard deviation calcu-lated by treating each study as a single data point is 4.3 years.
The lowest age of peak performance is that for the eureka moment task.Interestingly, that task is arguably the most dependent on analytical capac-ity and the least dependent on experience, since the kinds of balance trans-fer offers that we study were new financial products when our data werecollected. Hence, it is not surprising that the peak age for succeeding at thattask would be earlier than for the other tasks. However, since we lack a rig-orous measure of the difficulty of a task, the interpretation of the eurekacase remains speculative.
AGARWAL, DRISCOLL, GABAIX, and LAIBSON 71
Figure 10. Incidence of Credit Card Fees by Age of Borrower
Late fee
0.24
0.20
0.22
0.18
0.28
0.26
0.30
0.32
No. of fees incurred per month
Cash advance fee
Source: Authors’ calculations.
Age
60 70504030
Overlimit fee
11941-03_Agarwal_rev2.qxd 1/26/10 11:30 AM Page 71
It would be useful to measure such effects in other decision domains,such as savings choices, asset allocation choices beyond stocks, and healthcare choices. We have described a simple procedure for doing this: firstidentify the general shape of the age effect, as in equation 1, using controlsand age splines, and then estimate a linear-quadratic equation to localize thepeak of performance. George Korniotis and Alok Kumar (forthcoming-a)confirm our U-shape hypothesis in their study of investment skills.
It may also be possible to develop models that predict the age of peakperformance. There is a growing consensus that analytically intensive prob-lems, like those in mathematics, are associated with younger peak ages(see Simonton 1988; Galenson 2006; Weinberg and Galenson 2005). Anal-ogously, problems that require more experiential training have older peakages. For instance, Benjamin Jones (2005) finds that the peak age for nat-ural scientists drifted higher over the 20th century. Relative to 100 yearsago, more experience now needs to be accumulated to reach the cuttingedge of scientific fields. In this paper we found that what is arguably themost analytically demanding task—deducing the best way to exploit low-interest balance transfers—is associated with the youngest age of peak per-formance. It would be useful to study the association between analyticallydemanding problems and peak age.
III.C. Possible Explanations
Each credit market has idiosyncratic factors that may contribute to thehump-shaped age patterns that we have measured. But the recurrence of
72 Brookings Papers on Economic Activity, Fall 2009
Table 2. Age of Peak Performance for 10 Financial Tasks
Age
Task Mean Standard deviation
Minimizing APR on:Home equity loans 55.9 4.2Home equity lines 53.3 5.2Credit cards 50.3 6.0Automobile loans 49.6 5.0Mortgages 56.0 8.0Small business credit cards 61.8 7.9
Experiencing eureka moment 45.8 7.9Avoiding credit card late fees 51.9 4.9Avoiding credit card overlimit fees 54.0 5.0Avoiding credit card cash advance fees 54.8 4.9Average 53.3 4.3
Source: Authors’ calculations.
11941-03_Agarwal_rev2.qxd 1/26/10 11:30 AM Page 72
that pattern across all 10 outcomes above suggests that there may also besome common underlying explanation. In this section we discuss sev-eral such possible explanations, including cognitive age effects, selec-tion effects, and cohort effects. We do not find evidence for selection orcohort effects that could explain our results, but our data do not allow us todefinitively rule them out.
AGE-RELATED EFFECTS. One possible explanation for the U-shaped patternof mistakes is a combination of two age-based effects: diminishing returnsto learning, and the age-based decline in analytical function we documentedin section I. Relatively young borrowers tend to have low levels of experi-ence but a high degree of analytical function, whereas older borrowers tendto have high levels of experience but relatively lower analytical function. Wediscussed these mechanisms in section I and explained how these offsettingtrends could produce a hump-shaped pattern in financial sophistication.
This hypothesis of two offsetting age-based effects also provides a pos-sible explanation of the location of peak performance. We hypothesize thatpeak performance reflects a trade-off between rising experience and declin-ing analytical function. If so, the sooner people start experimenting with afinancial product, the earlier the peak of performance should be. To evalu-ate this hypothesis for each financial product, we first construct the age dis-tribution of the users of this product in our dataset and calculate the age atthe 10th percentile of the distribution, which we call “age10%.” This is aproxy for the age at which people typically start using the product. We thenregress the location of peak performance on that variable, with the follow-ing results:
The adjusted R2 for the equation is 0.62, and the standard errors on the inter-cept and the coefficient are, respectively, 5.7 and 0.19.19 Thus, we rejectthe null hypothesis of no relationship between the peak variable and age10%.Products whose use begins later in life tend to have a later performancepeak.
SELECTION EFFECTS. The cross-sectional age effects that we measure areprobably also partly attributable to differences in the pool of borrowersby age group—a selection effect. For example, in the total population ofU.S. households, retirees borrow less than other adults, as the life-cycle
peak age= + ×33 0 71 10. .%
AGARWAL, DRISCOLL, GABAIX, and LAIBSON 73
19. The effect is robust to the choice of percentiles other than the 10th for the start vari-able. For instance, the correlation between peak age and median age of users for the productis 0.83.
11941-03_Agarwal_rev2.qxd 1/26/10 11:30 AM Page 73

consumption model predicts. Older adults who are borrowing may there-fore be unrepresentative of the population of all older adults. Likewise,older adults who are borrowing might be less financially savvy than 30- or50-year-old borrowers, since borrowing might be less of a bad signal atthese younger ages.20 Below we describe several ways of measuring therole of sample selection in determining our results.
Lack of financial sophistication in relatively older (or younger) borrow-ers should be reflected in those borrowers having less education, income,or net worth than nonborrowers of the same age. To make such compar-isons, we calculate for each age group the ratio of the median educationalattainment (or income, or net worth) of borrowers in that group to themedian for all members of the group. We want to determine whether theseratios differ across age groups. In other words, are borrowers differentiallyselected across different age groups? Since our proprietary dataset con-tains information only on borrowers, we cannot use it to make these calcu-lations. However, we can make such comparisons using the SCF.
Using data from the 1989, 1998, 2001, and 2004 SCFs, we compute theabove ratios for education, income, and net worth; results are presented inthe online appendix. We find that within age groups, borrowers almostalways have higher income and more education than the population as awhole, and often have higher net worth. Moreover, older borrowers appearto have relatively higher income and more education relative to their peersthan middle-aged borrowers do. Hence, these data suggest that the selec-tion effects by age go in the opposite direction from that predicted: olderborrowers appear to be a more affluent and better educated pool thanmiddle-aged borrowers. We present additional results in the online appen-dix showing that borrowing by age does not appear to vary by race, and thatolder borrowers do not appear to have disproportionately lower incomes,lower FICO (credit) scores, or more debt than older people generally.
None of these analyses lend support to the idea that sample selectioneffects contribute to the U-shaped patterns that we see in the data. If in facta higher proportion of older borrowers are unsophisticated, then that lackof sophistication is somehow evident only in borrowing rates and feepayments, and not in credit scores, default rates, educational attainment,income, or net worth. Although we concede that this is a logical possibil-ity, we know of no explanation for why such a lack of sophistication wouldappear so selectively in the data.
74 Brookings Papers on Economic Activity, Fall 2009
20. They could also be riskier, in ways not captured by the risk measures we include—ahypothesis that we consider (and reject) below.
11941-03_Agarwal_rev2.qxd 1/26/10 11:30 AM Page 74

COHORT EFFECTS. Older borrowers in our cross section might make rela-tively less sophisticated financial choices than younger borrowers becausethey belong to cohorts that have less human capital than younger cohorts(see, for example, Flynn 1984). For example, older cohorts may be lessmathematically literate than younger cohorts, or they may use less sophis-ticated search technologies: for instance, they may be less inclined to usethe Internet to compare financial products. Finally, older cohorts may havegrown up with different financial products than those now available.
Without a true panel dataset with information going back 20 years ormore, we cannot measure the role of cohort effects in explaining theobserved U-shaped pattern relative to other explanations. However, severalfacts make us think that cohort effects cannot be the whole explanation.First, education-based cohort effects cannot explain the pattern of declin-ing mistakes that we observe over the first half of adulthood. Second, weobserve the U-shaped pattern over a broad range of products, some ofwhich, such as mortgages, have seen substantial changes in their institu-tional characteristics over time, while others, such as auto loans, have not.Third, if cohort effects were important, one would expect to see differ-ences in prices paid between male and female borrowers, on the groundsthat the current cohort of older female borrowers have tended to be lessinvolved in financial decisionmaking than their male contemporaries. Infact, we find no substantive differences between men and women. Finally,for two products—auto loans and credit cards—we have data from 1992,10 years earlier than the data used for our other studies. Replicating ouranalysis for these data results in the same U-shaped pattern.
In summary, although cohort effects are probably present in our data, wedoubt that they play an important role in explaining the U-shaped pattern.Cohort effects are most likely to make some contribution to the decline inperformance that we measure after middle age. The improvement in per-formance up to middle age is harder to explain with cohort stories, althoughsome preference-based cohort effect might be generating this pattern.21
RISK EFFECTS. Some of our results could be driven by unobserved varia-tion in default risk that is not reflected in the risk measures (such as FICOscores) that we use as control variables. For instance, the U-shaped patternof APRs could be due to a similar pattern of default by age. We test thisalternative hypothesis by analyzing default rates on credit cards, auto loans,and home equity loans and credit lines. We estimate a linear regression in
AGARWAL, DRISCOLL, GABAIX, and LAIBSON 75
21. See Malmendier and Nagel (2007) for examples of how cohort effects affect prefer-ences for equities.
11941-03_Agarwal_rev2.qxd 1/26/10 11:30 AM Page 75

which the default rate is modeled as a weighted sum of an age spline, logincome, and all of the standard risk measures that are in our data. When weplot fitted values by age (see the online appendix for the chart), we find apronounced inverted U-shape for home equity loans and credit lines,implying that the young and the old have lower default rates than themiddle-aged. Credit cards and auto loans show a slightly inverted U-shape,and the curve for small business credit cards is about flat. Hence, theseresults contradict the hypothesis that our APR results are driven by anunmeasured default risk. Finally, note that age-dependent default riskswould not explain the observed patterns in credit card fee payments or inthe suboptimal use of credit card balance transfers.
OPPORTUNITY COST OF TIME. Some age effects could be generated byage-related variation in the opportunity cost of time (Aguiar and Hurst2007). However, standard opportunity cost effects would predict thatretirees pay lower prices, which is not what we observe in our data. Never-theless, our findings and those of Aguiar and Hurst are not necessarily con-tradictory. Shopping for a familiar commodity—for instance, a gallon ofmilk—is much less analytically demanding than shopping for a compli-cated and somewhat unfamiliar product that can differ across many dimen-sions, such as a mortgage. Hence, we are not surprised to see older adultsshopping more effectively for food even while losing ground in relativelymore complex domains. In addition, shopping at stores and supermarketsmay be a more pleasant activity than shopping at banks and other lenders,leading consumers to devote more time to the former.
The 2007 SCF provides some support for the idea that shopping intensityfor loans decreases with age. That survey asked borrowers whether, whenborrowing money or obtaining credit, they shop around a great deal, moder-ately, or not at all. For borrowers under age 35, 24 percent report shoppingaround a great deal, 60 percent moderately, and 15 percent almost no shop-ping. The corresponding figures for those aged 75 and over are 15 percent,40 percent, and 46 percent. The online appendix presents a full table ofresults by SCF age class as well as the text of the survey question.
DISCRIMINATION AND OTHER SUPPLY FACTORS. The presence of age effectsmight also be interpreted as evidence for some kind of age discrimina-tion. Banks may explicitly choose to charge older and younger borrowershigher APRs, or they may simply market products that happen to havehigher APRs or fees more aggressively to the young or the old. We believethese explanations to be unlikely for two reasons. First, the U-shaped pat-tern shows up in contexts, such as credit card fee payments and failures tooptimally use balance transfer offers, in which discrimination is not rele-
76 Brookings Papers on Economic Activity, Fall 2009
11941-03_Agarwal_rev2.qxd 1/26/10 11:30 AM Page 76
AGARWAL, DRISCOLL, GABAIX, and LAIBSON 77
22. Charles, Hurst, and Stephens (2008) document racial differences in lending rates atauto finance companies, but not at banks.
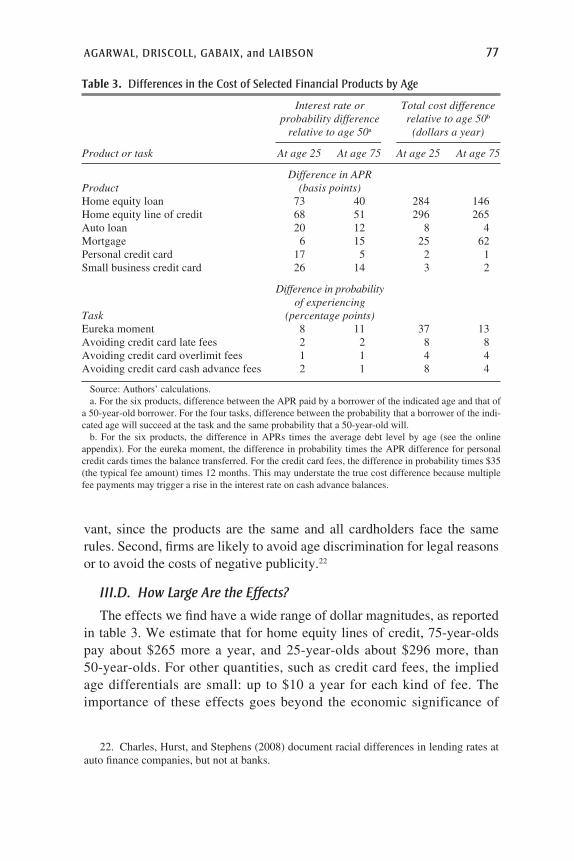
Table 3. Differences in the Cost of Selected Financial Products by Age
Interest rate or Total cost differenceprobability difference relative to age 50b
relative to age 50a (dollars a year)
Product or task At age 25 At age 75 At age 25 At age 75
Difference in APR Product (basis points)Home equity loan 73 40 284 146Home equity line of credit 68 51 296 265Auto loan 20 12 8 4Mortgage 6 15 25 62Personal credit card 17 5 2 1Small business credit card 26 14 3 2
Difference in probability of experiencing
Task (percentage points)Eureka moment 8 11 37 13Avoiding credit card late fees 2 2 8 8Avoiding credit card overlimit fees 1 1 4 4Avoiding credit card cash advance fees 2 1 8 4
Source: Authors’ calculations.a. For the six products, difference between the APR paid by a borrower of the indicated age and that of
a 50-year-old borrower. For the four tasks, difference between the probability that a borrower of the indi-cated age will succeed at the task and the same probability that a 50-year-old will.
b. For the six products, the difference in APRs times the average debt level by age (see the onlineappendix). For the eureka moment, the difference in probability times the APR difference for personalcredit cards times the balance transferred. For the credit card fees, the difference in probability times $35(the typical fee amount) times 12 months. This may understate the true cost difference because multiplefee payments may trigger a rise in the interest rate on cash advance balances.
vant, since the products are the same and all cardholders face the samerules. Second, firms are likely to avoid age discrimination for legal reasonsor to avoid the costs of negative publicity.22
III.D. How Large Are the Effects?
The effects we find have a wide range of dollar magnitudes, as reportedin table 3. We estimate that for home equity lines of credit, 75-year-oldspay about $265 more a year, and 25-year-olds about $296 more, than50-year-olds. For other quantities, such as credit card fees, the impliedage differentials are small: up to $10 a year for each kind of fee. Theimportance of these effects goes beyond the economic significance of
11941-03_Agarwal_rev2.qxd 1/26/10 11:30 AM Page 77

each individual case, however: the consistent appearance of a U-shapedpattern of costs in such a wide variety of circumstances points to a phe-nomenon that might also apply to many other areas.23 An important ques-tion is whether this pattern translates into other choice domains, includingsaving, asset allocation, and health care.
Indeed, in domains for which we lack data, the effects might be larger.For instance, our sample probably does not contain older adults withsevere dementia, for which the effects might be stronger. In section VI weestimate the fraction of GDP that may be wasted because of poor financialdecisionmaking.
IV. Other Work on Economic Decisionmaking over the Life Cycle
Our analysis is part of a recent literature that studies the effects of agingand cognitive function on the use of financial instruments (see, for exam-ple, Willis 2007; McArdle and others forthcoming), which in turn is part ofa broader literature on household finance (Campbell 2006). In their workon financial literacy, Annamaria Lusardi and Olivia Mitchell (2006, 2007)find declines in the mastery of basic financial concepts, such as the abilityto calculate percentages or perform simple division, in adults after age 50.
In light of our findings, other researchers have offered to look for agepatterns of financial mistakes in their own datasets. Lucia Dunn (personalcommunication, June 2007) has reported to us that the Ohio State Survey oncredit cards shows a U-shaped pattern of credit card APR terms by age.Fiona Scott Morton (personal communication, May 2007) has reported thatin her dataset of indirect auto loans (loans made by banks and finance com-panies using the dealer as an intermediary; see Scott Morton, Zettelmeyer,and Silva-Risso 2003), loan markups show a U-shaped age pattern. LuigiGuiso (personal communication, April 2007) finds that when pickingstocks, consumers achieve their best Sharpe ratios at about age 43, and thiseffect appears to be entirely driven by the willingness to hold stocks in thefirst place. Ernesto Villanueva (personal communication, April 2007) findsthat mortgage APRs in Spanish survey data (comparable to the U.S. Sur-vey of Consumer Finances) follow a U-shaped curve by age.
A relationship between age and performance has been noted in manynonfinancial contexts. Survey data suggest that labor earnings peak around
78 Brookings Papers on Economic Activity, Fall 2009
23. For example, Korniotis and Kumar (2008a) confirm our U-shape hypothesis in theirstudy of investment skills.
11941-03_Agarwal_rev2.qxd 1/26/10 11:30 AM Page 78

age 50 (Gourinchas and Parker 2002), or after about 30 years of work expe-rience (Murphy and Welch 1990). Kelly Shue and Erzo Luttmer (2009) findthat older and younger voters make disproportionately more errors in votingthan do middle-aged voters. John Graham, Campbell Harvey, and ManjuPuri (2008) find that older CEOs tend to be more risk averse (see Simonton1988 for a survey).
A recent literature reports systematic differences in rationality betweengroups of people, particularly with respect to financial decisionmaking.Barry Scholnick, Nadia Massoud, and Anthony Saunders (2008) find thatwealthier people make fewer mistakes on their credit cards, and Agarwaland others (2008) reach a similar conclusion concerning more experiencedpeople. Victor Stango and Jonathan Zinman (2009) document that naiveconsumers substantially underestimate loan interest rates when asked toinfer them from principal, maturity, and monthly payments. Korniotis andKumar (2008) find that investors who perform better on standard intelli-gence tests obtain better risk-adjusted returns (see also Korniotis and Kumarforthcoming-b). In experimental contexts, Shane Frederick (2005) identifiesa measure of IQ: people with higher scores on cognitive ability tasks tend toexhibit fewer and weaker psychological biases. Daniel Benjamin, SebastianBrown, and Jesse Shapiro (2006) find that subjects with higher intelligencetest scores, or less cognitive load, display fewer behavioral biases.
Several researchers have looked at the response of consumers to creditcard teaser rates. Haiyan Shui and Lawrence Ausubel (2005) show that con-sumers prefer credit card contracts with low initial rates for a short periodto ones with somewhat higher rates for a longer period, even when the latterare ex post more beneficial. Consumers also appear reluctant to switch con-tracts even when they would benefit from doing so (Agarwal and others2006). Stefano DellaVigna and Ulrike Malmendier (2004) theorize thatfinancial institutions set the terms of credit card contracts to reflect con-sumers’ poor forecasting ability over their future consumption. Many ofthese effects are discussed in the literature on behavioral industrial organi-zation, which documents and studies markets with boundedly rational con-sumers and rational firms.24 In some of that literature, the effects dependon having both naive and sophisticated consumers in the market. Thepresent paper suggests that those naive consumers will disproportionatelybe younger and older adults.
AGARWAL, DRISCOLL, GABAIX, and LAIBSON 79
24. Examples from this literature include DellaVigna and Malmendier (2004), Gabaixand Laibson (2006), Heidhues and Koszegi (2009), Malmendier and Shanthikumar (2007),Mullainathan and Shleifer (2005), and Spiegler (2006).
11941-03_Agarwal_rev2.qxd 1/26/10 11:30 AM Page 79

V. Regulatory Responses
In this section we discuss nine mutually compatible policy responses (andsome hybrids) to the problems we have identified, both specifically withrespect to older adults and more generally with respect to their applicabil-ity to financial decisionmakers of all ages. We analyze the pros and cons ofeach approach without arguing for the adoption of any one of them, recog-nizing that strong regulatory interventions have the potential to generatelarge social benefits but also large social costs. The nine approaches arediscussed approximately in order from least to most paternalistic. This order-ing is somewhat arbitrary since some approaches have multiple dimensions,some of which might be more or less paternalistic than others.
V.A. Laissez-Faire
Laissez-faire is surely not the first-best policy. As we have noted, abouthalf of decisionmakers between ages 80 and 89 are significantly cogni-tively impaired. The competitive equilibrium is unlikely to be efficientwhen agents routinely make significant cognitive errors.
A growing body of anecdotal evidence finds that overpriced financialproducts are being targeted at older adults (for example, Choi-Allum 2009).The competitive equilibrium works as follows: Some older adults will makebad decisions (for example, overpaying for financial services or losing theirmoney in fraudulent schemes), generating economic rents for those whocan exploit these decisions. These rents are partially dissipated, however,because the aggressive or manipulative sales tactics needed to capture themare costly, and because fraudulent sellers face the risk of legal punishment.In equilibrium, the zero-economic-profit condition still applies, but thesocial allocation is inefficient. To put it more intuitively, when sellersmust spend a dollar of their own resources (their time, legal defense fees,and so forth) to convince a pool of older adults to give them a dollar inrent, excess profits will be zero, but there is a social deadweight loss of onedollar. In equilibrium, then, wasteful marketing and bad products willsurvive even if competition eliminates all excess profits. (See Gabaixand Laibson 2006 for a related argument.)
Laissez-faire policies are nevertheless serious candidates on our list ofoptimal policies, because the laissez-faire approach could be second-bestoptimal. Strong regulatory interventions are problematic for many familiarreasons. Regulations are usually administratively costly. They may harmthe interests of households who are financially sophisticated or who havesophisticated and trustworthy advisers. Policymakers may have conflicts
80 Brookings Papers on Economic Activity, Fall 2009
11941-03_Agarwal_rev2.qxd 1/26/10 11:30 AM Page 80

of interest, and even well-intentioned policymakers make mistakes. For allthese reasons, we do not rule out laissez-faire policies. In addition, laissez-faire policies are compatible with voluntary advance directives (discussedbelow), in which rational household members, recognizing the possibilityof their own future cognitive decline, set up protective mechanisms aheadof time, in the form of family oversight, competent and trustworthy finan-cial advisers, and formal trusts.
However, such delegation-based solutions are limited by seven factors:the failure to anticipate, when cognitively healthy, the possibility of one’sown future cognitive decline; the mistaken belief that one will recognizeone’s own cognitive decline and respond optimally by progressively del-egating decisionmaking as it occurs; procrastination; the difficulties thatexternal parties face in determining when key thresholds of cognitivedecline have been crossed, so that control can be transferred efficiently;administrative costs, particularly when the trustee is a third party such asan attorney; a lack of financially sophisticated family members, capable ofmaking good financial decisions on the declining adult’s behalf; and a lackof trustworthy family members.
The last of these is particularly important, since, counterintuitively, fam-ily members are often a poor choice to play an oversight role. Of course,altruism is strong in many families, and many family members do haveintimate knowledge of each other’s preferences. However, family mem-bers also face a conflict of interest when they are residual claimants on aparent’s estate. Hence, many older adults will lack an unconflicted, low-cost agent to whom they can safely delegate decisionmaking authority.
V.B. Disclosure
Full and fair disclosure has been the primary goal of financial regulatorysystems since the 19th century, and it is at the heart of many current con-gressional proposals. Legislation to strengthen disclosure requirementshas recently been introduced in many different domains, including mutualfund fees, 401(k) fees, and mortgage origination fees.
However, we are skeptical that improved disclosure will be effectivein improving financial choices. Even for cognitively healthy popula-tions, there is scant evidence that increases in disclosure improve decision-making. In a series of recent studies of middle-aged adults, additionaldisclosure and consumer education made surprisingly little difference. Inone study, employees with low saving rates were randomly assigned to atreatment in which they were paid $50 to read a short survey explainingtheir 401(k) plan, including a calculation of how much money they would
AGARWAL, DRISCOLL, GABAIX, and LAIBSON 81
11941-03_Agarwal_rev2.qxd 1/26/10 11:30 AM Page 81

personally gain by taking full advantage of the employer match. Relativeto a control group, this group did not significantly increase its average401(k) saving rate (Choi, Laibson, and Madrian 2007). The bankruptcy ofthe Houston-based Enron Corporation and the huge losses suffered bymany of its employees who had invested their 401(k)s largely in Enronstock had no effect, despite intense media coverage, on the willingness ofnewly hired workers at other firms to invest their 401(k) contributions inemployer stock. This was true even for newly hired workers at other firmsin Houston (Choi, Laibson, and Madrian 2005). Employer-sponsoredfinancial education seminars have been shown to have little effect on401(k) enrollment (Madrian and Shea 2001b). A new, easy-to-read sum-mary prospectus proposed by the Securities and Exchange Commission(SEC) seems to have no effect on investor choices (Beshears and others2009a). Finally, making mutual fund fees overwhelmingly salient doesnot lead investors to minimize them, even when allocating real moneyamong index funds. In one study, subjects were asked to allocate $10,000among four S&P 500 index funds. To help with their choice, the sub-jects were told what an index fund is, given a one-page summary sheetcomparing the fees of the four index funds, and given the prospectus ofeach fund. Only 10 percent of the subjects put all $10,000 in the fundwith the lowest costs (Choi and others 2007).
The subjects of these studies were all adults in the workforce. It is likelythat disclosure would be even less effective on retired older adults experi-encing significant declines in cognitive function.
We wish to emphasize that we are not opposed to disclosure. There is noevidence that it hurts, and it is certainly possible that it makes a small posi-tive difference. For example, the study using the SEC summary prospectusfound that shortening and simplifying mutual fund prospectuses would savepaper and printing costs and decision time, even if it had no effect on assetallocation. So when improved disclosure is itself inexpensive or reducesother costs, it is surely a good idea. But one should not expect disclosure toresolve the regulatory concerns raised by the findings in this paper.
V.C. Libertarian Paternalism: Advice, Defaults, and Other Nudges
In the last decade a growing body of research has suggested that gentleinstitutional “nudges” can improve behavior without mandating any par-ticular behavior. Richard Thaler and Cass Sunstein (2003, 2008) refer tosuch interventions as “libertarian paternalism,” because the social planneris acting paternalistically by nudging behavior in one direction, but simul-taneously maintaining a libertarian stance by allowing the actor to reject
82 Brookings Papers on Economic Activity, Fall 2009
11941-03_Agarwal_rev2.qxd 1/26/10 11:30 AM Page 82

the nudge at minimal cost. Prominent examples of nudges include auto-matic 401(k) enrollment with an opt-out feature (Madrian and Shea 2001a;Choi and others 2002) and automatic saving rate escalators (Thaler andBenartzi 2004).
In practice, such nudges work when the nudge is aligned with the inten-tions of the person being nudged, for example when employees want to beenrolled in their company’s 401(k) plan but for whatever reason fail toenroll on their own. But nudges are rejected when the nudge is misalignedwith those intentions. For example, when workers are automaticallyenrolled at a saving rate that they deem too high (say, 12 percent ofincome), almost all opt out (Beshears and others 2009b). Likewise, auto-matic annuitization of defined-benefit accumulations is often rejected infavor of lump-sum payouts (Mottola and Utkus 2007).
It is also important that those being nudged not be subject to forcefulopposing influences. In the case of automatic 401(k) enrollment, workersoverwhelmingly perceive that they save too little (Choi and others 2002),and no third party stands to gain a significant rent by convincing them notto enroll. In other words, no third party has a strong incentive to nudge inthe other direction.
Unfortunately, benevolent institutional nudges, whether by the gov-ernment or by other agents, will probably provide little protection forolder adults. These benevolent nudges will often be outweighed by malevo-lent ones emanating from marketers and unscrupulous relatives (see Choi-Allum 2009). Older adults with low financial literacy or significant cognitiveimpairment may be no match for highly incentivized parties with malevo-lent interests and ample opportunities to nudge in the wrong direction.
Here, too, we are not opposed to the intervention in principle. Nudgescan partly protect older adults and other vulnerable economic agents. How-ever, we suspect that nudges will only be weakly protective in an environ-ment where older adults are soft (and increasingly wealthy) targets for thosewith conflicts of interest.
V.D. Financial “Driver’s Licenses”
Another set of proposals would require that individuals pass a “license”test before being allowed to make nontrivial financial decisions, such asopting out of “safe harbor” investment products (Alesina and Lusardi2006; see section V.G below). Such proposals would need to overcomeseveral logistical problems. Can a test be devised that reliably separatesqualified from unqualified investors, without generating too many falsenegatives or false positives? Can it be administered at a reasonable social
AGARWAL, DRISCOLL, GABAIX, and LAIBSON 83
11941-03_Agarwal_rev2.qxd 1/26/10 11:30 AM Page 83

cost? If the test were administered over the Internet, what would preventcoaching by parties with conflicts of interest? Who would be required totake the test? How often would retesting be required? Would it be requiredoften enough to catch people as they transition (often very quickly) into astate of significant cognitive impairment? Would such a test be politicallyfeasible if it primarily targeted older adults?
V.E. Strengthening Fiduciary Responsibilities
Regulators could also increase the fiduciary duties of individuals whosell financial products. In the extreme, all sales of financial products toindividuals could be required to be conducted by an agent with a fiduciaryduty toward the buyer.
The word “fiduciary” originates from the Latin words fides and fiducia,which mean, respectively, “faith” and “trust.” Under common law, fiducia-ries are legally bound to act at all times for the sole benefit and interestof a beneficiary—the principal—and to avoid conflicts of interest and self-dealing. Because of these legal obligations, the principal can trust thefiduciary to do the right thing. In an influential decision, Judge BenjaminCardozo wrote that a fiduciary “is held to something stricter than the moralsof the market place. Not honesty alone, but the punctilio of an honor themost sensitive, is then the standard of behavior.”25
In the United States, many types of advisers—lawyers, guardians, execu-tors, trustees, conservators of estates, corporate directors, corporate officers,and majority shareholders—bear fiduciary duties. Investment advisers alsohave a fiduciary duty, which is legislated in the Investment Advisers Actof 1940. As we mentioned in the introduction, the Employee RetirementInvestment Savings Act (ERISA) imposes a fiduciary duty on employersthat sponsor retirement plans, for their decisions that affect plan partici-pants, who in turn have the right to sue over breaches of that duty.
However, many types of financial representatives and salespeople haveno legal fiduciary responsibilities, and a substantial fraction of financialservices are sold by such agents. For example, an annuity salesperson whocold-calls potential clients may legally receive large commissions (whichare often shrouded from the client) for selling them financial products withlarge markups. Neither these agents nor the registered representatives ofsecurities broker-dealer firms are considered investment advisers, and
84 Brookings Papers on Economic Activity, Fall 2009
25. Alhough Cardozo would eventually sit on the Supreme Court, this landmark deci-sion was handed down during his earlier tenure on the New York Court of Appeals. In Mein-hard v. Salmon, 164 N.E. 545 (N.Y. 1928), the court held that business partners have afiduciary duty in the course of activities associated with their partnership.
11941-03_Agarwal_rev2.qxd 1/26/10 11:30 AM Page 84

26. In principle, investors could purchase low-fee products in their IRAs. In practice,they overwhelmingly fail to do so.
27. Alternatively, this could be a springing power of attorney, which takes effect only inthe event of their incapacity.
AGARWAL, DRISCOLL, GABAIX, and LAIBSON 85
consequently they do not have a full fiduciary duty. Brokers’ duties areestablished in the Securities Exchange Act of 1934, which does not set afiduciary standard.
One implication is that many workers have much greater effective regu-latory protection than retirees. Employer 401(k) plans and other defined-contribution plans are regulated by ERISA, which, as noted, imposes astrong fiduciary duty on the employer. IRAs, in contrast, have a much lowerlevel of protection, since the representatives of the securities broker-dealerfirms that manage these accounts are not full-fledged fiduciaries. Thus,when a retiree rolls money over from her 401(k) account to an IRA, as hap-pens with the overwhelming majority of 401(k) assets, her savings lose thefiduciary protection she enjoyed as an employee. Of course, nobody forcesretirees to make these rollovers, but the financial services industry has astrong incentive to encourage them, since fees are higher in practice out-side of 401(k) accounts.26
Mandating fiduciary responsibilities, even weak ones, on the sellers offinancial services would give them a stronger incentive to design and mar-ket products that meet high standards. But it might also generate newadministrative and compliance costs and slow financial innovation. If theseinefficiencies were to prove considerable, an alternative would be to man-date fiduciary duties only in certain circumstances, for example when thebuyer is above some age threshold. Other intermediate solutions would beto impose on IRA asset managers the same fiduciary duties as 401(k) plansponsors, or to strongly discourage rollovers from 401(k)s to IRAs.
V.F. Mandatory Advance Directives
One way to address directly the impact of cognitive decline on finan-cial decisionmaking would be to require older adults to put in place afinancial advance directive before reaching a certain age. Such mandatoryadvance directives could take many forms. For instance, older adults mightbe required to create a durable power of attorney, so that somebody wouldbe able to manage their financial affairs in the event of their incapacity.27
Alternatively, older adults might be required to create a streamlined version of a revocable living trust. Such trusts enable individuals to passmanagement of their assets to a fiduciary in the event of the principal’sincapacity.
11941-03_Agarwal_rev2.qxd 1/26/10 11:30 AM Page 85

Entirely new legal protections might also be created. For example, afiduciary could be appointed to approve all “significant financial trans-actions” involving the principal’s funds after the principal reaches a des-ignated age. A significant financial transaction might be defined as anytransaction representing more than a certain share (which could decreasewith the principal’s age) of the principal’s net worth. The principal wouldpreset this threshold for fiduciary approval at the time the advance directiveis created. To make the process easier, a default schedule could be estab-lished, for example, beginning at 50 percent of net worth at age 75 andfalling as the principal ages. If a seller then enters into a financial transac-tion with the principal without formal approval from the principal’s fidu-ciary, and it is subsequently determined that the transaction exceeded therelevant threshold, the transaction could be nullified. In addition, the direc-tive would stipulate who will judge the principal’s mental capacity andhow the principal’s assets would be administered in the event the principalis judged no longer mentally competent. Finally, the details of the directive(including the choice of fiduciary) could be changed at any time if the prin-cipal can demonstrate mental competency.
As an alternative to these fiduciary-based models, the principal couldalso be allowed to place her assets in a safe harbor (see next subsection)that eliminates the need for a fiduciary. This option would appeal to fami-lies that do not have substantial assets and would therefore not find theappointment of a fiduciary to be cost-effective.
Mandating advance directives would pose several problems. First, itmight be perceived by some older adults as an unfair restriction targetedagainst them. Second, the imposition of a fiduciary would create transac-tions costs. Third, any attempt to define a safe harbor would be politicallycontentious and would doubtless give rise to a great deal of lobbying. Anindependent agency would probably be needed to partly insulate the safeharbor regulations from political pressure.
V.G. Protected Assets: A Life-Cycle Safe Harbor
A portion of a retiree’s financial assets could be protected in a manda-tory safe harbor, with four basic features:28
86 Brookings Papers on Economic Activity, Fall 2009
28. We use the term “safe harbor” with two complementary meanings in mind. First,the standard legal usage is relevant, since the firms managing these safe harbor assets andfollowing the relevant regulatory guidelines would be protected from lawsuits. Second,the investors themselves would be protected from exploitation by those same regulatoryguidelines.
11941-03_Agarwal_rev2.qxd 1/26/10 11:30 AM Page 86

—First, an asset base would be identified. This would probably includeall forms of savings that have benefited from federal tax relief, such asqualified defined-contribution plans and all types of IRAs.
—Second, when the principal reaches a specified age, a portion of thisasset base would be irrevocably placed in a safe harbor account, that is,one that is permitted to hold only certain types of assets. For example, atage 591⁄2,29 every account in the asset base could be required to distribute50 percent of the balance into such an account. In principle, the safe harboraccounts could be managed by the same company that managed the origi-nal accounts, obviating the need for direct government involvement.
—Third, the investor would choose from among a limited range ofhighly regulated, low-cost investment options for the assets within the safeharbor. These options might include a fixed annuity, a variable annuity, abond mutual fund, and a life-cycle mutual fund (which would contain adiversified portfolio of stocks and bonds).
—Finally, the account would have a minimum and a maximum rate ofdrawdown. The minimum rate could be set according to current rules onrequired minimum distributions from tax-deferred accounts.30 The maxi-mum rate, which would rise with age, would be set to preserve the assetsso that they provide a nontrivial stream of retirement income until the prin-cipal’s death.
Such a system would provide four benefits. First, a substantial fractionof the retiree’s assets would be protected from high fees, from suboptimalinvestments, and from fraud. Second, the pooling of the assets in the safeharbor into a small number of investment vehicles would achieve scaleeconomies and might mitigate adverse selection problems in the case ofannuitized assets. Third, retirees would be at least partly constrained fromspending down their assets prematurely. Fourth, society at large wouldbenefit because household savings would cover a larger fraction of long-term care and other medical expenses.31
At first glance, the proposal just described may seem novel. But it isactually just a generalization of mandatory annuitization schemes that are
AGARWAL, DRISCOLL, GABAIX, and LAIBSON 87
29. This transfer to the safe harbor would occur just before early withdrawal penaltiesare terminated at age 591⁄2. The transfer would incur no penalty, since the assets wouldremain in the retirement savings system. Individuals who try to avoid the transfer to the safeharbor by prematurely withdrawing assets from their tax-deferred accounts would face a10 percent penalty.
30. Note that Roth IRAs are not currently covered by lifetime RMDs.31. Under the proposal made here, fewer assets could be transferred during one’s life-
time to one’s children, and so those assets would be available to cover some of the long-termcare costs that would otherwise be borne by Medicaid.
11941-03_Agarwal_rev2.qxd 1/26/10 11:30 AM Page 87
already commonplace in Europe, Latin America, and Asia (Antolin, Pugh,and Stewart 2008).
The proposal has two potential disadvantages. First, it would meaning-fully restrict individual choice by requiring households to invest some oftheir retirement savings in a limited menu of assets and by constrainingtheir consumption path. Second, it would create the potential for politicalmanipulation by empowering a regulator to select and monitor the assetmenu. As we argued above, an independent agency might be needed toinsulate the regulator.
V.H. Default Regulatory Approval: The Dietary Supplements Model
Up to this point we have focused on interventions that primarily targetthe individual investor. Regulations could instead target the financial prod-ucts themselves. One such regime would mimic the regulatory modelcurrently used for nutritional supplements: new financial products wouldbe allowed in the market without specific formal approval in advance butwould be monitored for adverse effects. The other, discussed in the nextsubsection, would require that new financial products obtain explicit regu-latory approval before being marketed.
The Dietary Supplement Health and Education Act of 1994 establisheda novel regulatory framework for nutritional supplements.32 Unlike foodadditives and drugs, dietary supplements do not need to be approved by theFood and Drug Administration (FDA) before being brought to market, norare they subject to formal requirements for ex ante safety and efficacy test-ing. Instead, the supplement manufacturer does its own due diligence,applying safety and marketing rules that have been established by the FDA.The manufacturer is responsible for ensuring that its supplement adheresto these established regulatory standards for safety and truthful labeling.The manufacturer does not even need to register the supplement with theFDA. The FDA is responsible for taking action against any unsafe supple-ments that it identifies in the marketplace. Under this system, dietary sup-plements thus have default regulatory approval.
Financial products could be regulated in much the same way. Safetyand quality standards would be established by the relevant regulator, typi-cally the SEC, and financial services firms would then evaluate their ownproducts to determine whether they comply with the standards. Such a sys-
88 Brookings Papers on Economic Activity, Fall 2009
32. Dietary supplements, also known as nutritional supplements, include vitamins, min-erals, botanical and herbal remedies, fiber, fatty acids, amino acids, and other substancesbelieved to improve health. The current regulatory regime is described on the FDA’s web-page “Dietary Supplements” (www.fda.gov/Food/DietarySupplements/default.htm).
11941-03_Agarwal_rev2.qxd 1/26/10 11:30 AM Page 88

tem would avoid the need for rigorous and time-consuming regulatoryreview for each new product and would encourage innovation.
Naturally, this system would work well only if the regulator could suc-cessfully identify socially optimal ex ante standards. This might be diffi-cult. Such standards would need to be based both on the characteristics ofthe product being marketed and on those of the buyer. For instance, prod-ucts that might be appropriate for young investors (such as equity-basedleveraged ETFs) might be deemed inappropriate for an 85-year-old retiree.
V.I. Mandatory Explicit Regulatory Approval
The final regulatory approach draws on the model currently used bythe FDA for drugs (as opposed to dietary supplements). New drugs mustundergo extensive, documented testing for safety and efficacy and maynot be sold until formally approved by the FDA. This testing takes yearsand is generally extremely costly to the pharmaceutical firm developingthe drug. Once approved, new drugs may be sold only by prescriptionuntil the FDA formally approves them, in a separate process, for over-the-counter sales.
Financial products could be made subject to such an ex ante reviewprocess and tested in small-scale trials much as drugs are today. For exam-ple, a new credit product could be offered (at regular cost) to 10,000 clientsduring a trial period. Their behavior could be studied anonymously, andthey could be anonymously surveyed about their experiences. The surveycould be designed by the financial regulator or outsourced to a third partymonitored by the regulator and could ask such questions as the following:
—Do you feel that this product generates value that exceeds the feesyou are paying for it?
—What are the fees on this product? (“Don’t know” would be anoption here.)
—Would you recommend this product to any of your friends?—In your view, should this product be approved for sale?Naturally, a product could be approved even if a sizable minority of
customers did not understand it or did not like it. However, if a largeenough fraction expressed reservations about its value or did not under-stand its costs, this would be grounds for further study and possibly rejec-tion. The regulator would try to judge the aggregate benefits and harmsgenerated by the product, recognizing the possibility that modest harm tomany consumers might be offset by large gains to a small number.
Such testing would be socially costly. It would delay the release ofnew products, increase costs for financial services firms, and discourage
AGARWAL, DRISCOLL, GABAIX, and LAIBSON 89
11941-03_Agarwal_rev2.qxd 1/26/10 11:30 AM Page 89

innovation. But it could also prevent the marketing of socially undesirableproducts. The net social benefit is not easy to evaluate.
Finally, note that testing could occur after a product has been released.For example, the regulator could be given the authority to compel a prod-uct’s developer to perform the analysis described above on products thathave been found after their introduction to be potentially problematic. Suchex post selection for testing might be superior to ex ante testing of all newproducts. Financial service firms would have an incentive to design prod-ucts that do not attract the potentially costly scrutiny of the regulator.
VI. Seven Open Questions for Future Research
This paper has undertaken three main tasks. First, we reported evidence thatolder adults experience substantial declines in cognitive function over time.Then, we reported evidence that economic behavior and economic mis-takes show strong age-based patterns in the cross section, even among apopulation of individuals who are screened to be prime borrowers. Finally,we discussed nine potential policy responses. We emphasized that we areagnostic about what regulatory interventions (if any) should be adopted.We do not think that the jury is in on many different dimensions of theproblem. Economic behavior among older adults is still poorly understood.Moreover, even if older adults are making substantial financial mistakes, itis not clear what a well-intentioned policymaker should do about it. Muchmore research is needed—including field experiments that study differentregulatory regimes—before the best solutions can be identified.33 In thisconcluding section we identify seven open questions that we hope aca-demic researchers and policymakers will consider as they wrestle withthese problems in the future.
First, how widespread and important are losses due to poor financialdecisionmaking? What fraction of aggregate wealth, and of the wealth ofolder adults, is lost because of poor choices? What are the utility costs?
In our analysis of economic behavior, we were able to study only a setof decisions with relatively moderate costs, such as credit card fees. Webelieve that these costs are just the tip of the iceberg. We studied these par-ticular transactions because the data are of good quality, but the bulk of themistakes that are probably being made lie elsewhere. Older adults makemany decisions with potentially enormous costs. Should I refinance my
90 Brookings Papers on Economic Activity, Fall 2009
33. The law and economics literature also studies those issues. See, for example, Bar-Gill (2009) and Marotta-Wurgler (2007).
11941-03_Agarwal_rev2.qxd 1/26/10 11:30 AM Page 90
home and draw down some of my equity? Should I buy a complicated(high-fee) annuity? Should I cash out my current annuity (paying a surren-der charge) so I can buy a better one? Should I invest a substantial fractionof my wealth in a high-return CD offered by a broker calling from an off-shore bank? Should I invest a substantial fraction in a structured financeproduct that has a high return and that I am assured is completely safe?Should I participate in a real estate investment pool with a minimuminvestment of $100,000?
Measuring and aggregating these costs is an important research pro-gram. To get a sense of how they might add up, consider a few quantitativeexamples. Wealth dissipation in the annuity market is estimated at about6 percent of the value of each annuity purchased, for a total of $16 billion in2008.34 Korniotos and Kumar (forthcoming-a) estimate that older investorswith accounts at a discount brokerage earn 3 percent less in risk-adjustedequity returns than middle-aged clients of the same broker. Even if the trueaggregate figure is just 0.3 percent of total financial assets held by olderadults, this would translate into $40 billion of underperformance per year.35
It is unclear whether these amounts are transfers between parties ordeadweight losses. As an order of magnitude for the stakes, Kenneth French(2008) estimates total fees paid in active financial management to be about0.7 percent of the market value of equity per year, which is equivalent toabout 0.7 percent of GDP. This may mostly be a deadweight loss, becausethe active traders (as well as the marketing experts who advertise thesefunds) could be productively engaged in other activities. The active tradersare engaged primarily in trying (usually unsuccessfully) to transfer wealthto their clients from other people. The transfers themselves are not a dead-weight loss, but the time spent attempting to achieve those transfers is.Physics Ph.D.s might be more usefully employed in labs rather than athedge funds.
Second, what demographic characteristics predict poor financial deci-sionmaking? In this paper we have used only data on age, but clearly otherdemographic measures (years of education, field of education) would be
AGARWAL, DRISCOLL, GABAIX, and LAIBSON 91
34. See LIMRA (formerly the Life Insurance and Market Research Association), “Annu-ity Sales Estimates, 1999–2008” (www.limra.com/PDFs/newscenter/databank/AnnuityEstimates99_08.pdf), for the volume of the annuities market. A typical commission on thesale of an annuity ranges from 6 to 12 percent of the face value of the contract. Annuitieswith small or zero commissions exist but represent a small part of the market.
35. The Federal Reserve estimates that households own financial assets worth about$40 trillion, excluding deposits (Flow of Funds, table B.100). The Survey of ConsumerFinances implies that 34 percent of that wealth is owned by households with a head age 65or older.
11941-03_Agarwal_rev2.qxd 1/26/10 11:30 AM Page 91

helpful. One would also like to know whether cognitive tests are predictiveof poor financial decisionmaking, and if so, what kinds of tests (knowl-edge-based, logic-based, or others). Is it possible to inexpensively andaccurately measure an individual’s current level of cognitive function or topredict future changes?
Third, to what extent do people anticipate their own cognitive decline orrecognize it when it happens? And if they do, are they able to delegate theirfinancial affairs or protect themselves in other ways (for example, bypolitely ending the conversation when they are solicited over the phone toattend a free lunch or investment seminar)? We do not know how malleableolder adults really are. One often hears anecdotes about aging widows whovaguely realize that they are experiencing some cognitive decline but stillfall prey to sophisticated and sociable brokers. Are these stories represen-tative? Or are the vast majority of older adults able to protect themselvesbecause they recognize their own vulnerability?
Fourth, does financial education help? Is it cost-effective? Is it relevantin a changing financial environment? As discussed above, the evidence onthe impact of financial education is mixed and not particularly encourag-ing. For example, Agarwal and others (2009) find that mortgage counsel-ing does not help consumers choose lower-risk mortgage products.
Fifth, do third parties help? Who should be empowered to serve asan external adviser or decisionmaker? A family member? a friend? anindependent trustee?36 Family members sometimes make problematictrustees—as illustrated in cases ranging from King Lear to BrookeAstor—but how prevalent are such problems? What is the evidence on theeffectiveness of different types of trustee? How does the market for fidu-ciaries operate?
Sixth, what is the market response to this situation, and does it help orhurt? There are theoretical reasons to worry that the market mechanismmight be inefficient in the market for advice. Advice markets suffer by def-inition from information asymmetries between providers and recipients(see the survey in Dulleck and Kerschbamer 2006). In markets with inat-tentive consumers and shrouded attributes (Gabaix and Laibson 2006),perverse situations with high fees can persist as bona fide economic equi-libria when there are enough naive consumers and the only profitable busi-ness model is to offer a product with low base prices and high “surprise”fees. How important empirically are these perverse market equilibria? Areprofessional fiduciaries trustworthy or not? There is much anecdotal evi-
92 Brookings Papers on Economic Activity, Fall 2009
36. See Li (2009) for empirical evidence on financial advice by family members.
11941-03_Agarwal_rev2.qxd 1/26/10 11:30 AM Page 92
dence of problems, for example of outrageously high fees, but a systematicquantification is needed.
Finally, what is the appropriate regulatory response? If the market forthird-party advice and fiduciary services functioned well, the marketequilibrium would have three phases. Early in life, each individual wouldwrite a plan for his or her future consumption and investment, contingenton major events (including cognitive decline). Then, cognitive testingand observation would monitor the individual for the onset of significantcognitive decline. Finally, once this prespecified threshold has beencrossed, the original contingent plan would be enforced by a fiduciary, orthe individual’s assets would be placed in a financial instrument with a state-contingent payout scheme. Indeed, the market already provides financialproducts with this feature: for example, annuities eliminate complex assetdecumulation decisions. More sophisticated institutions will be designed.However, for all of the reasons reviewed in this paper, the unregulatedmarket solution may not work well. Government intervention is proba-bly desirable, but the ideal form of that intervention remains unclear.More empirical analysis and field experiments are needed to identify theregulatory response that best balances the marginal costs against thepotential benefits.
A P P E N D I X
Data Description
Eureka Moments
We use a proprietary panel dataset with data from several large financialinstitutions, later acquired by a single financial institution that madebalance transfer offers nationally. The offers were not made conditionalon closing the old credit card account. The dataset contains informationon 14,798 individuals who accepted such balance transfer offers overthe period January 2000 through December 2002. The bulk of the dataconsists of the main billing information listed on each account’s monthlystatement, including total payment, spending, credit limit, balance, debt,purchase APRs, cash advance APRs, and fees paid. We also observe theamounts of all balance transfers, the start and end dates of the balancetransfer teaser rate offer, and the initial teaser APR on the balance transfer.At a quarterly frequency, we observe each customer’s credit bureau rating(FICO) score and a proprietary (internal) credit “behavior” score. We have
AGARWAL, DRISCOLL, GABAIX, and LAIBSON 93
11941-03_Agarwal_rev2.qxd 1/26/10 11:30 AM Page 93

credit bureau data about the number of other credit cards held by eachaccountholder, total credit card balances, and mortgage balances. We alsohave data on the age, sex, and income of the accountholder, collected whenthe account was opened. In this sample, borrowers did not pay a fee for bal-ance transfers.
Home Equity Loans and Lines of Credit
We use a proprietary panel dataset constructed from records from a nationalfinancial institution that has issued home equity loans and home equity linesof credit. This lender has not specialized in subprime loans or other marketsegments. Between March and December 2002, the lender offered a menuof standardized contracts for home equity credit.37 Consumers chose eithera loan or a credit line, either a first or a second lien, and an incrementalloan amount, which, given an estimate of the property’s value, resulted in anLTV ratio of less than 80 percent, between 80 and 90 percent, or between90 and 100 percent. Thus, in effect, the lender offered 12 different contractchoices.38 We ran separate regressions for home equity loans and lines ofcredit, conditioning in each case on not having a first mortgage and on theLTV ratio categories described above; hence, we control for contract type.All loans have the same five-year maturity. For 75,000 such contracts, weobserve the contract terms, demographic information about the borrower(age, years at current job, and home tenure), financial information (incomeand debt-to-income ratio), and risk characteristics (FICO score and LTV).39
We also observe the borrower’s estimate of the property’s value and theloan amount requested.
94 Brookings Papers on Economic Activity, Fall 2009
37. Other interest rates in the economy varied considerably during this time period. Onemight therefore ask whether the age results we report are an artifact of borrowers of differentages happening to disproportionately borrow earlier or later in the sample. We observe nopattern in the distribution by month of borrowing by age over the sample. In alternative versionsof the regressions including dummy variables for the month of loan origination, we obtainnearly identical results.
38. We focus on APRs across contracts for four reasons. First, the contracts in thedataset do not differ in points (origination fees as a percent of the loan) charged or in othercharges to the borrower. Second, we verified that even conditioning on contract choice,some borrowers pay higher APRs than others. Third, we controlled for borrower risk char-acteristics. Fourth, we show in the paper that the residual variation in APRs is explained bythe propensity to make an identifiable mistake in the loan acquisition process.
39. We do not have internal behavior scores (a supplementary credit risk score) for theseborrowers. Such scores are performance based and are thus not available at loan origination.
11941-03_Agarwal_rev2.qxd 1/26/10 11:30 AM Page 94
Auto Loans
We use a proprietary dataset of auto loans originated at several largefinancial institutions that were later acquired by another institution. Thedataset comprises observations on 6,996 loans originated for the pur-chase of new and used automobiles. Observed loan characteristics includethe automobile’s value and age, the loan amount and LTV, the monthlypayment, the contract rate, and the date of origination. Observed bor-rower characteristics include credit score, monthly disposable income,and age.
Mortgages
We use a proprietary dataset from a large financial institution that originatesfirst mortgages in Argentina. Using data from another country providessuggestive evidence about the international applicability of our findings.The dataset covers 4,867 owner-occupied, fixed-rate, first mortgage loansoriginated between June 1998 and March 2000 and observed throughMarch 2004. We observe the original loan amount, the LTV and appraisedhome value at origination, and the APR. We also observe borrower finan-cial characteristics (including income, second income, years on the job,and wealth measures such as second home ownership, car ownership, andcar value), risk characteristics (the borrower’s Veraz score—a credit scoresimilar to the U.S. FICO score—and mortgage payments as a percentageof after-tax income), and demographic characteristics (age, sex, and mari-tal status).
Small Business Credit Cards
We use a proprietary dataset of small business credit card accounts orig-inated at several large institutions that issued such cards nationally. Theinstitutions were later acquired by a single institution. The panel datasetcovers 11,254 accounts originated between May 2000 and May 2002. Mostof the businesses are very small, are owned by a single family, and have nopublic financial records. The dataset has all the information collected at thetime of account origination, including the business owner’s self-reportedpersonal income, the number of years the business has been in operation,and the age of the business owner. We also observe the quarterly creditbureau score of the business owner.
AGARWAL, DRISCOLL, GABAIX, and LAIBSON 95
11941-03_Agarwal_rev2.qxd 1/26/10 11:30 AM Page 95

Credit Card Fees
We use a proprietary panel dataset from several large financial institutionsthat offered credit cards nationally; these institutions were later acquiredby a larger financial institution. The dataset contains a representative ran-dom sample of about 128,000 credit card accounts followed monthly overa 36-month period from January 2002 through December 2004.40 The bulkof the data consists of the main billing information listed on each account’smonthly statement, including total payments, spending, credit limit, bal-ance, debt, APRs on purchases and cash advances, and fees paid. At aquarterly frequency, we observe each customer’s credit bureau (FICO)score and a proprietary (internal) credit “behavior” score. For each card-holder we have credit bureau data on the number of other credit cards held,total credit card balances, and mortgage balances. We also have data on theage, sex, and income of the cardholder, collected when the account wasopened. Further details, including summary statistics, are available in theonline appendix.
ACKNOWLEDGMENTS Xavier Gabaix and David Laibson acknowledgesupport from the National Science Foundation (DMS-0527518). Laibsonacknowledges financial support from the National Institute on Aging (R01-AG-021650, R01-AG-1665, P30-AG-012810). The views expressed in thispaper are those of the authors and do not represent the policies or positions ofthe Board of Governors of the Federal Reserve System or the Federal ReserveBank of Chicago. For their helpful comments we thank the editors and MarcoBasetto, John Beshears, Stephane Bonhomme, James Choi, David Cutler, Gio-vanni Dell’Ariccia, Ray Fair, Luigi Guiso, Gur Huberman, Erik Hurst, BrigitteMadrian, Ulrike Malmendier, Karen Pence, Mitchell Petersen, Richard Rosen,Timothy Salthouse, Fiona Scott-Morton, Jesse Shapiro, William Sharpe, PaoloSodini, Nicholas Souleles, Richard Suzman, Jonathan Zinman, and partici-pants at various conferences and seminars. We thank Jacqueline Barrett andKyle Chauvin for excellent research assistance.
96 Brookings Papers on Economic Activity, Fall 2009
40. The credit cards do not have annual fees and do not differ in terms of rewards pointsor other benefits.
11941-03_Agarwal_rev2.qxd 1/26/10 11:30 AM Page 96
References
Agarwal, Sumit. 2007. “The Impact of Homeowners’ Housing Wealth Misestima-tion on Consumption and Saving Decisions.” Real Estate Economics 35, no. 2:135–54.
Agarwal, Sumit, Souphala Chomsisengphet, Chunlin Liu, and Nicholas S.Souleles. 2006. “Do Consumers Choose the Right Credit Contracts?” Workingpaper. Federal Reserve Bank of Chicago.
Agarwal, Sumit, John C. Driscoll, Xavier Gabaix, and David Laibson. 2008.“Learning in the Credit Card Market.” Working Paper no. 13822. Cambridge,Mass.: National Bureau of Economic Research (February).
Agarwal, Sumit, Gene Amromin, Itzhak Ben-David, Souphala Chomsisengphet,and Douglas D. Evanoff. 2009. “Do Financial Counseling Mandates ImproveMortgage Choice and Performance? Evidence for a Legislative Experiment.”Working paper. Federal Reserve Bank of Chicago.
Aguiar, Mark, and Erik Hurst. 2007. “Life-cycle Prices and Production.” AmericanEconomic Review 97, no. 5: 1533–59.
Alesina, Alberto, and Annamaria Lusardi. 2006. “Driving Your Financial Invest-ment? Perhaps a License Is Needed.” Vox of Dartmouth 25, no. 2 (July 24).
Antolin, P., C. Pugh, and F. Stewart. 2008. “Forms of Benefit Payment at Retire-ment.” OECD Working Papers on Insurance and Private Pensions no. 26. Paris:OECD Publishing.
Ausubel, Lawrence M. 1991. “The Failure of Competition in the Credit Card Mar-ket.” American Economic Review 81, no. 1: 50–81.
Bar-Gill, Oren. 2009. “The Law, Economics and Psychology of Subprime Mort-gage Contracts.” Cornell Law Review 94, no. 5: 1073–1115.
Ben-David, Itzhak. 2008. “Manipulation of Collateral Values by Borrowers andIntermediaries.” Working paper. University of Chicago Graduate School ofBusiness.
Benjamin, Daniel J., Sebastian A. Brown, and Jesse M. Shapiro. 2006. “Who Is‘Behavioral’? Cognitive Ability and Anomalous Preferences.” Working paper.University of Chicago and Harvard University.
Beshears, John, James J. Choi, David Laibson, and Brigitte C. Madrian. 2008.“The Importance of Default Options for Retirement Saving Outcomes: Evi-dence from the USA.” In Lessons from Pension Reform in the Americas, editedby Stephen J. Kay and Tapen Sinha. Oxford University Press.
———. 2009a. “How Does Simplified Disclosure Affect Individuals’ Mutual FundChoices?” Working Paper no. 09-05. Yale International Center for Finance(March).
———. 2009b. “The Limits of Defaults.” Harvard University.Bucks, Brian, and Karen Pence. 2006. “Do Homeowners Know Their House Val-
ues and Mortgage Terms?” Finance and Economics Discussion Paper Series.Washington: Federal Reserve Board.
Campbell, John Y. 2006. “Household Finance.” Journal of Finance 61, no. 4(August): 1553–1604.
AGARWAL, DRISCOLL, GABAIX, and LAIBSON 97
11941-03_Agarwal_rev2.qxd 1/26/10 11:30 AM Page 97

Carstensen, Laura L. 2006. “The Influence of a Sense of Time on Human Devel-opment.” Science 312, no. 5782 (June): 1913–15.
Cattell, Raymond B., ed. 1987. Intelligence: Its Structure, Growth and Action.New York: Elsevier.
Charles, Kerwin Kofi, Erik Hurst, and Melvin Stephens, Jr. 2008. “Rates for Vehi-cle Loans: Race and Loan Source.” American Economic Review, Papers andProceedings 98, no. 2: 315–20.
Choi-Allum, Lona. 2009. “Protecting Older Investors: 2009 Free Lunch SeminarReport.” Washington: AARP.
Choi, James J., David Laibson, Brigitte C. Madrian, and Andrew Metrick. 2002.“Defined Contribution Pensions: Plan Rules, Participant Choices, and the Pathof Least Resistance.” Tax Policy and the Economy 16: 67–114.
Choi, James J., David Laibson, and Brigitte C. Madrian. 2005. “Are Empower-ment and Education Enough? Underdiversification in 401(k) Plans.” BPEA,no. 2: 151–98.
———. 2007. “$100 Bills on the Sidewalk: Suboptimal Investment in 401(k)Plans.” Working Paper no. 11554 (revised). Cambridge, Mass.: NationalBureau of Economic Research (December).
DellaVigna, Stefano, and Ulrike Malmendier. 2004. “Contract Design and Self-Control: Theory and Evidence.” Quarterly Journal of Economics 119, no. 2:353–402.
Denburg, N., D. Tranel, and A. Bechara. 2005. “The Ability to Decide Advan-tageously Declines Prematurely in Some Normal Older Persons.” Neuro-psychologia 43, no. 7: 1099–1106.
Dulleck, Uwe, and Rudolf Kerschbamer. 2006. “On Doctors, Mechanics, andComputer Specialists: The Economics of Credence Goods.” Journal of Eco-nomic Literature 44, no. 1: 5–42.
Ferri, Cleusa P., Martin Prince, Carol Brayne, Henry Brodaty, Laura Fratiglioni,Mary Ganguli, Kathleen Hall, Kazuo Hasegawa, Hugh Hendrie, YueqinHuang, Anthony Jorm, Colin Mathers, Paulo R. Menezes, Elizabeth Rimmer,and Marcia Scazufca. 2005. “Global Prevalence of Dementia: A Delphi Con-sensus Study.” The Lancet 366(9503) (December): 2112–17.
Flynn, James R. 1984. “The Mean IQ of Americans: Massive Gains 1932 to1978.” Psychological Bulletin 95, no. 1 (January): 29–51.
Fratiglioni, L., D. De Ronchi, and H. Agüero Torres. 1999. “Worldwide Preva-lence and Incidence of Dementia.” Drugs & Aging 15, no. 5 (November):365–75.
Frederick, Shane. 2005. “Cognitive Reflection and Decision Making.” Journal ofEconomic Perspectives 19, no. 4 (Fall): 25–42.
French, Kenneth R. 2008. “The Cost of Active Investing.” Journal of Finance 63,no. 4: 1537–73.
Gabaix, Xavier, and David Laibson. 2006. “Shrouded Attributes, ConsumerMyopia, and Information Suppression in Competitive Markets.” QuarterlyJournal of Economics 121, no. 2 (May): 505–40.
98 Brookings Papers on Economic Activity, Fall 2009
11941-03_Agarwal_rev2.qxd 1/26/10 11:30 AM Page 98
Galenson, David W. 2006. Old Masters and Young Geniuses: The Two Life Cyclesof Artistic Activity. Princeton University Press.
Gourinchas, Pierre-Olivier, and Jonathan A. Parker. 2002. “Consumption over theLife Cycle.” Econometrica 70, no. 1 (January): 47–89.
Graham, John R., Campbell R. Harvey, and Manju Puri. 2008. “Managerial Atti-tudes and Corporate Actions.” Working paper. Fuqua School of Business,Duke University.
Heidhues, Paul, and Botond Koszegi. 2009. “Exploiting Naivete about Self-Control in the Credit Market.” Working paper. University of California, Berke-ley, and University of Bonn.
Jones, Benjamin F. 2005. “Age and Great Invention.” Working Paper no. 11359.Cambridge, Mass.: National Bureau of Economic Research (May).
———. 2008. “Superior Information or a Psychological Bias? A Unified Frame-work with Cognitive Abilities Resolves Three Puzzles.” Working paper.Federal Reserve Board and University of Texas (www.aeaweb.org/annual_mtg_papers/2009/).
Korniotis, George M., and Alok Kumar. Forthcoming-a. “Do Older InvestorsMake Better Investment Decisions?” Review of Economics and Statistics.
———. Forthcoming-b. “Cognitive Abilities, Investor Sophistication, and Invest-ment Decisions.” Chapter 30 in Behavioral Finance, edited by H. Kent Bakerand John R. Nofsinger. John Wiley & Sons.
Langa, Kenneth M., Brenda L. Plassman, Robert B. Wallace, A. Regula Herzog,Steven G. Heeringa, Mary Beth Ofstedal, James R. Burke, Gwenith G. Fisher,Nancy H. Fultz, Michael D. Hurd, Guy G. Potter, Willard L. Rodgers, David C.Steffens, David R. Weir, and Robert J. Willis. 2005. “The Aging, Demograph-ics, and Memory Study: Study Design and Methods.” Neuroepidemiology 25,no. 4: 181–91.
Li, Geng. 2009. “Information Sharing and Stock Market Participation: Evidencefrom Extended Families.” Working paper. Washington: Federal ReserveBoard.
Lusardi, Annamaria, and Olivia S. Mitchell. 2006. “Financial Literacy and Plan-ning: Implications for Retirement Wellbeing.” DNB Working Paper 078.Amsterdam: De Nederlandsche Bank.
———. 2007. “Financial Literacy and Retirement Preparedness: Evidence andImplications for Financial Education.” Business Economics 42, no. 1 (January):35–44.
Madrian, Brigitte C., and Dennis F. Shea. 2001a. “The Power of Suggestion: Iner-tia in 401(k) Participation and Savings Behavior.” Quarterly Journal of Eco-nomics 116, no. 4 (November): 1149–87.
———. 2001b. “Preaching to the Converted and Converting Those Taught: Finan-cial Education in the Workplace.” Working paper. University of Chicago.
Malmendier, Ulrike, and Stefan Nagel. 2007. “Depression Babies: Do Macro-economic Experiences Affect Risk-Taking?” Working paper. University ofCalifornia, Berkeley.
AGARWAL, DRISCOLL, GABAIX, and LAIBSON 99
11941-03_Agarwal_rev2.qxd 1/26/10 11:30 AM Page 99

Malmendier, Ulrike, and Devin Shanthikumar. 2007. “Are Small Investors Naiveabout Incentives?” Journal of Financial Economics 85, no. 2 (August): 457–89.
Marotta-Wurgler, Florencia. 2007. “What’s in a Standard Form Contract? AnEmpirical Analysis of Software License Agreements.” Journal of EmpiricalLegal Studies 4, no. 4: 677–713.
Mather, Mara, and Laura L. Carstensen. 2005. “Aging and Motivated Cognition:The Positivity Effect in Attention and Memory.” Trends in Cognitive Sciences9, no. 10: 496–502.
McArdle, John J., James P. Smith, and Robert Willis. Forthcoming. “Cognitionand Economic Outcomes in the Health and Retirement Survey.” In Explo-rations in the Economics of Aging, edited by David Wise. Cambridge, Mass.:National Bureau of Economic Research.
Mottola, Gary R., and Stephen P. Utkus. 2007. “Lump Sum or Annuity? AnAnalysis of Choice in DB Pension Payouts.” Valley Forge, Pa.: Vanguard Cen-ter for Retirement Research (November).
Mullainathan, Sendhil, and Andrei Shleifer. 2005. “The Market for News.” Amer-ican Economic Review 95, no. 4: 1031–53.
Murphy, Kevin M., and Finis Welch. 1990. “Empirical Age-Earnings Profiles.”Journal of Labor Economics 8, no. 2: 202–29.
Ofstedal, Mary Beth, Gwenith G. Fisher, and A. Regula Herzog. 2005. “Docu-mentation of Cognitive Functioning Measures in the Health and RetirementStudy.” HRS Documentation Report DR-006. University of Michigan (March).
Park, Denise, and Norbert Schwarz, eds. 2000. Cognitive Aging: A Primer. Psy-chology Press.
Plassman, Brenda L., Kenneth M. Langa, Gwenith G. Fisher, Steven G. Heeringa,David R. Weir, Mary Beth Ofstedal, James R. Burke, Michael D. Hurd, Guy G.Potter, Willard L. Rodgers, David C. Steffens, John J. McArdle, Robert J.Willis, and Robert B. Wallace. 2008. “Prevalence of Cognitive Impairmentwithout Dementia in the United States.” Annals of Internal Medicine 148, no. 6(March 18): 427–34.
Poterba, James, Steven Venti, and David A. Wise. 2008. “New Estimates of theFuture Path of 401(k) Assets.” Tax Policy and the Economy 22: 43–80.
Salthouse, Timothy A. 2005. “Effects of Aging on Reasoning.” In The CambridgeHandbook of Thinking and Reasoning. Cambridge University Press.
———. Forthcoming. “Executive Functioning.” In Cognitive Aging: A Primer,2nd ed., edited by D. C. Park and N. Schwarz. London: Psychology Press.
Salthouse, Timothy A., David H. Schroeder, and Emilio Ferrer. 2004. “EstimatingRetest Effects in Longitudinal Assessments of Cognitive Functioning in Adultsbetween 18 and 60 Years of Age.” Developmental Psychology 40, no. 5: 813–22.
Scholnick, Barry, Nadia Massoud, and Anthony Saunders. 2008. “The Impact ofWealth on Inattention: Evidence from Credit Card Repayments?” WorkingPaper 2008-10. Arlington, Va.: FDIC Center for Financial Research.
Scott Morton, Fiona, Florian Zettelmeyer, and Jorge Silva-Risso. 2003. “ConsumerInformation and Discrimination: Does the Internet Affect the Pricing of New
100 Brookings Papers on Economic Activity, Fall 2009
11941-03_Agarwal_rev2.qxd 1/26/10 11:30 AM Page 100

Cars to Women and Minorities?” Quantitative Marketing and Economics 1,no. 1: 65–92.
Shue, Kelly, and Erzo F. P. Luttmer. 2009. “Who Misvotes? The Effect of Differ-ential Cognition Costs on Election Outcomes.” American Economic Journal:Economic Policy 1, no.1: 229–57.
Shui, Haiyan, and Lawrence M. Ausubel. 2005. “Time Inconsistency in the CreditCard Market.” Working paper. University of Maryland.
Simonton, D. K. 1988. “Age and Outstanding Achievement: What Do We Knowafter a Century of Research?” Psychological Bulletin 104, no. 2: 251–67.
Spiegler, Ran. 2006. “The Market for Quacks.” Review of Economic Studies 73,no. 4: 1113–31.
Stango, Victor, and Jonathan Zinman. 2009. “Exponential Growth Bias and House-hold Finance.” Journal of Finance (forthcoming).
Thaler, Richard H., and Shlomo Benartzi. 2004. “Save More Tomorrow: UsingBehavioral Economics to Increase Employee Saving.” Journal of PoliticalEconomy 112, no. 1, part 2: S164–87.
Thaler, Richard H., and Cass R. Sunstein. 2003. “Libertarian Paternalism.” Amer-ican Economic Review, Papers and Proceedings 93, no. 2 (May): 175–79.
———. 2008. Nudge: Improving Decisions about Health, Wealth, and Happiness.Yale University Press.
Weinberg, Bruce A., and David W. Galenson. 2005. “Creative Careers: The LifeCycle of Nobel Laureates in Economics.” Working Paper no. 11799. Cam-bridge, Mass.: National Bureau of Economic Research.
Willis, Robert J. 2007. “Cognitive Economics and Human Capital.” PresidentialAddress to the Society of Labor Economists, Chicago, May.
Zinman, Jonathan. 2007. “Where Is the Missing Credit Card Debt? Clues andImplications.” Discussion Paper 07-11. Federal Reserve Bank of Philadelphia.
AGARWAL, DRISCOLL, GABAIX, and LAIBSON 101
11941-03_Agarwal_rev2.qxd 1/26/10 11:30 AM Page 101

1. The views expressed in this paper are those of the author and do not necessarily rep-resent those of the International Monetary Fund.
102
Comments and Discussion
COMMENT BYGIOVANNI DELL’ARICCIA1 Those whom the gods love die young.Yet we grow old always learning new and interesting things. This paper bySumit Agarwal, John Driscoll, Xavier Gabaix, and David Laibson doessome justice to both these statements. And like all good economic papers,it identifies a trade-off. You can be young and foolish: at the peak of yourcognitive abilities, but also very ignorant. Or you can be old and a bit slow:having accumulated a lot of experience, but with depleted analytical capital.In the middle is an “age of reason” at which you have learned enough andare still able to exploit your experience and to process new information.The paper argues that these dynamics are reflected in a life-cycle pattern offinancial mistakes and performance. Its findings are relevant from a policyperspective, especially given the continuing aging of the population in mostadvanced economies. But I suspect they will be intriguing (and a bit scary)even for those who are not particularly interested in economic policymakingor behavioral finance.
I will structure my comments as follows. First, I will attempt to providealternative explanations for the main empirical patterns identified in thepaper. The authors present relatively convincing evidence linking the life-cycle pattern of high interest rates paid and other financial mistakes toprogressive cognitive decline. However, it is worth exploring whether aframework that does not rely on bounded rationality can produce a similarpattern. In particular, I will focus on whether more standard, industrialorganization–based stories can deliver similar results. Second, I will delveinto how such a framework can explain the paper’s two most convincing
11941-04_Agarwal Comment_rev.qxd 1/26/10 11:31 AM Page 102

COMMENTS and DISCUSSION 103
pieces of empirical evidence: the “eureka moments” on credit card balancetransfers and the “rate-changing mistakes” on home equity loan applications.Finally, I will briefly discuss the paper’s policy implications.
The paper hypothesizes that net cognitive performance is hump-shapedwith respect to age. This results from assuming that performance is deter-mined by the sum of analytical capital, which declines linearly with age, andexperiential capital, which rises with age but exhibits diminishing returns.The question is whether other plausible stories or models can produce asimilar U-shaped life-cycle pattern in the pricing of financial products. I will propose two such stories, both of which borrow elements from theliterature on relationship lending. The first examines how age can affectthe expected value of a bank-borrower relationship. The second looks athow a bank’s ability to extract rents from a borrower may vary with theborrower’s age. These models are not meant to be realistic or particularlysophisticated. They are just simple examples of how some of the empiricalevidence in the paper could be explained with models of bank competitionthat do not rely on bounded rationality.
Banks value lending relationships. One reason may be that having arelationship with a customer makes it easier to sell additional products tothat customer. Or, in a more complex model, it may be that relationshipsallow banks to gather valuable private information about the borrower.This can explain the widespread practice of offering introductory teaserrates on credit cards and other loans,2 and that of offering attractive termsto borrowers willing or likely to buy multiple products. For example,according to the president of one major bank, in Europe before the cur-rent crisis the margin on prime mortgages was so low that banks werelosing money on them. However, selling those mortgages brought in newcustomers who would then buy wealth management services, tradingservices, and the like.
Relationships, however, are not forever. They can be broken by exogenousshocks, such as changes in the preferences or needs of the customer, or whenthe customer moves or dies. The longer the expected life of a relationship,the greater its value. The value of a relationship will also depend on thedegree to which it allows the bank to extract rents from the customer. Thehigher the switching costs and informational barriers that prevent competinglenders from successfully poaching each other’s customers, the more arelationship is worth.
2. See Petersen and Rajan (1995) for evidence of how bank market power affects intro-ductory rates.
11941-04_Agarwal Comment_rev.qxd 1/26/10 11:31 AM Page 103

104 Brookings Papers on Economic Activity, Fall 2009
Consider now the following barebones model. Two banks compete onthe interest rate to extend loans to customers of equal creditworthiness butdifferent ages. Banks obtain profits from these loans but also benefit fromestablishing a relationship with the customer. Relationships, however, canbe broken with probability θ by the death of the customer, or with proba-bility µ by some other exogenous shock such as the customer moving to adifferent state. θ is obviously increasing with age. But it is reasonable toassume that µ is decreasing with age, since, for example, older people areless likely to change jobs (left-hand panel of figure 1). Then, normalizingthe bank’s cost of funds to 1, the profit from extending a loan at a grossinterest rate r is
where ϕ is the probability that the borrower will repay the loan, δ is thediscount factor, and V is the value of the relationship. With Bertrand com-petition driving profits to zero, in equilibrium we have
which, for a broad range of distribution functions for θ and µ, delivers a U-shaped life-cycle pattern for interest rates consistent with the evidence
ˆ ,rV
=− −( ) −( )1 1 1δ θ μ
ϕ
ϕ δ θ μr V− + −( ) −( )1 1 1 ,
Source: Authorís model described in the text.
Percent
Age Age
Mortality rate, θ Probability of anexogenousinterruption ofthe relationship
Probability of otherexogenousinterruptionof the relationship, µ
Figure 1. A Model of the Bank-Customer Relationship over the Life Cycle
11941-04_Agarwal Comment_rev.qxd 1/26/10 11:31 AM Page 104

COMMENTS and DISCUSSION 105
in the paper (right-hand panel of figure 1). However, in this case theage-dependent pattern reflects changes in the probability of an exogenousinterruption of the relationship rather than cognitive decline. If, in addition,one assumes that middle-aged clients are those most likely to be interestedin multiple banking products (so that V follows a hump-shaped patternwith respect to age), this pattern is reinforced further.
A model of bank competition under asymmetric information can delivera similar pattern. Consider another simple framework where banks learnabout their clients’ creditworthiness over the course of a relationship.3
Further, assume that a portion λ of these borrowers are captives of theirbank in that they find it difficult to signal their credit quality to competinglenders. It follows that inside lenders will charge the monopoly interestrate, R, to the captive borrowers but will be forced to offer the competitiverate, r, to those borrowers that can signal their quality. The average rateobserved on the market will then be a function of the proportion of captiveborrowers, r* = λR + (1 − λ)r. It is also reasonable to assume that the pro-portion of captive borrowers is a function of age: young borrowers withlimited track records and credit histories, and older borrowers with fewcurrent transactions, may find it more difficult than middle-aged borrowersto signal their quality. Then, consistent with the evidence in the paper,the average interest rate charged to borrowers will follow a U-shapedpattern with respect to age.
These simple models show that a U-shaped pattern of interest rateswith respect to age can be generated with models of bank competition,without resorting to unconventional assumptions. I now turn to the twomost convincing pieces of empirical evidence in the paper: the eurekamoments on credit card balance transfers and the rate-changing mistakeson home equity loan applications. For these, my task is more difficult.
Let me start with the eureka moments. A set of borrowers are offeredthe opportunity to transfer their current credit card balances to a new cardcharging a very low (teaser) interest rate on the transferred balance for alimited period. The catch is that new purchases on the new card face ahigh APR, and payments on the new card are credited first to the trans-ferred (low APR) balance. In that case the optimal strategy is to takeadvantage of the low-interest-rate offer by transferring existing balancesbut to continue to use the old card for new purchases. And the evidencein the paper shows, after controlling for individual factors, that the per-
3. This is a common assumption in models of competition under asymmetric information.See, for example, Sharpe (1990) and Dell’Ariccia and Marquez (2004).
11941-04_Agarwal Comment_rev.qxd 1/26/10 11:31 AM Page 105
centage of borrowers that actually follow this strategy has a hump-shapedpattern with respect to age. Put differently, a higher proportion of middle-aged than of younger and older borrowers discover the optimal strategyand put it into practice.
The simple models described above cannot immediately explain thispattern of financial mistakes. Yet they are not necessarily irrelevant to theissue. Consider the following argument. The paper implicitly assumes thatthe interest rate charged on new purchases with the new card is higher thanthe rate paid on the old credit card. If this is true, the proposed strategy isindeed optimal. If not, things are more complicated, and it may be optimalfor borrowers to use the new card for at least some purchases. But theauthors’ dataset lacks information on the interest rates borrowers werepaying on their old cards. Consistent with the models above, it is notunreasonable to assume that middle-aged people on average pay lower rateson their existing credit cards and have greater access to low-interest-ratecredit cards or other low-cost sources of funds generally. Then the eurekamoment result could be explained in terms of a heterogeneity of optimalstrategies rather than of cognitive abilities. In fact, without informationabout the rates paid on the old cards, the two explanations are observation-ally equivalent.
Now let me turn to the evidence on rate-changing mistakes. Theauthors find that the average interest rate paid by borrowers on homeequity loans follows the by-now-familiar U-shaped pattern with respect toage. However, the pattern disappears for borrowers that provide a correctestimate of the value of their home. Put differently, conditional on borrow-ers applying for the “right” loan (one with the loan-to-value ratio appropri-ate for their home), the interest rate they are charged is roughly constantwith respect to age. What drives the age pattern is the larger percentageof younger and older applicant borrowers who grossly underestimate thevalue of their home.
This is the strongest piece of evidence in support of the authors’ hypoth-esis, and it is especially difficult to explain with an industrial organization-based model. Of course, one could argue that some borrowers make moremistakes not because they are cognitively impaired or less experienced, butbecause they have fewer opportunities to learn. For instance, borrowerswho interact more often with the banking system might receive multipleloan offers and consequently have a more accurate estimate of the value oftheir home. This group might consist disproportionately of middle-agedborrowers. Alternatively, it might be that loan officers are more willing tosuggest the optimal strategy to their more valuable customers, who are again
106 Brookings Papers on Economic Activity, Fall 2009
11941-04_Agarwal Comment_rev.qxd 1/26/10 11:31 AM Page 106

disproportionately those of middle age. But these assumptions are far fromstandard and represent a much more convoluted explanation of the evidencethan the cognitive decline model.
Finally, I want to turn briefly to the policy implications of the paper.Obviously these depend on the mechanism one believes is at play. I believethe authors present convincing evidence that cognitive decline is at leastpartly responsible for the documented life-cycle pattern in financial perfor-mance. That said, the authors are rightly cautious when it comes to policyrecommendations. In addition to the alternative possible explanations forthe evidence (such as those discussed above), there is the question of howeconomically significant the identified age effects are. The paper reportsrelatively small economic damages associated with aging, which wouldnot by themselves justify ad hoc regulatory intervention. However, as theauthors argue, these costs may be the tip of the iceberg. Financial vulnera-bility in old age is a much broader issue, including exposure to outrightfraud that can put one’s entire life savings at risk.
Perhaps more important, several of the more paternalistic proposalsin the paper can infringe on individual freedom. This raises two questions.The first is one of principle: Should society constrain an individual’s right tocontrol her own wealth just because she belongs to a group that is statisti-cally more likely to make financial mistakes? What if similar results werefound for groups identified by sex, or ethnicity, or education? The secondquestion is a practical one: Several of the policies discussed in the paperwould likely be difficult to implement, or politically infeasible, or both.After all, as Karen Pence documents in her discussion of this paper, theUnited States imposes very few restrictions on driving by senior citizens,even though the externalities are far more evident. That said, the evidencein the paper could be safely used to provide guidance for resource allocationin the context of consumer protection programs. For example, educationand efforts against predatory lending could be targeted to more vulnerableareas and groups.
REFERENCES FOR THE DELL’ARICCIA COMMENT
Dell’Ariccia, Giovanni, and Robert Marquez. 2004. “Information and Bank CreditAllocation.” Journal of Financial Economics 72, no. 1: 185–214.
Petersen, Mitchell A., and Raghuram G. Rajan. 1995. “The Effect of Credit MarketCompetition on Lending Relationships.” Quarterly Journal of Economics 110,no. 2: 407–43.
Sharpe, Steven A. 1990. “Asymmetric Information, Bank Lending, and ImplicitContracts: A Stylized Model of Customer Relationships.” Journal of Finance45, no. 4: 1069–87.
COMMENTS and DISCUSSION 107
11941-04_Agarwal Comment_rev.qxd 1/26/10 11:31 AM Page 107

COMMENT BYKAREN M. PENCE Older and younger individuals are more likely topay higher prices for financial products than individuals in their middleyears. Sumit Agarwal, John Driscoll, Xavier Gabaix, and David Laibsondocument this fact in several consumer finance markets, including marketsfor mortgages, credit cards, and auto loans. The age-related pattern holdsafter controlling for other features of the credit contracts and for borrowers’other demographic, financial, and risk characteristics, suggesting that olderand younger individuals could have paid less than they did. I follow theauthors in labeling this phenomenon a “mistake,” although determining thiswith certainty would require knowledge of the full range of each borrower’soptions, which is lacking.
The authors assemble evidence from the medical, psychological, andeconomic literatures that suggests that older individuals make mistakesbecause of declining cognitive ability, whereas younger individuals appearto make mistakes because of inexperience. Although both groups are moreprone than middle-aged individuals to make mistakes, the paper focusesprimarily on the financial decisionmaking of older individuals.
The authors explore a range of possible regulatory responses, includingdoing nothing, requiring a financial “driver’s license” to invest in non-standard products, strengthening the fiduciary duties of financial sales-people, and requiring explicit regulatory approval of financial products. Theauthors decline to take a stand on which interventions, if any, are desirable.
The empirical work in this paper is clear and convincing, and the authorsplace their findings in a broad and rich context. However, many of thepossible regulatory responses may prove politically unpalatable: the polit-ical system seems reluctant to impose restrictions on the behavior of olderindividuals, even when such restrictions may be warranted. I describe belowtwo situations in which both younger and older individuals are more likelyto make mistakes, yet regulations are considerably more comprehensivefor younger than for older individuals.
DRIVING. Teenage drivers and older drivers are both more likely thanother drivers to be involved in car crashes (Liu, Utter, and Chen 2007).As drivers age, the advantage of their greater experience is eventuallyoutweighed by physical factors such as degradation of reflexes, vision, andhearing, and decreases in strength, mobility, and ability to process infor-mation (Islam and Mannering 2006). In addition, because of their relativefrailty, older drivers are more likely to be injured or killed in a crash: drivers65 or older have almost three times the odds of drivers 24 or younger ofbeing seriously injured in an auto accident (Liu and others 2007).
108 Brookings Papers on Economic Activity, Fall 2009
11941-04_Agarwal Comment_rev.qxd 1/26/10 11:31 AM Page 108

COMMENTS and DISCUSSION 109
The top panel of figure 1 shows driver deaths by age, scaled by billions ofmiles driven by members of the age group. The age-related pattern isdramatic: on average, 34 drivers aged 16 and 17, 5 drivers in their forties,and 96 drivers age 85 or older were killed per billion miles driven over the1999–2003 period.
Source: Author’s calculations from data in Tefft (2008).a. Persons killed in auto accidents who were not riding in an automobile.
Per billion miles drivenDriver fatalities
20
40
60
80
100
16 18 22 27 35 45 55 65 72 77 82 87
Driver age
Per billion miles drivenNonmotorist fatalitiesa
2
3
1
4
5
6
7
16 18 22 27 35 45 55 65 72 77 82 87
Driver age
Figure 1. Automobile Fatalities by Driver Age, 1999–2003
11941-04_Agarwal Comment_rev.qxd 1/26/10 11:31 AM Page 109
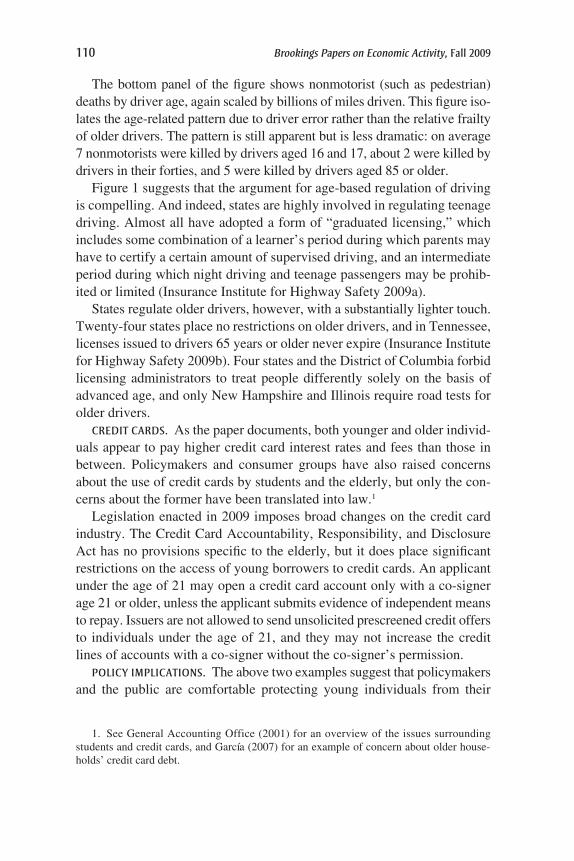
110 Brookings Papers on Economic Activity, Fall 2009
The bottom panel of the figure shows nonmotorist (such as pedestrian)deaths by driver age, again scaled by billions of miles driven. This figure iso-lates the age-related pattern due to driver error rather than the relative frailtyof older drivers. The pattern is still apparent but is less dramatic: on average7 nonmotorists were killed by drivers aged 16 and 17, about 2 were killed bydrivers in their forties, and 5 were killed by drivers aged 85 or older.
Figure 1 suggests that the argument for age-based regulation of drivingis compelling. And indeed, states are highly involved in regulating teenagedriving. Almost all have adopted a form of “graduated licensing,” whichincludes some combination of a learner’s period during which parents mayhave to certify a certain amount of supervised driving, and an intermediateperiod during which night driving and teenage passengers may be prohib-ited or limited (Insurance Institute for Highway Safety 2009a).
States regulate older drivers, however, with a substantially lighter touch.Twenty-four states place no restrictions on older drivers, and in Tennessee,licenses issued to drivers 65 years or older never expire (Insurance Institutefor Highway Safety 2009b). Four states and the District of Columbia forbidlicensing administrators to treat people differently solely on the basis ofadvanced age, and only New Hampshire and Illinois require road tests forolder drivers.
CREDIT CARDS. As the paper documents, both younger and older individ-uals appear to pay higher credit card interest rates and fees than those inbetween. Policymakers and consumer groups have also raised concernsabout the use of credit cards by students and the elderly, but only the con-cerns about the former have been translated into law.1
Legislation enacted in 2009 imposes broad changes on the credit cardindustry. The Credit Card Accountability, Responsibility, and DisclosureAct has no provisions specific to the elderly, but it does place significantrestrictions on the access of young borrowers to credit cards. An applicantunder the age of 21 may open a credit card account only with a co-signerage 21 or older, unless the applicant submits evidence of independent meansto repay. Issuers are not allowed to send unsolicited prescreened credit offersto individuals under the age of 21, and they may not increase the creditlines of accounts with a co-signer without the co-signer’s permission.
POLICY IMPLICATIONS. The above two examples suggest that policymakersand the public are comfortable protecting young individuals from their
1. See General Accounting Office (2001) for an overview of the issues surroundingstudents and credit cards, and García (2007) for an example of concern about older house-holds’ credit card debt.
11941-04_Agarwal Comment_rev.qxd 1/26/10 11:31 AM Page 110
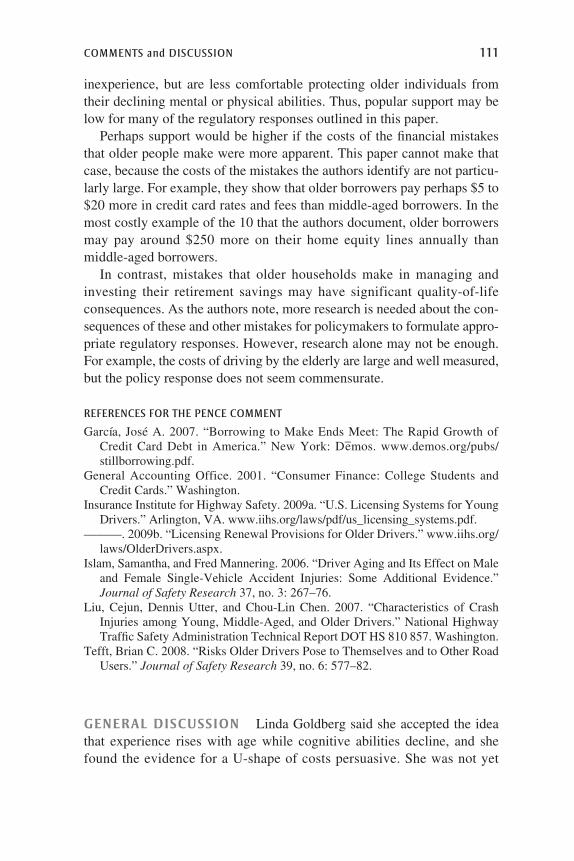
inexperience, but are less comfortable protecting older individuals fromtheir declining mental or physical abilities. Thus, popular support may below for many of the regulatory responses outlined in this paper.
Perhaps support would be higher if the costs of the financial mistakesthat older people make were more apparent. This paper cannot make thatcase, because the costs of the mistakes the authors identify are not particu-larly large. For example, they show that older borrowers pay perhaps $5 to$20 more in credit card rates and fees than middle-aged borrowers. In themost costly example of the 10 that the authors document, older borrowersmay pay around $250 more on their home equity lines annually thanmiddle-aged borrowers.
In contrast, mistakes that older households make in managing andinvesting their retirement savings may have significant quality-of-lifeconsequences. As the authors note, more research is needed about the con-sequences of these and other mistakes for policymakers to formulate appro-priate regulatory responses. However, research alone may not be enough.For example, the costs of driving by the elderly are large and well measured,but the policy response does not seem commensurate.
REFERENCES FOR THE PENCE COMMENT
García, José A. 2007. “Borrowing to Make Ends Meet: The Rapid Growth ofCredit Card Debt in America.” New York: De–mos. www.demos.org/pubs/stillborrowing.pdf.
General Accounting Office. 2001. “Consumer Finance: College Students andCredit Cards.” Washington.
Insurance Institute for Highway Safety. 2009a. “U.S. Licensing Systems for YoungDrivers.” Arlington, VA. www.iihs.org/laws/pdf/us_licensing_systems.pdf.
———. 2009b. “Licensing Renewal Provisions for Older Drivers.” www.iihs.org/laws/OlderDrivers.aspx.
Islam, Samantha, and Fred Mannering. 2006. “Driver Aging and Its Effect on Maleand Female Single-Vehicle Accident Injuries: Some Additional Evidence.”Journal of Safety Research 37, no. 3: 267–76.
Liu, Cejun, Dennis Utter, and Chou-Lin Chen. 2007. “Characteristics of CrashInjuries among Young, Middle-Aged, and Older Drivers.” National HighwayTraffic Safety Administration Technical Report DOT HS 810 857. Washington.
Tefft, Brian C. 2008. “Risks Older Drivers Pose to Themselves and to Other RoadUsers.” Journal of Safety Research 39, no. 6: 577–82.
GENERAL DISCUSSION Linda Goldberg said she accepted the ideathat experience rises with age while cognitive abilities decline, and shefound the evidence for a U-shape of costs persuasive. She was not yet
COMMENTS and DISCUSSION 111
11941-04_Agarwal Comment_rev.qxd 1/26/10 11:31 AM Page 111

convinced, however, that the former explains the latter. Issues also remainregarding the self-selection of borrowers: are older borrowers different fromthe rest of the older population, given that the general expectation, from alife-cycle perspective, is for borrowers to be younger? She also observedthat with product bundling, customers purchasing the most sophisticated orbroadest set of products might be offered lower interest rates. Also, otherissues relating to supply of credit need to be controlled for before decidingwhether regulation or some other policy is appropriate.
Robert Hall conceded that there are quite noticeable age effects infinancial performance, but he noted that the correlation is very low: onecan easily think of extreme outliers, like Warren Buffett. The paper’sresults might be more powerful if expressed in terms of a relationship tosome aptitude score rather than to age. With respect to mortgages, thepresumption is that the amount a person pays depends on the cost ofserving that person as well as on the person’s skill in choosing financialproducts. For example, the U-shaped relationship between mortgageexpense and age might reflect higher costs of originating mortgages forthe young and the old.
Hall also noted that mandatory mortgage counseling appears to havebeen quite successful at improving consumers’ choice of a mortgage. Apartfrom that, however, Hall shared the general frustration with the lack ofgood policy options, particularly regarding labeling and disclosure. The onlykind of labeling that might provide a useful model, he thought, is nutritionlabeling, for which some excellent research was done to determine theabsolute minimum amount of information necessary and how to present it.The so-called Schumer box now required of credit card issuers should looklike the nutrition label on the side of a box of cereal, but instead it islengthy and difficult to read. Hall concluded that there is still a long way togo on disclosure, but he doubted that even better disclosure would domuch to resolve the problem.
Alan Blinder observed that the authors were very agnostic about reme-dies, almost to the point of suggesting that nothing will work, and heurged a little less agnosticism. He suggested a distinction between poli-cies that rely on engaging the brain through improving financial literacyor greater disclosure, and policies that are more paternalistic, such asgood default options, nudges, and fiduciary standards, which he thoughtthe paper too easily dismissed. Blinder disputed the contention thatstockbrokers are obligated only to avoid misrepresentation. There is asuitability standard for brokers, which prohibits them from pressuring
112 Brookings Papers on Economic Activity, Fall 2009
11941-04_Agarwal Comment_rev.qxd 1/26/10 11:31 AM Page 112

anyone, let alone the elderly, into inappropriate investments. He agreed,however, that there is a lot of room to raise fiduciary standards and pre-vent abuse.
Christopher House agreed with Goldberg that differences in performanceacross age per se do not seem to be the key, and he suggested that it wouldbe better to think in terms of the level of cognitive ability. He furtherobserved that although cognitive ability does decline with age, there areoften other people present who have the interests of an aging household inmind. For example, just as parents encourage their children to drive safely,save their money, and choose a good subject for their major, so the grownchildren of older people often give them advice about finances and otherimportant decisions. The presence of these familial supports complicatesthe situation and argues for caution in devising a regulatory structure thatmight interfere with these supports.
Benjamin Friedman also urged a clearer distinction between nudges anddisclosure, especially if the authors generally approve of the former andare skeptical of the latter. The discussion of nudges in the paper remindedFriedman that in the recent book Nudge by Cass Sunstein and RichardThaler, many of the proposed nudges amounted to no more than disclo-sure. Friedman was also skeptical of the idea that small-scale trialswould be very informative. A mantra of the financial industry is that secu-rities are not bought; they are sold. In a small-scale trial, however, firmslack the incentive to develop the well-financed marketing effort to sellsecurities or other financial products to people who otherwise would notbuy them. Thus, if a small-scale trial suggests that a given interventionleads only a few people to buy an inappropriate product, that sheds littlelight on what will happen when the industry is unleashed on a large popula-tion of prospective buyers and thus has an incentive to sell aggressively.
Christopher Sims argued that not enough is known about the process bywhich younger people start taking over decisionmaking for their elderlyrelatives, and especially what happens to people who lack educated, finan-cially well off, or even living children to take care of them. The issue goeswell beyond finance. When a person gets Alzheimer’s, for example, even-tually not only financial decisions become difficult, but also what to eat inthe morning, what to wear, and how to maintain one’s home. Adding to theproblem is that Alzheimer’s patients often lose all perspective on theirabilities. A further problem is that some charities seem to increase the fre-quency of their requests for contributions addressed to older people,because they know that elderly people, especially those with Alzheimer’s,
COMMENTS and DISCUSSION 113
11941-04_Agarwal Comment_rev.qxd 1/26/10 11:31 AM Page 113

often forget how much they have given in the recent past. For some rela-tively wealthy households, the financial impact of this practice may be asimportant as the credit card issues discussed in the paper.
Christopher Carroll framed his comment by quoting the philosopherIsaiah Berlin, who said that one of the most important individual rightsis the right to make your own mistakes. Any rigorous investigation intooptimal financial regulation has to take into account the fact that peopleoften learn valuable lessons from their mistakes. Indeed, this could be onereason why the experience profile is so sharply upward sloping. Berlin’spoint is less persuasive, however, with respect to decisions that one cannoteasily revisit, such as lifetime saving decisions. This suggests that the needfor regulation of financial products should depend in part on whetherthe transaction is likely to be a one-time event, or one that is likely to berepeated with the benefit of learning.
Justin Wolfers thought the paper should do more to highlight not justthe types of mistakes being made and their relationship to the life cycle,but also the consequences of those mistakes. He observed further that theeconomics profession at the moment is thinking a lot about methodology,and in particular about what contributes to making results “robust.” Thepresent paper gathers a wealth of evidence across many different decisionsand different datasets, which adds robustness in a different sense thanadding another control variable. It is a wonderful case study in that respect.The paper also succeeds in identifying examples of behavior that areunambiguously suboptimal. For example, when using a credit card with ateaser rate to which one has transferred a balance, it is absolutely clear thatone should not use that credit card for purchases. There is no possible storywhere such a transaction represents a rational decision.
Ricardo Reis suggested two explanations for why there are more legalrestrictions on the young than on the old. First, the old vote and the youngdo not. Second, when a teenager has a horizon of 60 or 70 years of drivingahead but is prohibited from driving for the first 3, the cost does not seemas high as when a 65-year-old with 15 years of expected life ahead is prevented from driving. This may be what leads older people to resistrestrictions on their actions more than the young. Reis also stressed thedistinction between fiduciary duties and regulatory authority. The authorsdrew a parallel between financial products and medicines, but Reis believedthe right model for financial products was much closer to prescriptiondrugs than to over-the-counter drugs. Prescription drugs must be approvedfor sale by the FDA, but in addition they have to be recommended by adoctor for each patient individually and prescribed in the right doses. The
114 Brookings Papers on Economic Activity, Fall 2009
11941-04_Agarwal Comment_rev.qxd 1/26/10 11:31 AM Page 114

doctor’s approval is as important as the FDA’s, if not more important.Similarly, any governmental authority approving a financial product willalways have to rely ultimately on the broker or seller bearing some fiduciaryresponsibilities.
Reis added that there is a separate question about fiduciary responsibil-ity in the health field, namely, whether doctors are making poor financialdecisions for their patients and for taxpayers. Doctors are trained for 15 yearsand indoctrinated into thinking about their patients first; they take an oath todo so and can be not only disbarred but jailed for a wrong medical decision.Yet there is no comparable sanction for their decisions that go against thefinancial interest of a patient, not to mention that of the taxpayer.
Alan Auerbach disagreed with Reis’s comparison, arguing that there isa big difference between making a decision in the interest of a patient andmaking a decision in the interest of the taxpayer. Although this setup is onereason for the current problems in the health care system, it can be fullyrational and in the interest of the patient for the doctor to make a decisionagainst the taxpayer’s interest. Justin Wolfers added, with respect to the FDAanalogy, that off-label drug use is enormous. Medicines may be approvedfor one use, yet most of the sales of that drug may end up being used forsomething else. Much the same thing could well happen under strongerfinancial regulation.
Chang-Tai Hsieh wondered whether the phenomenon that the paperidentified is big or small. He suggested two possible dimensions for gaugingits importance. First, is the choice of a financial product among the mostimportant decisions a person makes, or merely one of many importantdecisions? People might, for example, be making serious mistakes in otherareas, such as schooling for their children, or what kind of home to buy.The potential welfare consequences from these mistakes could be evenlarger than those from poor financial decisions. Second, is age really themost important source of variation in cognitive ability? Suppose one couldadminister a test that accurately measures that variation, and in particularhow much of the variance can be explained by age. The latter result, Hsiehpredicted, is likely to be small; other considerations, such as differences inincome, might well be more important.
Timothy Besley suggested looking not just at mean differences betweenage groups, but also at the variance. One reason why there is less resis-tance to intervening with the young could be that competence at financialdecisionmaking is fairly tightly distributed within some age groups: mostyoung people are more or less equally bad at making such decisions, butthe distribution seems to fan out as people get older. This would have dif-
COMMENTS and DISCUSSION 115
11941-04_Agarwal Comment_rev.qxd 1/26/10 11:31 AM Page 115
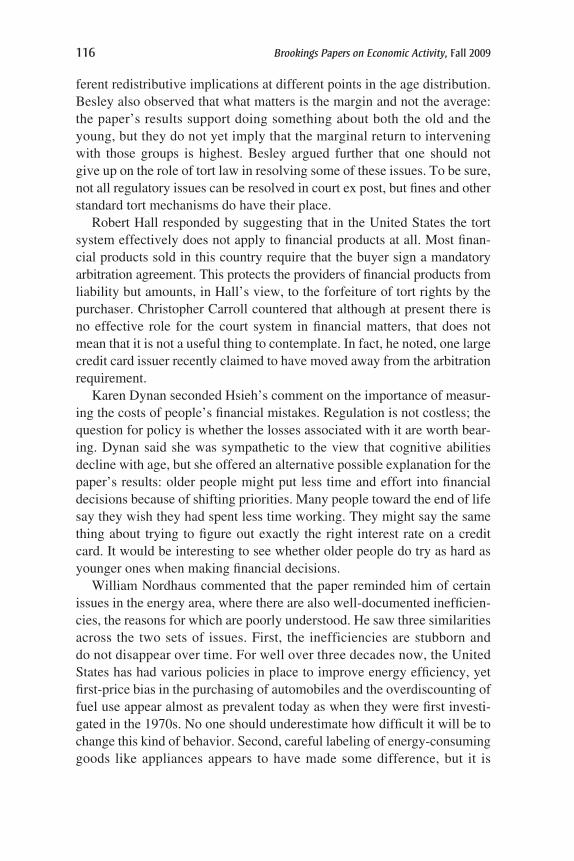
ferent redistributive implications at different points in the age distribution.Besley also observed that what matters is the margin and not the average:the paper’s results support doing something about both the old and theyoung, but they do not yet imply that the marginal return to interveningwith those groups is highest. Besley argued further that one should notgive up on the role of tort law in resolving some of these issues. To be sure,not all regulatory issues can be resolved in court ex post, but fines and otherstandard tort mechanisms do have their place.
Robert Hall responded by suggesting that in the United States the tortsystem effectively does not apply to financial products at all. Most finan-cial products sold in this country require that the buyer sign a mandatoryarbitration agreement. This protects the providers of financial products fromliability but amounts, in Hall’s view, to the forfeiture of tort rights by thepurchaser. Christopher Carroll countered that although at present there isno effective role for the court system in financial matters, that does notmean that it is not a useful thing to contemplate. In fact, he noted, one largecredit card issuer recently claimed to have moved away from the arbitrationrequirement.
Karen Dynan seconded Hsieh’s comment on the importance of measur-ing the costs of people’s financial mistakes. Regulation is not costless; thequestion for policy is whether the losses associated with it are worth bear-ing. Dynan said she was sympathetic to the view that cognitive abilitiesdecline with age, but she offered an alternative possible explanation for thepaper’s results: older people might put less time and effort into financialdecisions because of shifting priorities. Many people toward the end of lifesay they wish they had spent less time working. They might say the samething about trying to figure out exactly the right interest rate on a creditcard. It would be interesting to see whether older people do try as hard asyounger ones when making financial decisions.
William Nordhaus commented that the paper reminded him of certainissues in the energy area, where there are also well-documented inefficien-cies, the reasons for which are poorly understood. He saw three similaritiesacross the two sets of issues. First, the inefficiencies are stubborn anddo not disappear over time. For well over three decades now, the UnitedStates has had various policies in place to improve energy efficiency, yetfirst-price bias in the purchasing of automobiles and the overdiscounting offuel use appear almost as prevalent today as when they were first investi-gated in the 1970s. No one should underestimate how difficult it will be tochange this kind of behavior. Second, careful labeling of energy-consuminggoods like appliances appears to have made some difference, but it is
116 Brookings Papers on Economic Activity, Fall 2009
11941-04_Agarwal Comment_rev.qxd 1/26/10 11:31 AM Page 116

necessary not just to do the calculations, but also to undertake a fair numberof behavioral studies. Third, one should never underestimate Congress’sability to devise very poor, heavily interventionist policies. When designingnew financial regulations, policymakers would do well to remember thatthe SUV was invented basically to get around energy regulations and fueleconomy standards. The ability and the incentives of financial engineers todevise the financial equivalent of SUVs should not be taken lightly.
George Perry wondered whether, instead of allowing certain products tobe sold but forbidding certain groups of people to buy them, the solutionmight be to place restrictions on what is available for anyone to buy. Thiswould raise obvious issues of freedom of choice, but on the other hand noone disagrees that the Bernie Madoffs of the world should be put in jail andshould not be allowed to peddle fraudulent goods. Perry noted that bankscontinue to charge outrageous fees on debit card overdrafts, and on cardaccounts generally, and although the amounts are small compared with theloss of one’s home, they are nonetheless considerable. Perry could think ofno other area where regulation permits what is universally agreed to be anunfair price, yet companies remain free to set these unconscionable fees.
COMMENTS and DISCUSSION 117
11941-04_Agarwal Comment_rev.qxd 1/26/10 11:31 AM Page 117

11941-04_Agarwal Comment_rev.qxd 1/26/10 11:31 AM Page 118