the african continental free trade area · 2 where does the afcfta fit in africa’s development...
TRANSCRIPT

The African
Continental
Free Trade Area
A tralac guide
6th
ed
. N
ove
mb
er
20
19
2
Where does the AfCFTA fit in
Africa’s development agenda?
The Agreement establishing the African Continental Free Trade Area (AfCFTA) was signed at the 10th Extraordinary Summit of the AU Assembly on 21 March 2018 in Kigali, Rwanda. The AfCFTA Agreement entered into force on 30 May 2019.
The AfCFTA is the continent’s most ambitious integration initiative. The main objectives of the AfCFTA are:
• create a single continental market for goods and services, with free movement of business persons and investments
• expand intra-Africa trade across the regional economic communities and the continent in general
• enhance competitiveness and support economic transformation
Eight RECs have been officially recognised as building blocs of the AfCFTA:
ECCAS, ECOWAS, EAC, SADC, COMESA, AMU, CEN-SAD and IGAD.
Agenda 2063 is Africa’s framework for structural transformation. It builds on,
and aims to facilitate the implementation of existing continental initiatives
(AIDA, PIDA, BIAT and CAADP). The establishment of the AfCFTA, a single African
air transport market (SAATM) and the free movement of people are Agenda
2063 flagships. The AU has adopted legal instruments for effective implementa-
tion of these flagship projects. Importantly, the UN Agenda 2030’s 17 SDGs are
in the 20 goals of Agenda 2063. By implementing Agenda 2063, Africa will also
meet its global commitments under the SDGs.

3
Agenda 2063
PIDA
AIDA
BIAT
CAADP
SAATM Decision
Protocol on Free
Movement of People
AfCFTA Agreement
Yamous-soukro
Decision

4
Architecture of the AfCFTA
The AfCFTA Agreement is a framework agreement covering Trade in Goods
and Services, Investment, Intellectual Property Rights and Competition
Policy.
The Protocols on Trade in Goods, Trade in Services, Investment, Intellectual
Property Rights, and Competition Policy, as well as Dispute Settlement, form
an integral part of the Agreement. The Protocols on Trade in Goods and
Trade in Services each have a number of Annexes covering substantive
disciplines.
Trade in Goods and Trade in Services are being negotiated in Phase 1; with
negotiations on a number of issues (e.g. tariff concessions, rules of origin for
goods and schedules of specific commitments for services) still ongoing.
Phase 2 of the negotiations will cover Investment, Competition Policy and
Intellectual Property Rights. Phase 2 negotiations and the draft texts of the
Protocols on Investment, Competition Policy and Intellectual Property Rights
are expected to be complete by January 2021.

5
Agreement establishing the AfCFTA
Protocol on Rules and Procedures on the Settlement of
Disputes
Protocol on Trade in Services
Protocol on Trade in Goods
Protocol on Investment
Protocol on Intellectual
Property Rights
Protocol on Competition
Policy
Annexes
• Schedules of Specific Commitments
• MFN Exemption(s)
• Air Transport Services
• List of priority sectors
• Framework document on Regulatory Cooper-ation
Annexes
• Schedules of Tariff Concessions
• Rules of Origin
• Customs Cooperation and Mutual Administrative Assistance
• Trade Facilitation
• Non-Tariff Barriers
• Technical Barriers to Trade
• Sanitary and Phytosanitary Measures
• Transit
• Trade Remedies: Guidelines on implementation of Trade Remedies
Phase Two
Annexes
• Working Procedures of the Panel
• Expert Review
• Code of Conduct for Arbitrators and Panellists

6
Institutions of the AfCFTA The institutions established under the AfCFTA, and their powers, represent a
compromise between the typical institutional arrangements of a stand-alone
Free Trade Agreement (FTA) and the AfCFTA as a flagship project of the African
Union (AU) under Agenda 2063.
The founding Agreement does not state that this arrangement will be a legal
person (as is the case in several regional economic communities, including SADC
and EAC). It does provide an institutional architecture for this arrangement
(shown below). It is notable that the apex institution is the Assembly – this is
the Assembly of the African Union.
The Assembly is the African Union Assembly comprising all AU Heads of State, not just those of
State Parties to the Agreement. It provides oversight and guidance on the AfCFTA and is the
ultimate decision-making body for the AfCFTA.
The Council of Ministers comprises Ministers for Trade or other nominees from State Parties. It
has authority to take decisions on all matters under the AfCFTA Agreement, and works in collab-
oration with the relevant AU organs and institutions. It reports to the Assembly through the
Executive Council of the AU and makes recommendations to the Assembly for the adoption of
authoritative interpretation of the Agreement. It is separate from the African Union Ministers of
Trade (AMOT) under the AU.
The Committee of Senior Trade Officials: consists of Permanent Secretaries or other officials
designated by State Parties. It is responsible for the development of programmes and action
plans for the implementation of the AfCFTA Agreement.
The AfCFTA Secretariat is the administrative organ to coordinate the implementation of the
AfCFTA. It is based in Accra, Ghana.
The Dispute Settlement Mechanism replicates, with the necessary adaptations, the WTO dis-
pute settlement system. The principles and procedures appear in a dedicated Protocol. Only
State Parties will be able to bring applications. Private party litigation is not possible.

7
person (as is the case in several regional economic communities, including SADC

8
AfCFTA Committees
The Protocols of the AfCFTA Agreement establish various technical committees
to assist with the implementation of the Agreement. The committees will com-
prise designated representatives from State Parties. The Committee on Trade in
Goods will facilitate the operation of the Protocol on Trade in Goods. The Com-
mittee will establish sub-committees responsible for the operationalisation of
the annexes of the Trade in Goods Protocol. The Committee on Trade in Services
will facilitate the operation of the Protocol on Trade in Services.

9
Other AfCFTA initiatives
African Trade Observatory: the African Trade Observatory (ATO) aims to create a
continent-wide trade information portal to facilitate intra-African trade and to support
the roll-out of the AfCFTA. The ATO will seek to collect trade-related data from member-
states and provide trade intelligence to both market players and governmental and non-
governmental agencies. The ATO will also seek to include services trade, exchange rate
and competitiveness indicators, internal tax data and foreign direct investment data.
The AfCFTA Online Mechanism for Reporting,
Monitoring and Elimination of NTBs provides a
facility for online reporting of identified non-tariff
barriers (NTBs) including for reporting via SMS.
Reported NTBs and the status of their resolution
can be accessed on the public domain. Various
informative pages on the website, including FAQs,
assist in the use of the system. NTB notifications
will be received by the focal points of the re-
porting country, the responding country and the
AfCFTA Secretariat for processing. In a non-public
space, the system then allows information ex-
change between the concerned State Parties to
monitor and resolve NTBs.

10
Intra-African trade at a glance In 2018 intra-African exports were valued at US$74 billion; 15% of Africa’s
world exports. Between 2017 and 2018 intra-Africa exports increased by only
1%, while Africa’s exports to the rest of the world increased by 22%.
• South Africa is the main intra-Africa exporter and importer; 34% of intra
-Africa exports are from South Africa while South Africa imports 20% of
intra-Africa imports.
• Other main intra-African exporters include Nigeria (9%), Egypt (6%),
Ivory Coast (4%) and Zimbabwe (4%).
• Apart from South Africa, the other main intra-African importers are also
all located in southern Africa—Botswana, Zambia, Namibia and Mozam-
bique accounting for a further 24% of intra-Africa imports.
• Eswatini, Zimbabwe, Togo, Gambia and Uganda are the only countries
with intra-Africa exports more significant than exports to the rest of the
world.

11
Sources: tralac calculations, ITC Trademap 2019
Intra-Africa exports and imports 2018

12
Intra-REC trade In 2018 20% of intra-Africa exports were exports among the SACU member
states; 4% intra-EAC exports; 0.1% intra-CEMAC exports and 13% exports
among the ECOWAS countries. Intra-REC exports as a percentage of total Afri-
can exports by a REC show most countries trade more with their REC counter-
parts. The exceptions are intra-REC trade in CEMAC and ECCAS.
50% of intra-Africa exports are exports among SADC member states; close to
all intra-Africa exports by Zambia, Namibia, Botswana, Mozambique, Zimba-
bwe and Lesotho are intra-SADC exports. 97% of intra-Africa exports by Burki-
na Faso, 96% by Niger, 95% by Gambia and 92% by Guinea-Bissau are exports
to other ECOWAS member states. 93% of the DRC’s intra-Africa exports and
94% of Eritrea’s are intra-COMESA exports.
Measuring intra-REC trade is complicated by overlapping membership to differ-
ent RECs and bilateral trade agreements in place. It can also be difficult to
gauge under which agreement countries are trading with one another.

13
Intra-REC exports as a % of the RECs total intra-Africa exports

14
Agricultural trade In 2018, total intra-African agricultural trade was valued at US$25 billion (US$13
billion exports and US$12 billion imports) representing some 18% of total intra-
African exports and 16% of intra-African imports. However, between 2017 and
2018 intra-Africa agricultural exports and imports decline by 15% and 3% re-
spectively.
South Africa is the main exporter of agricultural commodities to the rest of the
continent, followed by Uganda and Zimbabwe. In 2017 Niger were one of the
main intra-Africa exporters; however, agricultural exports halved between 2017
and 2018. South Africa, Kenya and Botswana are the main intra-Africa agricul-
tural importers.
Intra-African agricultural exports are mainly tobacco, sugar and palm oil. The
main agricultural products Africa exports to countries outside Africa include co-
coa beans, nuts and coffee.
Main intra-Africa agricultural export products
Unmanufactured tobacco (8%) Sugar (8%) Palm oil (4%)
77% exported by
Zimbabwe
Mainly exported by Eswa-
tini (22%), South Africa
(19%) and Uganda (10%)
74% is exported by Ivory
Coast, Ghana, Kenya and
Uganda

15
So
urce
s: tralac calculati
on
s. ITC Trad
e Map
2019
M
ain
in
tra
-Afr
ica
ag
ric
ultu
ral e
xp
ort
ers
16
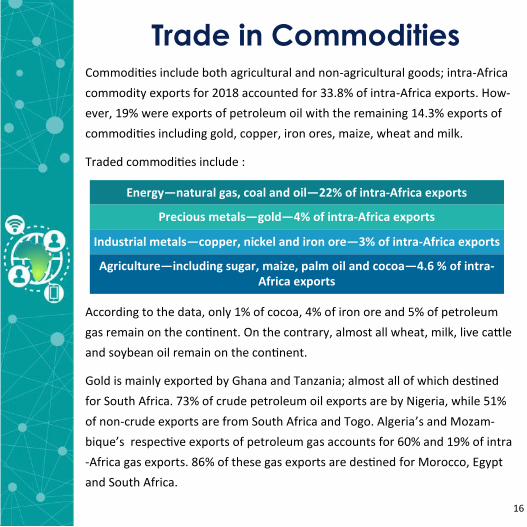
Commodities include both agricultural and non-agricultural goods; intra-Africa
commodity exports for 2018 accounted for 33.8% of intra-Africa exports. How-
ever, 19% were exports of petroleum oil with the remaining 14.3% exports of
commodities including gold, copper, iron ores, maize, wheat and milk.
Traded commodities include :
According to the data, only 1% of cocoa, 4% of iron ore and 5% of petroleum
gas remain on the continent. On the contrary, almost all wheat, milk, live cattle
and soybean oil remain on the continent.
Gold is mainly exported by Ghana and Tanzania; almost all of which destined
for South Africa. 73% of crude petroleum oil exports are by Nigeria, while 51%
of non-crude exports are from South Africa and Togo. Algeria’s and Mozam-
bique’s respective exports of petroleum gas accounts for 60% and 19% of intra
-Africa gas exports. 86% of these gas exports are destined for Morocco, Egypt
and South Africa.
Trade in Commodities
Precious metals—gold—4% of intra-Africa exports
Industrial metals—copper, nickel and iron ore—3% of intra-Africa exports
Energy—natural gas, coal and oil—22% of intra-Africa exports
Agriculture—including sugar, maize, palm oil and cocoa—4.6 % of intra-Africa exports

17
Intra-Africa trade in specific commodities

18
Non-agricultural, non-commodity trade
Main intra-Africa export products
Approximately 53% of intra-Africa exports are products which are neither
agricultural products, nor commodities and include diamonds, electric ener-
gy, motor vehicles and cement.
Sources: tralac calculations, ITC Trademap 2019

19

20
Intra-African tariffs Many African countries trade under the free-trade areas of their regional
economic communities (RECs), with reduced or zero tariff preferences and
members of fully fledged customs unions such as SACU trade duty-free with
one another. Tariffs are therefore highest between those countries that do not
already have a preferential agreement in place.
PAFTA and AGADIR members have duty-free access to Egypt’s market, while imports from
COMESA (except Eswatini & DRC) are granted preferential access. CENSAD is not yet an FTA.
Non-REC intra-Africa tariffs Ethiopia is a signatory of COMESA and IGAD. While Ethiopia is a member of COMESA, it is still
in the process of joining the COMESA FTA. IGAD is not yet a Free Trade Agreement.

21
Nigeria is a member of ECOWAS and CENSAD. CENSAD is not yet an FTA. All qualifying goods, under the ECOWAS
Trade Liberalisation Scheme (ETLS) imported from approved ECOWAS producers into Nigeria enter duty-free.
South Africa is a member state of both SACU and SADC. SACU is a customs union with duty-free intra-SACU
trade and a common external tariff applicable to all goods entering from outside the Union.
Kenya is party to 4 RECs in Africa, however, the CENSAD and IGAD preferential arrangements are not yet in
force. Countries that are members of COMESA and the EAC enjoy preferential access into Kenya.

22
MFN tariffs for key Copper
ores & concen-
Goods vehicles Portland cement Refined sugar
EAC CET 0 0; 25* 25 20; 100*
ECOWAS CET 5 0; 35* 20 20
SACU CET 0 0; 10; 20; 25* 0 476.71c/kg
Algeria 5 0; 5* 15 30
Angola 2 0; 2; 20; 30; 40* 2; 30* 20; 30*
Cabo Verde 0 0; 5; 10; 20* 5 5
Cameroon 10 10; 20* 20 30
CAR 10 10; 20* 20 30
Chad 10 10; 20* 20 30
Congo 5 5; 10; 20* 10 5; 20*
DRC 5 5 5; 10* 20
Djibouti 26 26 13; 26* 0; 13*
Egypt 2 5; 10; 20; 30* 0 5; 20*
Ethiopia 5 10; 35* 10 5
Gabon 10 10; 20* 20 30
Madagascar 5 10 10 10
Malawi 10 0; 10; 25* 10 25
Mauritania 5 13; 5; 20* 13; 20* 5; 20*
Mauritius 0 0 0 15
Morocco 2.5 2.5; 10; 25* 2.5;10; 17.5* 25; 55; 60*
Mozambique 2.5 5 7.5 7.5
Tunisia 0 0; 20* 20 0; 36*
Zambia 0 15; 30 5 25
Zimbabwe 5 5; 10; 25; 40; 60* 10; 15; 20* 10% + US$100/t

23
intra-African imports (%)
Sources: ITC MacMap 2019
Maize Articles of iron or steel Beer Trousers Palm oil
EAC CET 50 0; 10; 25* 25 25 0; 10; 35*
ECOWAS CET 5 5; 10; 20* 20 20 10; 35*
SACU CET 0 5; 10; 15; 20; 30* 5 40; 45* 10
Algeria 5 5; 15; 30* 60 30 5; 15; 30*
Angola 30 2; 10; 20;30* 60 10 0
Cabo Verde 0; 20* 0; 10; 20* 50 30 0; 5*
Cameroon 30 10; 20; 30* 30 30 30
CAR 5 5; 10; 20; 30* 30 30 10; 15*
Chad 30 5; 10; 20; 30* 30 30 10; 30*
Congo 10 10; 20; 30* 20 20 10; 20; 35*
DRC 10 5; 10; 20* 20 20 5; 20*
Djibouti 1 13; 26* 26 13 1; 13*
Egypt 0 0; 5; 10; 30; 60* 1200 40 0
Ethiopia 5 5; 20;35* 35 35 20
Gabon 30 5; 10; 20; 30* 30 30 0; 30*
Madagascar 10 0; 5; 10;20* 20 20 5; 10*
Malawi 0 0; 10; 25* 25 25 10; 25*
Mauritania 5 5; 13; 20* 20 20 0; 13*
Mauritius 0 0; 15* 15 0 0
Morocco 2.5 2.5; 10; 17.5; 25* 49 25 2.5; 25*
Mozambique 7.5 2.5; 7.5; 20* 20 20 2.5; 20*
Tunisia 15 0; 20* 36 20 36
Zambia 15 0; 5; 15; 25* 25 25 0; 15; 25*
Zimbabwe 0 5; 10; 15; 20; 25; 40; 60; 65* 0; 25; 40* 40% + US$3/kg 5; 15; 40*
*The import tariff varies depending on which specific product at national tariff line level is imported.

24
Trade in Services Currently, African services trade is low, and intra-African services trade is
lower still. However, given the worldwide increase in services trade over the
past few decades, there is potential for growth.
Between 2017 and 2018 Africa’s services exports increased by 5%, while
global services exports increased by 7%.
Services negotiations are included in phase 1 of the AfCFTA negotiations. The
implementation of services liberalisation commitments and regulatory
reform will be critical to achieve the aims of the African integration agenda.
Initially State Parties will schedule commitments in 5 priority sectors:
financial services, travel, transport, business services and communications.
Percentage world services exports

25
Services trade restrictiveness is
4x higher
in Africa than OECD countries
Top services exporters Egypt
Morocco
South Africa
Top services importers
Nigeria
Egypt
South Africa
Source: ITC Trademap 2019
All other services 26.1%
Business services 5.3%
Telecommunications 3.2%
Financial 2.4%
Travel 40.2%
Transport 22.8%
Exports—5 priority services sectors (2018)
Less than 2% of world services exports
originate in Africa
Africa accounts for around 3% of world
services imports
26
Trade facilitation
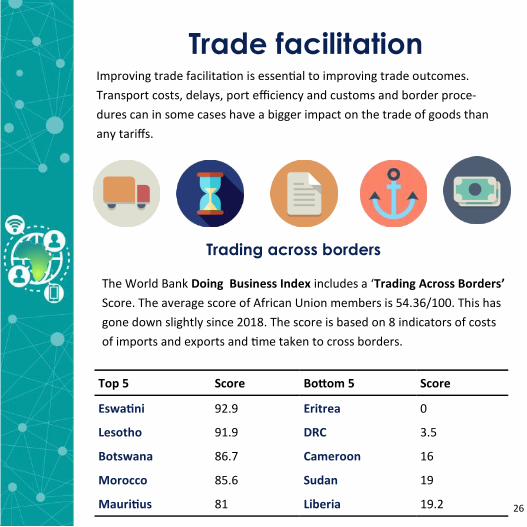
Bottom 5 Score Top 5 Score
Eswatini 92.9 Eritrea 0
Lesotho 91.9 DRC 3.5
Botswana 86.7 Cameroon 16
Morocco 85.6 Sudan 19
Mauritius 81 Liberia 19.2
The World Bank Doing Business Index includes a ‘Trading Across Borders’
Score. The average score of African Union members is 54.36/100. This has
gone down slightly since 2018. The score is based on 8 indicators of costs
of imports and exports and time taken to cross borders.
Improving trade facilitation is essential to improving trade outcomes.
Transport costs, delays, port efficiency and customs and border proce-
dures can in some cases have a bigger impact on the trade of goods than
any tariffs.
Trading across borders

27
The World Bank Logistics Performance Index (LPI) is based on a question-
naire sent to professionals in the logistics sector. It ranks countries on
customs, international shipments, quality and
competence, tracking and tracing, timeliness and infrastructure. A higher
score indicates higher performance. South Africa is the best performing
African country, with Angola at 2.05 the lowest scoring African country.
Firms identifying
customs and trade
regulation as a major
constraint
All
SSA
MENA
17%
26%
21%
Source: World Bank Enterprise Surveys
“The Sub-Saharan Africa region is the
weakest performer across the board,
due mainly to lower performance in
the areas of information availability,
advance ruling mechanisms and auto-
mation, as well as governance and
impartiality”
- OECD 2018 ‘Trade facilitation
around the world: The state of play’
South Africa 1.5
Morocco 1.41
Kenya 1.21
Senegal 1.17
Tunisia 1.13
Botswana 1.12
Madagascar 0.89
Nigeria 0.82
Burundi 0.43
OECD trade facilitation indicators
Selected country scores
(out of 2)
The OECD trade facilitation indicators assess a range of facilitation areas
including information availability, fees and charges, border agency
cooperation, governance and impartiality, documents and governance.
Logistics performance index

28
About tralac
www.tralac.org | [email protected] | @tradelawcentre | Copyright © tralac, 2019
(Trade Law Centre) tralac is a public benefit organisation based in South Africa. We develop technical expertise and capacity in trade governance across Africa.
We are committed to the principles of rules-based governance at the national, regional and international levels. We believe that better governance and strong institutions are essential elements for inclusive and sustainable growth. tralac’s activities are anchored on three pillars.
Readers are encouraged to quote and reproduce this material for educational, non-profit purposes,
provided the source is acknowledged. All views and opinions expressed remain solely those of the
authors and do not purport to reflect the views of tralac. Icons from freepik & smashicons at flaticon.com