the adsorption mechanism, structural and electronic...
TRANSCRIPT

Indian Journal of Pure & Applied Physics Vol. 57, October 2019, pp. 713-724
The adsorption mechanism, structural and electronic properties of pyrrole adsorbed ZnO nano clusters in the field photovoltaic cells by density
functional theory
S Dheivamalara* & K Bansura Banua,b
a PG and Research Department of Physics, Periyar E V R College (Autonomous), Tiruchirappalli 620 023, India b PG and Research Department of Physics, Holy Cross College (Autonomous), Tiruchirappalli 620 002, India
Received 2 December 2017; accepted 3 June 2019
An exhaustive quantum chemical analysis of structural and electronic properties have been investigated for pure and pyrrole adsorption on semiconductor nano-clusters Zn3O3 (P-Zn3O3) and Zn6O6 (P-Zn6O6) by density functional theory (DFT) calculations with various basis sets (B3LYP/6-31G, B3LYP/6-311G, MP2/6-31G, and B3LYP/LANL2DZ). The values of HOMO/LUMO energies, energy gap (Eg), adsorption energy (Ead), global reactivity descriptors, thermodynamic parameters and the total dipole moment have been calculated. The total density of states (DOS) of P-ZnO complexes have been probed to establish the consequences of adsorption of pyrrole on ZnO nano-clusters. The charge distribution has been examined by Mulliken atomic charge distribution and molecular electrostatic potential (MEPs) analyses. Spectroscopic analysis has been performed for the better understanding of the interaction of pyrrole on ZnO clusters. It is interesting to note that there is a reduction in energy gap, which causes an increase in electrical conductivity in pyrrole adsorbed geometries and hence confirms that the title compounds can be used in photovoltaic or bio-solar cell applications. As a result, Zn3O3 cluster was renewed to awfully conductive and more solid system upon pyrrole adsorption due to higher reduction in energy gap than Zn6O6 cluster. It can be presumed that the present study may have room for the fields such as solar cell, biomedicine, sensing and catalytic applications.
Keywords: Nano-cluster, Zn3O3, Zn6O6, DFT, Adsorption, Density of states
1 Introduction In nanotechnology, nano-structured materials have
substituted the bulk materials in a wide range of applications owing to their superior properties such as excessive surface to volume ratio and high chemical reactivity1,2. The nano-structured semiconductors are highly fascinating materials having distinct physical-chemical properties and acquire immense uses in catalysts, sensors, field emission and bio-medical applications3-6. Nano-structured materials7,8 such as nano-rings, nano-sheets, nano-tubes, nano-crystallites and nano-clusters can undergo with a dimension usually ranges from 1-100 nm. The exposure of nano-technology and the isolated size affiliated properties of nanomaterials have unlocked new perspectives and research provocations9-11. The nano-structure of ZnO acts as a stage for an insight, investigation of the structural and electronic properties. The hybrid nanomaterial ZnO has experienced much attention in recent years due to their shape and composition.
The present manuscript is an intensive analysis on (XY) n nano-clusters, Where X and Y are built by
Zinc and Oxygen elements12,13. The (XY) n nano-clusters specially (ZnO)n is an interesting semiconductor material with remarkable applications in photovoltaic, solar cell, gas sensor, ceramic, catalyst, optics and optoelectronic applications due to its broad bandgap14. The II–IV semiconductor compounds like (ZnO) n are of particular importance due to its wide direct band gap energy (3.4-3.7) eV and large excitation binding energy of 60 M eV. The (ZnO)n nano-clusters gained much attention due to their low toxicity, less economic, high electron mobility, less band gap, strong luminescence and high transparency15. The (ZnO)n nano-clusters functionalizing with biological elements are an excellent way to enhance its electronic properties16.
In the present work the quantum chemical calculations of pyrrole on Zn3O3 and Zn6O6 nano-clusters have been done and reported. The adsorption of pyrrole on Zn3O3 and Zn6O6 nano-clusters have been studied and compared in terms of energy, geometry, binding site, electronic properties, HOMO-LUMO energies, Mulliken charge distribution plots, DOS spectra, simulated IR and molecular electrostatic
—————— *Corresponding author (E-mail: [email protected])

INDIAN J PURE & APPL PHYS, VOL. 57, OCTOBER 2019
714
potential for the first time and are not available in the literature. Pyrrole (C4H4NH) is a heterocyclic compound which contains nitrogen like Furan and Thiophene and is also referred as Imidole. A five membered pyrrole possess chemical reactivity same as that of benzene. pyrrole is a colorless and volatile, which is essential for the production of many different chemicals. The electron density in Pyrrole is greater than benzene. So that pyrrole is categorized as p-electron excessive aromatic compound17. Pyrrole broadly used as catalysts, dyes, perfumes, medicines, preservatives, anti-cancer drug delivery system, photo thermochemical compounds and precursors for organic synthesis especially in indicator chemical industry18. Pyrrole compound may participate in Dies-Alder reactions under certain conditions. Study of Pyrrole is more informative since it is a parent compound of some certain substances like Hemoglobin, Chlorophyll, Indigo and the Corrin ring of vitamin B12. pyrrole is tremendously available in natural products, drugs, catalysts, Porphyrin, Alkaloids, co-enzymes, some marine natural products and advanced materials19. The surface morphology and spectroscopic analysis were carried out for the title compounds. The strength of adsorption and interaction of N site of Pyrrole with ZnO nano-cluster is higher than the other sites. The electronic properties favored the steadiest P-ZnO composite due to the reduction in energy gap after Pyrrole adsorption. The interaction of ZnO nano structures with biological compound like pyrrole will yield novel materials for further development in the sector of nano-medicine and catalytic activity20. The development of such catalysts may replace unstable and toxic catalysts. The pyrrole adsorbed ZnO nano-structures with different morphologies can serve as an anti-cancer drug candidate and cholesterol lowering drug candidate. The P-ZnO composite find wide application in the field of solar cell due to enhanced conductivity after pyrrole adsorption on ZnO cluster. The intriguing possibility of light sensitized solar cells has triggered great interest of the title compound due to their potential applications in opto electronic devices such as solar cells in the field of communication satellites.
2 Computational Methods The quantum chemical calculations such as
geometry optimizations, energy calculations and molecular orbital calculations were performed for P-Zn3O3 and P-Zn6O6 complexes along with their pure
nano-clusters at the B3LYP level of theory with various basis sets by DFT calculations in Gaussian 09 program21. The B3LYP/6-31G (d, p) basis set is used to study the geometries and electronic properties of III–V semiconductor nano-clusters. The Gauss sum program is implemented for the analysis of DOS spectra22. The electronic properties of pyrrole decorating on the surface of Zn3O3 and Zn6O6 nano-clusters have been comparatively investigated. After optimization, the adsorption energy (Ead) of the P-Zn3O3 and P-Zn6O6 are represented by:
Ead = EZnO-Pyrrole - (EZnO + EPyrrole) … (1)
Where, EZnO-Pyrrole is the total energy of pyrrole interacting
with ZnO nano-cluster, EZnO is the total energy of the isolated ZnO nano-cluster and Epyrrole is the total energy of the isolated pyrrole.
The energy gap Eg is defined as:
Eg = ELUMO - EHOMO … (2)
Where, EHOMO and ELUMO are the energy of HOMO and LUMO, respectively. The energy shift ∆Eg is calculated as the ratio of the difference of Eg1 measured in ZnO (reference value) and Eg2 measured in P-ZnO with respect to the reference value.
ΔEg = [(Eg2 - Eg1) / (Eg1)] … (3)
3 Results and Discussion
3.1 Electronic property analysis The two dimensional (planar) substantial structure
of pure Zn3O3 nano-clusters, including hexagon with D3h symmetry was optimized as a basic representation. The optimized structure of Zn3O3 nano-cluster, HOMO-LUMO profiles and its DOS plot have been presented in Fig. 1. The energy difference between the highest occupied molecular orbital (HOMO) and the lowest unoccupied molecular orbital (LUMO) indicates Zn3O3 belongs to semiconductive nano-structured material23. EHOMO and ELUMO calculated from the DOS results are -6.64 and -2.96 eV which yields Eg (EHOMO–ELUMO) as 3.77 eV with a Fermi level of -4.81 eV. The donor HOMO orbital is mostly located on O atoms, whereas the acceptor LUMO orbital is distributed in all the atoms.
The two dimensional (planar) optimized hexagonal ring structure of pure Zn6O6 nano-cluster of D6h symmetry with HOMO-LUMO profiles and its DOS plot is presented in Fig. 2. The calculated values of EHOMO and ELUMO by DOS are -6.70 and -3.09 eV. The

DHEIVAMALAR & BANU: PYRROLE ADSORBED ZnO NANO CLUSTERS
715
energy gap Eg determined from EHOMO and ELUMO of Zn6O6 is 3.61 eV with a Fermi level of -4.89 eV which specifies Zn6O6 has the property of the semi conductive nano-cluster. The HOMO orbital is predominantly located on O atoms and LUMO is scattered along all the atoms. The optimized structure, HOMO/LUMO profiles and DOS spectrum of pyrrole have been shown in Fig. 3. The HOMO and LUMO energies are calculated as -5.49 and 1.15 eV, which prompts band gap (Eg) of 6.64 eV. The large band gap (Eg) of Pyrrole enumerates large thermal stability. The HOMO is mainly presented in carbon atoms and the LUMO is uniformly spread along all the atoms.
The exploration of the present study manifests the changes observed on complexation of Pyrrole on
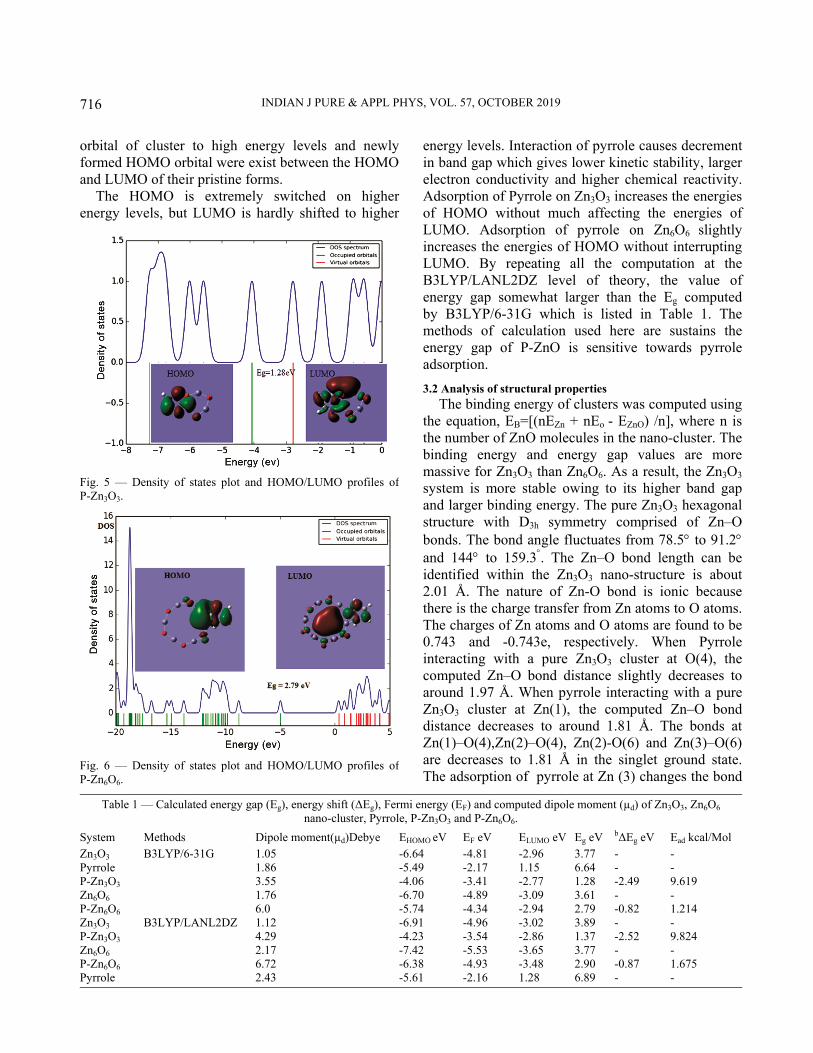
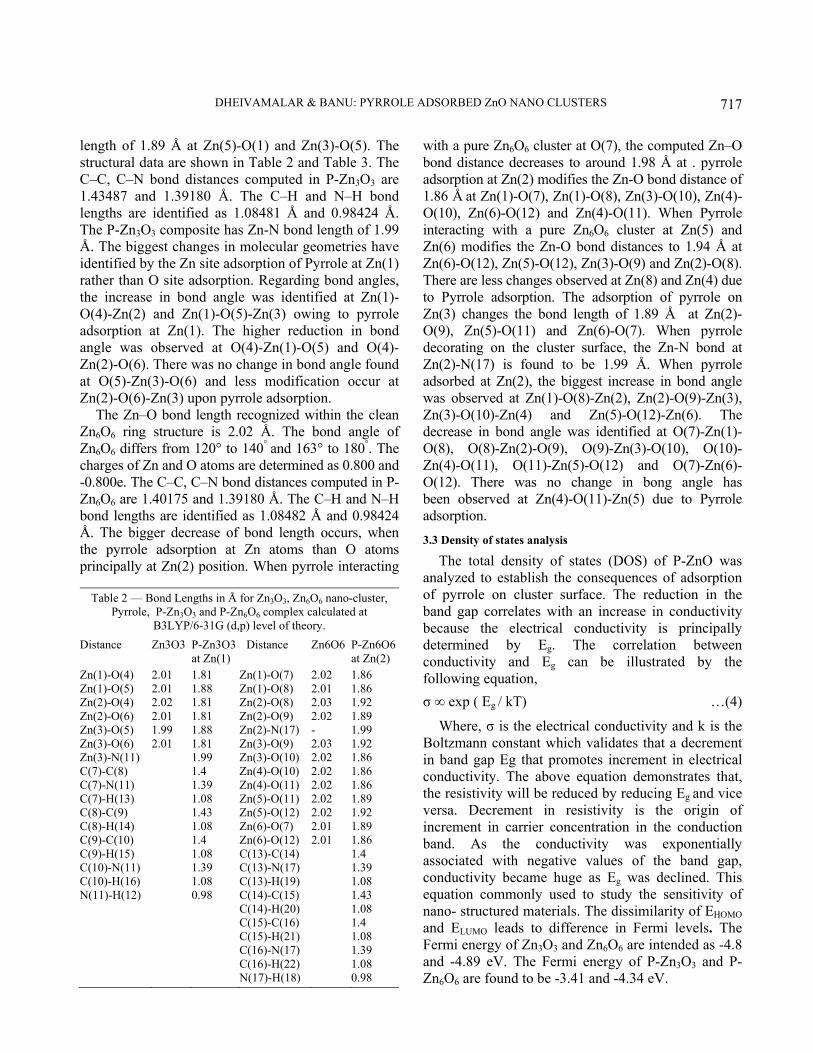
Zn3O3 and Zn6O6 clusters. The Zn3O3 and Zn6O6 nano-clusters are broad bandgap semiconductor material. pyrrole is introduced on the surface and interacts via a Nitrogen atom in order to modify their electronic properties. The interaction of Zn3O3 and Zn6O6 with pyrrole has shown in Fig. 4. The HOMO-LUMO pictures of P-Zn3O3 and P-Zn6O6 and its DOS plot are appearing in Fig. (5 and 6). The HOMO is positioned in the carbon atom region of pyrrole and LUMO is dispersed on entire atoms of P-Zn3O3 and P-Zn6O6. From DFT computation, the energies of HOMO and LUMO of P-Zn3O3 are -4.06 and -2.77 eV, which induce Eg of 1.28 eV. The estimated value of EHOMO and ELUMO of P-Zn6O6 are -5.74 and -2.94 eV, which derive Eg as 2.79 eV24. The Nitrogen atom in pyrrole is electron rich, whereas Zn atoms in semiconductor nano-clusters are electron inadequate. The adsorption of pyrrole causes a significant shift of the occupied
Fig. 1 — The optimized structure of Zn3O3 nano-cluster,HOMO/LUMO and its DOS spectrum calculated at B3LYP/6-31G (d,p).
Fig. 2 — The optimized structure of Zn6O6 nano-cluster,HOMO/LUMO and its DOS spectrum calculated at B3LYP/6-31G (d,p).
Fig. 3 — The optimized structure of Pyrrole, HOMO/LUMOprofiles of Pyrrole and its DOS spectrum.
Fig. 4 — Interaction of Pyrrole on Zn3O3 and Zn6O6 nano-cluster surface.
INDIAN J PURE & APPL PHYS, VOL. 57, OCTOBER 2019
716
orbital of cluster to high energy levels and newly formed HOMO orbital were exist between the HOMO and LUMO of their pristine forms.
The HOMO is extremely switched on higher energy levels, but LUMO is hardly shifted to higher
energy levels. Interaction of pyrrole causes decrement in band gap which gives lower kinetic stability, larger electron conductivity and higher chemical reactivity. Adsorption of Pyrrole on Zn3O3 increases the energies of HOMO without much affecting the energies of LUMO. Adsorption of pyrrole on Zn6O6 slightly increases the energies of HOMO without interrupting LUMO. By repeating all the computation at the B3LYP/LANL2DZ level of theory, the value of energy gap somewhat larger than the Eg computed by B3LYP/6-31G which is listed in Table 1. The methods of calculation used here are sustains the energy gap of P-ZnO is sensitive towards pyrrole adsorption.
3.2 Analysis of structural properties The binding energy of clusters was computed using
the equation, EB=[(nEZn + nEo - EZnO) /n], where n is the number of ZnO molecules in the nano-cluster. The binding energy and energy gap values are more massive for Zn3O3 than Zn6O6. As a result, the Zn3O3 system is more stable owing to its higher band gap and larger binding energy. The pure Zn3O3 hexagonal structure with D3h symmetry comprised of Zn–O bonds. The bond angle fluctuates from 78.5 to 91.2 and 144 to 159.3. The Zn–O bond length can be identified within the Zn3O3 nano-structure is about 2.01 Å. The nature of Zn-O bond is ionic because there is the charge transfer from Zn atoms to O atoms. The charges of Zn atoms and O atoms are found to be 0.743 and -0.743e, respectively. When Pyrrole interacting with a pure Zn3O3 cluster at O(4), the computed Zn–O bond distance slightly decreases to around 1.97 Å. When pyrrole interacting with a pure Zn3O3 cluster at Zn(1), the computed Zn–O bond distance decreases to around 1.81 Å. The bonds at Zn(1)–O(4),Zn(2)–O(4), Zn(2)-O(6) and Zn(3)–O(6) are decreases to 1.81 Å in the singlet ground state. The adsorption of pyrrole at Zn (3) changes the bond
Fig. 5 — Density of states plot and HOMO/LUMO profiles ofP-Zn3O3.
Fig. 6 — Density of states plot and HOMO/LUMO profiles ofP-Zn6O6.
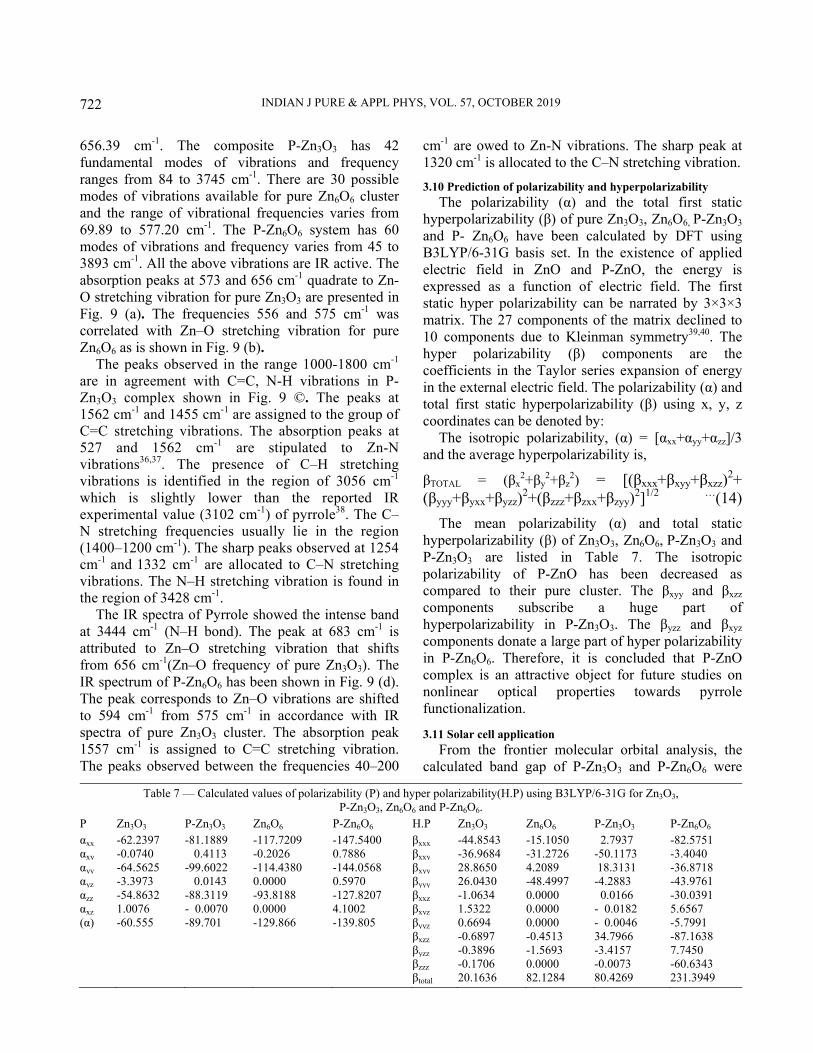
Table 1 — Calculated energy gap (Eg), energy shift (ΔEg), Fermi energy (EF) and computed dipole moment (µd) of Zn3O3, Zn6O6 nano-cluster, Pyrrole, P-Zn3O3 and P-Zn6O6.
System Methods Dipole moment(µd)Debye EHOMO eV EF eV ELUMO eV Eg eV bΔEg eV Ead kcal/Mol Zn3O3 B3LYP/6-31G 1.05 -6.64 -4.81 -2.96 3.77 - - Pyrrole 1.86 -5.49 -2.17 1.15 6.64 - - P-Zn3O3 3.55 -4.06 -3.41 -2.77 1.28 -2.49 9.619 Zn6O6 1.76 -6.70 -4.89 -3.09 3.61 - - P-Zn6O6 6.0 -5.74 -4.34 -2.94 2.79 -0.82 1.214 Zn3O3 B3LYP/LANL2DZ 1.12 -6.91 -4.96 -3.02 3.89 - - P-Zn3O3 4.29 -4.23 -3.54 -2.86 1.37 -2.52 9.824 Zn6O6 2.17 -7.42 -5.53 -3.65 3.77 - - P-Zn6O6 6.72 -6.38 -4.93 -3.48 2.90 -0.87 1.675 Pyrrole 2.43 -5.61 -2.16 1.28 6.89 - -
DHEIVAMALAR & BANU: PYRROLE ADSORBED ZnO NANO CLUSTERS
717
length of 1.89 Å at Zn(5)-O(1) and Zn(3)-O(5). The structural data are shown in Table 2 and Table 3. The C–C, C–N bond distances computed in P-Zn3O3 are 1.43487 and 1.39180 Å. The C–H and N–H bond lengths are identified as 1.08481 Å and 0.98424 Å. The P-Zn3O3 composite has Zn-N bond length of 1.99 Å. The biggest changes in molecular geometries have identified by the Zn site adsorption of Pyrrole at Zn(1) rather than O site adsorption. Regarding bond angles, the increase in bond angle was identified at Zn(1)-O(4)-Zn(2) and Zn(1)-O(5)-Zn(3) owing to pyrrole adsorption at Zn(1). The higher reduction in bond angle was observed at O(4)-Zn(1)-O(5) and O(4)-Zn(2)-O(6). There was no change in bond angle found at O(5)-Zn(3)-O(6) and less modification occur at Zn(2)-O(6)-Zn(3) upon pyrrole adsorption.
The Zn–O bond length recognized within the clean Zn6O6 ring structure is 2.02 Å. The bond angle of Zn6O6 differs from 120° to 140° and 163° to 180°. The charges of Zn and O atoms are determined as 0.800 and -0.800e. The C–C, C–N bond distances computed in P- Zn6O6 are 1.40175 and 1.39180 Å. The C–H and N–H bond lengths are identified as 1.08482 Å and 0.98424 Å. The bigger decrease of bond length occurs, when the pyrrole adsorption at Zn atoms than O atoms principally at Zn(2) position. When pyrrole interacting
with a pure Zn6O6 cluster at O(7), the computed Zn–O bond distance decreases to around 1.98 Å at . pyrrole adsorption at Zn(2) modifies the Zn-O bond distance of 1.86 Å at Zn(1)-O(7), Zn(1)-O(8), Zn(3)-O(10), Zn(4)-O(10), Zn(6)-O(12) and Zn(4)-O(11). When Pyrrole interacting with a pure Zn6O6 cluster at Zn(5) and Zn(6) modifies the Zn-O bond distances to 1.94 Å at Zn(6)-O(12), Zn(5)-O(12), Zn(3)-O(9) and Zn(2)-O(8). There are less changes observed at Zn(8) and Zn(4) due to Pyrrole adsorption. The adsorption of pyrrole on Zn(3) changes the bond length of 1.89 Å at Zn(2)-O(9), Zn(5)-O(11) and Zn(6)-O(7). When pyrrole decorating on the cluster surface, the Zn-N bond at Zn(2)-N(17) is found to be 1.99 Å. When pyrrole adsorbed at Zn(2), the biggest increase in bond angle was observed at Zn(1)-O(8)-Zn(2), Zn(2)-O(9)-Zn(3), Zn(3)-O(10)-Zn(4) and Zn(5)-O(12)-Zn(6). The decrease in bond angle was identified at O(7)-Zn(1)-O(8), O(8)-Zn(2)-O(9), O(9)-Zn(3)-O(10), O(10)-Zn(4)-O(11), O(11)-Zn(5)-O(12) and O(7)-Zn(6)-O(12). There was no change in bong angle has been observed at Zn(4)-O(11)-Zn(5) due to Pyrrole adsorption.
3.3 Density of states analysis
The total density of states (DOS) of P-ZnO was analyzed to establish the consequences of adsorption of pyrrole on cluster surface. The reduction in the band gap correlates with an increase in conductivity because the electrical conductivity is principally determined by Eg. The correlation between conductivity and Eg can be illustrated by the following equation,
σ ∞ exp ( Eg / kT) …(4)
Where, σ is the electrical conductivity and k is the Boltzmann constant which validates that a decrement in band gap Eg that promotes increment in electrical conductivity. The above equation demonstrates that, the resistivity will be reduced by reducing Eg and vice versa. Decrement in resistivity is the origin of increment in carrier concentration in the conduction band. As the conductivity was exponentially associated with negative values of the band gap, conductivity became huge as Eg was declined. This equation commonly used to study the sensitivity of nano- structured materials. The dissimilarity of EHOMO and ELUMO leads to difference in Fermi levels. The Fermi energy of Zn3O3 and Zn6O6 are intended as -4.8 and -4.89 eV. The Fermi energy of P-Zn3O3 and P-Zn6O6 are found to be -3.41 and -4.34 eV.
Table 2 — Bond Lengths in Å for Zn3O3, Zn6O6 nano-cluster, Pyrrole, P-Zn3O3 and P-Zn6O6 complex calculated at
B3LYP/6-31G (d,p) level of theory.
Distance Zn3O3 P-Zn3O3 at Zn(1)
Distance Zn6O6 P-Zn6O6 at Zn(2)
Zn(1)-O(4) 2.01 1.81 Zn(1)-O(7) 2.02 1.86 Zn(1)-O(5) 2.01 1.88 Zn(1)-O(8) 2.01 1.86 Zn(2)-O(4) 2.02 1.81 Zn(2)-O(8) 2.03 1.92 Zn(2)-O(6) 2.01 1.81 Zn(2)-O(9) 2.02 1.89 Zn(3)-O(5) 1.99 1.88 Zn(2)-N(17) - 1.99 Zn(3)-O(6) 2.01 1.81 Zn(3)-O(9) 2.03 1.92 Zn(3)-N(11) 1.99 Zn(3)-O(10) 2.02 1.86 C(7)-C(8) 1.4 Zn(4)-O(10) 2.02 1.86 C(7)-N(11) 1.39 Zn(4)-O(11) 2.02 1.86 C(7)-H(13) 1.08 Zn(5)-O(11) 2.02 1.89 C(8)-C(9) 1.43 Zn(5)-O(12) 2.02 1.92 C(8)-H(14) 1.08 Zn(6)-O(7) 2.01 1.89 C(9)-C(10) 1.4 Zn(6)-O(12) 2.01 1.86 C(9)-H(15) 1.08 C(13)-C(14) 1.4 C(10)-N(11) 1.39 C(13)-N(17) 1.39 C(10)-H(16) 1.08 C(13)-H(19) 1.08 N(11)-H(12) 0.98 C(14)-C(15) 1.43
C(14)-H(20) 1.08 C(15)-C(16) 1.4 C(15)-H(21) 1.08 C(16)-N(17) 1.39 C(16)-H(22) 1.08
N(17)-H(18) 0.98

INDIAN J PURE & APPL PHYS, VOL. 57, OCTOBER 2019
718
The decrease in Fermi energy of P- Zn3O3 and P-Zn6O6 specifies Fermi level shifted to valence band which intensifies the work function. This stimulating phenomenon makes P-ZnO composite detect uses in field emission due to the biological compound pyrrole. The change in electronic configuration of Zn3O3 is a better sensor for pyrrole molecule than Zn6O6. The HOMO-LUMO energy, energy Gap Eg, adsorption energy Ead and ΔEg (change of Eg of cluster upon the adsorption) of pure Zn3O3 and Zn6O6
cluster, pyrrole, P-Zn3O3, and P-Zn6O6 complexes are listed in Table 2. The adsorption energy Ead of P-Zn3O3 is calculated as 9.619kcal/Mol. The high adsorption energy of P-Zn3O3 is an indicative of Chemisorption mechanism. The adsorption energy Ead for P-Zn6O6 is found to be 1.214 kcal/Mol. The low adsorption energy of P-Zn6O6 represents Physisorption mechanism25.
3.4 Prediction of dipole moment The calculated values of dipole moment (µ) of
Zn3O3 and Zn6O6 clusters are 1.0592 and 1.7628 Debye, whereas the dipole moment of pyrrole is 1.86
Debye. The considerable changes in the dipole moment of semi conductive nano-structured material are observed after adsorption of Pyrrole. The dipole moment of P-Zn3O3 and P-Zn6O6 are determined as 3.55 and 6.0 Debye. The highest change in dipole moment is observed, when Pyrrole adsorption on Zn6O6 nano-cluster. The dipole moment vector and binding energy have an inverse relationship with one another. This inverse relationship can be explained based on the distance of Pyrrole from nano-cluster. The higher bond length of Zn6O6 nano-cluster to Pyrrole predicts lower binding energy, but causes larger dipole moment. The lower bond length of Zn3O3 nano-cluster to Pyrrole predicts larger binding energy, but causes lesser dipole moment.
3.5 Prediction of global reactivity descriptors The global indices of reactivity have been
investigated for P-Zn3O3 and P-Zn6O6 in accordance with their pristine forms. Global reactivity descriptors are calculated from the energies of HOMO-LUMO in order to study the chemical stability and reactivity. The ionization potential and electron affinity have
Table 3 — Bond Angles in degrees for Zn3O3, Zn6O6 nano-cluster, Pyrrole, P-Zn3O3 and P-Zn6O6 complex calculated at B3LYP/6-31G (d,p) level of theory.
Bond Angle Zn3O3 P-Zn3O3 Bond Angle Zn6O6 P-Zn6O6 O(4)-Zn(1)-O(5) 159.37 144.84 O(7)-Zn(1)-O(8) 161.72 150.28 O(4)-Zn(2)-O(6) 153.16 144.89 O(8)-Zn(2)-O(9) 158.49 149.76 O(5)-Zn(3)-O(6) 144.71 144.97 O(8)-Zn(2)-N(17) - 112.1 O(5)-Zn(3)-N(11) - 115.56 O(9)-Zn(2)-N(17) - 93.26 O(6)-Zn(3)-N(11) - 99.46 O(9)-Zn(3)-O(10) 159.87 149.86 Zn(1)-O(4)-Zn(2) 78.5 95.17 O(10)-Zn(4)-O(11) 162.37 150.84 Zn(1)-O(5)-Zn(3) 86.2 95.11 O(11)-Zn(5)-O(12) 159.34 149.07 Zn(2)-O(6)-Zn(3) 91.25 94.99 O(7)-Zn(6)-O(12) 160.21 150.18 C(8)-C(7)-N(11) 108.41 Zn(1)-O(7)-Zn(6) 150.76 150.33 C(8)-C(7)-H(13) 130.09 Zn(1)-O(8)-Zn(2) 145.87 149.6 N(11)-C(7)-H(13) 121.48 Zn(2)-O(9)-Zn(3) 139.26 149.6 C(7)-C(8)-C(9) 107.18 Zn(3)-O(10)-Zn(4) 147.24 150.54 C(7)-C(8)-H(14) 126.44 Zn(4)-O(11)-Zn(5) 150.76 150.5 C(9)-C(8)-H(14) 126.3 Zn(5)-O(12)-Zn(6) 142.36 149.36 C(8)-C(9)-C(10) 107.18 C(14)-C(13)-N(17) 108.41 C(8)-C(9)-H(15) 126.37 C(14)-C(13)-H(19) 130.09 C(10)-C(9)-H(15) 126.44 N(17)-C(13)-H(19) 121.48 C(9)-C(10)-N(11) 108.41 C(13)-C(14)-C(15) 107.18 C(9)-C(10)-H(16) 130.11 C(13)-C(14)-H(20) 126.44 N(11)-C(10)-H(16) 121.47 C(15)-C(14)-H(20) 126.37 Zn(3)-N(11)-C(10) 146.26 C(14)-C(15)-C(16) 107.18 Zn(3)-N(11)-H(12) 88.12 C(14)-C(15)-H(21) 126.31 C(7)-N(11)-C(10) 108.79 C(16)-C(15)-H(21) 126.44 C(7)-N(11)-H(12) 125.59 C(15)-C(16)-N(17) 108.41 C(10)-N(11)-H(12) 125.6 C(15)-C(16)-H(22) 130.11 N(17)-C(16)-H(22) 121.47 Zn(2)-N(17)-C(16) 146.11 C(13)-N(17)-C(16) 108.79 C(13)-N(17)-H(18) 125.89 C(16)-N(17)-H(18) 125.6

DHEIVAMALAR & BANU: PYRROLE ADSORBED ZnO NANO CLUSTERS
719
been calculated from EHOMO and ELUMO. The quantum molecular descriptors are portrayed as,
µ = - Ψ = - (I + A)/2 … (5)
Where, I (- EHOMO) and A (- ELUMO) are the ionization potential and electron affinity of P-Zn3O3 and P-Zn6O6. The electro negativity Ψ is the negative of µ, where µ is the chemical potential of the material26.
The softness (S) and electrophilicity index (ω) are,
S = 1/2 η … (6)
ω = µ2/2 η … (7)
Chemical potential (µ) also be defined as,
µ = - (EHOMO + ELUMO)/2 … (8)
Hardness (ƞ) is calculated using Koopmans theorem as,
η = (ELUMO – EHOMO)/2 … (9)
The Fermi level (EF) of the cluster is sited at the central point of energy gap Eg
27. The chemical potential µ is also the central point of band gap Eg and hence the Fermi level is similar to the chemical potential µ. The ionization potential is the amount of energy necessitates in removing an electron from the nano-cluster. The ionization potential of pure Zn3O3
and Zn6O6 are calculated as 6.66 and 6.70 eV. The ionization potential of P-Zn3O3 is calculated as 4.06 eV and the ionization potential for P-Zn6O6 is determined as 5.74 eV. The electron affinity is mentioned as the energy evolved, when an electron is added to the cluster. The electron affinity of Zn3O3 and Zn6O6 are calculated as 2.96 and 3.09 eV. The electron affinity of P-Zn3O3 is calculated as 2.77 eV. The electron affinity of P-Zn6O6 is found to be 2.94 eV. The ionization potential and electron affinity decreases towards Pyrrole adsorption. The ionization potential and electron affinity of adsorbed complexes are lower than that of their pristine forms. This calculation reveals that the value of ionization potential is greater than the electron affinity.
The pure Zn3O3 has the hardness value of 1.85 eV which decreases significantly to 0.645 eV after Pyrrole adsorption. The value of hardness somewhat decreases for P- Zn6O6 from 1.80 to 1.4 eV in accordance with its pure cluster. The hardness depends on the difference of ionization potential and electron affinity. The softness increases for P-Zn3O3
and P-Zn6O6 complex ascribed to Pyrrole adsorption. The softness value of Zn3O3 is 0.270 eV which
moderately increased to 0.775 eV after Pyrrole adsorption. The softness value of Zn6O6 is 0.277 eV which faintly increased to 0.357 eV after Pyrrole adsorption. So that the softness value of clusters has been contrary to hardness. Electrophilicity and chemical potential has slightly increased as compared to the complexation with Pyrrole28,29. The chemical potential of the pure Zn3O3 cluster is -4.81 eV which is notably increases to -3.41 eV after pyrrole adsorption. The chemical potential of pure Zn6O6 is -4.89 eV which increases to -4.34 eV in P-Zn6O6 and the electrophilicity index of P-Zn6O6 cluster increases to 6.727 eV from its clean cluster value (6.642 eV). The electrophilicity of Zn3O3 is 6.253 eV which considerably increases to 9.040 eV towards Pyrrole adsorption. Chemical potential (µ), hardness (ƞ), softness (S), and electrophilicity (ω) of pure Zn3O3,
Zn6O6, Pyrrole, P-Zn3O3, and P-Zn6O6 are listed in Table 4.
3.6 Mulliken population analysis Mulliken atomic charge distribution plays vital role
in quantum chemical calculation in order to explain the possibilities of hydrogen bonding and the atomic charge values30. The Mulliken atomic charges of P-Zn3O3 and P-Zn6O6 are listed in Table 5. The Mulliken population analysis for P-Zn3O3 and P-Zn6O6 has been calculated using DFT/B3LYP level with 6-31G (d, p) basis set. Mulliken atomic charge plot has been shown in Fig. 7. In the P-Zn3O3 configuration, the atoms Zn1, Zn2, Zn3, C7, C8, C10, H12, H14, H15 and H16 possess positive charges; which are acceptors. The atoms O4, O5, O6, C9, N11 and H13 have negative charges; which are donors. The Oxygen O5 is more negative with a value -0.806988. The Zn3 atom shows more positive charge (0.64144). In P-Zn6O6, the atoms Zn1, Zn2, Zn3, C7, C8, C10, H12, H14, H15 and H16 have positive charges that are acceptors and the atoms O4, O5, O6, C9, N11 and H13 have negative charges that are donors. The Oxygen N5 is more negative with a value (-1.007562). The Zn12 atom posses more positive charge (0.83628).
Table 4 — Calculated values of the global molecular reactivity descriptors of Zn3O3, Zn6O6, Pyrrole, P- Zn3O3 and P- Zn6O6.
Property Pyrrole Zn3O3 Zn6O6 P-Zn3O3 P-Zn6O6 I = -Eh eV 5.49 6.66 6.70 4.06 5.74 A = -El eV -1.15 2.96 3.09 2.77 2.94 Ƞ = (I – A)/2eV 3.32 1.85 1.80 0.645 1.4 µ = - (I + A)/2 -2.17 -4.81 -4.89 -3.415 -4.34 S = 1/2ƞeV 0.150 0.270 0.277 0.775 0.3571 ω = µ2/2ƞeV 0.7091 6.253 6.642 9.040 6.727

INDIAN J PURE & APPL PHYS, VOL. 57, OCTOBER 2019
720
3.7 Thermo-chemistry analysis Thermodynamic properties such as zero point
vibrational energy, thermal energy, specific heat capacity (Cv), rotational constants, enthalpy (H), Gibbs free energy (G) and entropy (S) of P-Zn3O3 and P-Zn6O6 and their pure clusters at room temperature (298.15 K) in the ground state31 are listed in Table 6. The tremendous value of zero point vibrational energy of P-Zn3O3 and P-Zn6O6 is calculated by the DFT and they are 70.8450 and 66.8600 kcal/Mol. The specific heat capacity (Cv)
explains the thermal capacity at room temperature with a constant volume. According to Table 6, the thermal capacity of P-Zn3O3 is increased (25.603 Cal/Mol-Kelvin) as compared with its pure Zn3O3 nano-cluster (23.365 Cal/Mol-Kelvin). The
Thermal capacity of P-Zn6O6 is increased to 62.236 Cal/Mol-Kelvin as compared with the thermal capacity of its pure cluster (56.152 Cal/Mol-Kelvin). The change in enthalpies (ΔHad), free energies (ΔGad) and entropies (ΔS) of P-Zn3O3 have been calculated from the frequency calculations and the values are 2.46, 2.53 and -67.228 Cal/Mol-Kelvin. The change in enthalpies (ΔHad), free energies (ΔGad) and entropies (ΔS) of P-Zn6O6 have been calculated from the frequency calculations and their values are 66.10, 66.13 and -67.228 Cal/Mol-Kelvin. These values were determined according to the subsequent equations:
Fig. 7 — Mulliken atomic charge distribution plot of P-Zn3O3
and P-Zn6O6.
Table 5 — Calculated values of Mulliken charges (a.u) for Zn3O3, Zn6O6 nano-cluster, Pyrrole, P-Zn3O3 and P-Zn6O6 at B3LYP/6-31G
basis set.
Atoms Zn3O3 Pyrrole P-Zn3O3 Atoms Zn6O6 P-Zn6O6
Zn1 0.744095 0.641444 Zn1 0.760853 0.836286Zn2 0.743237 0.434668 Zn2 0.761836 0.608859Zn3 0.742846 0.638739 Zn3 0.756232 0.785441O4 -0.743733 -0.741862 Zn4 0.782964 0.670388O5 -0.743563 -0.806988 Zn5 0.771278 0.817102O6 -0.742882 -0.347106 Zn6 0.800339 0.824252C7 0.075650 0.156755 O7 -0.756124 -0.800752C8 -0.171762 0.121946 O8 -0.762731 -0.808148C9 -0.171800 -0.094196 O9 -0.770760 -0.780722C10 0.075655 0.176819 O10 -0.751984 -0.799669N11 -0.653931 -0.743757 O11 -0.794209 -0.815536H12 0.315952 0.406399 O12 -0.797694 -0.838565H13 0.142363 -0.233962 C13 0.374616H14 0.122758 0.027671 C14 -0.316385H15 0.122753 0.164804 C15 -0.289019H16 0.142362 0.198626 C16 0.087618 N17 -1.007562 H18 0.417679 H19 0.307220 H20 0.226152 H21 0.239973 H22 0.260771
Table 6 — The thermodynamic parameters of Zn3O3, Zn6O6, Pyrrole, P-Zn3O3 and P-Zn6O6 at B3LYP/6-31G basis set.
Thermodynamic parameters Pyrrole Zn3O3 P-Zn3O3 Zn6O6 P-Zn6O6 Total energy (Thermal), Etotal (kcal/Mol) 54.036 11.337 75.427 22.825 78.075 Vibrational energy, Evib (kcal/Mol) 52.259 9.554 73.650 21.048 76.297 Zero point vibrational energy (kcal/Mol) 51.31918 6.6024 70.8450 11.79451 66.860 Rotational constants (GHz) X Y Z
9.02345 8.69843 4.42898
1.5497 1.5472 0.7742
1.3149 0.5481 0.3868
0.17841 0.16085 0.08459
0.17293 0.09840 0.06317
Specific Heat Cv (cal/Mol/K) 14.953 23.365 25.603 56.152 62.236 Entropy S, (cal/Mol/K) 68.073 90.027 90.872 139.683 141.408 Zero point correction (Hartee/particle) 0.081782 0.01052 0.11289 0.018796 0.106548 Thermal correction to energy 0.086113 0.01805 0.12020 0.036374 0.124420 Thermal correction to enthalpy 0.087057 0.01900 0.12114 0.037318 0.125364 Thermal correction to Gibbs Free energy 0.054713 -0.02377 0.07796 -0.029050 0.058176

DHEIVAMALAR & BANU: PYRROLE ADSORBED ZnO NANO CLUSTERS
721
ΔHad = HZn3O3-Pyrrole–HPyrrole–HZn3O3; ΔHad = HZn6O6-Pyrrole–HPyrrole–HZn6O6 … (10)
ΔSad = SZn3O3-Pyrrole–SPyrrole–SZn3O3; ΔSad = SZn6O6-Pyrrole–SPyrrole–SZn6O6 … (11)
ΔGad= GZn3O3-Pyrrole–GPyrrolr–GZn3O3; ΔGad= GZn6O6-Pyrrole–GPyrrolr–GZn6O6 … (12)
Where, Hcomplex, Hcluster and Hpyrrole are sum of electronic and thermal enthalpies of P-ZnO, ZnO and Pyrrole. Gcomplex, Gcluster and Gpyrrole are sum of electronic and thermal free energies of P-ZnO, ZnO and Pyrrole. Scluster, SPyrrole and Spyrrole are entropies of P-ZnO, ZnO and pyrrole.
3.8 Molecular electrostatic potential surface analysis Molecular electrostatic potential surface (MEPs)
has been investigated to study the interactions and charge distributions of P-Zn3O3 and P-Zn6O6 complex. All isosurfaces are illustrated by the isovalue of 0.0004 e/au3 in the Gauss view program. The positive and negative regions of the electrostatic potential in MEP plot are characterized by blue and red color respectively. MEP surface prompted by the charge distribution of the molecule in an atomic site is defined as:
V (r) = ∑ ′ ′
′ … (13)
ZA is the charge on nucleus A at RA32,33. MEPs
plots in Fig. 8 (a and b) show that the Zn atoms were positively charged (blue in color) while the O atoms were negatively charged (red in color) because there is a charge transfer from Zn atoms to O atoms
predicting ionic bonds in nano-cluster surface. Fig. 8 (c and d) shows that the sector of Zn atoms is identified by blue in color which specifies the positive charge because there is the charge transfer from ZnO nano-cluster to pyrrole34.
3.9 Spectral analysis
The evaluation of vibrational frequencies is an appreciable parameter to explore the local minimum in structures35. The theoretical IR spectra of ZnO and P-ZnO complexes were shown in Fig. 9. The geometry under investigation has 12 fundamental modes of vibrations for pure Zn3O3 nano-cluster and vibrational frequencies are in the range of 141.24 to
Fig. 8 — Molecular electrostatic potential surfaces for Pyrrole adsorbed and pure Zn3O3 and Zn6O6 nano-cluster.
Fig. 9 — Theoretical IR spectra of Zn3O3, Zn6O6, P-Zn3O3, and P-Zn6O6.
INDIAN J PURE & APPL PHYS, VOL. 57, OCTOBER 2019
722
656.39 cm-1. The composite P-Zn3O3 has 42 fundamental modes of vibrations and frequency ranges from 84 to 3745 cm-1. There are 30 possible modes of vibrations available for pure Zn6O6 cluster and the range of vibrational frequencies varies from 69.89 to 577.20 cm-1. The P-Zn6O6 system has 60 modes of vibrations and frequency varies from 45 to 3893 cm-1. All the above vibrations are IR active. The absorption peaks at 573 and 656 cm-1 quadrate to Zn-O stretching vibration for pure Zn3O3 are presented in Fig. 9 (a). The frequencies 556 and 575 cm-1 was correlated with Zn–O stretching vibration for pure Zn6O6 as is shown in Fig. 9 (b).
The peaks observed in the range 1000-1800 cm-1 are in agreement with C=C, N-H vibrations in P-Zn3O3 complex shown in Fig. 9 ©. The peaks at 1562 cm-1 and 1455 cm-1 are assigned to the group of C=C stretching vibrations. The absorption peaks at 527 and 1562 cm-1 are stipulated to Zn-N vibrations36,37. The presence of C–H stretching vibrations is identified in the region of 3056 cm-1
which is slightly lower than the reported IR experimental value (3102 cm-1) of pyrrole38. The C–N stretching frequencies usually lie in the region (1400–1200 cm-1). The sharp peaks observed at 1254 cm-1 and 1332 cm-1 are allocated to C–N stretching vibrations. The N–H stretching vibration is found in the region of 3428 cm-1.
The IR spectra of Pyrrole showed the intense band at 3444 cm-1 (N–H bond). The peak at 683 cm-1 is attributed to Zn–O stretching vibration that shifts from 656 cm-1(Zn–O frequency of pure Zn3O3). The IR spectrum of P-Zn6O6 has been shown in Fig. 9 (d). The peak corresponds to Zn–O vibrations are shifted to 594 cm-1 from 575 cm-1 in accordance with IR spectra of pure Zn3O3 cluster. The absorption peak 1557 cm-1 is assigned to C=C stretching vibration. The peaks observed between the frequencies 40–200
cm-1 are owed to Zn-N vibrations. The sharp peak at 1320 cm-1 is allocated to the C–N stretching vibration.
3.10 Prediction of polarizability and hyperpolarizability The polarizability (α) and the total first static
hyperpolarizability (β) of pure Zn3O3, Zn6O6, P-Zn3O3 and P- Zn6O6 have been calculated by DFT using B3LYP/6-31G basis set. In the existence of applied electric field in ZnO and P-ZnO, the energy is expressed as a function of electric field. The first static hyper polarizability can be narrated by 3×3×3 matrix. The 27 components of the matrix declined to 10 components due to Kleinman symmetry39,40. The hyper polarizability (β) components are the coefficients in the Taylor series expansion of energy in the external electric field. The polarizability (α) and total first static hyperpolarizability (β) using x, y, z coordinates can be denoted by:
The isotropic polarizability, (α) = [αxx+αyy+αzz]/3 and the average hyperpolarizability is,
βTOTAL = (βx2+βy
2+βz2) = [(βxxx+βxyy+βxzz)
2+ (βyyy+βyxx+βyzz)
2+(βzzz+βzxx+βzyy)2]1/2 …(14)
The mean polarizability (α) and total static hyperpolarizability (β) of Zn3O3, Zn6O6, P-Zn3O3 and P-Zn3O3 are listed in Table 7. The isotropic polarizability of P-ZnO has been decreased as compared to their pure cluster. The βxyy and βxzz components subscribe a huge part of hyperpolarizability in P-Zn3O3. The βyzz and βxyz components donate a large part of hyper polarizability in P-Zn6O6. Therefore, it is concluded that P-ZnO complex is an attractive object for future studies on nonlinear optical properties towards pyrrole functionalization.
3.11 Solar cell application From the frontier molecular orbital analysis, the
calculated band gap of P-Zn3O3 and P-Zn6O6 were
Table 7 — Calculated values of polarizability (P) and hyper polarizability(H.P) using B3LYP/6-31G for Zn3O3, P-Zn3O3, Zn6O6 and P-Zn6O6.
P Zn3O3 P-Zn3O3 Zn6O6 P-Zn6O6 H.P Zn3O3 Zn6O6 P-Zn3O3 P-Zn6O6 αxx -62.2397 -81.1889 -117.7209 -147.5400 βxxx -44.8543 -15.1050 2.7937 -82.5751 αxy -0.0740 0.4113 -0.2026 0.7886 βxxy -36.9684 -31.2726 -50.1173 -3.4040 αyy -64.5625 -99.6022 -114.4380 -144.0568 βxyy 28.8650 4.2089 18.3131 -36.8718 αyz -3.3973 0.0143 0.0000 0.5970 βyyy 26.0430 -48.4997 -4.2883 -43.9761 αzz -54.8632 -88.3119 -93.8188 -127.8207 βxxz -1.0634 0.0000 0.0166 -30.0391 αxz 1.0076 - 0.0070 0.0000 4.1002 βxyz 1.5322 0.0000 - 0.0182 5.6567 (α) -60.555 -89.701 -129.866 -139.805 βyyz 0.6694 0.0000 - 0.0046 -5.7991 βxzz -0.6897 -0.4513 34.7966 -87.1638 βyzz -0.3896 -1.5693 -3.4157 7.7450 βzzz -0.1706 0.0000 -0.0073 -60.6343 βtotal 20.1636 82.1284 80.4269 231.3949

DHEIVAMALAR & BANU: PYRROLE ADSORBED ZnO NANO CLUSTERS
723
increased in the order P-Zn6O6 > P-Zn3O3. The donor HOMO and the acceptor LUMO get affected by the modification of molecular geometries of P-ZnO composite. We have investigated the photovoltaic properties of the above compound as donor correlated with [6,6] – phenyl – C61 – butyric acid methyl ester (PCBM) as an acceptor in solar cell applications because of the extraordinary property of ZnO nano-cluster as a shallow donor or acceptor41. The LUMO energy level of the donor P-ZnO are higher than the conduction band of the acceptor PCBM, which predicts that this compound may be an efficient candidate in photovoltaic cell uses. The HOMO and LUMO levels of PCBM were calculated as -6.10 eV and -3.70 eV. The open circuit voltage of organic solar cells has been linearly related with the HOMO of donor and the LUMO of acceptor42. The value of open circuit voltage VOC is calculated by:
VOC = │EHOMO (Donor)│ – │ELUMO (Acceptor)│ -0.3
The value of VOC of P-Zn3O3 is found to be 1.5 eV and the value of VOC of P-Zn6O6 was observed as 3.0 eV. So that, the Pyrrole adsorbed ZnO nano-cluster can be used as sensitizers.
4 Conclusions The structural, energetic and electronic properties
of pyrrole adsorption on Zn3O3 and Zn6O6 nano-clusters have been investigated and compared with their pure clusters using computational methods. Optimized geometries, thermodynamic properties, Mulliken atomic charges, vibrational spectra and quantum mechanical descriptors have also been calculated. The Pyrrole is strongly adsorbed on Zn3O3 cluster surface than Zn6O6 nano-cluster with the remarkable adsorption energy of chemisorption interaction. The pyrrole adsorption process significantly changed the electronic properties of the clusters by decreasing HOMO-LUMO energy gap. The calculations from various basis sets predicts that there is a significant charge transfer from the ZnO nano-cluster to pyrrole which reduces the energy gap Eg. The HOMO-LUMO gap of P-Zn3O3 is 1.28 eV which is much lower than the pure Zn3O3 nano-cluster (3.77 eV). The HOMO-LUMO gap of P-Zn6O6 is 2.97 eV which is slightly lower than the pure Zn6O6
nano-cluster (3.61 eV). The above result proves that effective binding could not be attained by increasing the size of the clusters. The pyrrole adsorption provides high conduction and higher stability for Zn3O3 rather than Zn6O6 cluster. The dipole moment
of P-Zn3O3 and P-Zn6O6 is higher than their pure forms. The pyrrole adsorption assists the homogeneous hexagonal Zn3O3 nano-cluster as more firm, great sensitive, highly reactive and more conductive than Zn6O6 which would be a better potential originator for biomedical nano-technology, solar cells and catalytic applications. References 1 Wang J, Ma L, Liang Y, Gao M & Wang G, J Theor Comp
Chem, 13 (2014) 1450050. 2 Kirti Sahu & Murty V V S, Indian J Pure Appl Phys, 54
(2016) 485. 3 Cheng C W, Chen C M & Lee Y C, Appl Surf Sci, 255
(2009) 5770. 4 Kumar N, Sharma J D & Ahluwalia P K, Indian J Pure Appl
Phys, 54 (2016) 427. 5 Qju X, Howe J Y, Meyer H M, Tuncer E & Parantharman M
P, Appl Surf Sci, 257 (2011) 4057. 6 Mohamed F S & Foroutan M, J Theor Comp Chem, 13,
(2014) 140063. 7 Xu S, Zhang M, Zhao Y, Chen B, Zhang J & Sun C C, Chem
Phys Lett, 423 (2006) 212. 8 Beheshtian J, Peyghan A A & Bagheri Z, Monatsh Chem,
143 (2012) 1623. 9 Shokuhi R A, Sadeghi S S, Mohseni S & Alijantabar A S, J
Solid State Chem, 237 (2016) 204. 10 Shokuhi R A, Modanlou J Y, Foukolaei V P & Ehsan B,
Curr Appl Phys 16 (2016) 527. 11 Bachtold A, Hadley P, Nakanishi T & Dekker C, Science,
294 (2001) 1317. 12 Varghese S S, Lonkar S, Singh K K, Swaminathan S S &
Abdala A, Sensors Actuators B: Chem, 218 (2015) 160. 13 Wu Y L, Tok A I Y, Boey F Y C, Zeng X T & Zhang X H,
Appl Surf Sci, 253 (2007), 5473. 14 Guldali O E & Okur I, Indian J Pure Appl Phys, 54 (2016) 99. 15 Duan J, Huang X & Wang E, Mater Lett, 60 (2006) 1918. 16 O’Boyle N M, Tenderholt A L & Langer K M, J Comput
Chem, 29 (2008) 839. 17 Loudon & Marc G, Chemistry of Naphthalene and the
Aromatic Heterocycles, Organic (4th Edn), (Oxford University Press: New York), (2002) 1135.
18 Karimi S, Ma S, Liu Y, Ramig K, Greer E M, Kwon K, Berkowitz W F & Subramaniam G, Tetrahedron Lett, 58 (2017) 223.
19 Singh D K, Srivastava S K, Ojha A K & Asthana B P, Spec Acta Part A, 71 (2008) 823.
20 Sabbaghan M & Ghalaei A, J Mol Liq, 193 (2014) 116. 21 Venkatesh G, Govindaraju M, Vennila P & Kamal C, J
Theor Comp Chem, 15 (2016) 1650007. 22 Borhan A N, Masoud S, Rostam M & Iraj M, Eur Phys J
Appl Phys, 67 (2014) 20403. 23 Shah K, Ghulam M, Saeed U J, Nazeem U & Abdulla Y,
Indian J Pure Appl Phys, 54 (2016) 694. 24 Mallick P, Indian J Pure Appl Phys, 55 (2017) 187. 25 Beheshtian J, Ahmadi P A & Bagheri Z, App Surf Sci, 258
(2012) 8171. 26 Ali S & Khurshid A, J Alloy Compd, 678 (2016) 317. 27 Liu F T, Cheng Y, Yang F B & Chen X R, Eur Phys J Appl
Phys, 66 (2014) 30401.
INDIAN J PURE & APPL PHYS, VOL. 57, OCTOBER 2019
724
28 Chattaraj P K & Roy D R, Chem Rev, 107 (2007) 46. 29 Chattaraj P K, Sarkar U & Roy D R, Chem Rev, 106 (2006)
2065. 30 Dheivamalar S & Sugi L, Spectrochim Acta Part A, 151
(2015) 687. 31 Salimi H, Peyghan A A & Noei M, J Clustr Sci, 26 (2014)
609. 32 Li Y, Yuan H, Xia J , Zhang G, Zhong M, Kuang A, Wang
G, Zheng X & Chen H, Eur Phys J Appl Phys, 70 (2015) 31001.
33 Li L, Chen X, Cai W, Zhang M, Liang X & Tian A, J Theor Comp Chem, 16 (2017), 1750049.
34 Mohamdi M, Bensouilah N & Abdaoui M, J Theor Comp Chem, 15 (2016) 1650009.
35 Wahab R, Kim Y S, Hwang I H & Shin H S, Synth Mater, 2 159 (2009) 2443.
36 Benavides A R, Tlahuextl M, Tlahuext H & Carlos G V, ARKIVOC, (2008) 172.
37 Tackley D R, Dent G & Smith W E, Phys Chem Chem Phys, 2 (2000) 3949.
38 George S, Infrared and Raman characteristic group frequencies (Wiley: Chichester), 2001.
39 Arivazhagan M & Anitha R D, Spectrochim acta Part A, 83 (2011) 553.
40 Prasad O, Sinha L & Kumar N, J At Mol Sci, 1 (2010) 201. 41 Pal S & Sarkar A, J alloys Compd, 703 (2017) 26. 42 Abram T, Chitra S, Bejjit L, Bouachrine M & Lakhlifi T, J
Comp Meth Mol Des, 4 (2014) 19.