the adoption of mobile phones in emerging markets: global
TRANSCRIPT
International Journal of Communication 2 (2008), 631-661 1932-8036/20080631
Copyright © 2008 (Kas Kalba). Licensed under the Creative Commons Attribution Non-commercial No
Derivatives (by-nc-nd). Available at http://ijoc.org.
The Adoption of Mobile Phones in Emerging Markets: Global Diffusion and the Rural Challenge
KAS KALBA
Kalba International, Inc.
This paper offers an assessment of the drivers of mobile phone diffusion in emerging markets.1
It addresses both demand- and supply-side factors and provides an outlook on the diffusion
process going forward, as two or three billion more mobile users are accommodated by mobile
networks in addition to today’s 3.5 billion subscribers and users2.
The paper focuses on several specific issues, namely the relationship of mobile phone adoption to
income levels and to fixed legacy phone service, as well as the key role of prepaid phones and
asymmetrical interconnection fees in hastening mobile diffusion in emerging markets. Unlike the
growing view that mobile adoption occurs where fixed connectivity is lowest, this paper shows
that the two forms of adoption may be closely related. It also analyzes the impact of different
levels of competition on mobile phone adoption, indicating that the diffusion benefits may recede
as the number of operators increases. Finally, it provides explanations of several seeming
anomalies, such as why mobile penetration has been higher in Eastern Europe (with an aged
population) than in youthful Latin America, and why China continues to lead India in mobile
penetration despite the strong surge in mobile phone usage in the latter market in recent years.
Kas Kalba: [email protected]
Date submitted: 2008-01-04
1 It is based in part on a lengthier paper, which reviews the historical spread of mobile phones in
developed as well as emerging markets and covers a wider range of factors. See “The Adoption and
Diffusion of Mobile Phones—Nearing the Halfway Mark,” Draft, Sept. 17, 2007. The paper is undergoing
review and revision at Harvard Program on Information Resources Policy.
2 This is a general estimate that is meant to cover unique subscribers as well as users who share the
former’s phones, including family members and friends. Informa Telecoms & Media, a UK-based
industry research group, estimated 3.3 billion subscriptions (equivalent to half the world’s population) in
November 2007; see telecoms.com, “Global mobile penetration hits 50% today,” Nov. 29, 2007. See
Section 2 of the lengthier paper for a discussion of issues surrounding the definition and measurement
of the number of mobile phone “adopters” at the global level. See also the note on penetration
statistics on p. 6 below.

632 Kas Kalba International Journal of Communication 2(2008)
Looking forward, the paper addresses the major challenges the mobile industry faces in
extending mobile networks to rural regions in Africa, Asia, Latin America, and elsewhere. The
paper questions whether the market will be able to serve the last one or two billion potential
subscribers, or whether subsidies will be required. It also notes the emerging use of
infrastructure sharing and output-based subsidy schemes to foster rural network deployment and
calls for research for mobile phone awareness and ability-to-pay levels among the world’s non-
users and non-subscribers to help determine whether the recent 25% annual growth in worldwide
mobile phone diffusion is sustainable.
Inputs to the paper include a literature review, comparative databases, the author’s studies of
mobile adoption in individual countries, and the comments of reviewers of earlier drafts.3
Introduction
Mobile phones are spreading ubiquitously across the planet. They are considered a common
manifestation of the latest phase of globalization, along with Chinese consumer goods and Indian IT
services. With more than three billion subscribers around the world,4 mobile phones have out-diffused
virtually every prior technology, whether TV sets, radios, wrist watches, wallets, wireline phones, or
bicycles, and have done so in the past 25 years5. Mobile phones are now used by about half of the
world’s population.
The sheer numbers and the rapid diffusion rate are two of the reasons mobile phones merit
attention as a case in global technology diffusion. Another, however, is the baffling degree of variation in
how they have been adopted in different parts of the world — and the wide range of explanations of the
variation. In the emerging world, mobile penetration rates vary substantially — from more than 100%
3 The databases employed, as cited below, have been primarily Merrill Lynch’s and the ITU’s. The author
has directed and advised on mobile adoption and deployment studies in 12 emerging markets in Asia,
Eastern Europe, and Latin America during 1990-2001. He wishes to thank James E. Katz, John LeGates,
Richard Ling, Markku Kivenen,, William Melody, Hector Salgado, and Mike Short, who reviewed and
commented on an earlier version of this paper as well as the two anonymous reviewers for the
International Journal of Communication.
4 See note 2 above. The number of mobile phones in people’s hands and desk drawers is harder to
estimate but is probably about twice this number, causing growing concerns about battery and device
disposal.
5 For example, landline phone connections have fallen far behind. They stood at 1.26 billion at the end of
2005, up from 979 million in 2000; see ITU, ICT Statistics, available at http://www.itu.int/ITU-. As for
bicycles, there appears to be no authoritative data source; when the author contacted the International
Bicycle Fund last year on the question of the number of bicycles in use in the world, he was told that
two billion was a good guesstimate (with the two largest markets being China and India). About 100
million bicycles are sold a year vs. about one billion mobile phones.
International Journal of Communication 2 (2008) The Adoption of Mobile Phones in Emerging Markets 633
(e.g., Jamaica, Russia) to less than 1% (e.g., Papua New Guinea).6 On a regional basis, the levels range
from Europe’s 84.53% to Africa’s 15.03%.7 Even within Africa there is significant variation, with most
markets still below the 10% level, albeit growing rapidly, while three, including South Africa, are above
70%.8
These differences in adoption rates have been studied by economists, sociologists, and other
researchers. The most frequently cited explanatory factor is income, particularly at the per capita level.9
Yet recent surges in mobile subscriber growth in Africa, India, and other very low-income markets belie
this dominant view. This has raised the alternative explanation, often accepted in casual discussion, that
mobile adoption in emerging markets occurs in reverse proportion to the existence of legacy “fixed line”
connectivity. At least one study has demonstrated this effect with respect to the adoption and
deployment of information and communications technology (ICT) in general, though not specifically in
relation to mobile phones.10 In addition, the role of prepaid phone products (and associated pricing) and
6 The principal data sources for this paper are Merrill Lynch, Global Wireless Matrix 4Q06 (end of 2006
data), and ITU, Mobile Cellular Subscribers, 2005 data. The Merrill Lynch report covers the following
markets with GDP per capita of less than $10,000 (in order of ascending GDP per capita):
Bangladesh, India, Nigeria, Pakistan, Egypt, Philippines, Iraq, Indonesia, Morocco, China, Ukraine,
Colombia, Peru, Thailand, Algeria, Turkey, South Africa, Brazil, Argentina, Venezuela, Malaysia,
Russia, Mexico, Chile, and Poland. The analyses that follow rely on either the Merrill Lynch or ITU
data, as indicated in each case.
7 Still another reason why it is important to understand the mobile phone diffusion process is that
mobile phones can provide access to newer technologies such as the Internet. Vinton Cerf, one of the
founding fathers of the internet, recently acknowledged the greater connectivity of mobile phones
compared to the internet (currently accessed on a fixed basis by about one billion users) and
projected the future growth of the web through mobile devices: Cerf, V. (2007, February 21). Cerf
catches mobile wave. telecom.com.
8 ITU, op. cit.
9 For a traditional regression-based analysis of income and penetration, see H. Gruber and F. Verhoven,
“The evolution of markets under entry and standards regulation—the case of global mobile
telecommunication,” International Journal of Industrial Organization, 2001. See also Manuel Castells,
Mireia Fernandez-Ardevol, Jack Linchuan Qiu, and Araba Sey, Mobile Communication and Society: A
Global Perspective (The MIT Press: Cambridge, MA, 2007), p. 28, which cites UK market researchers,
TNS, as indicating that “GDP alone . . . explains about half of the variation in mobile-phone
penetration rates.” Castells et al., caution that this does not imply causality.
10 The study results, based on 1995 to 2005 data for 200 countries, indicate that greater legacy
telecommunications infrastructure has a negative effect on a country’s development of its ICT sector.
See Philip N. Howard, “Testing the Leap-Frog Hypothesis,” Information, Communication & Society,
Vol. 10, No. 2, April 2007, pp. 133-157.

634 Kas Kalba International Journal of Communication 2(2008)
that of Calling Party Pays (CPP) billing have been posited as important adoption facilitators.11 The roles of
gender,12 technical standards,13 and the number of competing operators14 have also been examined, along
with differing usage patterns in emerging markets.15
11 The case that CPP and prepaid increased adoption significantly in Latin America is made in Judith
Mariscal, “Market Structure and Penetration in the Latin American Mobile Sector,” WDR Dialogue
Theme 3rd cycle, Discussion Paper WDR0616, Draft, December 2006.
12 See Manuel Castells et al., op. cit, pp. 41-42 on gender and adoption; for a discussion of the wide
range of differences in how women and men use mobile phones, see pp. 45-55. Castells et al. cite a
source (Huyer et al., 2005) that indicates that mobile phones in South Africa are owned
disproportionately by men. However, another source suggests otherwise; see Jonathan Samuel, Niraj
Shas and Wenona Hadingham, “Mobile Communications in South Africa, Tanzania and Egypt: Results
from Community and Business Surveys,” in Africa: The Impact of Mobile Phones, The Vodafone policy
paper series, Number 3, March 2005. Part of the issue may be different survey methodologies. In
general, the higher the overall penetration rate, the smaller the gender divide, with South Africa’s
rate being the highest on the African mainland.
13 For an argument that unified standards with respect to the transmission (air interface) method as well
as commonality of frequency bands across countries foster adoption, see Gustave Barth, “Cellular
Phones: Is There Really Competition,” Incidental Paper, Program on Information Resources Policy,
Harvard University, Cambridge, MA, August 1994; also Gustave Barth, “Spectrum for Mobile
Communications in the World,” Program on Information Resources Policy, Harvard University,
Cambridge, MA, October 2003. See also H. Koski and T. Kretschmer, op. cit., who conclude (p. 109)
that technology standardization “increases the expected user value of mobile services, resulting in
quicker diffusion”. At the same time, the regression analysis of Koski and Kretschmer shows that
lower prices are associated with multiple standards, reflecting a more intense level of competition. In
the end, the research results so far with respect to the role of standardization (or lack thereof) in the
diffusion process are not entirely consistent.
14 See Thomas W. Hazlett and Roberto E. Muñoz, “A Welfare Analysis of Spectrum Allocation Policies,”
George Mason University Law and Economics Research Paper Series, 06-28. See also H. Gruber and
F. Verhoven, op. cit.; and Heli Koski and Tobias Kretschmer, op. cit., p. 106.
15 For example, a survey of mobile phone owners, non-owning users, and non-owners/non-users in
South Africa and Tanzania found that non-owning users made significantly fewer calls than owners.
More importantly, they made very few calls to “doctors, teachers, and police or security forces.”
Nonetheless, they regularly used mobile phones, typically 1-3 times per week. See James Goodman,
“Linking mobile phone ownership and use to social capital in rural South Africa and Tanzania,” in
Africa, op. cit., p. 62.

International Journal of Communication 2 (2008) The Adoption of Mobile Phones in Emerging Markets 635
Overall, mobile phone diffusion has reflected globalization on the one hand, and local and
regional variation on the other. The world, as a whole, is rapidly adopting mobile phones and associated
services, yet the pace of adoption varies substantially across markets. Moreover, much of the world’s
population — about half — has not yet adopted the technology. The purpose of this paper is to assess
how diffusion factors, such as average income and product innovation, have shaped mobile phone
diffusion as it has moved from high-income markets to emerging ones, using data that is more recent and
detailed than that available to past researchers.16 A second purpose is to look ahead at diffusion issues
facing the spread of mobile phones into the remaining — largely rural — portions of the developing world.
Specifically, the paper addresses a number of questions related to the diffusion of mobile phones
across emerging markets, including:
1. Does per capita income continue to be associated with rapid mobile phone diffusion, as it has
been in the earlier developed-market phase, or are we reaching a largely income-independent
stage of market development?
2. Has the absence of extensive legacy (i.e., wireline) service been a key driver of mobile phone
adoption in emerging markets — or is legacy service and infrastructure still an important diffusion
factor?
3. How important have prepaid mobile phones and Subscriber Identification Modules or chips (SIM
cards) been in stimulating adoption in emerging markets, and what has been the role of
associated factors such as Calling Party Pays (CPP) billing and asymmetric interconnection fees?
4. To what extent has competition, as reflected in the number of mobile operators in a given
market, driven mobile phone diffusion? (Is the frequently held view that the more operators, the
faster the market will grow a valid one?)
The paper addresses these questions as well as some “anomalies” of mobile phone diffusion in
emerging markets. For example, why has China, with a well-developed wireline network, outpaced India
(with India now replicating China’s progress but with several years lag), and why is ageing Eastern Europe
well ahead of youthful Latin America in mobile penetration?
16 This includes the data referenced in note 6 above, as well as the growing number of surveys of mobile
phone users in emerging markets in Africa, Asia and elsewhere, such as reported in Rohan
Samarayiva and Ayesha Zainudeen, eds., ICT Infrastructure in Emerging Asia (SAGE and IDRC,
2008), covering India and Sri Lanka. See also Africa: The Impact of Mobile Phones, The Vodafone
policy paper series, Number 3, March 2005, covering various African markets; and D. Souter et al.,
The Economic Impact of Telecommunications on Rural Livelihoods and Poverty Reduction: A study of
rural communities in India (Gujarat), Mozambique and Tanzania (CTO for DFID, 2005).
636 Kas Kalba International Journal of Communication 2(2008)
The paper concludes by examining adoption and deployment issues in the next phase of mobile
phone diffusion, as the requisite infrastructure, distribution, and service components of mobile phone
delivery extend beyond the urban areas of emerging markets. Provisioning of these rural and more
remote locations raises new challenges for the mobile industry as well as government policy makers and
regulators.
A Note on Penetration Statistics
While standard subscriber penetration figures are used in this paper, it is important to note that
subscriber “penetration” and “adoption” are not entirely equivalent. Subscriber statistics are not generally
based on individual users, but rather on individual subscription accounts, so there is some degree of
double counting.17 The double counting problem only escalates as the “subscriber” figures of multiple
operators are combined, as consumers often — for reasons of call pricing and discounting differences
between operators or plans, coverage differences, lack of interoperability (e.g., SMS), anonymity, expense
tracking (e.g., personal vs. business use), roaming, functionality (data vs. voice), backup service, etc. —
subscribe to services from two or more network operators. 18 Conversely, the sharing of mobile
subscriptions — through pay phone-type resale or their joint use by multiple individuals (e.g., household
members, as is often the case in Africa and India, for example) — throws the numbers off in the opposite
direction.19 Consequently, the number of adopters may be lower or higher than the number of
subscriptions, depending on the market. 20
17 Different operators also have different standards for counting active subscribers, in part based on
their accounting and billing systems, and how much they lag subscriber activations and de-
activations. In prepaid environments, this is a key issue in that some operators allow prepaid
subscribers to use their initial account for periods exceeding a year, while others impose limits of 60
or 90 days; in some cases these limits are determined by industry associations or regulators, but
often they are discretionary.
18 Wireless World Forum, a market research and networking entity, has sought to take into account such
duplications and has developed adjusted national subscriber numbers. See www.w2forum.com.
However, WWF has not responded to a request for an explanation of the methodology underlying its
adjusted figures.
19 See the studies cited in note 16 for evidence of how extensive such sharing can be, allowing even
very low income individuals to receive messages and make calls over the mobile phones of friends
and family members.
20 Mobile phone users who have dropped out of the market can also be considered (former) adopters.
International Journal of Communication 2 (2008) The Adoption of Mobile Phones in Emerging Markets 637
The Continuing Income Effect
Graphic plots of mobile phone subscribers per 100 capita against GDP per capita are generally
interpreted as indicating a high degree of correlation between a country’s income level and its adoption of
mobile phones.21 At the same time, a growing number of low- and middle-income countries (e.g., below
$10,000 GDP per capita) are achieving mobile penetration levels in excess of 60% (e.g., Algeria,
Colombia, South Africa), 80% (e.g., Chile, Jamaica, Poland), and even 100% (e.g., Lithuania, Russia,
Ukraine).22 Moreover, these lower income “outliers” are growing in numbers compared to the relatively
dwindling “mainstream” group.
The emergence of high-penetration developing markets suggests that a growing number of
lower-income countries may be disregarding the traditional relationship between income and mobile phone
adoption. Yet a look at a cross-section of 25 developing markets (Figure 1) suggests otherwise.23
21 See, for example, Figure 1.4 (p. 29) in Castells, M., Fernández-Ardèvol, M., Qiu, J. L., & Sey, A.
(2007). Mobile Communication and Society: A Global Perspective. (Cambridge, MA: The MIT Press. p.
29.) For a regression analysis of the relationship, see H. Gruber and F. Verhoven, “The evolution of
markets under entry and standards regulation — the case of global mobile telecommunication,”
International Journal of Industrial Organization, 2001.
22 Lithuania, for example, is listed as having a GDP/PPP per capita of $13,700 in 2005 (see Info -
please.com, Economic Statistics by Country, 2005) and a mobile penetration rate of 127.1 (ITU, op.
cit.).
23 The data in Figure 1 is derived from Merrill Lynch, Global Wireless Matrix 4Q06, March 28, 2007. It
covers the following markets (in order of ascending GDP per capita): Bangladesh, India, Nigeria,
Pakistan, Egypt, Philippines, Iraq, Indonesia, Morocco, China, Ukraine, Colombia, Peru, Thailand,
Algeria, Turkey, South Africa, Brazil, Argentina, Venezuela, Malaysia, Russia, Mexico, Chile, and
Poland.

638 Kas Kalba International Journal of Communication 2(2008)
Figure 1: Mobile Adoption and Income: 25 Developing Markets
Mobile Adoption and Income: Emerging Markets, 2006
0
2000
4000
6000
8000
10000
0 20 40 60 80 100 120mobile penetration
GD
P pe
r cap
ita
The 25 emerging markets represented in Figure 1 show a strong correspondence between mobile
adoption and the GDP per capita, with a Pearson correlation coefficient of 0.715 (p<0.01). 24 This
suggests that the weakening of the income-penetration relationship, in a multiple-SIM environment, has
occurred primarily in developed markets. In emerging markets, the GDP per capita appears to be a proxy
for disposable income and to reflect the financial capacity of consumers to purchase mobile phones and
associated services and accessories.
One of the reasons why the GDP per capita may be more closely related to mobile penetration in
emerging markets than in developed ones is the share of income allocated to mobile expenditures. In
general, this share, which is on the order of 0.8% to 1.6% in developed markets, is in the 1.9% to 3.9%
range in emerging markets.25 (At the same time, these higher shares could be a reflection of income that
is not reflected in national GDP statistics, along with the greater relative value placed on communications
24 These levels are achieved despite some outliers, the most noticeable of which appears in the lower
right-hand corner of Figure 1. This is Ukraine and is due to the low-income level ascribed to this
country in the data base ($1968). Using the PPP approach, Ukraine is listed as having a GDP per
capita of $6,300 in 2004 by another source (CIA, World Factbook). The next most significant outlier
is in the upper center of the graph (Mexico), where the large out-migration of workers may be a
factor.
25 Merrill Lynch, op. cit.

International Journal of Communication 2 (2008) The Adoption of Mobile Phones in Emerging Markets 639
by low-income populations.26) Another factor is fluctuations in income availability, which reduce the
demand for ongoing services such as postpaid mobile but not for prepaid mobile phones and cards, which
can provide extended subscription periods at very nominal entry cost to the user. As a result, mobile
adoption, as reflected in subscriber levels, can be associated with low monthly average subscriber revenue
(or ARPU), which can fall below $5.00 in emerging markets.27
Weakening of the Legacy Phone Factor?
Mobile phone demand has traditionally been associated with pre-existing wireline phone service.
Markets such as those of Sweden, Norway, Hong Kong, Singapore, and the United States supported high
fixed penetration levels before exhibiting high mobile adoption levels. Yet the high mobile penetration
rates (above 70%) in countries like Jamaica and South Africa are often associated with low fixed line
penetration. At the same time, there are some countervailing cases. China, which has added about 500
million mobile subscribers since 2000, has a high base of fixed phones as well — more than 400 million.28
Even South Africa, with a low fixed penetration level (c. 11%), has traditionally had the highest level of
fixed penetration in Sub Saharan Africa.
So what is the underlying relationship between mobile and fixed penetration in emerging markets
— or is there no relationship? As Figure 2 shows for 25 emerging markets, the relationship appears to be
quite strong,29although there are outliers to be sure. Two markets (Mexico and the Philippines) have
managed to achieve mobile penetration levels on the order of 50% with fewer than 5 fixed lines per
capita. China, by contrast, stands out (upper left) as a market with more than 25% fixed penetration and
a correspondingly low level of mobile adoption (35%). Yet, overall, the relationship between fixed and
mobile is quite evident, and is much stronger than would be the case with a similar cross-section of
developed markets. (The 25 emerging markets represented in the figure achieve a Pearson coefficient of
0.696 at < 0.01 significance, whereas the relationship between mobile and fixed penetration across 28
developed markets, using the same data base, was not significant.)30
26 The lower income statistics can stem from widespread tax avoidance, remittances received that are
excluded from income reports, the presence of a significant “gray” economy, wealth, and barter based
on non-cash commodities, etc.
27 This is the case in markets such as Bangladesh, Pakistan, and the Philippines; compared to ARPUs in
excess of $50 in Japan, Switzerland, and the U.S.
28 ITU, ICT Statistics; available at http://www.itu.int/ITU-D/ict/statistics/
29 Based on Merrill Lynch data for 2006, op. cit.
30 For an analysis of the difference between the fixed-mobile penetration relationship in developed and
emerging markets and accompanying graph, see Kas Kalba, “The Global Adoption of Mobile Phones:

640 Kas Kalba International Journal of Communication 2(2008)
Figure 2: Mobile vs. Fixed Penetration: 28 Developed Markets
Mobile vs. Fixed Penetration in Emerging Markets
0
5
10
15
20
25
30
35
0 20 40 60 80 100 120mobile penetration
fixed
pen
etra
tion
But does the relationship hold in countries with many more mobile lines than fixed lines? For
example, what happens when one looks at emerging African markets--markets with very low GDP per
capita levels and, generally, very few fixed lines?
The rapid pace at which mobile phones are being adopted in Africa is very evident. From a base
of 10,000 fixed phones in 2000, the Democratic Republic of Congo gained nearly three million mobile
subscribers by 2005; Nigeria started with about a million fixed phones but picked up 19 million mobile
ones; Angola, Ghana, Kenya, Mali, Mauritania, Morocco, Tanzania, and Uganda have followed the same
path. Only countries with relatively well-established fixed and mobile networks prior to 2000 (e.g., Egypt,
South Africa) have not experienced 100%+ mobile CAGRs in the post-2000 period, as well as a few with
markets that have not been liberalized, such as Guinea and Zimbabwe.31
Sizing of Factors, Regions and Phases,” ICA Pre-Conference on “The Global and Globalizing
Dimensions of Mobile Communication,” Montreal, Le Centre Sheraton, May 21-22, 2008.
31 ITU, op. cit.

International Journal of Communication 2 (2008) The Adoption of Mobile Phones in Emerging Markets 641
Figure 3 displays the mobile-fixed ratios of 49 African markets.32 While the fixed to mobile ratios
presented on the graph are low, it turns out that the correlation between fixed connectivity and its mobile
cousin remains quite high. A country with virtually no fixed lines is also likely to have very few mobile
ones. Correspondingly, one with a fixed penetration level of 10% or more is likely to have 20% or more
mobile lines per capita. (The Pearson coefficient for the 50 African countries in Figure 3 is just as high as
the coefficient for the geographically more distributed markets in Figure 2 — 0.696 at p<0.01.)
Figure 3: Mobile vs. Fixed Penetration: African Markets
Mobile vs. Fixed Penetration, African Markets
0
5
10
15
20
25
30
35
0 20 40 60 80mobile per 100 capita
fixed
per
100
cap
ita
Quite likely, mobile is substituting for fixed in many parts of Africa, and it is generating new
demand that fixed could not fulfill as well. At the same time, there remains a strong connection between
fixed and mobile penetration. How can this be explained? First, there is an awareness factor. In markets
with relatively more fixed connections, the awareness of the potential value of telephone-based
communications, including mobile, is greater than in markets with fewer fixed lines per capita.33 Second,
where there are more fixed lines (e.g., at work places), there are more opportunities to call mobile
phones, which is especially important in Africa’s and India’s CPP billing environment. And third, greater
fixed connectivity generally implies the presence of a greater backbone network, which, in turn, facilitates
32 Also based on the ITU data for 2005.
33 The understood value includes mobile’s role as a status symbol and fashion article as well as a
functional device. See Rohan Samarayiva and Ayesha Zainudeen, eds., op. cit., for evidence of the
status and fashion value of mobile phones to very low-income users (below $100/month) in Sri
Lanka.
642 Kas Kalba International Journal of Communication 2(2008)
the deployment of mobile networks, at least where regulators have required incumbent operators to
provide backbone access at reasonable rates to mobile entrants. In sum, even in low-income emerging
countries with relatively few legacy phones, mobile networks are initially installed in urban areas where a
tradition of calling over public pay phones, work-site phones, and (for the affluent) residential phones is in
place, helping stimulate interest in — and adoption of — mobile phones.
Prepaid Phones and Variable Demand
Prepaid phones and SIM cards are a key reason mobile subscriber levels are growing so rapidly in
emerging regions. In the traditional postpaid market, the registration of demand called for a commitment
to subscribe to a mobile service for one or two years — in other words, it involved a mobile phone
purchase (subsidized or not, depending on the market), 12 or 24 monthly service obligations, usage
charges, and a service connection fee (sometimes waived), not to mention a credit check. The
introduction of prepaid responded to — and further stimulated — the market for occasional or variable
demand. It allowed adoption of mobile phones by users with variable usage needs and variable means to
pay for access to the mobile network.34
Prepaid products were introduced in most emerging markets after first being widely adopted in
Europe. Yet prepaid technology’s original introduction occurred in a northern province of Mexico in 1992.
The product faltered but was fine-tuned and re-introduced during the “peso crisis” a year later, when it
matched the needs of a credit-challenged market. From a broad diffusion perspective, this introduction of
prepaid technology, considered a peripheral achievement at the time, has been the most significant
product innovation since the development of the initial cellular radio concept. Without prepaid, which
consists largely of storage and billing software, mobile calling may not have reached as many as half of
today’s subscribers, especially those located in poor and moderate-income emerging markets, where
participation in the cash economy is often an itinerant activity.
Instead of diffusing a few miles north to the U.S. — or south to Central America, Colombia, or
Brazil — prepaid technology appeared next in Portugal, then in Italy, and eventually across the globe,
where it now accounts for the vast majority of mobile subscriptions. The impact of prepaid on emerging
markets is reflected in Figure 4 below. For a cross-section of developed and emerging markets,35 it shows
that the share of prepaid subscriptions ranges from 43.2% in high-end markets (above $30,000 GDP/cap)
to 92.2% for the lowest-income segment (below $3,000/cap). In sum, what started out as a solution to a
credit authorization problem — thought initially to affect 10-20% of the subscriber base — has come to
serve more than 1.5 billion accounts. Prepaid made mobile phones financially accessible to anyone with
disposable income (if only on an occasional basis) and not solely to anyone with salaried income, which
has been effectively a prerequisite for postpaid subscriptions.
34 To the extent that prepaid cards remain active even when not used—or after their expiration in terms
of outgoing call minutes — they allow quasi-continuous service access with respect to incoming calls.
35 See Merrill Lynch, op. cit.; 2006 data for 53 developed and emerging markets.

International Journal of Communication 2 (2008) The Adoption of Mobile Phones in Emerging Markets 643
By 2006, prepaid had become the dominant mode of mobile access worldwide. As Figure 4
illustrates, the prepaid mode is especially dominant in lower-income markets, though now heavily utilized
in markets at all income levels. The main outliers are Korea and Taiwan (bottom left) and Japan, Finland,
and the United States (bottom center), all developed markets with less prepaid use than the main trend
line. Despite these outliers, the Pearson coefficient for the 52 markets represented in Figure 4 is -0.664
(p<0.01), reflecting the negative relationship between income level and prepaid penetration.
Figure 4: Prepaid and Income, Developed and Emerging Markets
There are several other developments that have supported and extended the effects of the
prepaid revolution. These have included CPP (effectively allowing “free” incoming calls), transferable SIMs
(allowing one phone to be used with multiple prepaid subscriptions),36 and asymmetrical interconnection
fees. Asymmetric interconnection regimes have allowed mobile operators to collect significant termination
charges for incoming calls from fixed networks — higher on a per minute basis than the fees they pay
such operators to terminate their subscribers’ outgoing calls.
36 In the international business segment of the market, it is not unusual to find users with five SIMs for
five different countries or groups of countries. Similarly, within a country, mobile users can benefit
from access to the pricing schedules and coverage areas of multiple mobile operators through
ownership of two or more SIMs.
Prepaid and Income, Developed and Emerging Markets, 2006
0
20
40
60
80
100
120
0 20000 40000 60000 80000
GDP per capita% prepaid
644 Kas Kalba International Journal of Communication 2(2008)
In some emerging markets, such as those of Costa Rica and Malaysia, the interconnection
charges have been kept equivalent — or “symmetrical.” However, in a growing number of countries, the
asymmetrical approach has been adopted, with fixed-to-mobile charges being substantially — on average
about two times (and in some cases as much as four times) — higher than mobile-to-fixed rates.37
Botswana, Brazil, Mexico, and the Philippines provide examples of such asymmetrical regimes.38 This has
resulted in mobile operators receiving on average about $0.09 — and in some cases, $0.20 or more — per
minute when terminating calls from fixed operators, which have often represented a majority of their
incoming calls.39 This, in turn , has allowed operators to make a profit from prepaid customers paying as
little as $10 for a prepaid card, say, every six months, making few outgoing calls but receiving 100 to 300
minutes per month of incoming calls.
Such asymmetric regimes have been developed in part to promote the development of mobile
networks. They are justified on the basis of the costs of mobile networks being substantially greater than
those of fixed networks, in large part because the latter have been depreciated, given their legacy
status.40 As a result, many operators, especially in emerging markets, have benefited from the
combination of asymmetrical rates, CPP, and prepaid offerings, allowing them to generate revenues as
much, if not more, through interconnection settlements as through prepaid payments directly.41 This, in
37 There are also cases where the mobile-to-fixed rates are higher than fixed-to-mobile, but this usually
occurs in RPP environments.
38 See Tim Kelly, op. cit.
39 This is based on 1999 data. See Tim Kelly, op. cit. The high level of fixed to mobile calling
underscores the earlier point (Section 3) on the continuing influence of fixed line connectivity on
mobile usage and probably adoption as well.
40 In addition, mobile networks may be smaller and riskier, involving fewer economies of scale and
higher costs of capital. Depending on when they are built and the choice of technology, they may
also involve a technology premium (e.g., for innovative advanced technology). At the same time,
fixed operators have argued that these differences do not justify as great differences in
interconnection rates as have been imposed by some regulators — or that the differences should be
reduced as mobile networks are built out and become more mature. Mobile operators in many
emerging countries may now be entering a relatively less favorable interconnection phase, as
regulators such as Anatel in Brazil seek to rebalance interconnection rates in favor of landline
operators. The fact that, with time, more calls originate on mobile networks than fixed ones is
concurrently increasing their interconnection expenses.
41 Now, however, as their interconnection costs have risen, subscriber growth rates have slowed, and
pressures to rebalance rates have grown, operators in Brazil and other moderate-income markets are
re-focusing their marketing efforts on increasing subscriber ARPU, primarily in the postpaid market
segment. The emphasis on subscriber growth, so prevalent during the late nineties and early part of
this decade, has largely vanished, though it continues obviously in India, where CPP was first
International Journal of Communication 2 (2008) The Adoption of Mobile Phones in Emerging Markets 645
turn, has served as a major stimulus to mobile phone adoption, in that the operators were willing to
charge nominal amounts to secure prepaid subscribers, as they could make money simply from the
incoming calls these new, often low-income subscribers would generate.42
In lower-income emerging markets, prepaid offerings are being combined with various forms of
communal, shared, even bartered access to mobile minutes, with or without the ownership of a mobile
phone. Operators and resellers are responding not only to the “variable” segment of the market, but to
fractional demand as well. A dramatic example of the fractional approach is the communal service being
offered by Orascom in remote, low-income areas in Algeria. The company is installing mobile phones in
villages at the edge of the Sahara that are frequented by nomadic people, who use them on a per-minute
basis.43 Such phones may be used by several hundred users over the period of a year, if not a month.
Similarly, new prepaid phones can involve a commitment of under $50, with prepaid cards
costing under $5 and being replenished for as little as a few cents.44 In short, both supply and demand
are being fractionalized. Even barter payments — yes, fruits and vegetables — in exchange for prepaid
cards or for minutes on a communal mobile are becoming commonplace in many markets. 45
introduced more recently. Previously, the interconnection regime in India was asymmetrical in favor
of the fixed operators, with only the mobile operators paying to terminate calls.
42 In Brazil, for example, the average MOU (monthly minutes of use) is only 82 — compared to an
average in emerging markets about three times higher. But in a CPP environment ,this does not
include the typically larger number of incoming minutes, for which mobile operators in Brazil collect
termination fees.
43 See Cassell Bryan-Low, “New Frontiers for Cellphone Service,” Wall Street Journal, Feb. 13, 2007, p.
B5.
44 Ibid.
45 A lot of phone sharing goes on as well. Many mobile phones are being effectively used as fixed
phones in households in India, Africa and elsewhere. In the process, their usage is shared by
anywhere from two to a dozen users, given the large households and extended families that form the
social infrastructure of many communities. In emerging markets where personal mobile use of the
phones is the dominant pattern, they are still often shared with family and friends outside of the
home. Some of the friends involved in the sharing may own their own mobiles but have left them at
home or run out of battery power. Others are merely itinerant users with no mobile phones of their
own. The emergence of fractional demand also has an effect on mobile statistics. If spouses, co-
workers, or teenage friends share a mobile phone, are they not all “adopters”? This sharing practice
is especially prevalent in emerging markets where mobile phones have become the dominant mode of
communication, surpassing the landline count by as much as eight or nine to one. In many cases the
mobile phone sits in a designated spot at home and is used as a fixed line by multiple household
members, except on special occasions when it is taken outside the home. For useful descriptions of

646 Kas Kalba International Journal of Communication 2(2008)
The fundamental demand question going forward is how many of the world’s non-subscribers will
be served by these various communal and shared forms of access, including mobile pay phones, and how
long it will take to convert such shared-users into owner-users. Will shared use build awareness and
interest in owning mobile phones and subscribing to the associated services, most likely on a prepaid
basis, or will it serve as a substitute for full-scale mobile phone adoption?
Limited Effects of Unlimited Competition
A number of studies have shown that competition is a key factor in stimulating mobile phone
diffusion through lower prices and other marketing effects. While a few monopolies have been able to
achieve penetration rates similar to those in competitive markets, in general mobile phone adoption has
lagged in monopoly markets. In some cases, monopoly operators have lowered prices and increased their
marketing efforts once competitors were licensed or were about to be, thereby reducing the market that
would be easily available to them. Yet even in these situations, the market has generally continued to
grow at a brisk pace, with competitors securing significant market share.
A recent example is that of Trinidad & Tobago. The second operator did not enter the market
until early 2006, at which point the penetration level was already approaching 70%.46 The level grew to
86.4% by March 2007.47 Anecdotal evidence suggests that the second operator, Digicel, has secured
most of the incremental subscribers, while the initial operator, C&W-affiliate TSTT, has largely managed to
hold onto its subscriber base.48 In Trinidad, the incumbent has benefited from the lack of SMS
interoperability between the two networks and from its broader initial coverage, which has resulted in
many users subscribing to both services. The incumbent, TSTT, has also been accused by Digicel of
blocking calls from Digicel subscribers to those of TSTT’s mobile affiliate, and has lost its case in court.49
how mobile phones are shared in Bangladesh, Chile, Ghana, Uganda and South Africa, see Manuel
Castells et al., op. cit., pp. 231-39.
46 Ian Alleyne, “Mobile war in Trinidad – an analysis,” Caribbean360.com, July 7, 2006. The head of the
original mobile operator, TSTT, is cited as stating that his company had 900,000 subscribers in
February 2006, which is 69% of the estimated population of 1,305,000 in July 2005 (Wikipedia, Jan.
20, 2007).
47 See “Signs of Liberalisation Appear Across Trinidad & Tobago,” Americas Telecommunications Insight,
Business Monitor International, September 2007, Issue 17.
48 By contrast, when Digicel entered the Jamaican market in 2001, it managed to secure a 60%
subscriber share within a year. In both cases it is competing with Cable & Wireless affiliates.
49 See “Signs of Liberalisation Appear Across Trinidad & Tobago,” op. cit.

International Journal of Communication 2 (2008) The Adoption of Mobile Phones in Emerging Markets 647
Meanwhile, the two operators continue to argue over an appropriate interconnection framework while
using “bill and keep” as an interim approach.50
As this case illustrates, incumbents benefit from “head start” and other advantages. Yet the
effects of competition in terms of speeding up adoption are usually quite evident. Prices tend to drop.
Marketing activity and promotion picks up. Opportunities to observe and try mobile phone usage
increase. In some cases, coverage is expanded and new products or services are introduced, whether by
the new entrants to gain share or the incumbent to maintain it — often both. The result is higher
penetration than would otherwise be the case, including a rise in the number of subscribers with two or
more subscriptions.
This does not mean, however, that unlimited competition brings unlimited penetration growth.
For example, a review of Latin American penetration levels at the end of 2002 found that the number of
operators does make a difference, though less than might be expected. The penetration level across the
sample of 16 countries grew from an average of 8.8% in single-operator markets to 13.1% in dual-
operator markets to 21.6% in markets with three or more operators. However, a comparative adjustment
of the results in terms of GDP per capita differences and age of data (2002 in most cases, 2001 in others)
effectively increased the difference between single- and dual-operator markets and decreased that
between dual- and three- (or more) operator markets. In other words, the value-added contribution of
competition — in making mobile service widely available — dropped off fairly quickly as the number of
operators grew.51
In analyzing 20 Caribbean markets in the same way, a similar but even less pronounced effect
was found. The single-operator markets had an average penetration of 21.4%, which grew to 29.8% and
36.2% for dual- and three- (or more) operator markets, respectively. Given the increase in average GDP
per capita between dual-operator markets and those with three or more operators, the effects of adding a
third or fourth operator on the overall market were less significant than the difference between 29.8% and
36.2% would suggest.52
50 See Telecommunications Authority of Trinidad & Tobago, Decision 2/2006, Aug. 16, 2006.
51 See Kas Kalba, Telecommunications Development in the Caribbean Region after the Global
Telecommunications Crash, paper presented at the19th Annual Conference of the Caribbean
Association of National Telecommunication Organizations, June 17, 2003, Paradise Island, The
Bahamas, Slides 11A and 11B.
52 Ibid.
648 Kas Kalba International Journal of Communication 2(2008)
A review of more recent data covering 24 emerging markets in Africa, Asia, Eastern Europe, and
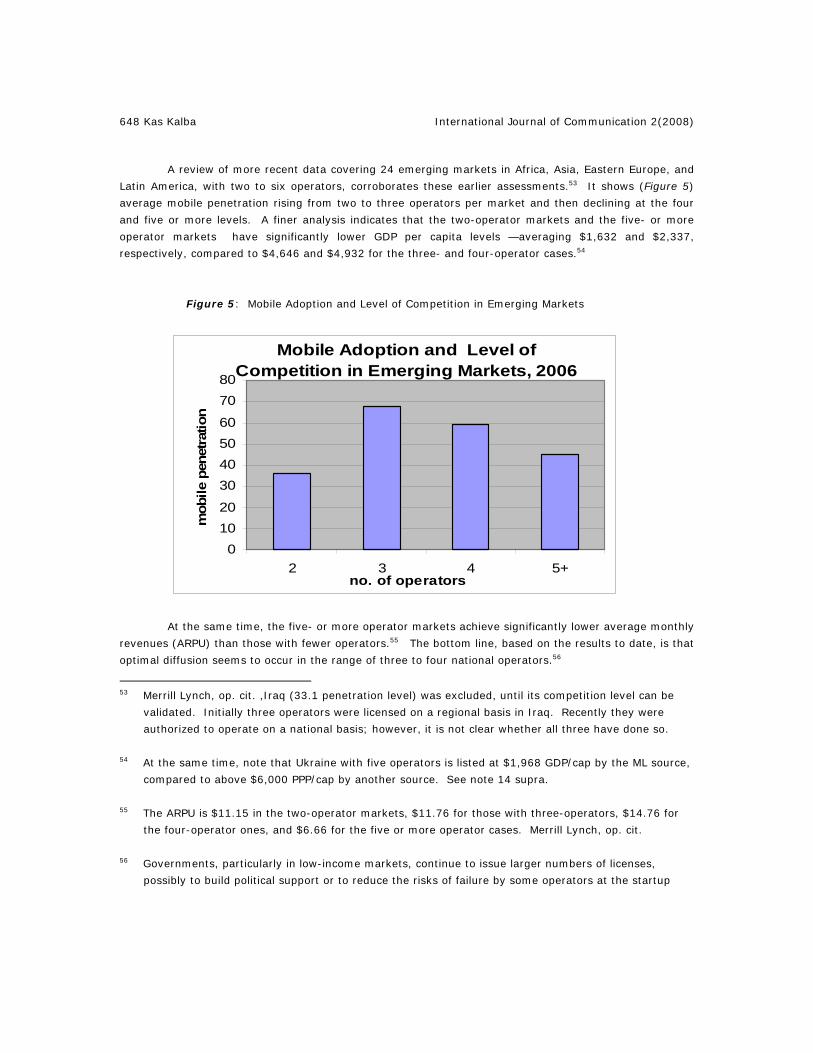
Latin America, with two to six operators, corroborates these earlier assessments.53 It shows (Figure 5)
average mobile penetration rising from two to three operators per market and then declining at the four
and five or more levels. A finer analysis indicates that the two-operator markets and the five- or more
operator markets have significantly lower GDP per capita levels —averaging $1,632 and $2,337,
respectively, compared to $4,646 and $4,932 for the three- and four-operator cases.54
Figure 5: Mobile Adoption and Level of Competition in Emerging Markets
Mobile Adoption and Level of Competition in Emerging Markets, 2006
01020
30405060
7080
2 3 4 5+no. of operators
mob
ile p
enet
ratio
n
At the same time, the five- or more operator markets achieve significantly lower average monthly
revenues (ARPU) than those with fewer operators.55 The bottom line, based on the results to date, is that
optimal diffusion seems to occur in the range of three to four national operators.56
53 Merrill Lynch, op. cit. ,Iraq (33.1 penetration level) was excluded, until its competition level can be
validated. Initially three operators were licensed on a regional basis in Iraq. Recently they were
authorized to operate on a national basis; however, it is not clear whether all three have done so.
54 At the same time, note that Ukraine with five operators is listed at $1,968 GDP/cap by the ML source,
compared to above $6,000 PPP/cap by another source. See note 14 supra.
55 The ARPU is $11.15 in the two-operator markets, $11.76 for those with three-operators, $14.76 for
the four-operator ones, and $6.66 for the five or more operator cases. Merrill Lynch, op. cit.
56 Governments, particularly in low-income markets, continue to issue larger numbers of licenses,
possibly to build political support or to reduce the risks of failure by some operators at the startup
International Journal of Communication 2 (2008) The Adoption of Mobile Phones in Emerging Markets 649
A general pattern in emerging markets, as in developed ones, is that the first two operators
capture a very large share of the market — 65% or more (often above 80%). 57 Where the residual
segment is split among two, three, or more operators, this does not always provide a sustainable base for
increased competition on a full-fledged basis — competition at the level of coverage, quality of service,
price, customer responsiveness, applications, and so on. The smaller operators may try to compete on
price of service and/or handset subsidies, but this can exact a cost (e.g., higher financing charges or
reduced service quality and coverage) and can result in turnover, not only of subscribers but in the
ownership of the operator as well. Emerging markets such as Chile, Malaysia, and the Philippines have
experienced operator consolidation, with others exhibiting signs of forthcoming consolidation.58
Although the effect of more operators is often greater competition at the retail level, it can also
result in reduced profitability due to duplication of capital investment, lower spectrum efficiency (by
dividing available spectrum into excessively small bands), and limited investment in coverage and other
aspects of service quality.59 While there are short-term “welfare” benefits from the hyper competition
that can occur when five, six, or more operators compete, long-term welfare and adoption may suffer. 60
stage. At the same time, by issuing “too many” licenses, governments may be reducing the likelihood
of financial support for the operators and thereby increasing the chances of startup failures.
57 Major exceptions among emerging markets are Brazil and India, where the top two operators control
about 50% of the subscribers. The U.S., UK and Hong Kong are similar exceptions among developed
markets.
58 A case in point is Brazil, where Telefonica will hold interests in two of the mobile operators, which it
may try to consolidate, assuming its proposed acquisition (along with Italian financial entities) of a
controlling management position in Telecom Italia is finalized; Telecom Italia controls TIM Brasil.
Similarly major operator consolidations have occurred in developed markets such as Canada, Hong
Kong, Italy and the United States.
59 See, for example, Raul L. Katz and Bharat Sarna, “The Importance of Scale and Scope in Driving
Telecommunications Industry Structure,” Working Paper, Research Program on Remedies for the
Telecom Industry, Columbia Institute for Tele-Information, Columbia Business School, January 24,
2003. This recent comparative analysis of 24 international markets (excluding the U.S.) shows that
one measure of financial viability, EBITDA margins (Earnings before Interest, Taxes, Depreciation and
Amortization), generally varies with the number of mobile operators. As depicted in Exhibit 2,
aggregate industry margins vary from a high of 40-60% in markets with two or three operators such
as, New Zealand, the Philippines and China to a low of about 10-15% in Hong Kong (six operators)
and the Netherlands (five operators). The analysis is based on Fourth Quarter data for 2001. The
authors conclude that, “Industries with more than four players witness their EBITDA margins drop
significantly, not only due to irrational price competition but also to the inability of players to leverage
economies of scale.” At the same time, they note that competitive circumstances can vary widely
among markets with an equal number of operators. For example, aggregate EBITDA in Italy (four
650 Kas Kalba International Journal of Communication 2(2008)
Explaining Eastern Europe and China
The high levels of mobile diffusion first apparent in the western parts of Europe swept across the
much less affluent populations of Eastern Europe during the last 10 years. First Hungary, then the Czech
Republic and Slovakia, next the Baltics and Poland, then Slovenia and Croatia, eventually Russia, and
most recently Ukraine have all passed the 80%, and in most cases, the 100% penetration level. Yet no
similar wave has been evident in Latin America, a more youthful market in demographic terms.
Put more specifically, why has mobile phone diffusion occurred so rapidly across Eastern Europe,
a region with an ageing population where each country has its own culture, its own language, its own
currency, its own way of loading washing machines?61 Is it the small size of most of the markets
(excluding Russia) that is at play here?62 Is it the region’s harsh climate;63or, possibly, the breakup of the
Soviet-dominated Comecon bloc, turning the mobile phone into a symbol of consumer expression and
new-found liberty?64 Is it the relatively flat geography and relatively thin vegetation?65 Or does latitudinal
operators) is much higher than in the United Kingdom (also four operators), due in part, contend Katz
and Sarna, to the absence of handset subsidies in the former market as well as the relatively equal
size of the competitors in the latter.
60 For an analysis that supports this latter view, see Thomas W. Hazlett and Roberto E. Muñoz, “A
Welfare Analysis of Spectrum Allocation Policies,” George Mason University Law and Economics
Research Paper Series, 06-28.
61 The “washing machine” metaphor is a reference to the attempt some years ago to use the same TV
commercial for laundry soap across multiple Eastern European markets. It turned out most viewers
were amused given the alien way in which laundry and laundry soap was loaded into the washers
compared to prevailing local practice.
62 If so, there may be diseconomies of scale involved — or economies of deployment and regulatory
focus.
63 See “The Role of Climate” section in the companion paper, op. cit.
64 Still another possible explanation of the penetration differences between Eastern Europe and Latin
America is demographic. On the face of it, Latin America’s far younger population (except in
Argentina and, secondarily, Chile) would suggest a higher propensity to adopt mobile phones and
other consumer innovations. On the other hand, the larger households of the region could reduce the
availability of disposable income — and thereby the ability to afford mobile phones and the associated
services. However, the prepaid environment prevalent in both regions should mitigate the influence
of disposable income. For a fuller discussion of the influence of disposable income and of
demographic factors, see the companion paper, op. cit.

International Journal of Communication 2 (2008) The Adoption of Mobile Phones in Emerging Markets 651
diffusion, given the region’s proximity to GSM-prolific Western Europe, proceed more rapidly than
longitudinal, north-south diffusion, as Jared Diamond has suggested?66
Compared to Eastern Europe, demographically-youthful Latin America has been a mobile diffusion
laggard. On the other hand, Latin America has, arguably, fared reasonably well when compared to China.
At the end of 2005, the average penetration level across Brazil, the Andean countries, Central America,
and Mexico was 35.33% compared to China’s 29.90%.67 On the other hand, Eastern Europe leads Latin
America in mobile penetration on the order of two to one. Of the 18 Eastern European markets covered
in the ITU database, 13 have more than 80% penetration rates (including five over 100%) in 2006,
compared to only one of the 19 Latin American markets.68
So what accounts for Eastern Europe’s lead? Some of it is a higher GDP per capita. But
significant differences persist even when Eastern Europe’s high economic flyers — the Czech Republic,
Estonia, Hungary, Slovenia — are taken out of the equation.69 In the end, it may come down to a cluster
65 The region does not have an Andean mountain range (short of the Urals) or a thick Amazon jungle.
66 Diamond posits in Guns, Germs and Steel that agricultural innovations have spread over the ages in
latitudinal directions more rapidly than along longitudinal lines, due to the similarities in climate and
other factors. He noted this effect in the trade and other exchanges that diffused along the Eurasian
Silk Route — and its absence from the North and South American trajectory, constrained by the
isthmus of Panama, dramatic climate changes, and assorted natural barriers, despite the presence of
great civilizations along the way. Is there a similar effect at play here — a mobile ethos that
stretches across a greater Europe from the Atlantic to the Urals and well beyond to Siberia and Pacific
Russia? And who do the consumers of the emerging Eastern European economies think they are
imitating when they acquire mobile phones — western Europeans, Americans, Koreans and
Japanese?
67 This is an unweighted average for Brazil (46.25), Bolivia (26.37), Colombia (47.92), Ecuador (47.22),
Peru (19.96), Venezuela (46.71), Costa Rica (25.45), El Salvador (35.05), Guatemala (25.02),
Honduras (17.79), Panama (41.88), and Mexico (44.34), based on ITU data, op. cit.; on a population-
weighted basis the Americas average would be higher, as the larger countries (Brazil, Mexico,
Venezuela, etc.) have higher penetration levels than the smaller ones.
68 ITU, op. cit.
69 For a comparison that focuses on Russia and Ukraine vs. Brazil and Mexico (where the East European
countries have lower per capita income but significantly higher mobile penetrations), see Kas Kalba,
“The Global Adoption of Mobile Phones: Sizing of Factors, Regions and Phases,” ICA Pre-Conference
on “The Global and Globalizing Dimensions of Mobile Communication,” Montreal, Le Centre Sheraton,
May 21-22, 2008.

652 Kas Kalba International Journal of Communication 2(2008)
of socioeconomic factors. The older demographics are actually a positive (in Latin America relatively
ageing Argentina and Chile have the highest penetrations), especially when coupled with Eastern Europe’s
smaller households (e.g., Poland’s 2.9% persons vs. Mexico’s 4.4%), higher education levels, and greater
average disposable cash.
The household size factors also help explain why China’s population adopted mobile phones more
rapidly and broadly than did India’s. With an average household size of 3.4 persons — compared to
India’s 5.3 — China’s average household has more readily acquired the disposable income needed to
acquire mobile phone service (involving phone purchase plus connection, monthly and usage service
charges). China’s nominal household GDP of about $5,800 (on average) needs to “feed” (and house,
clothe, transport, etc.) only 3.4 persons. India’s average nominal household GDP of about $3,700 needs
to cover the expenses of 5.3 individuals. Chances are, there is more cash left over in the case of the
average Chinese household than the Indian one, China’s higher savings rate notwithstanding. 70
Figure 6 shows the relationship between mobile penetration and household size for six low-
income markets — China and India as well as Bangladesh, Egypt, Indonesia, and Pakistan. Pakistan,
which despite its large households (6.8 persons) has a relatively high mobile adoption rate, is a clear
outlier.71 Otherwise, household size reflects the mobile penetration rates of the remaining five countries in
Figure 6 more closely than do their income levels (i.e., GDP/cap). China is at the far right, India at the far
left. (The relationship is not significant in statistical terms, due presumably to the small number of
countries. When the number of markets is increased to 17 — all the emerging countries in the Merrill
Lynch database with a GDP per capita under $10,000 for which average household size could be obtained
— it becomes significant at the 0.05 level, with a Pearson coefficient of -0.533.)
70 The argument here is not that small household size “causes” mobile phone adoption but that it
represents a confluence of “modernization” factors that result in greater mobile penetration among
low-income populations. At higher income levels, large households may in fact foster the adoption of
mobile phones, as adoption by one household member stimulates adoption by others in the same
household.
71 The household data is from the World Bank, with the original data varying; household size data for
the markets represented in Figure 6 is from the last five years. The mobile penetration data is for
2005 from ITU, op. cit. One reason Pakistan may be the exception is its low ARPU (ML, 2006) of
$4.50, which facilitates the ownership and use of multiple phones in a household.

International Journal of Communication 2 (2008) The Adoption of Mobile Phones in Emerging Markets 653
Figure 6: Mobile Adoption and HH Size in Selected Emerging Markets
Mobile Adoption and HH Size in Selected Emerging Markets
2
3
4
5
6
7
8
0 10 20 30 40 50 60
mobile penetration
HH s
ize
A similar pattern underlies the penetration differences between Eastern Europe and Latin
America. In the latter case, household size generally ranges from 3.4 (Chile) to 4.8 (Colombia). This
compares with a range of 2.4 (Estonia) to 3.2 (Poland) in Eastern Europe. The largest countries include
Russia (2.8), Brazil (3.8) and Mexico (4.4). Overall, the ageing but smaller households of emerging
Europe have adopted mobile phones more rapidly than the younger ones in Latin America.
Patterns can change. By the end of 2005, China’s mobile penetration was 29.9 versus India’s
8.16. Since mid 2005, India has been experiencing a surge in new mobile subscribers, and has been
adding them over the past year at a rate of six million per month, which until very recently was higher
than the rate in China.72 This is a testament to the prevailing prepaid formula in India, which requires
little financial commitment. (Until this year, China has not relied on prepaid, in part because more of its
population works on a fixed salary basis and in part because China has not adopted CPP technology.) At
the same time, India’s surge reflects the competitive pressures its mobile industry is experiencing, with
ARPU reaching below $6.00 per month.73
72 As of mid 2007, China is adding about eight million new subscribers per month, which may reflect the
recent launch of prepaid subscriptions.
73 Consumer satisfaction with mobile service in India is also dropping below the levels mandated by the
regulator. According to a news report, only two of India’s 10 leading mobile operators have managed

654 Kas Kalba International Journal of Communication 2(2008)
Another factor that may help explain some of the regional differences is income distribution.
Unlike Eastern Europe, Latin America does not generally have an egalitarian income structure. Arguably
this does not impede mobile adoption in the early stages of the market and may, in fact, hasten it.
However, once more than half of the population has adopted mobile phones, the unequal distribution of
income may slow down further diffusion. By contrast, Eastern Europe’s smaller and more equally-paid
households can more readily subscribe to mobile service, even though they may be populated by older
consumers, who are usually considered laggards when it comes to new technology. Similarly, China has
lower income inequality than India, although China’s growing upper- and middle-income households have
reduced this difference in recent years. Income equality effectively creates a large, horizontal “mass
market,” with only a limited low-income segment that cannot afford prepaid phones.
The Next Three Billion Adopters
The issue of extending mobile phone service to the rest of the emerging world is largely one of
rural coverage. In Russia, more than 30,000 small towns and villages have no phone lines currently. In
Brazil, some 2,500 towns lack mobile coverage.74 The supply-side challenge in India and much of Africa is
even greater. Wide-area technology like WiMAX may be the solution, but so may prepaid technology,
which is more responsive to the seasonal and variable cash flows and barter arrangements of rural
communities than would be WiMAX or other forms of wireless broadband on the basis of postpaid
contracts.
When the Maitland Commission reported, in late 1984, that over two billion people lived more
than two hours walking distance from the nearest phone, this raised an eyebrow or two.75 Now it is
generally assumed that this phone gap has been eliminated. Yet simple math indicates that things have
not changed as much as the industry and policy makers would care to think. There are now 6.7 billion
people on earth, compared to 4.8 billion in 1984. Subtract 3 billion (assuming this number of unique
mobile phone users) from 6.7 billion and one is still left with 3.7 billion.
Some of these 3.7 billion individuals may be mobile phone adopters in that they use mobile
payphone services and/or borrow or share the mobiles of family members, friends and co-workers.
to exceed the 90% consumer satisfaction benchmark level set by the telecommunications regulator,
based on a nationwide survey by Voice & Data, the Indian telecoms magazine. See “Strain Tells in
India,” Financial Times, Jan. 15, 2007, p. 15.
74 “Anatel says mobile market needs USD$1.5 billion,” TeleGeography’s CommsUpdate, 2007.
75 The Missing Link: Report of the Commission for World-Wide Telecommunications Development, ITU,
December 1984.

International Journal of Communication 2 (2008) The Adoption of Mobile Phones in Emerging Markets 655
Unfortunately, there is no quantitative information on how large this group may be.76 There is also a
growing population of “transit” phone users — individuals who pay for phone cards, but do not own mobile
phones, using their cards in combination with the handsets of people they know; these SIM-only
subscribers are presumably included in the statistics.77
Undoubtedly, in countries with large households, such as India and Pakistan, the multiplier effect
of mobile phone ownership through shared mobile phone use is high. Not only mobile phones but
individual calls are shared among family members and friends to the point that not including someone
nearby when a call is being taken can be considered antisocial.78 The multiplier also extends to by-the-
minute mobile rental services in Africa, Bangladesh, and elsewhere, although how many of the users of
these services are non-subscribers versus subscribers who have not been able to “top-off” their prepaids,
left their phones at home, or were unable to charge the phones, is also difficult to estimate.79
All the additional “user-but-not-owner” segments, however, are likely to add up to less than a
billion individuals, leaving a residual non-adopter population on the order of 3 billion. This population in
turn can be segmented into those who are aware of mobile phones but have never tried one, those that
have tried a mobile phone and would subscribe if only there were adequate coverage, those who have
tried a mobile phone (and may use one periodically on a shared basis) but cannot afford to become
subscribers, and those who have tried mobile phones and have little or no interest in becoming a
subscriber.80 It would be useful to know what portions of non-subscribers fall into these various
76 For some qualitative data on similarities and differences between mobile phone owners and mobile
phone users (and between these subgroups and non-owners/non-users) based on surveys in rural
towns in South Africa and Tanzania, see Jonathan Samuel et al., op. cit. A companion paper in the
same report by James Goodman, on “Linking mobile phone ownership and use to social capital in rural
South Africa and Tanzania,” shows that a significant number of mobile phone owners let family
members and friends use their handsets for free (close to 50%). However, the survey was not
representative of all rural users, nor of the respective national markets, preventing quantitative
extrapolation to the broader populations of these two countries. See also the survey data from India
and Sri Lanka reported in Rohan Samarayiva and Ayesha Zainudeen, eds., op. cit.
77 Jonathan Samuel, op. cit., p. 59.
78 K. Konkka, op. cit., pp. 104-105.
79 Public charging kiosks are now starting to appear in China and in other countries, where electricity
can not be taken for granted, but very little information is available as yet whether these are catching
on.
80 Among those aware of mobile phones who have not tried one to date, are those with no direct phone
experience (a small number) and those with fixed phone and/or payphone experience.

656 Kas Kalba International Journal of Communication 2(2008)
segments, based on survey research,; and to what extent they might be willing to pay (by means of cash
or barter) for access to mobile phone service in the future.81
Overall, it is not impossible, nor even improbable, to conjecture that a billion people today have
not used a mobile phone.82 And many people still live two hours walking distance from the closest mobile
service area; the reach of mobile phone infrastructure remains more limited in some countries than that of
the landline network. In fact, in the developing world, about three billion people live in rural areas today,
up from 2.5 billion in 1985.83 With few exceptions (notably China), developing countries have made very
little progress in bringing telephone access to rural areas by wire or wireless, other than to rural areas
that are often categorized as peri-urban, some of which now fall within mobile signal coverage.84 This is
due not only to the heavy costs involved and the poor inhabitants but also to the absence of electricity.85
As noted earlier, in Russia (a high-end emerging market) more than 30,000 villages have no
access to telephone lines, fixed or mobile. In Brazil, the 2,500 “cities” still without mobile service call for
81 In the early stages of mobile phone diffusion, many surveys focused on non-subscribers as much as
subscribers. This focus needs to be re-established with respect to countries and areas (largely rural)
where mobile phone penetration remains low.
82 According to Dr. Tim Kelly, “ITU estimates, based on the number of households and villages that have
telephone access, suggest that close to one-fifth of the world’s population currently have no telephone
access.” This works out to about 1.3 billion people as of mid 2006. See Tim Kelly, “Twenty years of
measuring the missing link,” in Gerald Milward-Oliver, ed., Maitland+20: Fixing the Missing Link (The
Anima Centre Limited: Bradford on Avon, UK, 2005), p. 26.
83 United Nations, World Population Prospects: The 2004 Revisions, available at
http://esa.un.org/unpp/p2k0data.asp
84 According to Randall Stephenson of AT&T (NXTcomm08, Las Vegas, June 17,2008), 80% of the
world’s population now lives within range of a cell tower compared to 40% in 2000. However, this
figure may not take into account the spottiness of coverage, frequent breakdowns due to electricity
failures, interruptions of service in areas with heavy rainfall, etc. Also a potential subscriber at the
edge of a rural coverage zone may work outside the zone and/or have important social relations with
others not yet covered, all of which may reduce the propensity to subscribe, particularly when
disposable cash is highly limited.
85 Access to electricity is, of course, critical to re-charging mobile phones. The ingenuity of mobile
phone users in coping without local electricity cannot be underestimated, however. In South Africa,
recharging by means of car batteries is a common practice; in Tanzania periodic collection of the
phones in a rural town without electricity and transporting them to the closest electrified town for re-
charging is not uncommon. See Jonathan Samuel et al., op. cit. See also notes 170 and 171 above
and associated text.
International Journal of Communication 2 (2008) The Adoption of Mobile Phones in Emerging Markets 657
an investment of $1.5 billion, according to Anatel, Brazil’s regulator.86 Another study of 11 Latin American
countries has found that from 15% to 35% of their populations will not be able to adopt mobile phone
service on a market basis, with Brazil falling into the middle of the range.87 To make mobile phone service
available in the areas not likely to be served by the market, this same study would require a subsidy of
$44 billion, the study concludes.88 The commensurate numbers for Africa and Asia are undoubtedly
higher, as could be the number for Russia and the rest of the developing world.
Mobile phones offer hope but also require infrastructure. And such infrastructure is difficult and
expensive to deploy in poor, often geographically-challenging, rural areas — for reasons of density,
economics (including maintainability), often topography, and climate, not to mention for reasons of
opportunity costs. The effort and investment allocated to rural areas is taken from urban ones, where the
market opportunities are greater — and where loss of market share to competing operators could stunt a
mobile company’s overall growth. Conversely, the investment required to install mobile coverage in
relatively low-density rural areas may be better spent on water, public health, housing, or education
facilities. Some governments — from Peru, to Cambodia, to Armenia — have started to focus on how to
create incentives for operators to deploy rural wireless service, but we remain in the early adoption stage
as far as poor and remote rural areas are concerned.89
86 See note 92 above.
87 Peter A. Stern and David N. Townsend, New Models for Universal Access to Telecommunications
services in Latin America: Lessons from the Past and Recommendations for a New Generation of
Universal Access Programs for the 21st Century, Regulatel (Forum of Latin American
Telecommunications Regulation Entities), November 2006.
88 Ibid., Executive Summary, p. 5. About 44% of the unservable population lives in towns of 300 or
more and could be reached relatively inexpensively (with a subsidy of $126 per capita). The
remainder represents a much bigger challenge, requiring an average subsidy of $736.
89 With World Bank support, governments are implementing output-based aid (OBA) projects to extend
telecommunications access to rural areas. Typically, private operators are asked to bid in reverse
auctions for the right to operate mobile (or other telecommunications) services in rural parts of low-
income emerging countries. The bidder requiring the lowest subsidy is awarded the concession.89
While promising, this approach faces a number of challenges, including implementation of new
technologies that have had limited field testing (upon the promising economics of which winning
bidders may depend) and the ability of the winning bidders, in some cases relatively new companies,
to sustain financial and managerial requirements. For further details, See World Bank, OBA Book,
Geoffrey Cannock, “Expanding Rural Telephony: Output-based contracts for pay phones in Peru,” OBA
Book, World Bank, Washington, DC; available at
http://rru.worldbank.org/Documents/Other/06ch1.pdf; also Andrew Dymond and Sonja Oestmann,
Rural Telecommunications Development in a Liberalizing Environment: An Update on Universal Access
Funds, Intelecon Research & Consultancy Ltd. July, 2002.

658 Kas Kalba International Journal of Communication 2(2008)
In sum, despite globalization, massive urbanization, and the rapid spread of mobile phones, we
are now only completing what Everett Rogers and other analysts of innovation diffusion would call the
“early majority” phase of the global adoption process.90 The innovators and early adopters have entered
the market as has most of the second quadrant of the world’s population. As noted above, another 4.6
billion people do not subscribe to mobile phone service, including some in the developed world, where
laggard countries like the U.S. are still catching up with the likes of Sweden, Italy, Israel, and Hong Kong.
Of these, perhaps a billion are users via family, friends, and mobile payphones, which brings the number
of non-adopters to about 3.5 billion. Many of these in turn are children or others who are restricted by
age, infirmity, or incarceration from becoming regular mobile phone users. This still leaves on the order
of 2.5 billion potential adopters.
So at a global level, the mobile phone diffusion process is taking, paradoxically, longer than
might be expected, in part because of population growth. Most adoption studies assume fairly constant
population. Yet the globe has had a net gain of almost two billion people since 1984, many of whom have
been born—and still live — in poor rural areas. Full global adoption, in other words, will take more than
the 20 to 30 years contemplated in the classical diffusion literature, the unprecedented spread of mobile
phones across the globe notwithstanding. The question is whether it will be a few years longer — as few
as four, if 20-25% per year subscriber growth were to continue, or 10 or more, if the diffusion curve
lapses into a relatively long tail.91
Rogers notes that traditionally late adopters have taken several times as long as early ones to
adopt an innovation. 92 So understanding what share of those currently without mobile phones are
nonetheless relatively far along the mobile diffusion curve (due to their use of shared mobile phones) is
important to any projection of further adoption in emerging markets. If this prior exposure predisposes
low-income users to buying phones, their future availability at, say, a $10 level (along with future ARPU
of, say, $1) could open a floodgate.93 An equally important technological trend line is the declining cost
per subscriber (especially per rural subscriber) of the infrastructure, along with allocations of wider
90 See Everett Rogers, The Diffusion of Innovations, Fifth Edition (Free Press: New York, 2003).
91 One of the most recent global forecasts of mobile phone subscriptions projects the recent 25% annual
level dropping to 12.8% in 2007 and 5.7% by 2010. (The projection is by iSuppli, as cited in Stephen
Wellman, “Wireless Agenda,” Information Week, Feb. 19, 2007, pp. 40-45.) However, except for the
3G forecasting euphoria in the 1998-2002 period, virtually all projections of mobile subscriber growth
have underestimated actual results; arguably, they were not contending with market “laggards.”
92 Op. cit., pp. 214-215.
93 Many mobile operators have reduced operating costs by an order of magnitude in recent years in
markets such as India in order to sustain calling fee reductions from $0.20 per minute to $0.02 per
minute. See, for example, Jo Johnson, “Entrepreneur sows his mobile millions in the fields,” Special
Report on India and Globalization, Financial Times, Jan. 26, 2007, p. 6.
International Journal of Communication 2 (2008) The Adoption of Mobile Phones in Emerging Markets 659
spectrum bands for mobile service94 and industry commitment to extending mobile networks,95 as these
are the critical ingredients of mobile coverage extension into rural areas. These are the main challenge in
rural India, Russia, Pakistan, Indonesia, Brazil, parts of rural China, and especially rural Sub Saharan
Africa, going forward.
Could the pace of adoption be transformed with the introduction of new technology or a new
business model? It certainly can, at least in theory. A new wide area technology, allowing an area of 100
km. radius (possibly WiMAX) or 1000 km. radius (possibly HF communications) to be served from a single
antenna, powered by inexpensive solar energy, could reduce the deployment costs dramatically.
Similarly, a business model based on advertising or greater government- or vendor-based subsidies of
service, handsets, or infrastructure deployment could lower adoption barriers significantly.
At the same time, such approaches embody their own adoption cycles. The new technology must
be proven. Learning economies must have time to permeate the production and deployment process.
New frequencies must be allocated, including international coordination. And the new business model
must be tested and perfected before investors will support it on a widespread basis, especially in the rural
areas of low-income markets.
Meanwhile, the tension between the emerging communication culture and the traditional
subsistence economy will play itself out across the poor and remote agrarian villages of the world. A
resolution will occur, sooner or later, not only as cheaper phones and prepaid plans are developed, but as
low-cost base stations, capable of serving the low-volume, wide-area needs of small villages, become
available at a relatively nominal cost.96 Until this — or another widespread revolutionary wireless rollout
— occurs, the diffusion of mobile phones in the rural areas of the developing world remains the next
frontier.
94 Why is a lot of spectrum needed for a few initial users? It is needed to insure that coverage and
capacity can be provided without having to deploy costly, more intricate (i.e. with smaller cells)
infrastructure. This spectrum will not have to be “stolen” or borrowed from urban areas. It will be
indigenous. Nonetheless, a fair degree of spectrum planning is called for. For example, in many
countries, the military is the primary holder of relevant spectrum and is reluctant to part with it.
95 At the ITU-led Connect Africa Summit held in Rwanda in May 2007, the World Bank and the GSM
Association (mobile operators) committed more than $50 billion in further infrastructure investments
to improve connectivity on the continent.
96 For a useful summary of how a mobile operator in India is extending its service into rural areas, see
Eric Bellman, “In India, Rural Poor Are Key to Cellular Firm’s Expansion,” Wall Street Journal, Sept.
24, 2007, p.1. The author reports on some concrete successes in reducing rural cellular coverage
costs, including prospects for sharing towers and other infrastructure by multiple operators. At the
same time, the latest cost of building and equipping a cellular tower, 40% lower than the previous
level, remains at $75,000.
660 Kas Kalba International Journal of Communication 2(2008)
In short, much of the world’s population does not currently have the means to support mobile
phone service, other than on a shared access basis. Even at $5 per month, this can represent 10% to
25% of the income of a person making $1 or $2 a day. And other than the occasional call to coordinate a
remittance payment, stay in touch with a family member who has moved to the city, or arrange the
annual visit to another village, the functional uses of a phone for the average rural inhabitant are limited.
However, farmers and small business users are likely to lead the way in rural mobile phone adoption as
they have historically in the adoption of fixed and mobile phones in rural and urban areas, respectively.
For them, the functional benefits — whether ordering supplies or checking market prices — are more
obvious and more routine. 97
Also, as the world has shown, adoption of the mobile phone proceeds only partly on a functional
basis. It has also been spurred by observability and imitation, by cultural and lifestyle changes, by status
imitation and fashion trends, and by the sheer retail presence and dynamic product and pricing
innovations of the mobile industry. This process will continue unabated. The question is at what pace.
Conclusions
The mobile adoption process in emerging markets is highly dynamic and is still evolving. At the
same time, a number of underlying patterns are evident. Notably, the relationships between income level
(as reflected in GDP per capita) and mobile penetration and between fixed and mobile penetration are
both strong. This suggests mobile diffusion across the world — and, in particular, within emerging
markets — is not topsy turvy (i.e., random or counter-historical), but that it largely follows traditional
diffusion patterns, albeit at a much faster pace. Whereas in past diffusions of communications media, the
impact in “third world” markets was generally limited (i.e., to a small elite and/or large workplaces),
mobile adoption has occurred on a widespread basis in the past few years in India, Africa and other low-
income markets.
Yet widespread does not mean that the diffusion process has not followed certain traditional
patterns. The relationships to income and to fixed penetration remain fundamental building blocks in any
attempt to understand the mobile phone adoption process. Admittedly, most emerging markets have
more mobile subscribers than fixed ones (often many more), and low-income users spend a much higher
share of their income on mobile phones and associated service than do high-income ones. However, this
does not negate the existence of the above relationships, not their strength. In fact, the correlation
between fixed and mobile penetration is now much stronger in emerging markets than in developed ones.
On the side of change, this paper confirms the major role played by prepaid products in
innovation diffusion in emerging markets. How access to communications media is charged and billed
97 Small businesses have been the vanguard of mobile phone adoption in most countries. Farmers were
relatively heavy early adopters of the wireline phone in the United States. See Claude Fischer,
America Calling: A Social History of the Telephone to 1940 (University of California Press: Berkeley,
CA, 1992), pp. 92-107.

International Journal of Communication 2 (2008) The Adoption of Mobile Phones in Emerging Markets 661
turns out to be a critical factor. Specifically, the paper shows that there is a strong correlation between
declining income level and the adoption of prepaid mobile phones and cards. In many cases, this means
that individuals in emerging markets find the advantages of prepaid, which can include greater
expenditure control, free access to incoming calls, and subscriber anonymity, to outweigh higher per
minute charges. The net result is that most subscribers in emerging markets, using prepaid offerings,
spend less for mobile connectivity and calling than do their post-paid counterparts, and are able to buy
mobile access in a way that is consistent with irregular cash availability.98
The paper questions several other commonly held views of mobile phone adoption. One is that
the number of mobile operators in a given market is a good proxy for competition, and that the higher the
number, the more mobile subscribers there should be. It turns out, based on the data presented, this is
not always the case. While the issue needs to be examined more systematically, there is a real possibility
that in some contexts the optimal number of operators from a subscriber maximization standpoint is not
the largest possible number. Similarly, the paper questions the value of young adopters in driving
adoption in emerging markets, and suggests that older populations (e.g., in Eastern Europe) can be more
pivotal, as the age of prospective subscribers may be correlated with other adoption-facilitating factors
(e.g., steady income).
One such factor, the paper suggests, is household size. Specifically, it finds that emerging
markets with small-size households are likely to experience more rapid mobile adoption than are their
counterparts with larger households. This is the case not only for Eastern Europe compared to Latin
America, but also China compared to India, Indonesia compared to Bangladesh, and so on. Education,
income, and age may be co-mingled with household size, but this does not reduce the potential value of
this variable as a lead differentiator of broad-based mobile adoption. A question for future research is
whether the adoption of mobile phones by a large household with limited disposable cash — and their
shared use by household members — will stimulate other household members to join the cash economy in
order to afford personal mobile phones.
Large households are especially prevalent in the rural areas of very low-income emerging
markets, such as the Indian subcontinent, most of Africa, and parts of Latin America. The last part of the
paper addresses the challenges of covering the rural areas of these regions with mobile infrastructure and
the uncertainties of demand for mobile communications where contact with mobile phones has been
limited to date. This rural challenge is at the heart of the next phase of mobile phone adoption around the
world. Will urban adopters, including recent migrants from rural areas, serve as effective adoption agents
and promoters in these rural regions once signal coverage is available, or will the adoption process
decelerate as it enters more remote areas? That is the question as mobile phones become available to
humanity’s second half.
98 Postpaid offerings, on the other hand, require salary-type cash flows or significant accumulation of
cash.