the acs system of the ct scanner – a verification for
TRANSCRIPT
Inżynier i Fizyk Medyczny 2/2017 vol. 6 87
radiologia / radiologyartykuł naukowy / scientific paper
The ACS system of the CT scanner – a verification for radiation therapy
purposes during commissioning of the Philips Brilliance system
(ver.4.2.0.17057)ACS w systemie tomograficznym – weryfikacja
na potrzeby radioterapii podczas testów dopuszczających tomografu Philips Brillance
(ver.4.2.0.17057)
Dominika Oborska
The Royal Wolverhampton NHS Trust New Cross hospital Wednesfield, Wolverhampton WV10 0QP, United Kingdom, e-mail: [email protected]
Abstract
The aim of the project was to allow the CT sys-
tem (Philips Brilliance ver.4.2.0.17057) to a clin-
ical use in radiation therapy. A part of the project
was to evaluate the performance of the ACS system
using quality and quantity parameters of CT imag-
es. The assumption was that the ACS system should
compensate a patient size and keep consistent im-
age quality and quantity.
The ACS was evaluated using image quality para-
meters (SD, SNR, CNR, contrast), quantitative pa-
rameters (HU, SD) and dose (CTDIs). The scans and
reconstructions were made for all implemented
clinical protocols using phantoms: CATPHAN600,
CIRS, Philips test subjects (15cm-50cm in diameter).
A qualitative and quantitative assessment of the
image parameters was performed. They were also
compared for the protocols with fixed mAs and ACS
protocols. ACS testing was completed to ensure that
the system behaves stable, compensate different
scanning conditions, keeps appropriate image qual-
ity and don’t change image quantity data for radio-
therapy purposes.
Key words: CT scanner wide bore, AEC system, ima-
ge quality, image quantity
Streszczenie
Na potrzeby dopuszczenia systemu TK (Philips
Brilliance ver.4.2.0.17057) do użytku kliniczne-
go w radioterapii wykonana została ocena działania
systemu ACS w zakresie parametrów jakościowych
i ilościowych obrazów. Założono, że system ACS
powinien kompensować warunki obrazowania de-
terminowane rozmiarem pacjenta, uwzględniając
jakość obrazu, parametry ilościowe obrazu przy op-
tymalizacji dostarczonej dawki. Dla wszystkich zaim-
plementowanych protokołów klinicznych oceniono
ACS w funkcji jakości obrazu parametrów ilościowych
(HU, SD), używając fantomów CATPHAN600 (SD, CNR,
kontrast, jednorodność), CIRS (SD, HU, powtarzal-
ność i odtwarzalność HU) oraz zestaw jednorodnych
obiektów testowych (15cm-50cm średnicy) (HU,
SD, jednorodność). Porównano również parame-
try jakościowe i ilościowe dla protokołów ze stałym
mAs i protokołów ACS. Wszystkie czynności zostały
wykonane w celu uzyskania efektu optymalizacji pro-
tokołów w układzie jakość obrazu w stosunku do daw-
ki, przy jednoczesnym zapewnieniu właściwej kali-
bracji gęstości masowej w funkcji odczytywanych HU.
Słowa kluczowe: tomografia, systemy to-
mograficzne w radioterapii, system AEC, jakość
obrazowania, parametry ilościowe obrazu
otrzymano / received:
03.02.2017
poprawiono / corrected:
13.02.2017
zaakceptowano / accepted:
28.02.2017
vol. 6 2/2017 Inżynier i Fizyk Medyczny88
radiologia \ radiology artykuł naukowy \ scientific paper
Introduction
A CT simulator is a component in the radiation oncology facility.
It enables a radiotherapy staff to set/simulate the radiotherapy
treatment as well as a clinician to determine a location, size and
shape of the tumour/treated region/OARs..
3D planning scans are carried out on “regular diagnostic”
CT scanners. Usually they have “wide-bore” sizes from 80cm
to 90cm. It makes a space to scan patients in the radiotherapy
treatment position with appropriate immobilisation equip-
ment. A flat table-top with indexing for immobilisation devices
is required to replicate the linac table top to get a simulation of
a patient position and treatment setup during radiotherapy ses-
sions. Additionally a table movement and sag effect are restrict-
ed more than for a standard diagnostic system as a geometrical
reconstruction precision is required.
Image quality is less restricted in radiation oncology than in
diagnostic imaging. There is because patients undergoing CT
simulation in radiation oncology have already diagnosed disease
and clinician contouring is supported by other imaging modal-
ities (MRI, nuclear imaging). Quantity data of the CT image is
more concern in radiation oncology. There is still very import-
ant to get a proper setting protocols/facilities (gating, metal
artefact correction, contrast etc.) in relation to radiotherapy
purposes and to reduce artefacts which can change significantly
quality or quantity parameters in the image.
Scan protocols are similar to diagnostic but should be altered
to increase geometric accuracy and linearity of Hounsfield
Units. Each voxel has a HU value proportional to it’s x-ray ab-
sorption, which is proportional to its electron density, which is
fairly proportional to its physical density. A CT scan is thus a 3D
map of x-ray absorption in the patient which is used by treat-
ment planning software to determine the absorption of radia-
tion anywhere in the patient taking into account the 3D shape
of the patient and the different absorption of different tissues
within the patient. The treatment planning software uses the
CT scan to calculate the dose absorbed anywhere in the patient
and produce a 3D treatment plan and dose distribution.
External laser systems are installed as the internal lasers on
CT scanners characterizes high uncertainty of a setup in relation
to radiotherapy requirements. A full set contains moving side-
wall lasers and overhead sagittal laser.
A radiotherapy facility built in the CT scanner system is a vir-
tual simulation software developed to replace the physical sim-
ulator. Using it treatment planners can import the patient CT
planning scan and then:
– position beams around the virtual patient with different
gantry & collimator angles and table rotations,
– set field sizes and MLC shapes, generate DRRs (digitally re-
constructed radiographs),
– visualize the patient surface, showing the light field of the
treatment field on the patient surface and showing patient
marks that have been placed on during the planning CT scan,
– contour patient anatomical structures within the patient CT
dataset which can be used by the TPS,
– calculate dose distribution in the patient and DVHs.
(AEC) System
AEC (Automatic Exposure Control) systems for CT scanners
have different capabilities and operate in a variety of ways, de-
pendently on a manufacturer. Their main purpose is to adjust the
x-ray tube current/time of a rotation to compensate for differ-
ent levels of attenuation (patient size/shape) of the CT scanner’s
x-ray beam. This has a number of potential advantages – consis-
tency of image quality, optimization radiation dose provided to
patient and image quality, avoidance of certain types of image
artefacts. There is very important to find out a new concept and
understand facilities of those systems to use them correctly.
A range of exposure parameters can be adjusted – tube volt-
age, tube current, exposure time and other factors. The reason
that a single set of exposure parameters can’t be used for all
patients is their size or shape as well as composition of the ana-
tomical regions. The penetration of x-ray through a patient de-
pends on a range of factors, but in an average way, x-ray beam
halves for each 3 cm of soft tissue. A difference in patients sizes
and composition – eg. soft tissue, bone and lung tissue - causes
difference of levels of image noise.
CT scanners produce digital images as a result of a mathemat-
ical reconstruction from a series of attenuation measurements
made during the rotation of a x-ray tube and detector around
of the examined patient. These images don’t suffer from under-
and over-exposure in the same way as standard imaging sys-
tems. All digital images systems use image presentation tools
– window level and width controls – allowing viewing in a highly
flexible manner. The effect of differences in patient size and/
or composition is to increase/decrease the intensity of the x-ray
beam getting the CT detectors. The statistical nature of x-ray
transmission, the accuracy of the attenuation measurements
made by detectors depends on the beam intensity – the lower
intensity causes the worse accuracy of measurements resulting
in higher noise in the image. The worse statistic can result the
worse noise “distribution” and “streaking” artefacts appearing
(especially in asymmetric regions of the body – eg, shoulders).
The usual method for adjusting CT exposure levels to com-
pensate for patient size is to adjust the tube current or rotation
time in order to change the mAs. Currently CT scanners have
a range predefined protocols for different examination types,
anatomical regions, used facilities enhancing functionalities
matching to diagnostic or radiotherapy purposes. These are
generally set up for an “average” sized patient, and the user can
vary these parameters on a patient–by-patient basis.
The AEC system works at three levels: patient size, Z-axis, rota-
tional/diagonal separation. The patient size determines a mA set
up. The same mA is used for an entire examination or scan series as
an average assessed from a scannogram. The Z-axis AEC adjusts mA

Inżynier i Fizyk Medyczny 2/2017 vol. 6 89
radiologia / radiologyartykuł naukowy / scientific paper
for each rotation of the x-ray tube, taking into account the variation
of the attenuation along the patient’s z-axis. That reduces the vari-
ation in image quality of each cross-section for the same series. The
rotational/diagonal AEC compensates differences in attenuation
between lateral and A-P projections using a modulation of the x-ray
tube current. The amplitude of mA modulation during the rotation-
al AEC reflects the patient asymmetry (eg. head-neck region and
shoulders). The rotational AEC requires x-ray tubes and generators
vary the output rapidly and accurately, especially for sub-second ro-
tation times (multi-slice CT systems). Image noise is affected by ro-
tational/diagonal modulation in a different way to the patient and
z-axis AEC. Noise is a function of uncertainty of all the attenuation
measurements in each pixel. The rotational/diagonal AEC reduces
the variation in uncertainty of those measurements by modulation
of mA in relation to the attenuation level for each projection angle.
Those three levels of the AEC system can be combined (Fig.1.).
Fig. 1 (AEC) system: a) patient size, b) z-axis (AEC), c) rotational/diagonal (AEC), d)
combined (AEC)
Source: [1].
The introduction of CT AEC systems improved the consistency
of image quality. Although it does not answer the question of what
level of image quality is required for the diagnostic or radiotherapy
purposes. The consistency of image quantity is also assigned to im-
age quantity. It is not answer what consistency of image quantity is
required for the diagnostic and radiotherapy purposes.
AEC systems should also bring optimization between image
quality and dose provided to the patient (exposure optimiza-
tion), reduce tube loading, protect the CT system for extended
scan runs, reduce photon starvation artefacts. That last one re-
sult from inaccurate attenuation measurements at some scan
angles, causes by relatively small number of radiation transmit-
ted through the patient and reaching the detectors. Increasing
mA for the most attenuating scans angles can increase the accu-
racy of these attenuation measurements.
Verification of the (AEC) System
The AEC system should be controlled by specifying image qual-
ity – SD (Standard Deviation, Noise), SNR, CNR, contrast, unifor-
mity, spatial resolution and image quantity - HU, SD.
The standard deviation of pixel values determines a noise in
the image. The scanner aims to set the tube current is achieving
the requested standard deviation in the image by image basis.
Using an SD based system, the AEC is controlled by setting im-
age quality, rather than using mA modulation, which is a radia-
tion exposure related measure. Philips CT scanners use the SD
based AEC system. SD values in the image is not intuitive for that
system and user should set protocols in line with SD appropri-
ate for the clinical task. There is important to understand that
image noise in inversely proportional to the square of the tube
current, so halving the SD results in an increase in the mA (ef-
fectively patient dose), by a factor of 4. With SD based systems,
the (AEC) response to different patient sizes is pre-defined, be-
cause the aim is always to keep the image noise constant.
Some CT scanners systems use a reference mAs AEC control.
Setting an mA (or mAs) is used for a scanner protocol basing on
the reference mA value. That value is used on an average sized
patient. The AEC system assesses the patient size cross-section
using a scannogram, and adjusts the tube current relative to the
reference value.
There is not straightforward relationship between AEC sys-
tems basing on the reference mA value and reference SD.
The third method is controlling AEC systems basing on a “ref-
erence image” (reference images for different reference phan-
tom sizes – Philips Brillance). That image, scanned and judged
previously, is characterised by appropriate image quality for
a particular clinical purpose. The scanner sets the mA to match
the noise in the reference image. The main advantage of that
system is required image quality is expressed using existing clin-
ical protocols, rather than an abstract value of SD. It can result
better image quality but requires high experienced staff to pro-
vide appropriate image quality and an assessment of it.
The Philips CT Scanner AEC System
The Philips DoseRight system is composed of three indepen-
dent parts; Automatic Current Selector (ACS) Z-DOM (Longitu-
dinal Modulation), D-DOM (Angular Modulation). The ACS auto-
matically suggests the maximum mAs for each patient in order
to achieve a constant image noise level (between patients, not
throughout the scan). Z-DOM adjusts the mAs along the lon-
gitudinal direction, based upon the Surview image. D-DOM is
a rotational modulator varies mAs due to asymmetry (lower sig-
nals (e.g. lateral) contribute high noise, whilst high signals (A-P)
make minor contributions to total noise). Modulation is carried
out online during the scan using the data from the previous ro-
tation to determine what to do on the next.
DoseRight ACS is controlled by use of a reference image,
which is assigned by the user to be used for individual scan pro-
tocols. It uses an Surview (A-P and LAT) to assess the patient
attenuation in order to set the mA for all z-axis positions and
angles of a projection.
vol. 6 2/2017 Inżynier i Fizyk Medyczny90
radiologia \ radiology artykuł naukowy \ scientific paper
AEC System Testing
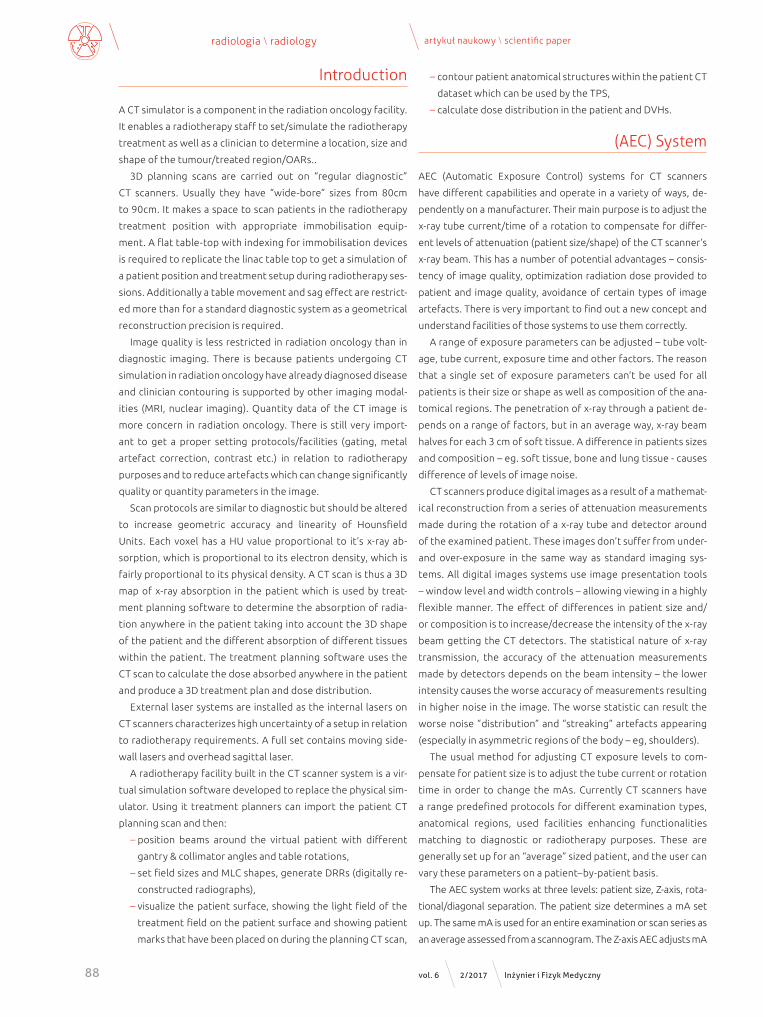
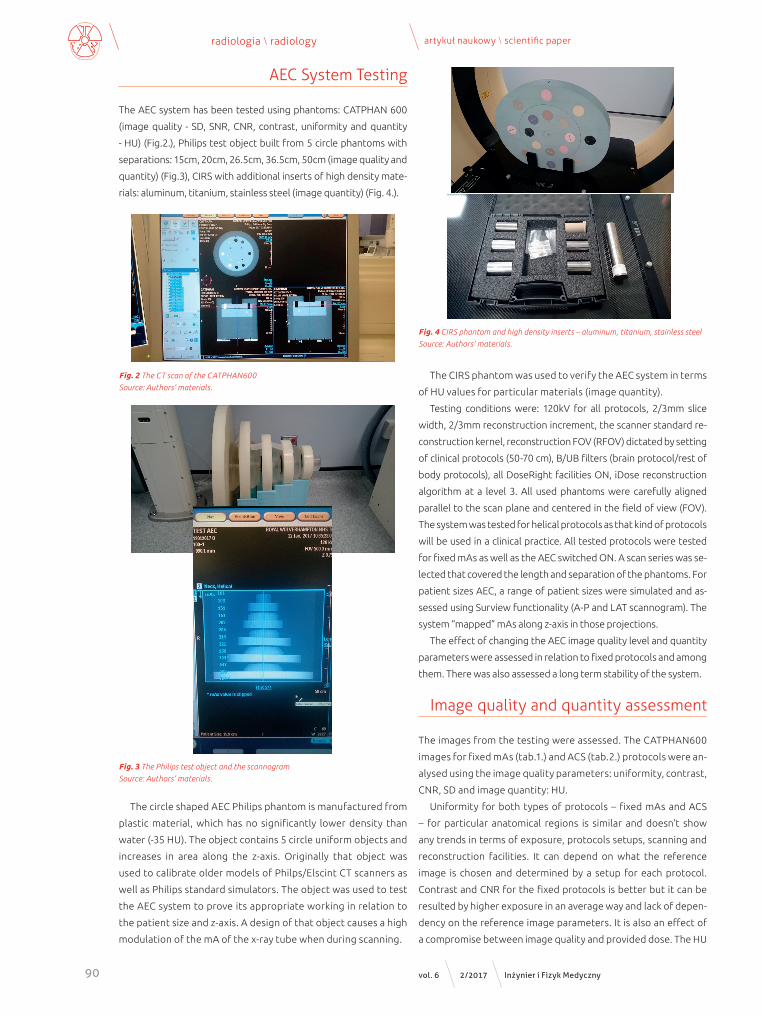
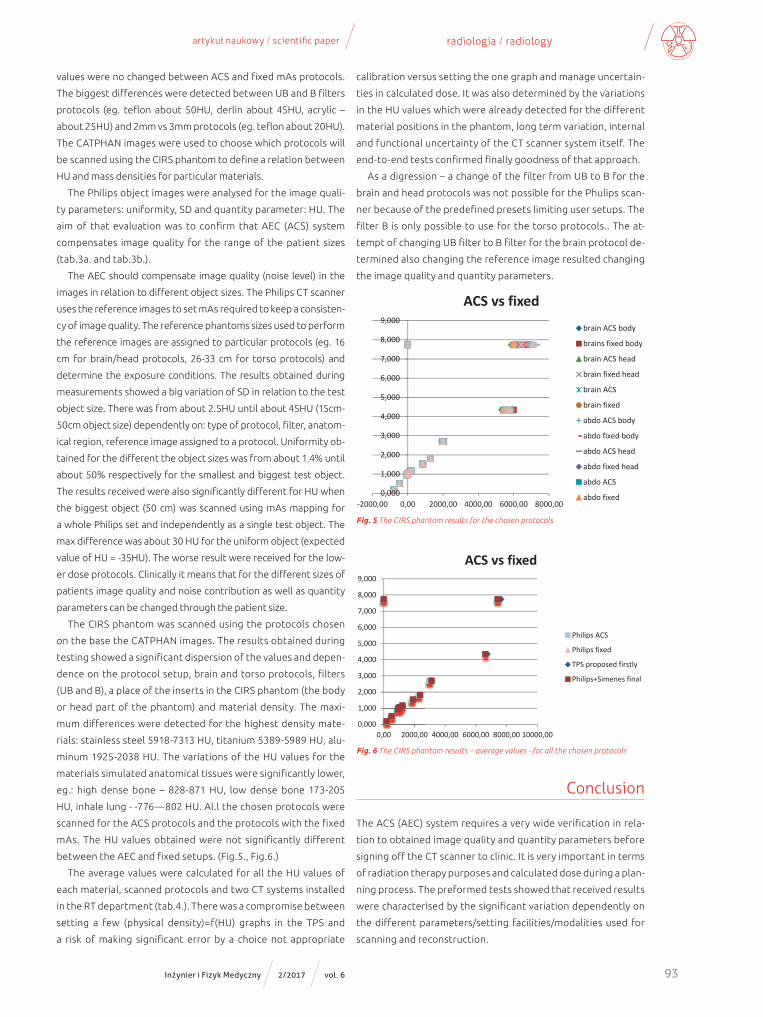
The AEC system has been tested using phantoms: CATPHAN 600
(image quality - SD, SNR, CNR, contrast, uniformity and quantity
- HU) (Fig.2.), Philips test object built from 5 circle phantoms with
separations: 15cm, 20cm, 26.5cm, 36.5cm, 50cm (image quality and
quantity) (Fig.3), CIRS with additional inserts of high density mate-
rials: aluminum, titanium, stainless steel (image quantity) (Fig. 4.).
Fig. 3 The Philips test object and the scannogram
Source: Authors’ materials.
Fig. 2 The CT scan of the CATPHAN600
Source: Authors’ materials.
Fig. 4 CIRS phantom and high density inserts – aluminum, titanium, stainless steel
Source: Authors’ materials.
The CIRS phantom was used to verify the AEC system in terms
of HU values for particular materials (image quantity).
Testing conditions were: 120kV for all protocols, 2/3mm slice
width, 2/3mm reconstruction increment, the scanner standard re-
construction kernel, reconstruction FOV (RFOV) dictated by setting
of clinical protocols (50-70 cm), B/UB filters (brain protocol/rest of
body protocols), all DoseRight facilities ON, iDose reconstruction
algorithm at a level 3. All used phantoms were carefully aligned
parallel to the scan plane and centered in the field of view (FOV).
The system was tested for helical protocols as that kind of protocols
will be used in a clinical practice. All tested protocols were tested
for fixed mAs as well as the AEC switched ON. A scan series was se-
lected that covered the length and separation of the phantoms. For
patient sizes AEC, a range of patient sizes were simulated and as-
sessed using Surview functionality (A-P and LAT scannogram). The
system “mapped” mAs along z-axis in those projections.
The effect of changing the AEC image quality level and quantity
parameters were assessed in relation to fixed protocols and among
them. There was also assessed a long term stability of the system.
Image quality and quantity assessment
The images from the testing were assessed. The CATPHAN600
images for fixed mAs (tab.1.) and ACS (tab.2.) protocols were an-
alysed using the image quality parameters: uniformity, contrast,
CNR, SD and image quantity: HU.
Uniformity for both types of protocols – fixed mAs and ACS
– for particular anatomical regions is similar and doesn’t show
any trends in terms of exposure, protocols setups, scanning and
reconstruction facilities. It can depend on what the reference
image is chosen and determined by a setup for each protocol.
Contrast and CNR for the fixed protocols is better but it can be
resulted by higher exposure in an average way and lack of depen-
dency on the reference image parameters. It is also an effect of
a compromise between image quality and provided dose. The HU
The circle shaped AEC Philips phantom is manufactured from
plastic material, which has no significantly lower density than
water (-35 HU). The object contains 5 circle uniform objects and
increases in area along the z-axis. Originally that object was
used to calibrate older models of Philps/Elscint CT scanners as
well as Philips standard simulators. The object was used to test
the AEC system to prove its appropriate working in relation to
the patient size and z-axis. A design of that object causes a high
modulation of the mA of the x-ray tube when during scanning.

Inżynier i Fizyk Medyczny 2/2017 vol. 6 91
radiologia / radiologyartykuł naukowy / scientific paper
Tab
. 1 T
he C
ATP
HA
N6
00
imag
es q
ualit
y an
alys
is r
esul
ts –
fixe
d m
As
prot
ocol
s
Tab
. 2 T
he C
ATP
HA
N6
00
imag
es q
ualit
y an
alys
is r
esul
ts –
AC
S pr
otoc
ols

vol. 6 2/2017 Inżynier i Fizyk Medyczny92
radiologia \ radiology artykuł naukowy \ scientific paper
ROI ~
500
cm^2
EXPR
ESSE
D IN
TER
MS
OF
HU N
OT
%~1
000m
m sq
~100
0mm
sqon
ly sc
anne
d
Prot
ocol
15.0
cmHU
SNR
UNI
diff
to
cat
20.0
cmHU
SNR
UNI
diff
to
cat
26.5
cmHU
SNR
UNI
diff
to
cat
36.5
cmHU
SNR
UNI
diff
to
cat
50.0
cmHU
SNR
UNI
diff
to
cat
50.0
cmHU
SNR
UNI
diff
to
cat
BRAI
N R
AD 2
mm
cent
r-3
7ce
ntr
-34,
8ce
ntr
-31,
8ce
ntr
-29,
2ce
ntr
-31,
9ce
ntr
-54
(id: 2
01)
SD2,
9SD
4SD
6,6
SD14
,5SD
44,8
SD37
,1an
t-3
8,3
ant
-37,
6an
t-3
5,6
ant
-32,
8an
t-3
2,9
ant
-31,
7SD
3SD
4,1
SD5,
2SD
11,3
SD24
,9SD
23,4
post
-37,
5po
st-3
5,5
post
-33,
5po
st-3
1,5
post
-45,
9po
st-4
6,6
SD2,
9SD
3,9
SD5,
3SD
11,4
SD26
,9SD
24,7
LT-3
7,8
LT-3
5,9
LT-3
4,1
LT-3
3,9
LT-4
0,4
LT-5
2,3
SD2,
7SD
3,6
SD5,
1SD
12SD
27,4
SD27
,2RT
-39,
1RT
-37,
4RT
-35,
6RT
-34,
8RT
-42,
5RT
-50,
5SD
2,7
SD3,
7SD
4,7
SD11
SD26
,2SD
26,4
Prot
ocol
15.0
cmHU
SNR
UNI
diff
to
cat
20.0
cmHU
SNR
UNI
diff
to
cat
26.5
cmHU
SNR
UNI
diff
to
cat
36.5
cmHU
SNR
UNI
diff
to
cat
50.0
cmHU
SNR
UNI
diff
to
cat
50.0
cmHU
SNR
UNI
diff
to
cat
H&N
2 m
mce
ntr
-31,
4ce
ntr
-32,
6ce
ntr
-35,
2ce
ntr
-36,
6ce
ntr
-28,
5ce
ntr
-50,
7(id
: 301
)SD
6,4
SD7,
5SD
11,7
SD20
,4SD
38,4
SD35
,6an
t-3
2,2
ant
-33,
2an
t-3
5,3
ant
-36,
4an
t-3
3,2
ant
-34,
3SD
5,8
SD7,
2SD
10,8
SD16
,7SD
23,5
SD25
,3po
st-3
1po
st-3
1,6
post
-34,
2po
st-3
7,6
post
-48,
9po
st-5
3,2
SD5,
5SD
7,1
SD11
SD19
,2SD
25,4
SD25
,1LT
-30,
5LT
-31,
8LT
-34,
5LT
-37,
8LT
-34,
8LT
-63,
8SD
4,9
SD7,
4SD
9,9
SD18
,3SD
23,8
SD26
RT-3
1,5
RT-3
3,3
RT-3
5,2
RT-3
9,5
RT-3
8,1
RT-6
4,6
SD5,
2SD
6 ,9
SD9,
4SD
16,8
SD27
,2SD
26,7
12,8
2,1
-0,5
8,7
2,8
0,2
4,8
3,8
1,5
22,3
21,5
1,4
1,9
1,9
1,9
12,9
9,1
6,3
2,8
1,7
11,4
12,8
9,2
6,8
2,9
1,3
1,2
2,0
5,6
3,0
0,7
14,0
14,5
10,1
7,6
3,2
1,6
14,0
10,0
6,7
2,8
1,5
4,9
1,7
-0,5
4,3
1,7
-0,5
5,6
4,6
5,6
4,5
6,1
4,8
1,4
30,3
29,5
1,4
2,1
2,5
0,7
20,4
18,2
1,4
3,0
1,1
-1,1
1,8
3,1
0,9
3,3
2,2
3,1
2,0
2,4
3,7
2,4
1,4
1,9
6,2
4,3
3,5
2,1
1,5
Prot
ocol
15.0
cmHU
SNR
UNI
diff
to
cat
20.0
cmHU
SNR
UNI
diff
to
cat
26.5
cmHU
SNR
UNI
diff
to
cat
36.5
cmHU
SNR
UNI
diff
to
cat
50.0
cmHU
SNR
UNI
diff
to
cat
50.0
cmHU
SNR
UNI
diff
to
cat
Pelv
is/G
ynae
cent
r-3
6,9
cent
r-3
5,9
cent
r-3
7,9
cent
r-4
2,7
cent
r-4
9,4
cent
r-7
0lo
w d
ose
SD7,
5SD
8,9
SD10
,3SD
12,9
SD33
,6SD
37,2
(id: 1
701)
ant
-38,
6an
t-3
8,1
ant
-38
ant
-39,
7an
t-3
9,2
ant
-39
SD6,
5SD
7,7
SD7,
4SD
8,5
SD20
,8SD
26,4
post
-37,
1po
st-3
5,8
post
-36,
8po
st-4
5,7
post
-70,
4po
st-7
4,3
SD7,
1SD
8,3
SD9,
7SD
7,5
SD19
,5SD
26,7
LT-3
7,6
LT-3
6,6
LT-3
8,1
LT-4
1,9
LT-4
7,6
LT-8
1,7
SD5,
9SD
8,3
SD7,
9SD
9,6
SD24
SD31
,6RT
-38
RT-3
6,9
RT-3
8,9
RT-4
3,3
RT-7
7,6
RT-8
3,1
SD6,
7SD
8SD
7,9
SD11
SD19
,1SD
34
Prot
ocol
15.0
cmHU
SNR
UNI
diff
to
cat
20.0
cmHU
SNR
UNI
diff
to
cat
26.5
cmHU
SNR
UNI
diff
to
cat
36.5
cmHU
SNR
UNI
diff
to
cat
50.0
cmHU
SNR
UNI
diff
to
cat
50.0
cmHU
SNR
UNI
diff
to
cat
T SP
INE
cent
r-3
7,1
cent
r-3
6,5
cent
r-3
7,5
cent
r-4
4,7
cent
r-4
9,1
cent
r-6
8,4
(id: 1
801)
SD5,
8SD
6SD
5,3
SD8
SD29
,5SD
40,7
ant
-38,
5an
t-3
9an
t-3
7,8
ant
-37,
2an
t-4
7,3
ant
-39,
7SD
5SD
6,1
SD4,
1SD
6,7
SD20
,4SD
25,8
post
-37,
9po
st-3
6,2
post
-36,
5po
st-5
0,2
post
-67,
7po
st-6
7,8
SD5
SD4,
7SD
5,4
SD6,
1SD
17,7
SD28
,6LT
-38
LT-3
6,5
LT-3
7,9
LT-4
1,5
LT-7
0,3
LT-7
0,5
SD4,
8SD
5SD
6SD
5,6
SD22
,4SD
31,6
RT-3
8,2
RT-3
7,3
RT-3
8,4
RT-4
4RT
-54,
8RT
-78,
3SD
4,9
SD4,
9SD
5,7
SD7,
1SD
13,5
SD27
,6
1,9
44,1
43,5
1,5
1,7
4,9
1,7
-1,0
4,0
2,3
-0,4
5,9
4,9
5,2
4,3
5,7
4,6
1,5
38,4
35,7
1,9
2,8
2,6
2,4
4,1
3,7
2,1
-0,6
3,3
6,0
3,3
5,1
4,7
3,8
6,1
4,9
3,9
7,9
7,3
6,3
7,4
3,1
3,6
6,4
4,4
4,8
4,4
2,0
1,7
23,0
20,9
2,3
4,1
38,6
37,8
1,5
3,8
2,4
2,2
2,8
7,1
1,9
-0,2
5,6
13,0
10,9
9,2
5,6
6,8
8,2
6,7
6,2
6,4
1,4
7,8
7,6
-0,7
6,1
2,8
0,7
7,7
6,4
7,6
7,7
Tab
. 3a
The
Phi
lps
test
obj
ect
imag
es q
ualit
y an
alys
is r
esul
ts (e
xam
ple)
– A
CS
prot
ocol
s
Tab
. 3b
The
Phi
lps
test
obj
ect
imag
es q
ualit
y an
alys
is r
esul
ts (e
xam
ple)
– A
CS
prot
ocol
s
Inżynier i Fizyk Medyczny 2/2017 vol. 6 93
radiologia / radiologyartykuł naukowy / scientific paper
values were no changed between ACS and fixed mAs protocols.
The biggest differences were detected between UB and B filters
protocols (eg. teflon about 50HU, derlin about 45HU, acrylic –
about 25HU) and 2mm vs 3mm protocols (eg. teflon about 20HU).
The CATPHAN images were used to choose which protocols will
be scanned using the CIRS phantom to define a relation between
HU and mass densities for particular materials.
The Philips object images were analysed for the image quali-
ty parameters: uniformity, SD and quantity parameter: HU. The
aim of that evaluation was to confirm that AEC (ACS) system
compensates image quality for the range of the patient sizes
(tab.3a. and tab.3b.).
The AEC should compensate image quality (noise level) in the
images in relation to different object sizes. The Philips CT scanner
uses the reference images to set mAs required to keep a consisten-
cy of image quality. The reference phantoms sizes used to perform
the reference images are assigned to particular protocols (eg. 16
cm for brain/head protocols, 26-33 cm for torso protocols) and
determine the exposure conditions. The results obtained during
measurements showed a big variation of SD in relation to the test
object size. There was from about 2.5HU until about 45HU (15cm-
50cm object size) dependently on: type of protocol, filter, anatom-
ical region, reference image assigned to a protocol. Uniformity ob-
tained for the different the object sizes was from about 1.4% until
about 50% respectively for the smallest and biggest test object.
The results received were also significantly different for HU when
the biggest object (50 cm) was scanned using mAs mapping for
a whole Philips set and independently as a single test object. The
max difference was about 30 HU for the uniform object (expected
value of HU = -35HU). The worse result were received for the low-
er dose protocols. Clinically it means that for the different sizes of
patients image quality and noise contribution as well as quantity
parameters can be changed through the patient size.
The CIRS phantom was scanned using the protocols chosen
on the base the CATPHAN images. The results obtained during
testing showed a significant dispersion of the values and depen-
dence on the protocol setup, brain and torso protocols, filters
(UB and B), a place of the inserts in the CIRS phantom (the body
or head part of the phantom) and material density. The maxi-
mum differences were detected for the highest density mate-
rials: stainless steel 5918-7313 HU, titanium 5389-5989 HU, alu-
minum 1925-2038 HU. The variations of the HU values for the
materials simulated anatomical tissues were significantly lower,
eg.: high dense bone – 828-871 HU, low dense bone 173-205
HU, inhale lung - -776—802 HU. Al.l the chosen protocols were
scanned for the ACS protocols and the protocols with the fixed
mAs. The HU values obtained were not significantly different
between the AEC and fixed setups. (Fig.5., Fig.6.)
The average values were calculated for all the HU values of
each material, scanned protocols and two CT systems installed
in the RT department (tab.4.). There was a compromise between
setting a few (physical density)=f(HU) graphs in the TPS and
a risk of making significant error by a choice not appropriate
calibration versus setting the one graph and manage uncertain-
ties in calculated dose. It was also determined by the variations
in the HU values which were already detected for the different
material positions in the phantom, long term variation, internal
and functional uncertainty of the CT scanner system itself. The
end-to-end tests confirmed finally goodness of that approach.
As a digression – a change of the filter from UB to B for the
brain and head protocols was not possible for the Phulips scan-
ner because of the predefined presets limiting user setups. The
filter B is only possible to use for the torso protocols.. The at-
tempt of changing UB filter to B filter for the brain protocol de-
termined also changing the reference image resulted changing
the image quality and quantity parameters.
0,000
1,000
2,000
3,000
4,000
5,000
6,000
7,000
8,000
9,000
‐2000,00 0,00 2000,00 4000,00 6000,00 8000,00
ACS vs fixed brain ACS body
brains fixed body
brain ACS head
brain fixed head
brain ACS
brain fixed
abdo ACS body
abdo fixed body
abdo ACS head
abdo fixed head
abdo ACS
abdo fixed
0,000
1,000
2,000
3,000
4,000
5,000
6,000
7,000
8,000
9,000
0,00 2000,00 4000,00 6000,00 8000,00 10000,00
ACS vs fixed
Philips ACS
Philips fixed
TPS proposed firstly
Philips+Simenes final
Fig. 5 The CIRS phantom results for the chosen protocols
Fig. 6 The CIRS phantom results – average values - for all the chosen protocols
Conclusion
The ACS (AEC) system requires a very wide verification in rela-
tion to obtained image quality and quantity parameters before
signing off the CT scanner to clinic. It is very important in terms
of radiation therapy purposes and calculated dose during a plan-
ning process. The preformed tests showed that received results
were characterised by the significant variation dependently on
the different parameters/setting facilities/modalities used for
scanning and reconstruction.

vol. 6 2/2017 Inżynier i Fizyk Medyczny94
radiologia \ radiology artykuł naukowy \ scientific paper
Determining the average function (mass density vs HU) for
the different clinical protocols (scanning and reconstruction
conditions), used facilities and modalities, inserts settings in the
phantom, CT scanners was the most optimized solution. That
approach reduced the effect of the uncertainty of the TPS cali-
bration - (mass density) = f (HU). The CT system uses, for the dif-
ferent anatomical regions, various reconstruction algorithms,
scatter correction, internal filters to enhance image features so
the user has no influence on it. Additionally, the user settings
for the protocols are limited by the predefined setups for the
anatomical region. That solution has been verified during the
end-to-end tests. The results were obtained in the range of the
tolerance +/- 1.5% of the calculated dose compared to the mea-
sured dose.
References1. Report 05016, CT scanner automatic exposure control sys-
tems, MHRA, Feb 2005.2. Report 05016, Wide bore CT scanner comparison report ver-
sion 12, MHRA, Feb 2005.3. Comparative specifications, Wide bore CT scanners, Purchasing
and Supply Agency, CEP08029, March 2009. R.R. Liu, K.L. Prado, D. Cody: Optimal acquisition parameter selection for CT simulators in radiation oncology, J Appl Clin Med Phys., 9(4), 2008, 2878
4. http://www.ctug.org.uk/meet12-10-04/Optimisation%20of%20the%20Philips%20automatic%20exposure%20con-trol%20system.pdf
Tab. 4 The final calibration of the HU values vs physical densities introduced to TPS
DENSITYAV
BODY+HEAD ACS ALL PROTOCOLS
AVBODY+HEAD fixed ALL
PROTOCOLSAV ACS +1000
AVBODY+HEAD ACS ALL PROTOCOLS
PHILIPS+SIEMENS
0,200 -788,68 -789,63 211,32 182,710,500 -474,52 -474,83 525,49 506,240,960 -67,07 -67,12 932,93 929,680,990 -33,39 -33,91 966,61 966,111,000 -6,86 -5,47 993,14 996,761,060 32,76 31,65 1032,76 1037,571,070 46,43 46,54 1046,43 1052,371,160 197,12 197,14 1197,12 1220,281,530 846,90 846,88 1846,90 1911,291,820 1282,12 1283,56 2282,12 2365,372,697 1989,04 1995,75 2989,04 3111,517,737 6423,27 6439,85 7423,27 7423,274,345 5606,33 5640,20 6606,33 6606,33
reklama