the ability of a novel compound to enhance the …
TRANSCRIPT

THE ABILITY OF A NOVEL COMPOUND TO ENHANCE
THE EFFECT OF UREA ON NITROGEN DEFICIENT
TOMATOES
Hendri Pretorius

THE ABILITY OF A NOVEL COMPOUND TO ENHANCE THE EFFECT OF
UREA ON NITROGEN DEFICIENT TOMATOES
by
Hendri Pretorius
submitted in fulfillment of the requirements for the degree
MAGISTER SCIENTIAE
Department of Plant Sciences (Botany)
Faculty of Natural and Agricultural Sciences
University of the Free State
Bloemfontein
November 2009
Supervisor: Dr. G.P. Potgieter

I
TABLE OF CONTENTS
PAGE
ACKNOWLEDGEMENTS VI
LIST OF ABBREVIATIONS VII
LIST OF FIGURES XI
LIST OF TABLES XV
SUMMARY XVIII
OPSOMMING XIX
CHAPTER 1
INTRODUCTION 1
CHAPTER 2
LITERATURE REVIEW 3
2. TOMATOES 3
2.1 TOMATO PRODUCTION AND USES 3
2.2 THE PLANT 4
2.3 CULTIVARS 4
2.4 FLOWERING AND POLLINATION 5
2.5 TOMATO DISEASES 6
2.6 THE FRUIT 6
2.6.1 Fruit ripening and the role of ethylene 7
2.6.2 Fruit colour 8
2.6.3 Fruit ripening - softness, appearance and aroma 9
2.6.4 Fruit quality parameters 10
2.6.4.1 % Brix (Brix index) 10
2.6.4.2 Fruit Electrical conductivity 10
2.6.4.3 Fruit pH 11
2.6.4.4 Carbohydrates (Sugars) 12
II
PAGE
2.7 LYCOPENE 14
2.7.1 Lycopene structure and attributes 14
2.7.2 Lycopene synthesis 15
2.7.3 Role of Lycopene 19
2.7.3.1 Role of lycopene in the plant 19
2.7.3.2 Role of Lycopene in the human diet 20
2.7.3.2.1 Method of action in the human body 20
2.8 HYDROPONICS 22
2.8.1 Hydroponic systems 24
2.8.2 Support media 25
2.8.3 EC 27
2.8.4 pH 27
2.8.5 Hydroponics and tomatoes 28
2.8.5.1 Hydroponic requirements 28
2.8.5.2 Climatic requirements 29
2.8.5.2.1 Temperature 29
2.8.5.2.2 Relative Humidity 29
2.8.5.2.3 Light Intensity 30
2.8.5.3 Nutrient media and related parameters 30
2.8.5.4 Foliar fertilization 31
2.9 ESSENTIAL ELEMENTS 32
2.9.1 Non mineral elements 33
2.9.2 Mineral elements 33
2.9.2.1 Macro-nutrients, their related roles and deficiency symptoms 33
2.9.2.1.1 Nitrogen deficiencies 35
2.9.2.2 Micro-nutrients, their related roles and deficiency symptoms 36
2.9.3 Toxicity symptoms 38
2.9.4 Physiological Disorders 38

III
PAGE
2.10 NITROGEN 40
2.10.1 The role of nitrogen in the plant 40
2.10.1.1 Enzymes, proteins and amino acids 41
2.10.2 Sources of nitrogen 44
2.10.3 Nitrogen Metabolism 44
2.10.4 Mobility of nitrogen in the plant 45
2.10.5 Nitrogen in nutrient salts and fertilizers used in hydroponics 46
2.11 UREA 47
2.11.1 Foliar absorption and metabolism of urea 49
2.12 PLANT MEMBRANES 51
2.13 PHEROIDS 53
2.14 RATIONALE FOR THIS STUDY 54
CHAPTER 3
3.1 MATERIAL 55
3.2 METHODS 55
3.2.1 Cultivation 55
3.2.1.1 Hydroponic setup 55
3.2.1.2 Pruning and supporting 57
3.2.2. Greenhouse conditions 57
3.2.2.1. Temperature and Relative Humidity (% RH) 57
3.2.2.2. Light intensity 58
3.2.3. Nutrient medium 58
3.2.3.1 Nutrient composition 58
3.2.3.2. Replacement of nutrient media 60
3.2.3.3 Electrical Conductivity (EC) 60
3.2.3.4 pH 60
3.2.4. Treatments 60
3.2.5 Pest Control 61

IV
PAGE
3.2.6 Physical Parameters 62
3.2.6.1 Vegetative growth (plant height) 62
3.2.6.2 Generative development (bud, flower and fruit formation) 62
3.2.6.3 Yield (Fruit number, mass and size) 63
3.2.7 Quality Parameters 63
3.2.7.1 Extraction and determination of Protein Content of leaves 64
3.2.7.2 Leaf and fruit moisture content 65
3.2.7.3 Fruit pH, EC, % Brix 65
3.2.7.4 Lycopene 66
CHAPTER 4
RESULTS 68
4.1 GREENHOUSE CONDITIONS 68
4.2 HYDROPONIC SETUP 70
4.2.1 Electrical Conductivity (EC) of nutrient media 70
4.2.2 pH of nutrient media 73
4.2.3 Nutrient media consumed 75
4.3 VEGETATIVE DEVELOPMENT OF PLANTS GROWN
UNDER CONTROL AND NITROGEN DEFICIENT CONDITIONS 76
4.3.1 Plant Height 77
4.3.2 Initial protein content of leaves 80
4.4 GENERATIVE DEVELOPMENT 85
4.5 YIELD 88
4.5.1 Number, mass and size of fruit harvested 89
4.5.2 Market implication 96
4.6 YIELD QUALITY 99
4.6.1 pH, Electrical conductivity, % Brix and moisture content of fruit 99
4.6.2 Lycopene content of fruit 109

V
PAGE
CHAPTER 5
DISCUSSION 112
5.1 RATIONALE FOR THIS STUDY 112
5.2 PHYSICAL ENVIRONMENT OF CULTIVATION 115
5.3 PREVENTION OF THE REDUCING EFFECT OF NITROGEN
LIMIITNG CONDITIONS ON VEGETATIVE AND GENERATIVE
DEVELOPMENT IN TOMATOES 116
5.4 PREVENTION OF THE REDUCING EFFECT OF NITROGEN
LIMITING CONDITIONS ON YIELD 120
5.5 PREVENTION OF THE REDUCING EFFECT OF NITROGEN
LIMITING CONDITIONS ON FRUIT QUALITY 124
5.6 CONCLUDING REMARKS 131
CHAPTER 6
REFERENCES 135

VI
ACKNOWLEDGEMENTS
I would like to thank the following persons who made it possible for me to complete
this study:
I would like to thank Dr. G.P. Potgieter, of the Department of Plant Sciences, for his
valuable advice and supervision. His enthusiasm and constructive comments made
a real learning experience of the study.
I am indebted by the company, Elementol (Pty) Ltd, for giving me the opportunity to
study and investigate their novel compound, Pheroids.
I would like to acknowledge the University of the Free State for providing me with
financial support.
My sincere appreciation goes to my wife who made it possible for me to study by
providing me with loving and moral support.
I am greatly indebted to my parents for enabling me to study and for their moral
support and keen interest in my study.
I would also like to thank my friends and colleagues for their support and assistance.
Last but not least, I humbly thank the Lord for guidance, insight and determination.
Without Him, nothing is possible.

VII
LIST OF ABBREVIATIONS
This list of abbreviations does not include the accepted SI units and abbreviations or
accepted abbreviations utilized for common language use. Symbols used to
illustrate mathematical manipulations in the text are also included.
A503 absorbane at 503 nm
Ala alanine
Arg arganine
Asn asparagine
Asp asparganine
ATP adenosine triphosphate
B Boron
BHT Butylated Hydroxytoluene
C carbon
C5 carbon 5
Ca calcium
Ca2+ calcium cation
CaCl2 calcium Chloride
Ca(NO3)2 calcium nitrate
Cl chloride
Cl- chloride cation
CO2 carbon dioxide
CO(NH2)2 urea
COOH carboxyl group
Cu copper
Cu+ copper (I) cation
Cu2+ copper (II) cation
cv cultivar
Cys cysteine
DMAPP dimethylallyl diphosphate
DNA deoxyribonucleic acid

VIII
DOXP 1-deoxy-D-xylose-5-phosphate
EC electrical conductivity
EDTA ethylenediaminetetraacetic acid
ER endoplastic reticulim
Fe iron
Fe2+ ferrous cation (Iron (II) cation)
Fe3+ ferric cation (Iron (III) cation)
GA-3-P D-glyceraldehyde-3-phosphate
GDH glutamate dehydrogenase
Glu glutamate
Gln glutamine
Gly glycine
GOGAT glutamine-2-oxyglutarate amino transferase
GS glutamate synthase
H hydrogen
H+ hydrogen cation
H2O water
H2PO4- dihydrogen phosphate anion
H3BO3 boric acid
ha-1 hectare
His histadine
HPO42- monohydrogen phosphate anion
HMG-CoA 3-hydroxy-3-methylglutaryl co-enzyme A
Ile isoleucine
Leu leucine
IPI isopentenyl diphosphate isomerase
IPP isopentenyl diphosphate pathway
K potassium
K+ potassium cation
KNO3 potassium nitrate
Lys lysine
m:v mass volume ratio

IX
m/v mass per volume
M molar
Met methionine
Mg magnesium
Mg2+ magnesium cation
mM milli molar
Mn manganese
Mn2+ manganese cation
Mo molebdenium
MoO42- molybdate anion
MVA mevalonic acid pathway
mw molecular weight
N2 nitrogen (gas)
Na(NO3)2 sodium nitrate
NADPH nicotinamide adenosine dinucleotide phosphate (reduced)
NADP nicotinamide adenosine dinucleotide phosphate (oxidized)
NH2 amino group
NH4NO3 ammonium nitrate
NH4SO4 ammonium sulphate
Ni nickel
Ni2+ nickel cation
NFT nutrient film technique
NH4+ ammonium cation
NO2- nitrile anion
NO3- nitrate anion
O2 oxygen
OH hydroxide
OH- hydroxyl cation
P phosphorous
P53 tumor protein 53
Phe phenylalanine
PMSF phenyl methylsulfonyl fluoride

X
ppm parts per million
Pro proline
PVC polyvinyl chloride
Rb retinoblastoma protein
RH relative humidity
RNA ribonucleic acid
ROS reactive oxygen species
S sulphur
Ser serine
SO42- sulphur-oxide anion
Std standard
TCA tricarboxyl cycle
Thr threonine
TiP’s trans intrinsic proteins
Tris-HCl tris hydrochloric acid buffer
Trp tryptophan
TSS total soluble solids
Tyr tyrosine
UV ultra violet
Val valine
w/v weight per volume
Zn zinc
Zn2+ zinc cation

XI
LIST OF FIGURES
PAGE
Figure 2.1 Bilocular tomato showing two locules separated by the
pericarp which houses the placenta and locular tissue.
7
Figure 2.2 Lycopene structure indicating 13 double bonds of which 11
are conjugated and two are un-conjugated (Internet 3).
15
Figure 2.3 Isoprenoid (terpenoid) synthetic pathways (DOXP Pathway
and MVA Pathway) localized to the cytosol and chloroplast
(Laule et al., 2003).
18
Figure 2.4 Amino acid. R indicates a remainder of the molecule. This is
different for each amino acid. The –NH2 is the amino group
and the –COOH is the carboxyl group (Redrawn from
Salisbury & Ross, 1991).
41
Figure 2.5 Transport of urea into plant cells (through high affinity urea/H+
peripheral symporter protein). AtDUR3 is the gene encoding
for high affinity urea/H+ peripheral symporter protein in
Arabidopsis (Lui et al., 2003). (C = chloroplast, M =
mitochondria, ER = endoplasmic reticulum, P = protein, TIP’s
= tonoplast intrinsic proteins or aquaporins).
49
Figure 2.6 A simplified Fluid Mosaic membrane. The lipid like inner part
(blue) indicates a hydrophobic region whereas the outer part
(green) indicates a hydrophilic region (Brock, 2003).
51

XII
Figure 2.7 The phospholipids accompanied by membrane associated
proteins, glycoproteins and glycolipids (Singer & Nicolson,
1972; Brock, 2003).
52
Figure 2.8 The three different types of transport events (Brock, 2003).
53
Figure 3.1 Experimental layout. Setup 1, 2 and 3 were nitrogen limiting
whereas setup 4 was supplied with an adequate
concentration of nitrogen (control).
56
Figure 4.1 Changes in light Intensity (A), Temperature (B) and Relative
Humidity (C) in the greenhouse during the duration of the trial
period.
DAT = Days after transplantation.
69
Figure 4.2 Fluctuations in Electrical conductivity (EC) over the trial
period. A = Control; B – D = Nitrogen limiting media in three
different reservoirs. Arrows ( ) indicate time of complete
nutrient replacement. WAT = Weeks after transplantation.
71
Figure 4.3 Average EC of control- (A) and nitrogen limiting media (B)
before and after complete replacement at weeks 7, 13, 22,
27, 36 and 41 after transplantation.
72
Figure 4.4 Variation in the pH of after replenishment and complete
replacement. (A = Control; B – D = Nitrogen limiting media.
Arrows ( ) indicate the time of complete nutrient
replacement).
WAT = Weeks after transplantation.
73

XIII
Figure 4.5 Average pH of the control- (A) and nitrogen limiting media (B)
directly before and after replacement at weeks 7, 13, 22, 27,
36 and 41 after transplantation.
74
Figure 4.6 Nutrient consumption by control – and nitrogen deficient
plants during the trial. WAT = Weeks after transplantation.
76
Figure 4.7 Changes in plant height over the experimental period. The
arrows indicate when generative development and
subsequent harvest period occur, as shown in Table 4.2.
WAT = Weeks after transplantation.
78
Figure 4.8 Average height of plants during early development (A: week
5) and the start of the harvest period (B: week 15).
79
Figure 4.9 Protein content of top and bottom leaves early in vegetative
development. WAT = Weeks after transplantation.
81
Figure 4.10 Average weekly number of fruit harvested (A & B), fruit mass
(C & D) and fruit size (E & F) over a trial period of 25 weeks.
89
Figure 4.11 Accumulated yield for mass (A & C) and number (B & D) of
fruit harvested over a period of 25 weeks.
WOH = Weeks of harvest.
92
Figure 4.12 Changes in fruit pH (A & B), EC (C & D) and % Brix (E & F)
between the different treatments for the duration of the
harvest period.
100

XIV
Figure 4.13 Average pH (A), EC (B) and % Brix (C) for fruits harvested
over the harvest period of 16 weeks.
102
Figure 4.14 Changes in the fresh mass (A & B), dry mass (C & D) and
moisture content (E & F) of the fruit and the dry fresh to dry
mass ratio (Fm:Dm) (G & H) over a harvest period of 16
weeks.
105
Figure 4.15 Differences in average fruit fresh mass (A), dry mass (B),
moisture content (C) and Fm:Dm (D) after the first 16 weeks
of harvest.
107
Figure 4.16 Changes in lycopene content of the fruit over a harvest period
of 16 weeks.
110
Figure 4.17 Average lycopene content for fruits from the different
treatments over a harvest period of 16 weeks.
111

XV
LIST OF TABLES
PAGE
Table 2.1 Elements needed in a typical hydroponic nutrient solution.
Macro- and micro mineral elements concentrations are
based on the quantities needed.
31
Table 2.2 The available forms, role and estimated critical
concentrations of macro elements and deficiency symptoms
in tomatoes.
34
Table 2.3 Available forms, role and estimated critical concentrations of
micro elements and deficiency symptoms in tomatoes.
37
Table 2.4 Abiotic induced physiological disorders in tomato fruit, visual
effects and possible causes of the related symptoms.
39
Table 2.5 Nitrogen content of different amino acids.
43
Table 3.1 Nutrient concentrations in the nitrogen adequate and
deficient media.
59
Table 3.2 Foliar applications of urea solutions, singly or mixed with
Pheroids, to tomato plants grown under nitrogen adequate-
and nitrogen limiting hydroponic conditions.
61
Table 3.3 Insecticides used to control diseases.
62
Table 3.4 Preparation of a micro-plate for protein assays. Gamma
globulin (0.5 mg.ml-1) was used as standard.
64

XVI
Table 4.1 A comparison in leaf protein content for top- and bottom
leaves for the different treatments from transplantation
(week 0) to week 8.
83
Table 4.2 Generative development as influenced by a nitrogen
deficiency and the addition of extra nitrogen through urea and
Pheroids foliar applications.
85
Table 4.3 Time gain and loss when control- and nitrogen deficient
plants were sprayed with 0.5% and 1% urea solutions,
singly or mixed with Pheroids.
88
Table 4.4 Average fruit number, mass, size and yield after 25 weeks
of harvest.
94
Table 4.5 The effect of a nitrogen deficiency and the subsequent
corrective treatments on yield and gross income over a
harvest period of 25 weeks.
98

XVII
SUMMARY
Key words: Elementol, Pheroids, Lycopersicon esculentum, hydroponics, nitrogen
deficiency, urea, yield
A company, Elementol (Pty) Ltd, requested the evaluation of their novel product,
Pheroids. Pheroids can apparently facilitate the transport of phytological beneficial
substances over membranes. Information regarding the chemical attributes was
withheld as patent registration is still pending. Pheroids is apparently a micro-
emulsion containing free fatty acids (FFA’s) and or fatty acid derivatives. It
apparently encapsulates a substance and facilitates its transport over the
membrane. The exact mechanism involving encapsulation, transport and release of
the substances inside the cells is still vague due to little information available on it.
The aim of this study was to evaluate the ability of Pheroids to facilitate the transport
of additional nitrogen, urea in this case, in tomatoes grown under nitrogen limiting
conditions. Tomatoes (Lycopersicon esculentum cv. Rodade Star) were cultivated in
a greenhouse using a circulating ebb and flow hydroponic setup, which supplied the
plants with either a control- or nitrogen limiting nutrient solutions. The plants
cultivated in the nitrogen limiting conditions showed a remarkable reduction in
vegetative development and yield. To alleviate the effect of nitrogen limiting
conditions on yield, the plants were foliarly sprayed with 0.5% and 1% urea
solutions, singly or mixed with Pheroids, once every two weeks. The purpose of
these foliar treatments was to determine whether Pheroids can further enhance the
absorption and transport of urea across membranes of the leaves to alleviate the
effect of limiting nitrogen supply. Plants grown under nitrogen adequate conditions
(control) were also foliarly treated with a 0.5% urea solution, singly and mixed with
Pheroids, to determine to which extent control plants react to the additional nitrogen
supplied.

XVIII
The reduction in yield, as a result of limited nitrogen supply, was partially alleviated
by spraying nitrogen deficient plants with the 0.5% and 1% urea solutions. However,
mixing the 0.5% and 1% urea solutions with Pheroids, not only improved vegetative
growth and generative development, but also improved yield, suggesting that
Pheroids indeed has the ability to improve the uptake of urea. The 0.5% urea /
Pheroids solution specifically proved to have the best ability in alleviating the effect
of nitrogen limiting conditions on yield without compromising fruit quality. Although
the reducing effect was not completely alleviated, the yield and loss in income as a
result of nitrogen limiting conditions was prevented to a large extent.
Spraying control plants with 0.5% urea, singly or mixed with Pheroids, also improved
yield, without compromising fruit quality. In addition, Pheroids itself, without mixing it
with any substance, also resulted in increased yields in both control- and plants
grown under nitrogen limiting conditions.
In summary, it appeared that Pheroids has the ability to facilitate the transport of
phytological beneficial substances, in this case urea, over plant membranes and
enhances cellular nitrogen content, but this needs further detailed analyses. This
phenomenon was more evident in plants grown under nitrogen limiting conditions
than in plants grown under control conditions. Taking into consideration that most
crops frequently may suffer from nitrogen limiting conditions in standard agricultural
practices, Pheroids may have numerous potential applications in the agricultural
industry.

XIX
OPSOMMING
Sleutelwoorde: Elementol, Pheroids, Lycopersicon esculentum, hidroponika,
stikstofbeperking, ureum, oesopbrengs
‘n Maatskappy, Elementol (Edms) Bpk, het die evaluering van hul produk “Pheroids”
aangevra. Pheroids beskik vermoedelik oor die eïenskap om die vervoer van
fitologiese voordelige verbindings oor membrane te fasiliteer. Inligting rakend die
chemiese eïenskappe van Pheroids was weerhou aangesien patentregistrasie nog
hangende was. Pheroids is vermoedelik ‘n mikro-emulsie bestaande uit vry vetsure
en afgeleide vetsure. Pheroids “verpak” die verbindings waarna hierdie Pheroids /
verbindingskompleks deur die membraan beweeg. Die presiese meganisme rakend
“verpakking”, vervoer en vrystelling van verbindings in die sel is onduidelik, as
gevolg van die beperkte inligting bekend oor die werking en samestelling van
Pheroids.
Die doel van die studie was om die vermoë van Pheroids te ondersoek om die
opname van voordelige verbindings, in dié geval ureum, in tamaties te verhoog deur
dit onder stikstofbeperkende toestande te verbou. Tamaties (Lycopersicon
esculentum cv. Rodade Star) was in ‘n kweekhuis verbou met behulp van ‘n
sirkulerende “ebb and flow” hidroponiese stelsel. Die stelsel het die plante van
kontrole- en stikstofbeperkende groeimedia voorsien. Die plante wat onder
stikstofbeperkende toestande verbou was, het ‘n sigbare verlaging in oesopbrengs
getoon. Om die negatiewe invloed wat stikstofbeperkende toestande op
oesopbrengs het te oorkom, is die plante elke twee weke met 0.5% en 1% ureum
oplossings, alleen of vermeng met Pheroids, bespuit.

XX
Die doel van hierdie blaarbespuitings was om vas te stel of Pheroids die opname
van ureum bevorder en sodoende die invloed van stikstofbeperkende toestande op
groei en oesopbrengs te beperk. Kontrole-plante was ook met ‘n 0.5% ureum
oplossing, alleen of met Pheroids vermeng, bespuit. Dit was gedoen om vas te stel
of kontrole-plante ook op die addisionele stikstoftoedienings reageer.
Die afname in oesopbrengs, as gevolg van stikstofbeperkende toestande, is
gedeeltelik opgehef wanneer plante met die 0.5% en 1% ureum oplossings bespuit
word. Deur die 0.5% en 1% ureum oplossings met Pheroids te vermeng, kon die
effek van stikstofbeperkende toestande op vegetatiewe groei, generatiewe
ontwikkeling en oesopbrengs verder opgehef word. Dit dui daarop dat Peroids wel
oor die vermoë beskik om ureumopname te verhoog. Die 0.5% ureum / Pheroids
mengsel was die mees suksesvolle behandeling om die invloed van lae
stikstofvlakke op groei en ontwikkeling te beperk. Alhoewel die negatiewe invloed
nie ten volle opgehef kon word nie, was die verlies in oesopbrengs en
gepaardgaande inkomste wel tot ‘n groot mate beperk.
Kontrole-plante wat met 0.5% ureum, alleen of met Pheroids vermeng, bespuit is het
ook positief op die bespuitings gereageer deur ‘n hoër oesopbrengs te lewer.
Pheroids alleen as behandeling het ook ‘n toename in oesoprengs tot gevolg gehad
by die plante wat onder stikstofbeperkende toestande verbou was.
Dit blyk dus dat Pheroids wel die potensiaal besit om verbindings soos ureum se
vervoer oor plantmembrane te fasiliteer, om sodoende waarskynlik die sellulêre
stikstofvlakke te verhoog. Hierdie verskynsel benodig egter nog verdere ondersoek.
Die invloed van Pheroids was egter meer opvallend by die plante wat onder
stikstofbeperkende toestande verbou was. As daar in ag geneem word dat die
meeste gewasse van tyd tot tyd stikstofbeperkende toestande ervaar, blyk dit dat
Pheroids groot toepassingspotensiaal in die landboukundige industrie mag hê.

1
CHAPTER 1
INTRODUCTION
Plant growth and development involves a number of complex interactions
between the plant and the environment. Nitrogen is the most abundant element
in the atmosphere. Nitrogen is a critical component of all proteins which regulates
plant metabolism and growth and plays an important role in forming compounds
that is vital for plant metabolism and growth. Nitrogen is also an integral part of
the chlorophyll molecule, which plays an important role during photosynthesis.
(Salisbury & Ross, 1991; Layzell, 1990). Nitrogen is found in the environment in
the following forms: N2 (nitrogen gas or di-nitrogen), NO (nitric oxide), NO2
(nitrogen dioxide), N2O (nitrous oxide), NO2- (nitrite ion), NO3
- (nitrate ion), NH3
(ammonia), NH4+ (ammonium ion) and R-NH2 (organic nitrogen including amino
acids, proteins, alkaloid bases and urea).
Plants absorb nitrogen as NO3- or NH4
+ (Layzell, 1990). Most soil nitrogen is in
organic form and must first be oxidized by soil organisms into inorganic forms in
order for plants to absorb the nitrogen (Salisbury & Ross, 1991). This is a
complex interaction between plants and microorganisms (Verma et al., 1986).
Crop plants require large concentrations of nitrogen for growth and it frequently
may become a limiting nutrient. Losses of nitrogen from the soil may result in low
yields (Layzell, 1990).
To alleviate the losses of nitrogen, due to leaching and high absorption rates,
urea is commonly used to supply additional nitrogen to crop plants, mostly in the
form of a foliar spray. Several benefits have been identified in supplying crops
with urea through their foliage (Gooding et al., 1992). After urea is absorbed it is
transported with the transpiration stream (Kirkby & Mengel, 1967). Galluci et al.
(1971) suggested that urea can easily cross biological membranes without
requiring protein-mediated transport, because it is an uncharged molecule

2
(Salisbury & Ross, 1991). However, plants also absorb urea actively by H+-urea
co-transporter proteins. (Liu et al., 2003). Most plants absorb foliarly applied urea
rapidly (Wittwer et al., 1963; Nicoulaud & Bloom, 1996) and hydrolyze the urea in
the cytosol where it is further metabolized. However, when urea is applied as a
foliar spray, urea may only be absorbed in low concentrations because not all
urea is transported into the leaves by the transport proteins. These proteins may
become saturated with urea, temperature may play a role or the urea mixture
may evaporate from the leaf surface. All these factors may limit urea absorption
(Liu et al., 2003). Thus, an attempt has to be made to improve or enhance the
absorption of urea in tomato leaves.
A company, Elementol (Pty) Ltd, is in the process of registering a novel
compound under the name of Pheroids. Elementol (Pty) Ltd, disclosed very little
information regarding the chemical attributes of Pheroids. Pheroids is apparently
a micro-emulsion containing free fatty acids (FFA’s) and / or fatty acid
derivatives. Elementol (Pty) Ltd, propose that Pheroids is a vehicle for the
delivery and translocation of phytologically beneficial substances over
membranes. Elementol (Pty) Ltd. further propose that Pheroids itself has a
stimulatory effect on plants. However, this has not been proven. Elementol (Pty)
Ltd, therefore, requested the evaluation of Pheroids as a growth promoting
substance as well as its ability to enhance the transport of beneficial substances
over membranes.
The rationale for this study was to evaluate the ability of Pheroids to facilitate the
additional uptake of urea in tomatoes grown hydroponically under nitrogen
limiting conditions. The plants were sprayed with 0.5% and 1% urea solutions,
singly and mixed (“packed) with Pheroids. This was done in an attempt to reduce
the effect of nitrogen limiting conditions on vegetative growth and subsequent
yield by enhancing the uptake of urea through the action of Pheroids. Another
aim was to determine whether Pheroids itself can be promoted as a bio-
stimulant. Hydroponics is an ideal technique to address this as nutrient supply to
the plants can be accurately controlled.

3
CHAPTER 2
LITERATURE REVIEW
2. TOMATOES
Lycopersicon esculentum Miller. (Solanaceae).
2.1 TOMATO PRODUCTION AND USES
Tomatoes are one of the most important crops worldwide and the second most
important crop in economic value, with an annual production of 40 million tons
worldwide (Internet 1) in 2008. Taking tomato fruit and the processing of
tomatoes into account, tomato is the second most popular vegetable per capita
used in the United States (USDA, 2000). Tomatoes are consumed fresh or is
used in various processed foods. More than 65% of the world tomato production
is processed and used as flavourings, sauces, etc. Quality attributes of tomatoes
vary depending on their intended use e.g. smaller fruit would be processed
whereas larger fruit would be sold on the fresh market (Schuch & Bird, 1994).
The market value of tomatoes are determined by fruit quality which includes size,
shape, firmness, colour, taste and solids content. Market demand varies,
particularly for fresh market tomatoes. While fruit quality has been improved by
genetic manipulation and breeding, fruit quantity has particularly been improved
by propagation using hydroponics (Ho & Hewitt, 1986).
Tomatoes are consumed fresh or in salads etc. Tomatoes have also been used
in the making of soups, drinkable juices, tomato sauces and tomato pastes etc.
Due to tomato fruit containing high levels of lycopene, dietary intake of tomatoes
and tomato products has been shown to decrease the risk of chronic diseases
like cancer and cardiovascular diseases (La Vecchia, 2002; Rao, 2002). Tablets
and juices with high lycopene content are manufactured and sold as a daily

4
antioxidant supplement. These tablets and juices may also contain natural or
synthetic lycopene products (Internet 3).
2.2 THE PLANT
Tomatoes have two growth tendencies, namely indeterminate and determinate
growth characteristics. Although a distinguishment is made between these two
growth patterns, both are actually determinate growers. Determinate growers
may grow to a height of 2 m, are erect and have a restricted flowering and fruiting
period. These determinate growers are best suited for field conditions, however,
it can be grown in greenhouses with great ease. The indeterminate cultivars,
however, are characterized by the main stem which grows upward indefinitely
reaching more than 10 m per year. When the stem reaches the desired height,
the stem is redirected which allows an indefinite growth tendency. These
cultivars are ideally suited for greenhouse cultivation as well as hydroponic
production and guarantees continued flowering and fruiting.
A detailed description of the growth, anatomy and histogenesis of the tomato is
given by Hayward (1938). Leaves are arranged alternately with a 2/5 phyllotaxy.
Leaf size is variable (Aung & Austin, 1971). Leaves lower in the stem may be
small with few leaflets. Thereafter, leaves are typically 0.5 m long with a large
terminal leaflet with up to eight lateral leaflets which may be compounded.
Leaflets are usually petiolate and irregularly lobed with toothed edges. Tomatoes
have a taproot system which can extend up to 1.5 m into the soil, but is often
limited in hydroponic production (Hayward, 1938).
2.3 CULTIVARS
While field and greenhouse tomatoes share many characteristics, several
requirements are specific for greenhouse production. A large number of tomato
cultivars are available depending on the grower or consumer requirements. They
are divided into cultivars specific for yield, resistance to specific diseases, fruit

5
type and size and whether the fruit will be used for processing or the fresh
market (Ho & Hewitt, 1986). Some popular cultivars in South Africa include
Floradade, Heinz 1370, Homestead, Manapal and Moneymaker (Gilbert &
Hadfield, 1987). It must be kept in mind that each cultivar have different
requirements and different yields, but some cultivars are great all-round cultivars
with a high yield and good fruit quality, are easily managed and are suitable for
greenhouse hydroponic production.
2.4 FLOWERING AND POLLINATION
Development of flowers is a prerequisite for the development of fruits as a result
of pollination. Any factor preventing pollination will result in less fruit forming.
Furthermore, any delay in flowering will cause a delay in subsequent fruit
development. More flowers from more frequent flowering does not necessarily
yield more fruit, but rather increases the potential for competition between fruit
which may causes a reduction in fruit size (van Ravestijn & Molhoek, 1978). In
both determinate and indeterminate growers, fruit production may be limited by
the lack of pollination.
Several pollination related problems may be experienced when tomatoes are
grown in a greenhouse. Fertilization of the ovules is very important with regard to
the growth of seeded tomato fruit. Fruit weight is related to seed number, as a
result of successful pollination and fertilization and fruit size is positively
correlated with seed number (Rylski, 1979). All current tomato cultivars are self
pollinated (Smith, 1935). Any factor influencing pollen production, pollen transfer,
pollen germination and fertilization will result in no fruit being formed. Factors
influencing the above mentioned include temperature, nutrient deficiencies,
nutrient toxicities, relative humidity, absence of a draft inside the greenhouse and
the absence of pollinators in cultivars which are not self pollinating (Rudich et al.,
1977, Internet 2).

6
2.5 TOMATO DISEASES
Hydroponic production of crops results in a physical environment which is
favorable for pathogens. Ideal temperatures, high humidity and the supply of
enriched nutrient solutions can be not only favorable, but ideal for pathogen
development (Gullino & Garibaldi, 1994; Paulitz, 1997; Paulitz & Bélanger, 2001;
van Assche & Vangheel, 1994). Biotic diseases of tomatoes favored by these
ideal conditions include insects like cutworm, whitefly, erinose, tomato rust mite,
white mite, red spider mite, nematodes and tomato russet mite, where the latter
cause irreversible wilting of plants followed by chlorosis (yellowing of leaves),
and finally necrosis (dying of leaves). Unfortunately, these organisms are often
noticed only in a fairly colonized state. Other biotic organisms causing diseases
include late rust, early rust, septoria leaf spot, Fusarium wilting, bacterial wilt and
bacterial cancers.
2.6 THE FRUIT
A tomato fruit is a berry consisting of seeds within a fleshy pericarp developed
from the ovary of the flower. The fruit is composed of flesh (pericarp walls and
skin) and pulp (placenta and locular tissue including seeds). In general the pulp
accounts for less than one third of the fruit fresh weight. Two types of fruits are
distinguished, namely bilocular and multilocular fruits. Bilocular fruit have two
locular cavities which contains the seeds (Fig. 2.1), whereas the multilocular fruit
contains more than tow locular cavities. The locular cavities are separated by the
columella or the inner wall of the pericarp.
7
Epidermis ________________
_______________________Seed
Outer wall of pericarp ______________ ____________________________________Radial wall of pericarp
Loclar cavity with seeds ______________________ ___________________________________Columella (Inner pericarp wall)
Placental tissue _____________________________
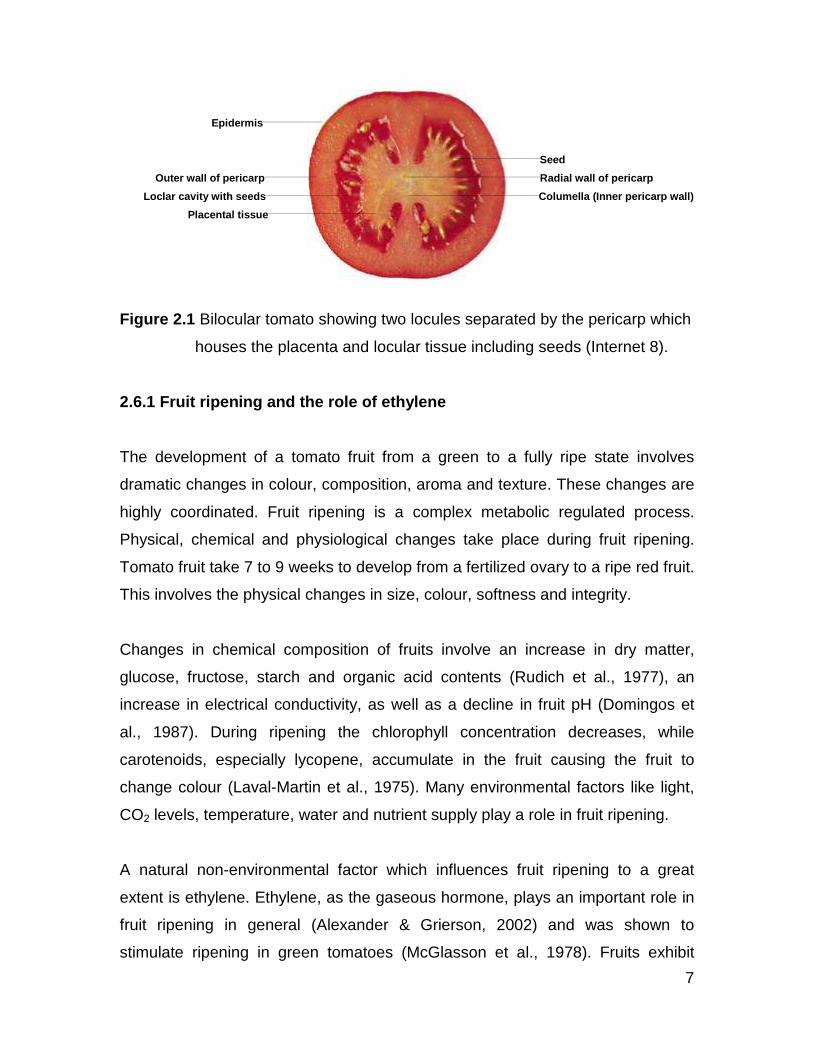
Figure 2.1 Bilocular tomato showing two locules separated by the pericarp which
houses the placenta and locular tissue including seeds (Internet 8).
2.6.1 Fruit ripening and the role of ethylene
The development of a tomato fruit from a green to a fully ripe state involves
dramatic changes in colour, composition, aroma and texture. These changes are
highly coordinated. Fruit ripening is a complex metabolic regulated process.
Physical, chemical and physiological changes take place during fruit ripening.
Tomato fruit take 7 to 9 weeks to develop from a fertilized ovary to a ripe red fruit.
This involves the physical changes in size, colour, softness and integrity.
Changes in chemical composition of fruits involve an increase in dry matter,
glucose, fructose, starch and organic acid contents (Rudich et al., 1977), an
increase in electrical conductivity, as well as a decline in fruit pH (Domingos et
al., 1987). During ripening the chlorophyll concentration decreases, while
carotenoids, especially lycopene, accumulate in the fruit causing the fruit to
change colour (Laval-Martin et al., 1975). Many environmental factors like light,
CO2 levels, temperature, water and nutrient supply play a role in fruit ripening.
A natural non-environmental factor which influences fruit ripening to a great
extent is ethylene. Ethylene, as the gaseous hormone, plays an important role in
fruit ripening in general (Alexander & Grierson, 2002) and was shown to
stimulate ripening in green tomatoes (McGlasson et al., 1978). Fruits exhibit

8
different ripening mechanisms and can be divided into two groups namely non-
climacteric and climacteric fruit, where ripening in the latter is accompanied by an
increase in respiration with a concomitant increase in ethylene production. In
non-climacteric fruit no increase in respiration occurs, while ethylene production
remains at a very low level. In tomato and other climacteric fruits, such as apple,
melon and banana, the ethylene burst is a prerequisite for normal fruit ripening
(Oeller et al., 1991).
The role of ethylene in climacteric fruit ripening is divided into two separate
stages of ethylene production. The first system is functional during normal
vegetative growth where ethylene is auto-inhibitory and controlled on gene level,
and is responsible for producing basal ethylene. The second system, however,
occurs during ripening usually in one region of a fruit, spreading to neighboring
regions as ethylene diffuses freely from cell to cell and initiates the ripening
process throughout the fruit. However, ethylene is not the sole initiator for fruit
ripening (Oeller et al., 1991). Gene expression and climatic factors may also play
a role.
2.6.2 Fruit colour
The development of a tomato fruit from a green to a fully ripe red state involves
dramatic changes in colour. These changes occur within the plastids after the
disappearance of chlorophyll from the fruit. These colour changes are highly
coordinated and is a regulated multi step process. The two major groups of
pigments found in tomato fruit are chlorophylls and carotenoids. The most
noticeable change during ripening is the remarkable increase in the carotenoid
content of the fruit (Laval-Martin et al., 1975). During ripening the chlorophyll
concentration decreases while carotenoids, especially lycopene, accumulate in
the fruit (Laval-Martin et al., 1975).
Tomato fruit follows a transition from partially photosynthetic to heterotrophic
metabolism during development by the parallel differentiation of chloroplasts into

9
chromoplasts and the dominance of carotenoids and lycopene during ripening.
(Fernando & Alisdair, 2006; Harris & Spurr, 1969).
2.6.3 Fruit ripening - softness, appearance and aro ma
The softening and decline in fruit firmness during ripening is generally reported to
result principally from disassembly of the primary cell wall and middle lamella.
This causes a reduction in intercellular adhesion depolymerization, and
solubilization of hemicellulosic and pectic cell wall polysaccharides and, in some
cases, wall swelling (Brummell & Harpster, 2001). The ripening of fleshy fruits
involves many physiological processes, including the production of aromatic
compounds and nutrients, changes in colour, and softening of the flesh to an
edible texture, which have evolved to attract animals to promote seed dispersal
(Giovannoni, 2004). However, much less is known about the critical molecular
components of fruit firmness and softening. In part, this reflects the difficulties in
evaluating the many physical and sensory characteristics that determine texture
(Harker et al., 1997; Waldron et al., 2003), a characteristic that, unlike colour or
aroma, cannot be defined by a quantitative measurement of specific metabolites
or by monitoring a particular biosynthetic pathway.
The softening and decline in fruit firmness are accompanied by the increased
expression of numerous cell wall degrading enzymes, including polysaccharide
hydrolases, transglycosylases, lyases, and other wall loosening proteins, such as
expansin (Harker et al., 1997; Rose et al., 2003; Brummell, 2006). It has been
reported that factors such as turgor and cell morphology contribute to aspects of
texture (Lin & Pitt, 1986; Shackel et al., 1991), and invariably attribute to fruit
softening and disassembly of polysaccharide networks in the primary wall and
middle lamella (Rose et al., 2003; Brummell, 2006). Tomato flavour is influenced
by sugars, acids and their interactions, which in turn is important in determining
overall fruit sweetness, sourness and flavour. More than 130 volatile compounds
are apparently responsible for overall fruit aroma (Kato et al., 1984).

10
2.6.4 Fruit quality parameters
Tomato quality and flavour are influenced by the aromas of many chemical
constituents. These include sugars (glucose, fructose, sucrose), alcohol insoluble
solids (proteins, pectic substances, hemicellulose, cellulose), organic acids (citric
and malic acid), minerals (mainly potassium, calcium, magnesium an
phosphorus), lipids, dicarboxylic amino acids, pigments, ascorbic acid, volatiles,
other amino acids, vitamins and polypehnols (Davies & Hobson, 1981). Sugars,
acids and their interactions are the most important factors influencing sweetness,
sourness and overall flavour (de Bruin et al., 1971). The quality of tomato fruit is
partially dependent on the flavour of the fruit. Factors affecting fruit flavour,
aroma, appearance etc. will ultimately influence fruit quality. It is of utmost
importance that in a good quality fruit, fruit taste must not be compromised.
2.6.4.1 % Brix (Brix index)
Total soluble solid concentration (TSS, measured as % Brix) of tomato fruits is an
important variable which is used to determine fruit quality, because TSS is most
commonly associated with sugar and organic acid concentrations (Stevens et al.,
1977; Young et al., 1993). The % Brix index includes all soluble solids like
sucrose, fructose, glucose, vitamins, amino acids, protein, organic acids,
minerals and hormones. Starch, pectic substances and cellulose are water
insoluble and do not contribute to the Brix index (Baxter et al., 2005). Each % of
Brix is equal to 1 gram of soluble solids in 100 g of fresh mass. A high Brix %
normally indicates high sugar content (Baxter et al., 2005).
2.6.4.2 Fruit electrical conductivity
Fruit electrical conductivity is an indication of the concentration of dissolved
solids present in the fruit. These dissolved solids include sugars (glucose,
fructose and sucrose), organic acids, and other soluble cellular constituents like
amino acids. When these constituents are present within the fruit in larger

11
quantities, fruit puree has the ability to conduct electricity better than the puree of
fruit with a low number of these soluble solids. By measuring fruit conductivity
(milliSiemens.cm-1), the number of charged soluble solids can be determined.
Domingos et al. (1987) found that electrical conductivity increases during fruit
ripening, thus total soluble solids, which greatly influences fruit taste. Electrical
conductivity can be considered an important parameter in measuring fruit quality.
2.6.4.3 Fruit pH
Fruit pH plays an important role in fruit ripening and taste. As fruit ripening
persist, a slight decline in pH was observed by Domingos et al. (1987). Citric acid
seemed to be more important in fruit sourness than malic acid. Citric acid
apparently accounts for more than half the acidity of the fruit (Davies & Hobson,
1981). A high acid content is generally required for best flavour in tomato fruit.
The pericarp portion of tomato fruit contains low concentrations of organic acids
opposed to the locular portion of the fruit (Stevens et al., 1977).
Fruit pH and carbohydrate content are the main factors influencing fruit taste and
the interaction of these two factors influence fruit taste dramatically. An example
of this is the relationship or ratios between the different sugars and acids.
Fructose and citric acid are more important in fruit sweetness and sourness than
glucose and malic acid respectively (Davies & Hobson, 1981). A high sugar
content, as well as a high acid content is required for the best flavour. A high acid
and a low sugar content will produce a sharp-tasting tomato, whereas a high
sugar content and a low acid content will result in a fruit with a bland taste. When
sugar and acid contents are low, a tasteless fruit is normally the result.
Therefore, the carbohydrates (sugars) present in tomatoes need to be discussed.

12
2.6.4.4 Carbohydrates (Sugars)
Carbohydrates (sugars) have a major influence on tomato flavour. Sucrose,
glucose and fructose are the foremost carbohydrates, which accounts for 65% of
fruit dry weight. Winsor (1979) found that tomato fruits with a high hexose
accumulation being characteristic of the domesticated tomato. Together with
quinic-, malic- and citric acid, these compounds are also the principal quality
components for determining the total soluble solid content (TSS) or Brix index in
tomato fruit (Davies & Hobson, 1981). Two main factors influence the
carbohydrate content in fresh tomato fruits. These are 1) the environmental
conditions during development and ripening and 2) the cultivar (Luckwill, 1943).
Sugar content increases progressively during development and maturation of
tomato fruit (Winsor et al., 1962a; 1962b). Yelle et al. (1991) have reported that
sugars can contribute up to 60% of the total dry weight of a fruit.
Sucrose is the major photo-assimilate transported from the leaves (source) to the
tomato fruit (sink), where it is subsequently cleaved by sucrose synthase and
invertase. These enzymes are the main enzymes responsible for the degradation
of sucrose and greatly affect the levels of sucrose and overall fruit metabolism.
Invertase cleaves sucrose into glucose and fructose. Plant invertases are
separated into two groups on the basis of pH optima, namely acid and alkaline
invertases. While an alkaline invertase activity has not been reported in tomato
fruit, two types of acid invertases have been observed, namely a soluble and a
particulate form (Klann et al., 1996). According to Klann et al. (1996), plants with
a low invertase activity had increased sucrose concentrations in the fruits,
resulting in smaller fruits. This implies that small fruit may have a higher sucrose
content than larger fruit.
Early during tomato fruit development there is a transient increase in both
sucrose synthase activity and starch levels, which is correlated with fruit growth
and sink strength, suggesting a regulatory role for sucrose synthase in sugar
import. Plants with reduced sucrose synthase activity showed a reduction in fruit

13
size, which also correlates with a reduction in starch during the early stages of
the fruit development (Klann et al., 1996). High starch levels in turn are well
correlated with high levels of soluble solids in a number of tomato lines (Dinar &
Stevens, 1981; Sun et al., 1992), suggesting that sucrose synthase might have a
controlling role in loading assimilates into the fruit. It was found that sucrose
synthase activity is low in the first week after anthesis, reaching a peak early in
development and then subsequently decline as the fruit matures (Demnitz-King
et al., 1997; Schaffer & Petreikov, 1997; Yelle et al., 1988). The peak of sucrose
synthase activity occurs when import of sugar into the fruit switches from a
predominantly symplastic to an apoplastic mechanism (Patrick, 1997). The rate
of sucrose import into tomato fruit is further reported to be regulated by the
sucrose concentration gradient between the leaves and the fruits (Walker & Ho,
1977).
Fruit growth is thus mainly determined by the import of leaf assimilates. Most of
the fruit dry matter is apparently derived from leaf assimilates. The import rate of
assimilates like starch into tomato fruit is inversely related to the sucrose
concentration in the fruit. From this it seems that the import of starch is regulated
by sucrose hydrolysis (Walker et al., 1978). The rate of starch accumulation
during fruit development has a great effect on the final total soluble solid content.
Starch content reaches a maximum of 1% dry matter at the mature green state,
where after the starch content decreases. The decrease in starch is
accompanied by an accumulation of reducing sugars (Dinar & Stevens, 1981).

14
2.7 LYCOPENE
Tomatoes have a high nutritional value, and are important sources of vitamins A,
C, and especially lycopene. Lycopene is a very important nutritional source and
are of utmost importance in determining overall tomato quality.
The change in colour during ripening is due to differentiation of chloroplasts to
chromoplasts and the dominance of carotenoids like lycopene. Lycopene is
responsible for the red colour in tomato fruit (Bramley, 2000; Salunkhe et al.,
1974). Salunkhe et al. (1974) have found a correlation between the colour index
of tomato fruit and lycopene content, which implies that the most reddish fruit will
have the highest level of lycopene.
2.7.1 Lycopene structure and attributes
Lycopene is a carotenoid (Nguyen & Schwartz, 1999), a forty carbon molecule
and an acyclic isomer of β-carotene. It is a highly unsaturated aliphatic
hydrocarbon chain consisting of 13 carbon-carbon double bonds, one of which is
a conjugated bond and two which are un-conjugated double bonds (Bramley,
2000). The extended series of alternated double bonds and cyclic end groups are
the key to the biological activity of lycopene. These bonds are arranged in a
linear array. The molecule further consists of two central methyl groups arranged
in the 1,6-position relative to each other. Other methyl groups in the molecule are
in a 1,5 position relative to each other (Fig. 2.2).
Lycopene in plants primarily exists in an all-trans configuration, which is a
relatively stable form (Bramley, 2000). Lycopene undergoes cis-trans
isomerization induced by light (Nguyen & Schwartz, 1999; Xianquan et al., 2005).
Exposure to high temperatures, catalysts, active surfaces, oxygen, acids,
catalysts and metal ions can cause seven of the double bonds of lycopene to
isomerize to a less stable conformation (mono- poly- or cis- isomeration)

15
(Functional Foods, 1998). Thermodynamically, the all-trans configuration
corresponds to the most stable configuration (Functional Foods, 1998).
Figure 2.2 Lycopene structure indicating 13 double bonds of which 11 are
conjugated and two are un-conjugated (Internet 3).
2.7.2 Lycopene synthesis
Carotenoids are a group of isoprenoids (terpenoids) which exist in plastids.
Carotenoids are composed of five carbon building blocks, isoprene units that
serve as precursors for the synthesis of other carotenoids and isoprenoid
compounds. The isoprenoids, which constitute the most diverse group of natural
products, serve numerous biochemical functions in plants. They play important
roles as quinones in electron transport chains, as components of membranes
(sterols), in sub-cellular targeting and regulation (prenylation of proteins), as
photosynthetic pigments (carotenoids, side chain of chlorophyll), as hormones
(gibberellins, brassinosteroids, abscisic acid, cytokinins), as plant defense
compounds and as attractants for pollinators (monoterpenes, sesquiterpenes,
and diterpenes; Harborne, 1991). Isoprenoids (terpenoids) are synthesized
ubiquitously among prokaryotes and eukaryotes through condensation of the
five-carbon intermediates isopentenyl diphosphate (IPP) and dimethylallyl
diphosphate (DMAPP) (Lange et al., 2000).

16
Isopentenyl diphosphate (IPP) and dimethylallyl diphosphate (DMAPP) are
produced in two different localities (cytosol and chloroplasts) using two different
pathways.
The first pathway is the mevalonate (MVA) pathway in the cytosol and the
second pathway is the non-mevalonate or 1-deoxy-D-xylulose-5-phosphate
(DOXP) pathway in the chloroplast. Both pathways form the active C5-unit
isopentenyl diphosphate (IPP) as the precursor from which all other isoprenoids
are formed via head-to-tail addition (Figure 2.3). The difference between the
MVA and the DOXP pathways are the starting point of these pathways. The MVA
pathway forms IPP outside the chloroplast, where after the IPP is transported
into the chloroplast. The DOXP pathway forms IPP inside the chloroplast. IPP is
therefore the condensation point for these two pathways.
The MVA pathway in the cytosol begins with acetyl-CoA and proceeds via a
number of independent steps to form IPP, which is then reversibly converted to
DMAPP in a reaction catalyzed by IPP isomerase (IPI) in the chloroplast (Bach et
al., 1999). The MVA pathway also contributes to the biosynthesis of sterols,
sesquiterpenes, triterpenoids and ubiquinone (Laule et al., 2003).
The DOXP pathway involves the condensation of pyruvate and glyceraldehyde-
3-phosphate via 1-deoxy-D-xylulose 5-phosphate (in the chloroplast) as a first
intermediate, which is used for the synthesis of isoprene, carotenoids, abscisic
acid, and the side chains of chlorophylls and plastoquinone (Arigoni et al., 1997;
Lichtenhaler et al., 1997; Lichtenthaler, 1999; Schwender et al., 1997; Milborrow
& Lee, 1998; Hirai et al., 2000). The DOXP pathway in the chloroplast not only
produce lycopene but like the MVA pathway, provides precursors for the
biosynthesis of plastidic isoprenoids, such as carotenoids, phytol (a side-chain of
chlorophylls), plastoquinone-9, isoprene, mono-, and diterpenes.

17
Although this subcellular compartmentation allows both pathways to operate
independently in plants to form IPP in the chloroplast and cytosol, there is
evidence that they cooperate in the biosynthesis of certain metabolites. For
example, the chamomile sesquiterpenes are composed of two C5 isoprenoid
units formed via the MVA-dependent pathway, with a third unit being derived
from the MVA-independent pathway (Adam et al., 1999).
Environmental factors, cultivar type (Moraru et al., 2003) and the specific stage of
ripening (Ilahy & Hinder, 2007) all affect the level of lycopene in tomatoes
(Ramandeep & Savage, 2004). Lycopene content can vary considerably
depending on cultivar type resulting in some cultivars having higher lycopene
content than others (Moraru et al., 2003). A difference in lycopene content was
distinguished between field grown tomatoes and greenhouse tomatoes.
Depending on the quantity of light the fruit receives, lycopene content of field
grown fruit differ from 52 mg. kg-1 to 230 mg. kg-1 fresh mass, whereas
greenhouse grown tomatoes have lycopene contents of 10 mg. kg-1 to 108 mg.
kg-1 fresh mass (Sahlin et al., 2004). Bramley (2000) and Levy & Sharoni (2004)
recorded that the average lycopene content of tomatoes grown in greenhouses
to vary between 8.8 mg. kg-1 to 42.0 mg. kg-1 fresh mass.
Lycopene is an intermediate for the synthesis of other carotenoids like β-
carotene (Fig. 2.3). The cyclization of lycopene is a key branch point in the
pathway of carotenoid biosynthesis. Lycopene present in tomato fruit, (giving it a
red colour), will attract animals, which will help with the dispersal of fruit and
seed.

18
DOXP Pathway MVA Pathway Chloroplast
Cytosol
Glyceraldehyde Pyruvate
3-phosphate
Hydroxymethylbutenyl Acetyl-CoA
4-diphosphate
Dimethylallyl Isopentenyl Isopentenyl Dimethy lallyl
diphosphate diphosphate diphosphate dip hosphate
Isoprene Generyl Mono
Diphosphate terpines
Geranylgenyl Phytoene Sterols, sesquiterpenes
diphosphate triterpanoids, ubiqui none
Carotenes
Phytyl
diphosphate Lycopene
Carotenes
Tocopherols Carotenes
And β-carotene
Phylloquinine Lutein
Figure 2.3 Isoprenoid (terpenoid) synthetic pathways (DOXP Pathway and MVA
Pathway) localized to the cytosol and chloroplast (Laule et al., 2003).

19
2.7.3 Role of Lycopene
Lycopene plays a major role in plants in being an anti-oxidant and prevents
photosynthetic pigments to undergo photo-oxidation. Lycopene was also found to
be an effective anti-oxidant in the human body. The role of lycopene can be
divided into its role in plants, as well as the role of lycopene in the human diet.
2.7.3.1 Role of lycopene in the plant
Lycopene is one of the most important carotenoids present in tomatoes.
Lycopene is present in both the skin and the pericarp of tomato fruit. Lycopene,
with its cyclic end groups, is an essential photosynthetic component in all plants
and serves different functions (Goodwin, 1980). Certain metabolic activities
generate reactive oxygen species (ROS). These ROS react with cellular
components and cause oxidative damage to lipids, proteins and DNA. Lycopene
with its good anti-oxidant properties prevents these ROS to cause damage to
cellular constituents (Conn et al., 1991; Di Mascio et al., 1989; Rice-Evans et al.,
1997).
Carotenoids are essential components of the photosynthetic membranes
protecting chlorophyll against poto-oxidation and act as light absorbing pigments
(Salisbury & Ross, 1991). These pigments harvest light for photosynthesis, and
dissipate excess light energy absorbed by the antenna pigments. The chlorophyll
is protected against photo-oxidation by quenching triplet chlorophyll, superoxide
anion radicals and singlet oxygen (Agarwal & Roa, 1999). The quenching ability
of lycopene is determined by the number of conjugated double bonds, as well as
the end groups in the structure (Stahl & Sies, 1996).

20
2.7.3.2 Role of Lycopene in the human diet
The role of carotenoids, including lycopene, has received much attention in
recent years in the prevention of diseases (Halliwell et al., 1995; Sies & Stahl,
1995; Frei, 1994; Block, 1992; Steinmentz & Potter, 1996). Lycopene as an
antioxidant, make it one of the most important carotenoids for human health.
Lycopene can be obtained from a number of fruits like fresh tomato and tomato
products, pink grapefruit, watermelon and guava (Holden et al., 1999). When
absorbed in the stomach, lycopene is transported in the blood by various
lipoproteins and accumulates in the liver, adrenal glands and testes. Lycopene
can also be incorporated into lipid micelles in the small intestine. These micelles
are formed from dietary fats and bile acids, and help to make lycopene more
soluble and enable it to permeate into the intestinal mucosal cells by a passive
transport mechanism. Little is known about the liver metabolism of lycopene, but
like other carotenoids, lycopene is incorporated into chylomicrons and released
into the lymphatic system. In blood plasma, lycopene is eventually distributed into
the very low and low density lipoprotein fractions (Stahl & Sies, 1996).
2.7.3.2.1 Method of action in the human body
Intake of lycopene has been shown to be correlated to a decreased risk of
chronic diseases, like cancer and cardiovascular diseases (Rao & Agarwal,
2000), mostly caused by oxidative stress induced by reactive oxygen species
(ROS).
Metabolic activities inside the human body generate reactive oxygen species
(ROS). These ROS are highly reactive oxidant molecules and include
superoxide, hydrogen peroxide, and hydroxyl radicals, which can cause damage
to cellular constituents like lipids, proteins and DNA. Many forms of cancer are
thought to be the result of reactions between free radicals and DNA, resulting in
mutations that can adversely affect the cell cycle and potentially lead to
malignancy that is a normal response of the human body to infection and
damages to cell walls and DNA alterations (Princemail, 1995; Ames et al., 1995;

21
Witztum, 1994; Halliwell, 1994). Lycopene, as a natural anti-oxidant in the human
diet, can for example quench free radicals and reactive oxygen species,
significantly delay or prevent oxidative damage by free radicals (Conn et al.,
1991; Di Mascio et al., 1989; Rice-Evans et al., 1997) and lower the risk of heart
diseases (Kohlmeier et al., 1997; Rao, 2002) and cancers (Canene-Adams et al.,
2005; Dorgan et al., 1998; Giovannucci et al., 1995).
In humans, the two mechanisms in which lycopene can be effectual is derived
from the type of disease it prevents and can either be anti-carcinogenic or anti-
atherogenic. These are also known as non-oxidative and oxidative mechanisms.
Lycopene is hypothesized to suppress carcinogen-induced phosphorylation of
regulatory proteins such as tumor protein 53 (P53) and retinoblastoma proetin
(Rb) anti-oncogenes and stop cell division at the G0-G1 cell cycle phase, which
then inhibits cancerous growth (Matsushima et al., 1995). Astorg et al. (1997)
proposed that lycopene-induced modulation of the liver metabolizing enzyme,
cytochrome P450 2E1 (involved in the metabolism of xenobiotics) was the
underlying mechanism of protection against carcinogen-induced pre-neoplastic
lesions in rat liver.
Patients with prostate cancer were found to have low levels of lycopene and high
levels of oxidation of serum lipids and proteins (Rao et al., 1998). Preliminary in
vitro evidence indicates that lycopene reduces cellular proliferation induced by
insulin-like growth factors, which is potent mitogens, in various cancer cell lines
(Levy et al., 1995). Lycopene regulated intrathymic T-cell differentiation
(immunomodulation) and is suggested to be the mechanism for suppression of
mammary tumor growth (Nagasawa et al., 1995; Kobayashi et al., 1996).
In humans, lycopene or tomato-free diets resulted in loss of lycopene from blood
serum causing an increase in lipid oxidation (Rao, 2002). Dietary
supplementation of lycopene for 1 week increased serum lycopene levels and
reduced endogenous levels of oxidation of lipids, proteins, lipoproteins and DNA
(Agarwal & Rao, 1998), therefore decreasing the chance of coronary heart
22
disease. Lycopene has also been shown to act as a hypo-cholesterolemic agent
by inhibiting HMG-CoA (3-hydroxy-3-methylglutaryl coenzyme A) reductase,
thereby limiting cholesterol synthesis and enhances cholesterol degradation
(Fuhramn et al., 1997; Arab et al., 2000).
2.8 HYDROPONICS
In 1929, William Frederick Gericke termed early soilless agricultural gardening
“aquaculture”, but later found that aquaculture was already applied to culture of
aquatic organisms. In 1937 he then decided that the term aquaculture should be
termed hydroponics. The word “Hydroponics” is derived from two Greek words,
hydro- meaning water and ponos- meaning labour. Hydroponics is a method of
cultivating plants without soil, using an inert support medium. Nutrients are
supplied to the plants via a nutrient medium containing the correct concentration
of nutrients.
Hydroponics has many advantages which include the following:
• Much higher crop yields can be obtained because hydroponics can be
used in arid areas where ordinary agriculture is impossible.
• Crops produced hydroponically tend to grow faster combined with the
absence of soil diseases, resulting in consistent crops, quality crops and
improved yields.
• Reduction in growing area is a great advantage.
• Weed contaminants are eliminated and does not influence yield quality.
• Hydroponics is less labour effective, costs less and has minimal manual
labour except harvesting of the crop. Most plants can be grown
hydroponically out of normal growing season which guarantees continues
yield.
• Nutrients are controlled more accurately and seldom become limiting
which results in higher yields and better quality crops.

23
• The avoidance or elimination of pesticides is of utmost importance in
growing healthy strong plants and minimizes soil contamination with
pesticides.
• Plants are under continues observation and diseases and deficiencies are
detected early on before major plant damage and crop loss occurs.
• Hydroponic setups are environmentally friendly because no unnecessary
nutrients are applied to the soil that can pollute the environment. In an
environmentally conscious world, hydroponics is the way to go.
Hydroponics is a cultivation technique to maximize crop yield. Obtaining
economic yields of high quality and quantity of tomatoes while minimizing the use
of pesticides and other agri-chemicals has put hydroponics on the frontline of
tomato production. Hydroponics provides optimum conditions for cultivation of
tomatoes and has great potential for alleviation of environmental related
problems (Howard, 2002). A review of the global commercial hydroponic industry
revealed that the commercial hydroponics industry has grown four to five fold in
recent years.
“Hydroponic gardening is the way of the future for environmentally controlled
agriculture. By carefully controlling nutrient levels, light intensity and temperature,
phenomenal yields (quantity and quality) can be achieved in relatively small
space” (Internet 1). Moraru et al. (2003) has grown 10 different tomato cultivars
for NASA Advanced Life Support Program in order to determine the best cultivar
for outer space usage.
Hydroponic technology allows for growing crops where crops has never been
grown before, whether it is underground, above ground, in space or under the
oceans. Hydroponic technology will allow humanity to live where humanity
chooses. If used for our own survival or our colonization, hydroponics is and will
be a major part of the future (Winterborne, 2005).

24
2.8.1 Hydroponic systems
There are six basic hydroponic systems. These include the water culture
technique, wick system, ebb and flow (flood and drain) system, nutrient film
technique (NFT), drip system and aeroponics. The latter being the latest
development. The most common and widely used hydroponic system used is the
drip system (Jensen, 1999).
Since a re-circulating ebb and flow (flood and drain) system was used in this
study for certain reasons, it will be discussed in more detail. An ebb and flow
system is a fairly simple and reliable hydroponic setup. This setup consists of
containers filled with an inert support media, which acts as a support material
and act as a temporary reservoir for water and nutrients for the roots. In an ebb
and flow setup the nutrient solution temporarily floods the containers to
predetermined levels and cycles before it drains back to the nutrient reservoir.
The roots are thus temporarily flooded with nutrient solution where after it is
aerated again. Depending on the water hold capacity of the support media, some
may require flooding of the trays more frequently than others.
Ebb and Flow systems have advantages, which includes the following: plants are
rarely subjected to dry conditions. Depending on the design of the setup, some
trays may have a small reservoir of nutrient solution left on the bottom of the tray
after flooding the tray. This can act as a reserve of nutrients and water during
cycles. The ebb and flow setups are cost effective, re-circulating and fairly easy
to manage with low maintenance and labour.
Disadvantages include the following: root pathogens can spread easily, as all the
roots share the same space and nutrient source. Excessive non-drained water
may cause root rot.

25
2.8.2 Support media
One characteristic support media must have in common is that it must be inert
and not supply the plant with any nutrients. It must be kept in mind that some
media may work for some crops, while others may work better for other crops
(Romer, 1997).
There are various support media which can be used. These media include
rockwool, coconut fiber, perlite, vermiculite, sand, gravel or inert silica sand and
many other synthetic and natural media. One of the most obvious decisions to
take into account is which medium is the most applicable for a crop. Different
media are appropriate for different crops.
Rockwool (mineral wool) is the most widely used medium in hydroponics.
Rockwool is an inert substrate for both re-circulating and non-circulating systems.
Rockwool is produced from molten mineral compounds (molten rock) which is
aerated at a temperature of about 1600 °C, resultin g in a light, sterilized and
fibrous medium. Rockwool is not degraded by microbiological activity. Rockwool
can hold large quantities of water and air that aids root growth and nutrient
uptake and its fibrous nature provides a good mechanical structure to support the
plant. Rockwool has a neutral pH (Internet 7).
Perlite is a volcanic rock that has been heated to 850 – 900 °C, which then
expands into lightweight pebbles (± 1 mm). Perlite is a fusion of granite, obsidian,
pumice and basalt. The expanded material is a brilliant white, very light
substance (30 – 150 kg.m-³). Due to its low density and relatively low price, it is
ideal for hydroponics. Perlite has similar properties to vermiculite, but generally
holds more air and less water. Perlite has a neutral pH (Internet 7).
Like perlite, vermiculite is an inorganic mineral that has been heated to 1100 °C
until it expands into light flakes. The expansion process is called exfoliation and it
is routinely accomplished in purpose-designed commercial furnaces. Vermiculite
is formed by hydration of certain basaltic minerals. Vermiculite is also very light

26
and is often used in hydroponics as support media. Vermiculite has a neutral pH
of 7 and has a very good ability to regulate temperature around the root zone.
However, vermiculite is not always available and may be expensive (Internet 7).
Sand (river or sea sand) or silica sand is cheap and easily available. However, it
is heavy, thus impractical in some setups and it does not always drain well due to
very small grains. Sand must often be sterilized by baking the sand in an oven at
200 °C between seasons or between handlings. Aerati on may also pose a threat
and cause root rot due to high water retention abilities. Sand is slightly acidic
(pH < 7). Depending on the colour of the grains, grey or white, silica sand
regulate temperature fairly good (Internet 7).
Gravel is a much more course support medium than sand, which makes it a very
effective support medium for hydroponics. Gravel is inexpensive, easily kept
clean and drains well. However, gravel is heavy due to its large (< 2 mm) grain
size and some systems will be unpractical when gravel is used as support
medium. A disadvantage of gravel is that if the system doesn't regularly receive
water, the gravel dries out quickly. Gravel can be grouped into two different
gravel types depending on the origin of the gravel namely silica gravel and
crushed rock. Silica gravel comes from a silica rock (quartz) which is crushed into
the desired particle size. After it has been crushed it undergoes a series of
washes to clean it. This give the silica gravel it distinctive white appearance. This
white appearance may influence temperature in the root zone. Crushed rock is
limestone or dolomite which is crushed to a predetermined particle size. The
crushed rock has a grey appearance which may cause the root zone to heat to
levels above the desired temperatures. Both silica and crushed rock gravel is
inert and has a neural pH with relatively low water retention ability, but provides
excellent aeration for roots (Internet 7).
Coconut fiber, also known as peat, coir or coco, is the fibers of a coconut husk
which have been removed from the bolster (outermost shell) of the coconut. Raw
coconuts are washed, heat-treated, screened and graded before being
processed into coco peat products of various granularity and densities. Coconut

27
fiber is an organic medium which generally has an acidity in the range of pH - 5.5
to 6.5 and has a high water retention capacity (Internet 8).
2.8.3 Electrical Conductivity (EC)
The electrical conductivity (EC) of a nutrient solution change continuously. These
changes in EC are a result of absorption or accumulation of dissolved salts within
the medium. Therefore, the EC indicates that elements may become limiting or
accumulate within the media. Electrical conductivity is measured as milliSiemens
per centimeter (mS.cm-1) or microSiemens per centimeter (µS.cm-1) depending
on the concentration of dissolved salts. The average EC required for crops is
approximately 2.1 mS.cm-1 (Romer, 1997) to 2.6 mS.cm-1 (du Plessis, 2001).
Measuring EC is a valuable tool in hydroponics to ensure a high yield and fruits
of good quality and taste (Dorai et al., 2001).
By adjusting and monitoring the EC of the nutrient solution at an optimal level,
fruit quality can be maintained. At some point a high EC may limit yield. The
concentration of nutrients available to plants influences fruit size and the dry
matter content. Changes in size and dry matter content increases linearly with
the EC of the nutrient solution. The exact rate of yield decline or incline varies
between cultivars, environmental factors and nutrient solution composition.
Electrical conductivities which are low (less than 2 mS.cm-1) may result in a low
yield, whereas an EC of 3.5 – 9.0 mS.cm-1 may improve fruit quality (Dorai et al.,
2001).
2.8.4 pH
pH is used to measure the degree of acidity or alkalinity in a solution. Excessive
H+ ions in a solution will result in an acidic solution, whereas a solution with
excess hydroxyl ions (OH-) will be alkaline. A solution with a pH of 7 contains an
equal number of hydrogen and hydroxyl ions, and is termed a neutral solution.

28
Solutions with a pH less than 7 are more acidic and solutions with a pH more
than 7 are basic. The abbreviation, pH, stands for “Positive hydrogen”
When pH levels for a nutrient solution is not optimal, some elements may
become limiting (du Plessis, 2001). This happens because the pH of the nutrient
solution affects the availability of many nutrients. By increasing the pH (more
alkaline) of the nutrient solution, the availability of phosphorous, boron, copper,
iron, manganese and zinc decreases, whereas decreasing the pH (more acidic)
the availability of molybdenum is affected. Changes in the absorption rates of
ammonium and nitrates are strongly correlated with pH levels. If the pH
influences the availability of these elements, then pH indirectly influences fruit
yield and quality. pH is thus another important parameter to monitor the quality of
the nutrient solution.
2.8.5 Hydroponics and Tomatoes
Tomatoes are produced on an enormous scale throughout the world and are
estimated to be 40 million tons (Internet 1) of which 20 million tons are produced
hydroponically per annum (Stern et al., 2003). A large number of tomatoes are
consumed fresh, used for tomato paste and other tomato containing products
(Stern et al., 2003). Sutherland & Sutherland (1987) reported that tomatoes are
an excellent hydroponic crop and is cultivated with great ease and satisfaction.
2.8.5.1 Hydroponic requirements
Tomatoes are a summer crop, which requires both warm and cool temperatures.
Plants should not be subjected to frost or very high humidity. Light affects the
development of fruit colour and pigmentation (Herrmann, 1976; Lopez-Andreu et
al., 1986; Sahlin et al., 2004). Growing tomatoes in greenhouses requires the
regulation of environmental factors like light, temperature, humidity, CO2 levels
and pests. By making use of hydroponics, water and nutrients can be regulated

29
to almost perfection. Because nutrients play such an important role, a much more
detailed discussion will be given.
2.8.5.2 Climatic requirements
Because tomatoes are a summer crop, tomatoes have a specific climatic
requirement which should be controlled optimally for tomato production.
Tomatoes grown in hydroponics are normally grown in a greenhouse where the
environmental factors can be specifically manipulated and controlled for optimal
production. These factors include temperature, relative air humidity and the light
intensity.
2.8.5.2.1 Temperature
Tomatoes have an optimum temperature requirement of 21°C to 24°C during the
day and 12°C to 18°C at night (Niederwieser, 2001). An exhaust fan can help to
regulate air temperature in a greenhouse and also provide fresh air. Fruit set and
development is markedly affected by temperature. Non-optimal temperatures
may cause premature bud and flower abortion, limit inflorescence size, leaf
growth, pollen germination and overall vegetative growth and fruit formation
(Rudich et al., 1977). Davies and Hobson (1981) have found that temperatures
below 16°C and above 30°C inhibit lycopene producti on, while temperatures
between 16°C and 21°C is optimal for lycopene synth esis.
2.8.5.2.2 Relative Humidity
The optimum relative humidity (RH) for tomato production ranges between 60 –
70 % (Buitelaar, 1983). However, relative humidity is difficult to control, and may
vary in a greenhouse, depending on the season, sunny or rainy days, type of
greenhouse construction and its associated ventilation. Yield is also indirectly
affected by relative humidity, since relative humidity influences pollination

30
(Rudich et al., 1977). Relative humidity influences the ability of certain pathogens
to colonize the greenhouse and cause diseases (Buitelaar, 1983).
2.8.5.2.3 Light Intensity
Another environmental parameter, light intensity is difficult to control. Low light
may be the single most important factor in limiting yield in greenhouses. This is
due to the abortion of fruit trusses and lack of fruit set during low light periods.
Low light may cause a lack of pollination and result in smaller fruit size. Artificial
light sources can be used to control day length, as well as light quality and
intensity.
In times of excessive light, shade cloth can be used to prevent excessive light
which may induce damage like photo-oxidation. When tomatoes are grown in a
greenhouse, ultra violet (UV) wavelengths are filtered by the green or plastic
surfaces. Greenhouse cultivated tomatoes are thus less exposed to UV radiation
than field grown tomatoes (Stewart et al., 2000). McCollum (1954) also found
that tomato fruits exposed to direct sunlight during development had a higher
lycopene content than fruit which was exposed to lower light intensities during
development and maturation. Similar results were demonstrated more recently
by Sahlin et al. (2004), Bramley (2000) as well as Levy and Sharoni (2004).
2.8.5.3 Nutrient media and related parameters
Nutrition is the most important aspect of hydroponics. Modern tomato cultivars
have the ability to produce very high yields. A huge yield requires the correct
concentration of nutrients. There is no ideal or optimal nutrient formulation for
hydroponics as each crop requirements differ. When nutrient concentrations are
low, plant growth is reduced compared to when nutrients are available in a high
concentration. The minimum concentration for a specific element is referred to as
the critical concentration of that element (Salisbury & Ross, 1991). Elements in
high demand become limiting first and need to be replaced more frequently than

31
other elements. When elements are not replaced periodically, elements become
limiting resulting in nutrient deficiencies in the plant (Sutherland & Sutherland,
1987). Table 1 indicates the average concentration (ppm – parts per million) of
each element required for most hydroponic set-ups (Sonneveld, 1995).
Table 2.1 Elements needed in a typical hydroponic nutrient solution. Macro- and
micro- mineral elements concentrations are based on the
concentrations needed.
Macro-elements ppm
N 234
P 54
K 370
Mg 58
Ca 216
S 139
Micro-elements ppm
Fe 0.8
Mn 0.55
Zn 0.3
B 0.3
Cu 0.05
Mo 0.05
Cl 0.02
Since nutrient minerals are an integral part of plant nutrition and hydroponics, it
will be addressed in more detail in 2.9 (Essential Elements).

32
2.8.5.4 Foliar fertilization
It has been known that plants can absorb essential elements through their foliage
(Swietlik & Faust, 1984; Gooding & Davies, 1992; Bondada et al., 2001; Johnson
et al., 2001). Foliar feeding is a very useful technique to supply the plant with
additional nutrients and correcting nutrient deficiencies. The mobility of a nutrient
is determined by the ability of the nutrient to be transported in the plant.
Tomatoes grown hydroponically are already under optimal nutrient conditions but
have been shown to have an improved yield and fruit quality when sprayed with a
micro-nutrient complex on a weekly basis (El-Naggar & Awad, 1986).
2.9 ESSENTIAL ELEMENTS
An element is essential, firstly, if the plant cannot complete its life cycle in the
absence of that element. Secondly, an element is essential if it forms part of any
molecule or constituent of the plant that is itself essential to the plant (e.g.
nitrogen in proteins and magnesium in chlorophyll; Epstein, 1972).
Seventeen such chemical elements are known to be important for plant growth
and development. These elements are divided into non-mineral elements and
mineral elements. The mineral elements are further divided into two groups
namely macro-elements (macro-nutrients) and micro-elements (micro-nutrients).
2.9.1 Non-mineral elements
Non-mineral elements include oxygen (O), available in the form of O2, H2O and
CO2, hydrogen (H), available in the form of H2O and carbon (C), available as
carbon dioxide (CO2). Oxygen, hydrogen and carbon accounts for more than
96% of a plants dry weight (Salisbury & Ross, 1991).

33
2.9.2 Mineral elements
In addition to the non-mineral elements (oxygen, hydrogen and carbon) plants
require a great variety of other elements in various chemical forms. The mineral
elements are usually divided into two groups namely macro-elements (macro-
nutrients) and micro-elements (micro-nutrients) based on the quantities required
by the plants. These elements are absorbed from the soil as nutrient ions.
However, absorption of these elements is influenced by the availability of the
particular element, soil pH, and the concentration of the element available
(Atherton & Rudich, 1986). Ions are usually associated with chelating agents
which helps with the availability of the particular ion because ions are easily
precipitated by other nutrients.
2.9.2.1 Macro-nutrients, their related roles and deficiency symptoms
Macro-nutrients are nutrients required in larger concentrations by the plants.
These elements become deficient whenever the specific element cannot be
absorbed in the required concentration due to factors limiting absorption. Plants
thus require a continues supply of these elements to sustain growth and
development. It should be emphasized that many of the symptoms accounted
with a deficiency are differently expressed in different plants, and the
concentration of the element resulting in a deficiency may be different in different
species.

34
Table 2.2 The available forms, role and estimated critical concentrations of macro-elements and deficiency symptoms in
tomatoes.
Element Symbol Available form Functions in plants Deficiency symptom(s)
Optimum range ppm
Nitrogen N NO3- ; NH4
+
Part of living cells,
proteins, chlorophyll,
metabolic processes.
Stunted growth, chlorosis, and small.
Plants with low yield. Deficiency if less
than 200 ppm (see 2.9.2.1.1)
234
Phosphorus P H2PO4- ; HPO4
2-
Synthesis of oils, sugars,
starches. Root growth,
flowering and
photosynthesis.
Similar to nitrogen deficiency. Dark
green leaves, delays maturity.
Deficient below 45 ppm
54
Potassium K K+
Protein synthesis,
photosynthesis, disease
resistance.
Chlorotic, necrotic, curly leaves,
premature fruit drop, stunted growth.
Deficient below 70 ppm
370
Calcium Ca Ca2+
Cell wall structure,
absorption of other
elements.
Slight chlorosis, scorching of leaves,
blossom end rot. Deficient below 150
ppm
216
Magnesium Mg Mg2+
Part of chlorophyll.
Photosynthesis, enzyme
activator.
Interveinal chlorosis, necrosis slow
growth. Deficient below 20 ppm 58
Sulfur S SO42-
Synthesis of proteins,
chlorophyll and vitamins.
Cold tolerance.
Like nitrogen deficiency, woody and
elongated stems. Deficient below 70
ppm
139
(Atherton & Rudich, 1986).

35
The macro-nutrients accounts for approximately 4% of a plants dry weight
(Salisbury & Ross, 1991). Macro-nutrients are needed in larger quantities
(100mg.kg-1 dry matter) than micro-nutrients (Trace elements; 1mg.kg-1 dry
matter). Nitrogen (N), Phosphorus (P) and Potassium (K) are the most important
macro-nutrients and are needed in the largest amounts. These elements are
often limited or deficient due to a high uptake by plants (Salisbury & Ross, 1991).
The remaining macro-nutrients include calcium (Ca), magnesium (Mg) and sulfur
(S). These elements are needed in lower quantities than nitrogen, phosphorus
and potassium. Because nitrogen is needed in such high concentrations, it
frequently becomes limiting.
2.9.2.1.1 Nitrogen deficiencies
Nitrogen deficiency is the most common type of deficiency due to its high
requirement by plants. Nitrogen deficiency is first observed in older leaves
because nitrogen is mobile in plants and moves with the transpiration stream
(Kirkby & Mengel, 1967).
Three visual deficiencies can be detected in plants. i) The synthesis of
chlorophyll decreases and the plants become chlorotic. ii) Retarded or stunted
growth can occur in new shoots and especially lateral shoots. Because nitrogen
is important for cell division, deficient nitrogen levels will limit and retard growth.
iii) When nitrogen is needed in younger leaves, available nitrogen will be
translocated from older leaves to younger leaves. When this nitrogen
requirement is not replenished, the older leaves become chlorotic. Stems of
leaves become shorter and slender and in severe nitrogen deficiency, leaves can
become necrotic and fall off.
Nitrogen is part of all amino acids, proteins, coenzymes, chlorophyll, RNA and
DNA and when nitrogen is deficient, it can influence all processes involving these
metabolites (Devlin, 1969).

36
Nitrogen deficiency rarely occurs under hydroponic conditions but is frequently
observed in field trials. To reduce nitrogen deficiency, additional nitrogen must be
added to soils. This however is not always a solution because the nitrogen can
again become limiting due to factors influencing nitrogen uptake.
2.9.2.2 Micro-nutrients, their related roles and deficiency symptoms
Micro-nutrients are needed in only very small concentrations (1mg.kg-1 dry
matter), but are still essential for plant growth and development (Salisbury &
Ross, 1991). These nutrients include copper (Cu), Boron (B), Iron (Fe),
Manganese (Mn), chloride (Cl), zinc (Zn) and molybdenum (Mo) and recently
Nickel (Ni) (Brown et al., 1987).
The micro-nutrients usually serve in catalytic processes in plants. Although
micro-nutrients are widely distributed in soils, certain micro-nutrients may be
absent due to the absence of base the rock. In addition to this, soil pH, other
solutes and soil oxygen levels affect the solubility of the elements or the plant’s
ability to absorb these micro-nutrients.

37
Table 2.3 Available forms, role and estimated critical concentrations of micro elements and deficiency symptoms in
tomatoes.
Element Symbol Available form Functions in plants D eficiency symptom(s)
Optimum range.
ppm
Copper Cu Cu+ ; Cu2+
Reproductive growth, root
metabolism, protein
utilization.
Leaf wilt, chlorosis, necrosis, fruit split.
Rare. Deficient below 0.02 ppm 0.05
Boron B H3BO3
Uptake of other elements,
partial production of
sugars.
Slight chlorosis, reduced growth, thick
leaves. Fruit crack. Deficient below
0.2 ppm
0.3
Iron Fe Fe3+ ; Fe2+
Formation of chlorophyll,
frequently underestimated.
Chlorotic to white, small leaves.
Deficient below 0.3 ppm 0.8
Manganese Mn Mn2+
Breakdown of sugars,
nitrogen metabolism,
enzyme catalyst.
Immature chlorotic leaves, poor
flowering, premature leaf drop.
Deficient below 0.28 ppm
0.55
Chloride Cl Cl- Photosynthesis, specific
oxidation reactions (PSII).
None known. Possible lower
photosynthetic rate. Low yield. 0.02
Zinc Zn Zn2+
Sugar transformation and
breakdown, enzyme
catalyst.
Chlorotic molting, short internodes,
small leaves. Deficiency occurs below
0.18 ppm
0.3
Molybdenum Mo MoO42-
Nitrogen metabolism,
breakdown of purines.
Cupped, thick leaves, necrosis, rare.
Deficient below 0.03 ppm 0.05
Nickel Ni Ni2+
Essential catalyst for
Urease.
Inability to metabolize urea. Possible
chlorosis and stunted growth. < 0.01
(Atherton & Rudich, 1986).

38
2.9.3 Toxicity symptoms
Once nutrient deficiencies have been identified, nutrient deficiencies can easily
be corrected by supplying the plant with additional nutrients. However, caution
must be taken not to over supply plants with nutrients. Overdose or nutrient
toxicities may permanently damage the plant without correction. Nutrient
toxicities are seldom found in soils due to correct natural buffering of soil
nutrients by microbes, pH management, leaching of nutrients and temperature
effects (Roorda van Eysinga & Smilde, 1981).
In hydroponics, toxicity rarely occurs because of a regulated nutrient supply.
When such toxicity occurs, it can easily be corrected by replacing or modifying
the nutrient solution. Because nitrogen is such an important macronutrient, it is
the most likely element to be become toxic. Toxicity symptoms of nitrogen can be
detrimental to the plant by producing lush looking plants with few blossoms and a
poor fruit set. Very excessive concentrations of nitrogen can cause generalized
or complete necrosis, poorly coloured tomato fruit with a puffy appearance due to
limited pollination. Fruit may also split as they ripen (Roorda van Eysinga &
Smilde, 1981; Salisbury & Ross, 1991).
2.9.4 Physiological Disorders
There are many symptoms in tomatoes which are not caused by nutrient
deficiencies, but rather by environmental factors. These disorders are termed
physiological disorders and are mainly caused by abiotic factors. Only the most
common physiological disorders in tomatoes will be briefly listed.

39
Table 2.4 Abiotic induced physiological disorders in tomato fruit, visual effects
and possible causes of the related symptoms.
Symptom Visual effects Probable cause
Concentric
cracking
Cracked fruit from calyx to
bottom.
Varying water supply, high
growth rates and
temperatures.
Splitting
Skin of fruit crack, causing
markings on fruit. Complete fruit
splitting when ripe.
Varying temperatures,
excessive nitrogen.
Catfacing Scarring, malformation,
cracking of fruit, holes in fruit.
Extreme variation in
temperatures during fruit
set.
Zipper Scar Vertical scar on the side of the
fruit. Anther, genetic causes.
Blotchy ripening Blotchy, brown markings on
fruit, uneven ripening.
Various environmental
factors (temperature, water
etc.).
Blossom
end rot
Brown or black sunken area at
the blossom end of the fruit.
Insufficient supply of
calcium.
Puffiness
Angular appearance of fruit.
Absence of seed and
suspension gel in locules
causing a smaller fruit.
Any factor influencing
pollination.
(Atherton & Rudich, 1986).

40
2.10 NITROGEN
The importance of nitrogen to plants is emphasized by the fact that only carbon
(C), oxygen (O) and hydrogen (H) are more abundant in them. Because nitrogen
plays such an important role in plants, and is needed in relative large quantities,
nitrogen may frequently become limiting. Many factors can influence the
availability and uptake of nitrogen from soils. These include low soil pH, the type
and availability of nitrogen ions, presence of other macro nutrients like potassium
(K), temperature and the presence of nitrogen reducing microbes. Tomato plants
need approximately 170 mg nitrogen.plant-1.day-1 during the flowering stage
(Adams & Winsor, 1979). Whenever this concentration is not available, nitrogen
becomes limiting and may cause reduced yield and fruit quality. The role of
nitrogen in plants is of utmost importance in maintaining an optimum metabolism
controlling critical pathways in plants.
2.10.1 The role of nitrogen in the plant
Whenever nitrogen becomes limiting, the metabolic activities in the plant which
depends on nitrogen cannot commence fully. Nitrogen is important in overall
metabolism and growth, which ultimately determines yield.
Nitrogen is a component of all plant proteins which is responsible for plant
metabolism. Additionally, nitrogen is found in purines, pyrimidines and
coenzymes. Purines and pyrimidines are found in nucleic acids (RNA and DNA)
which are essential for protein synthesis. Nitrogen is also part of the porphorin
structure found in chlorophyll and cytochrome enzymes which are very important
metabolic compounds involved in photosynthesis and respiration. Coenzymes
are essential for the function of many enzymes. Nitrogen is thus a key factor in
vegetative growth and chlorophyll formation. Nitrogen is also an intrinsic part of
many vitamins (Devlin, 1969).

41
2.10.1.1 Enzymes, proteins and amino acids.
Nitrogen is an intrinsic part of all enzymes, proteins and amino acids (Salisbury &
Ross, 1991). The rate and type of metabolic pathways in cells are controlled by
enzymes. Enzymes are very specific of the reactions they catalyze. Nearly all
enzymes have a protein as a major part of the structure and many enzymes are
made up of only protein.
Proteins are polypeptide chains, each made up of hundreds of amino acids. The
type and size of a protein is determined by the number of amino acids added
together (peptide bonds). There are twenty different kinds of amino acids known.
Amino acids are the building blocks of proteins and some proteins have a full
complement of twenty amino acids. Amino acid chains are held together by non-
covalent bonds, ionic bonds and hydrogen bonds. The amino acid building blocks
in proteins are represented as:
Figure 2.4 Amino acid. R indicates a remainder of the molecule. This is different
for each amino acid. The –NH2 is the amino group and the –COOH is
the carboxyl group (Redrawn from Salisbury & Ross, 1991).
The –R groups adds to the overall properties of amino acids, determining for
example, its water solubility, and polarity. Amino acids can either be bound to
each other in enzymes and proteins but it may also occur in minor concentrations
of unbound molecules (Salo-Väänänen & Koivistoinen, 1996).

42
Amides are amino acids but the –R group is connected to the carbonyl carbon.
Amides are formed from glutamic and aspartic acids. Amides are structural parts
of many proteins and are important in the transport of nitrogen from one part of
the plant to another and acts as a reservoir in which excess nitrogen can be
stored (Salisbury & Ross, 1991).
The nitrogen content in proteins is approximately 16% (Rubner, 1885; Atwater &
Bryant, 1899; Jones, 1931; Browne, 1944). Jones (1931) proposed that by
measuring protein content, the concentration of nitrogen can be determined by
dividing the concentration of protein measured by 6.25 (or multiply by 16%).
Salo-Väänänen & Koivistoinen (1996), however, found that by using the
conversion factor of 6.25 (16 %) overestimates the true protein content of
biological materials. This is because the protein composition in biological material
differ in terms of amino acids compositions. The percentages of nitrogen of all 20
amino acids are given in the table below as well as the basic amino acid (α
amino acid).

43
Table 2.5 Nitrogen content of different amino acids.
Amino Acid Abbreviation % Nitrogen as part of
amino acid structure
Alanine Ala 15.72
Arginine Arg 32.16
Asparagine Asn 21.20
Asparganine Asp 10.52
Cysteine Cys 11.56
Glutamate Glu 9.52
Glutamine Gln 19.17
Glycine Gly 18.65
Histidine His 27.08
Isoleucine Ile 10.68
Leucine Leu 10.68
Lysine Lys 19.16
Methionine Met 9.39
Phenylalanine Phe 8.48
Proline Pro 12.17
Serine Ser 13.33
Threonine Thr 11.76
Tryptophan Trp 13.72
Tyrosine Tyr 7.73
Valine Val 12.01
Basic amino acid (α amino acid) 18.66
Average nitrogen content of
amino acids 14.92
Taking the percentage nitrogen present in all the amino acids gives an average
value of 14.92 %. It must be kept in mind that not all nitrogen present in plant
material is present in amino acids, but may be in ionic forms such as nitrates,

44
nitrites, ammonia, ammonium and molecules like atmospheric nitrogen,
chlorophyll, nucleic acids and other cell constituents. This nitrogen also adds to
the total concentration of nitrogen present within the plant material. Thus, when
protein concentrations are known, the nitrogen content can be estimated as 16%
of the protein content.
2.10.2 Sources of nitrogen
Nitrogen can be taken up through plant roots from the soil in highly oxidized
forms but must be reduced by energy dependant processes before it can be
metabolized and incorporated into cellular constituents. Nitrogen can alternatively
be obtained from symbiotic relationships with soil bacteria. The fixation of
atmospheric nitrogen (N2) by microbes yields nitrate (NO3-) and ammonium
(NH4+). Many factors can influence the symbiotic relationship between plants and
soil bacteria (James et al., 2002), thus also affecting the concentration of
available nitrogen.
Plants can utilize any form of nitrogen ions, ammonium and nitrate, respectively.
If both of these ions are available, plants will metabolize any one (Salisbury &
Ross, 1991) although nitrate (NO3-) are metabolized more commonly. In
agriculture, nitrogen sources include rainwater (source of NO3-), alfalfa meal,
blood meal, compost, feather meal, fish meal, animal manure, plant residues and
fertilizers.
2.10.3 Nitrogen Metabolism
Once absorbed, nitrates (NO3-) are reduced to nitrites (NO2
-) via nitrate reductase
and is further reduced to ammonium (NH4+) by nitrite reductase. The ammonium
(NH4+) formed is utilized by plants by combining ammonium into organic forms
via glutamate. Glutamate synthetase and glutamate synthase is the most
important enzymes converting ammonium and glutamate into the amino acid

45
glutamine. Originally, glutamate dehydrogenase (GDH) was thought to be the
enzyme of ammonia assimilation in plants. However, an alternative pathway of
ammonia assimilation, involving glutamine synthetase (GS) and an NADPH-
dependent glutamine-2-oxoglutarate amidotransferase (GOGAT) also referred to
as glutamate synthase was shown to be operating when ammonia was present
(Tempest et al., 1970). This is the main route by which ammonia enters plant
metabolism. The NH2 group is then used in the formation of other carbon
skeletons to produce other amino acids via aminotransferaseses.
Amino acids may also be synthesized by reverse transamination of NH2 from
glutamate to other carbon skeletons. Aminotransfrase can transfer NH2 groups
from amino acids onto α-keto acids like oxaloacetate. Oxaloacetate is a Kreb’s
cycle intermediate and in conjunction with aminotransferase is used to
synthesize amino acids. Other metabolic intermediates formed include -
ketoglutarate, phosphoenol pyruvate, erythrose, ribose-5-phosphate, 3-
phosphoglycerate and pyruvate. Essential amino acids that can be formed from
the above mentioned intermediates include glutamine, glutamate, praline,
arganine, asparganine, aspartate, methionine, threonine, lysine, isoleucine,
tryptophan, phenylalanine, tyrosine, histidine, serine, glycine, cysteine, alanine,
valine and leucine (Vance & Griffith, 1990).
2.10.4 Mobility of nitrogen in the plant
The mobility of an element is determined partially by the solubility of the element
and how well it can enter various tissues when transported (e.g. phloem sieve
tubes). If an element can be loaded into translocating phloem cells the element
will be mobile within the plant. The ability of an element to be mobile in a plant
and the rate at which the element is mobile determines the time in which the
element is metabolized. Thus, when an element is only partially mobile or very
slow moving in the plant the deficiency of the element in the tissue where it is
needed may cause irreversible damage even if element levels are optimal.

46
Elements that have been classified as mobile include potassium, phosphorus,
chlorine and nitrogen. Partially mobile elements include zinc, copper,
manganese, molybdenum and magnesium. Immobile or very slowly mobile
elements include boron, calcium, sulfur and iron (Salisbury & Ross, 1991).
Nitrogen is absorbed from the soil in a highly oxidized form and must be reduced
by energy-dependant processes before it can be incorporated into proteins and
other cellular constituents (Salisbury & Ross, 1991). Nitrogen move readily from
older to younger leaves, then to storage organs (Salisbury & Ross, 1991; Ireland,
1990). This is why nitrogen deficiency is first observed in older leaves, due to a
high demand for nitrogen in younger leaves (see nitrogen deficiencies, 2.9.2.1.1).
Another very effective way of translocating nitrogen in the plant is by means of
amino acid transport (Okumoto et al., 2004). Once nitrogen has been
incorporated into amino acids in the cytosol, these amino acids can be freely
transported in the plant, for example to where new growth commences like in
new shoots or leaves. Nitrogen no longer needed in older tissue will be
transported via the transpiration stream (Kirkby & Mengel, 1967; Palta et al.,
1991) to new growth areas and older leaves become nitrogen deficient first. To
prevent nitrogen deficiency, plants need optimal concentrations of nitrogen which
is approximately 170 mg nitrogen.plant-1.day-1 for tomatoes during the flowering
stage (Adams & Winsor, 1979).
2.10.5 Nitrogen in nutrient salts and fertilizers u sed in hydroponics
Plants need the correct concentration and ratio of nutrients to grow. Fertilizers
applied to the soil may be less effective than that applied in hydroponics. Only a
small concentration of fertilizer is taken up by a crop and the rest either remains
in the soil, leaches out, is physical washed off, fixed by soil bacteria or can be
released into the atmosphere by microbial activity (Hera, 1996). Nitrogen is
especially prone to these cases and easily become a limiting nutrient, thereby
lowering yields.

47
However, in hydroponics, these problems can be prevented by optimal
management of the nutrient solution. In hydroponics, nitrogen is obtained by
plants directly from the nutrient solution. Inorganic salts such as calcium nitrate
(Ca(NO3)2), ammonium nitrate (NH4NO3), potassium nitrate (KNO3), sodium
nitrate (Na(NO3)2), ammonium sulfate ((NH4)SO4) and urea (CO(NH2)2) are
commonly used to supply optimal nitrogen concentrations to the plants (Layzell,
1990). Hydroponics provides nitrogen in optimal concentrations because it
eliminates the factors limiting nitrogen availability.
2.11 UREA
Due to frequent nitrogen limiting conditions in agricultural practices, urea is
commonly used as an additional source of nitrogen for many crops, including
tomatoes. Urea is widely applied as a foliar fertilizer. However, soil urea usually
is low because of the reduction of urea by soil microbes. Other urea products
(Black Urea) have been developed that limits urea from being depleted too fast
(Internet 4).
Urea is a white crystalline inorganic salt (CO(NH2)2), which contains 46%
nitrogen per mass. Urea can be supplied to the soil (Vavrina & Obreza, 1993) or
used as a foliar spray (Wittwer et al., 1963; Yamanda et al., 1965; Knoche et al.,
1994; Bondada et al., 2001). Urea is the most frequent used nitrogen fertilizer
globally and is the most important additional nitrogen source for vegetable
production in the field (Vavrina & Obreza, 1993).
Urea has been successfully applied to tomato leaves to reduce a nitrogen
deficiency (Maximum yield, 2003). The application of urea fertilizer to the leaves
of plants has given responses approximately equal to that of fertilizer applied to
the soil (Nicoulaud & Bloom, 1996; Maximum yield, 2003).

48
When urea is applied as a foliar spray, it may cause burning of leaves when the
concentration is too high, mostly above 2%, due to the presence of biuret. Biuret
is a condensation compound of urea, equivalent to two molecules of urea, but
with one molecule of ammonia absent from the molecule (C2O2N3H5; Krogmeier
et al., 1989). Attempts should rather be made to apply lower concentrations of
urea (0.5% - 1%) more frequently. Most plants absorb foliar applied urea rapidly
(Wittwer et al., 1963; Nicoulaud & Bloom, 1996) where urease hydrolyzes urea in
the cytosol where it is then further metabolized.
2.11.1 Foliar absorption and metabolism of urea
Urea is able to enter leaves through stomata or have specific translocators
located in the leaves, as demonstrated in Arabidopsis (Liu et al., 2003). A gene,
AtDUR3 apparently encodes for a high affinity urea/H+ symporter in Arabidopsis
(Liu et al., 2003), which is an energy requiring process (Wilson et al., 1988).
Urea can easily pass through the phospholipids bilayer of membranes, due to its
non-polar properties (Salisbury & Ross, 1991; Galluci et al., 1971). Wittwer et al.
(1963), as well as Nicoulaud and Bloom (1996), stated that most plants absorb
foliar applied urea rapidly and complete absorption of foliar applied urea occurred
within 24 hours. Wilson and Walker (1988) suggested that urea was taken up by
both high- and low affinity transport systems. Krogmeier et al. (1989) reported
that after leaves were sprayed with urea, urea accumulated within the leaf,
suggesting that urea enters the leaf in an intact form. Hine and Sprent (1988)
obtained similar results, but with urea supplied to the roots.
It has been shown that foliar applied urea (15N) was transported to potato tubers
within 48 hours, followed by a more gradual redistribution within the plant (Witte
et al., 2002). This redistribution of urea derived nitrogen has been observed in
hydroponically grown tomatoes as well (Tan et al., 1999). In fact, it has been
shown by Shelp and Shattuck (1986) that urea fed to tomatoes via the foliage

49
can be transported directly to the fruit, suggesting that urea entered the transport
tissue. When urea is sprayed onto the leaf, it enters the cell through an urea
specific symporter (urea + H+ → urea + H+) peripheral protein (AtDUR3), where it
is immediately or quickly available for metabolic processes (Dilley & Walker,
1961; Liu et al., 2003). This reaction is catalyzed by urease and is essential to
make nitrogen derived from urea accessible to plants. Urease, a nickel-
dependant enzyme that occurs in almost all organisms is responsible for the
degradation of urea once inside the cytosol (Gerendas et al., 1999). This reaction
is as follows:
CO(NH2)2 + H2O + Urease 2NH4 + CO2
(urea) (water) (Ni dependant enzyme) (ammonium) (carbon dioxide)
Figure 2.5 Transport of urea into plant cells (through high affinity urea/H+
peripheral symporter protein). AtDUR3 is the gene encoding for high
affinity urea/H+ peripheral symporter protein in Arabidopsis (Liu et
al., 2003). (C = chloroplast, M = mitochondria, ER = endoplasmic
reticulum, P = protein, TIP’s = tonoplast intrinsic proteins or
aquaporins) .

50
When urea is applied as a foliar spray, urea may only be absorbed in low
concentrations because not all urea is transported into the leaves by the
transport proteins. These proteins may become saturated with urea, temperature
may play a role or the urea mixture may evaporate from the leaf surface. All
these factors may limit urea absorption. Thus, an attempt has to be made to
improve or enhance the absorption of urea in tomato leaves (Liu et al., 2003).
Urea is not only supplied to a plant, but is also formed inside the plant during
arganine breakdown via arginase in the urea cycle (Polacco & Holland, 1993).
The ammonium formed is further metabolized into other cellular constituents.
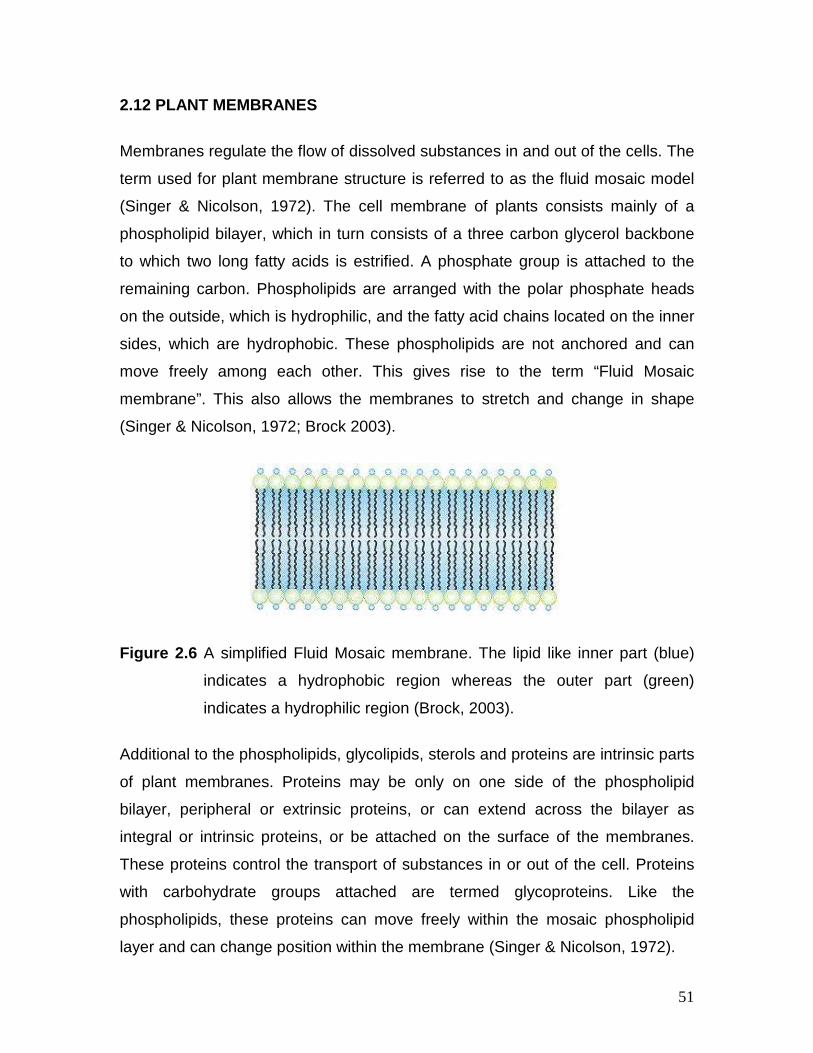
51
2.12 PLANT MEMBRANES
Membranes regulate the flow of dissolved substances in and out of the cells. The
term used for plant membrane structure is referred to as the fluid mosaic model
(Singer & Nicolson, 1972). The cell membrane of plants consists mainly of a
phospholipid bilayer, which in turn consists of a three carbon glycerol backbone
to which two long fatty acids is estrified. A phosphate group is attached to the
remaining carbon. Phospholipids are arranged with the polar phosphate heads
on the outside, which is hydrophilic, and the fatty acid chains located on the inner
sides, which are hydrophobic. These phospholipids are not anchored and can
move freely among each other. This gives rise to the term “Fluid Mosaic
membrane”. This also allows the membranes to stretch and change in shape
(Singer & Nicolson, 1972; Brock 2003).
Figure 2.6 A simplified Fluid Mosaic membrane. The lipid like inner part (blue)
indicates a hydrophobic region whereas the outer part (green)
indicates a hydrophilic region (Brock, 2003).
Additional to the phospholipids, glycolipids, sterols and proteins are intrinsic parts
of plant membranes. Proteins may be only on one side of the phospholipid
bilayer, peripheral or extrinsic proteins, or can extend across the bilayer as
integral or intrinsic proteins, or be attached on the surface of the membranes.
These proteins control the transport of substances in or out of the cell. Proteins
with carbohydrate groups attached are termed glycoproteins. Like the
phospholipids, these proteins can move freely within the mosaic phospholipid
layer and can change position within the membrane (Singer & Nicolson, 1972).

52
Figure 2.7 The phospholipids accompanied by membrane associated proteins,
glycoproteins and glycolipids (Singer & Nicolson, 1972; Brock, 2003)
Transport of substances through membranes can occur in two different ways.
Firstly, by simple or passive transport (diffusion). This involves the simple
movement of an uncharged molecule over the membrane with a concentration
gradient. Such molecules include water (H2O), carbon dioxide (CO2), small
amounts of atmospheric nitrogen (N2), oxygen (O2) and urea. Active transport
proteins in the membrane regulate the substances entering and exiting the cell,
but do not influence the direction of substances.
Secondly, by means of active transport where molecules are transported against
a concentration gradient. This, however, are energy (ATP) dependant transport
systems. These molecules are transported by transport proteins, channel
proteins or carrier proteins (Sussman & Harper, 1989). Active transport proteins
can further be categorized into uniporter, antiporter and symporter proteins,
based on the direction of movement of the substances (Fig. 2.8). In uniporter
transporters, only one molecule or ion is transported in one direction. In
antiporter transporters, a molecule or ion is passed through the membrane in
exchange for another molecule or ion. In the case of symport transport, two
molecules or ions are transported over the membrane in the same direction at
the same time (Brock, 2003).

53
Figure 2.8 The three different types of transport events (Brock, 2003).
Although urea can easily pass through the biphospholipid layer it can be
transported into the cell by transport proteins (Liu et al., 2003). Urea is an
uncharged molecule and would therefore be translocated over a biphospholipid
either by simple diffusion or by means of a symporter transport system (Fig. 2.5;
Liu et al., 2003).
2.13 PHEROIDS
Pheroids is manufactured by ELEMENTOL (Pty) Ltd, and is apparently a “natural
organic lipid like molecule” extracted from soya beans. Due to its lipid like
structure, it is claimed that Pheroids easily associates with plant membranes and
may enhance the transport of phytological beneficial substances over
membranes. Due to pending patent registration, little is known about the
chemical attributes of Pheroids. It is presumed that Pheroids “encapsulate” or
“pack” substances and facilitate the transport of substances over membranes.
Once inside the cell, the Pheroids / substance complex is metabolized, thereby
releasing the substance. Whether the breakdown and “unpacking” of Pheroids is
energy dependant or enzyme linked is unclear and requires further investigation.
Due to the natural organic properties of Pheroids, it is claimed that Pheroids itself
may stimulate plant growth. Pheroids is effective at very low concentrations
(8 ml.L-1).

54
2.14 RATIONALE FOR THIS STUDY
Elementol (Pty) Ltd, requested the evaluation of their novel compound, Pheroids,
as a possible vehicle for the transport of phytological beneficial substances over
membranes and as a bio-stimulant in general.
Field grown tomato plants may regularly experience nitrogen limiting conditions.
Urea is commonly used as an additional source of nitrogen for many crops in the
form of a soil fertilizer (Vavrina & Obreza, 1993) or as a foliar spray. Urea has
been successfully applied to tomato leaves to reduce a nitrogen deficiency. Urea
can easily pass through the phospholipids bilayer of membranes (Salisbury &
Ross, 1991; Galluci et al., 1971). Wittwer et al. (1963) as well as Nicoulaud and
Bloom (1996) stated that most plants absorb foliar applied urea rapidly. When
urea is applied as a foliar spray, urea may only be absorbed in low
concentrations because not all urea is transported into the leaves by the
transport proteins. These proteins may become saturated with urea, temperature
may play a role or the urea mixture may evaporate from the leaf surface. All
these factors may limit urea absorption. Thus, an attempt has to be made to
improve or enhance the absorption of urea by tomato leaves.
The rationale of this study was to determine whether Pheroids has the ability to
enhance the effect of foliar applied urea, an already fairly successful treatment,
to reduce the effects of nitrogen limiting conditions on vegetative development
and yield. This was addressed in a study conducted in a hydroponic setup where
nitrogen levels could accurately be controlled. Plants were grown under optimal
nitrogen control conditions and nitrogen limiting conditions. The plants were
treated with different urea concentrations, either singly or mixed (“packed”) with
Pheroids to determine Pheroids capacity to facilitate the additional uptake urea
and to which extent. Another aim was to determine if Pheroids has any bio-
catalytic properties by itself. In this case Pheroids was singly sprayed onto plants
grown under nitrogen limiting conditions.

55
CHAPTER 3
MATERIAL AND METHODS
3.1 MATERIAL
Tomato plants (Lycopersicon esculentum Miller. cv. Rodade Star (Solanaceae))
was purchased from a local nursery.
All chemicals used were of the highest purity available. Most chemicals were
purchased from Merck®. Urea was purchased frorm BDH AnalaR®, Butylated
Hydroxytoluene (BHT) from ICN Biomedicals, Inc. Pheroids was kindly provided
by ELEMENTOL (Pty) Ltd. Nutrient mixtures for hydroponics were obtained from
Hygrotech, South Africa.
3.2 METHODS
3.2.1 Cultivation
3.2.1.1 Hydroponic setup
Eight week old tomato seedlings were transplanted to an ebb and flow
hydroponic system. Four identical experimental layouts were used (Fig. 3.1). The
piping of each setup was constructed from 15 mm black PVC pipes, which in turn
was connected to a 70 liter dark reservoir via a pump. Each layout consisted of
two containers (900 mm X 200 mm X 200 mm) with a volume of 36 dm3. Each
container was filled with white silica gravel (3 mm – 4 mm) to 30 mm from the
rim. This resulted in a 30 dm3 support volume. Three plants were transplanted to
each container 200 mm apart, resulting in a support volume of 10 dm3 for each
plant. The containers were placed 180 mm apart. Each container contained a
pipe feeding back to the reservoir to complete the circulating ebb and flow setup.

56
The total area for each setup was approximately 7 m2. This gives an average of
3.5 plants.m-2 (35 000 plants.ha-1). The setups were flooded with the applicable
nutrient solution seven times a day for five minutes, every two hours from 06:00.
This is equivalent to 3.5 L.min-1, which gives a volume of 17.5 L.cycle-1 for each
setup. After this, the nutrient solution was allowed to drain back into the dark
reservoir (recirculation) which took approximately 10 minutes.
Figure 3.1 Experimental layout. Setup 1, 2 and 3 were nitrogen limiting whereas
setup 4 was supplied with an adequate concentration of nitrogen
(control).

57
3.2.1.2 Pruning and supporting
Where necessary, pruning was done in the early stages of vegetative
development before any flowers and fruit set occurred. Some side branches
below the first flower truss were removed to allow air circulation between the
plants. All plants were pruned evenly. Care was taken not to remove all bottom
leaves to allow for the translocation of nitrogen from older to younger leaves
(Salisbury & Ross, 1991; Ireland, 1990) (see mobility of nitrogen, 2.10.4).
The evenly spaced tomato plants were additionally supported using twine tied to
a supporting frame as part of the hydroponic setup. To prevent damage to the
plant during vegetative growth care was taken not to wine the twine too tightly
around the stems of the plants.
3.2.2 Greenhouse conditions
Greenhouse conditions, optimized for the production of tomatoes, were
measured three times a week at midday (12:00), at three different localities within
the greenhouse. Controlling greenhouse factors like temperature, relative
humidity and light intensity are of utmost importance in obtaining and managing
optimum yield.
3.2.2.1 Temperature and Relative Humidity (% RH)
The temperature was controlled within the greenhouse. Temperature (ºC) was
measured and monitored constantly throughout the trial. Temperature was
measured with a stagnant thermometer, thermo hydrograph and a swirl
hygrometer at three different localities within the greenhouse.

58
Relative humidity (% RH) was measured with a stagnant thermo hydrograph and
additionally with a swirl hygrometer. The values (wet and dry bulb values)
measured with the swirl hygrometer were used to obtain the percentage relative
humidity (% RH).
3.2.2.2 Light intensity
Light intensity was measured with a LiCor LI – 185A quantum/radio/photometer
(µE.m-2.s-1). Light measurements were taken at three different locations within
the greenhouse and the average thereof was taken as the existing light intensity
for the experimental layout.
3.2.3 Nutrient medium
3.2.3.1 Nutrient composition
Two nutrient media were used. A nitrogen adequate medium (control) and a
nitrogen limiting medium. The control medium contained 210 ppm nitrogen,
whereas the nitrogen limiting medium contained only 70 ppm nitrogen.
The nutrient media were prepared using Hygrotech’s nutrient formula from two
different stock mixtures (A & B). The first mixture (A) consisted of all the essential
elements and the second mixture (B) consisted of Ca(NO3)2. The first mixture
contained only 70 ppm nitrogen. When combined, the two mixtures resulted in a
complete nutrient solution of 210 ppm nitrogen. The control medium consisted of
both mixtures, whereas the nitrogen limiting solution consisted only of mixture A.

59
Table 3.1 Nutrient concentrations in the nitrogen adequate and limiting media.
Nutrient element Nitrogen adequate medium
control (ppm)
Nitrogen limiting medium
(ppm)
Nitrogen (N) 210 70
Phosphorus (P) 43 43
Potassium (K) 214 214
Magnesium (Mg) 30 30
Sulphur (S) 64 64
Iron (Fe) 1.25 1.25
Copper (Cu) 0.02 0.02
Zinc (Zn) 0.149 0.149
Manganese (Mn) 0.3 0.3
Boron (B) 0.37 0.37
Molybdenum (Mo) 0.037 0.037
Calcium (Ca) 183 182
Chloride (Cl) 0 325
Due to the mixing ratios between the two mixtures, the nitrogen limiting medium
was also deficient of calcium. Calcium was additionally added in the form of
calcium chloride (CaCl2) to ensure the same concentration of calcium as in the
control medium.
The nitrogen adequate nutrient solution (control) contained three times more
nitrogen (210 ppm) than the nitrogen limiting medium (70 ppm). This represents
a ratio of 3:1 nitrogen between the control- and nitrogen limiting media.

60
3.2.3.2 Replacement of nutrient media
The nutrient media were replaced every two weeks to ensure fresh, accurate and
precise levels of nutrients to the plants. The nutrients were also replaced to avoid
acidification of the media and to limit the circulation of possible diseases.
3.2.3.3 Electrical Conductivity (EC)
The Electrical Conductivity (EC) of the nutrient media were constantly monitored
using a Philips PW 9526 Digital Conductivity meter (milliSiemens.cm-1). This was
done to ensure that accurate and correct levels of nutrients were obtained.
3.2.3.4 pH
The pH of the nutrient solutions were constantly monitored using a Radiometer
Copenhagen PHM85 Precision pH Meter.
3.2.4 Treatments
The different treatments are listed in Table 3.2. It entails that both control plants
and plants grown under nitrogen limiting conditions were additionally sprayed
with 0.5% urea solution, singly or mixed (“packed”) with Pheroids. In addition, the
nitrogen deficient plants were also sprayed with a 1% urea solution, singly and
mixed with Pheroids. Pheroids only was also a treatment sprayed on the plants
grown under nitrogen limiting conditions. The 0.5% urea solution was prepared
by dissolving 2 g urea in 400 ml distilled water. The 1% urea solution was
prepared by dissolving 4 g urea in 400 ml distilled water. In order to “pack”
Pheroids with urea, 2 g urea was dissolved in 400 ml distilled water (0.5% urea
solution), where after 2 ml of Pheroids was added and stirred on a magnetic
stirrer for 30 minutes. To obtain a 1% urea Pheroids mixture, 4 g of urea and 2 ml
of Pheroids was dissolved in 400 ml distilled water and stirred on a magnetic

61
stirrer for 30 minutes. The Pheroids treatment consisted of 2 ml Pheroids in 400
ml distilled water.
Table 3.2 Foliar applications of urea solutions, singly or mixed with Pheroids, to
tomato plants grown under control- and nitrogen limiting hydroponic
conditions.
Treatments
Foliar treatment Nitrogen adequate
(control) (210 ppm)
Control None
0.5 % Urea 2 g Urea dissolved in 400 ml dist. H2O
0.5 % Urea / Pheroids 2 g Urea + 2 ml Pheroids dissolved in 400 ml
dist. H2O
Nitrogen limiting (70 ppm)
Nitrogen limiting None
0.5 % Urea 2 g Urea dissolved in 400 ml dist. H2O
1 % Urea 4 g Urea dissolved in 400 ml dist. H2O
0.5 % Urea / Pheroids 2 g Urea + 2 ml Pheroids dissolved in 400 ml
dist. H2O
1 % Urea / Pheroids 4 g Urea + 2 ml Pheroids dissolved in 400 ml
dist. H2O
Pheroids 2 ml Pheroids in 400 ml dist. H2O
3.2.5 Pest Control
Hydroponically grown tomatoes are exceptionally prone to insects due to the
favorable micro–environment inside the greenhouse. As soon as pests or
diseases were noticed, applicable pest control measures were taken. Metasystox
were used to control aphids, Kelthane for russet mites as well as White fly and
Funginex for fungal infections. The insecticides were prepared according to the
recommendations of the manufacturer and are given in Table 3.3.

62
Table 3.3 Insecticides used to control diseases.
Insecticide Biotic disease Concentration used
Metasystox Aphids 2.5 ml.L-1
Kelthane AP Russet mite, White fly 2 g.L-1
Funginex Fungal pathogens 1.5 ml.L-1
3.2.6 Physical Parameters
Nitrogen is a key element in overall plant metabolism and when it becomes
limited, vegetative development and yield of the plants are affected. Physical
parameters such as plant height, fruit and flower formation, fruit mass and
diameter as well as generative development of the plants were recorded weekly
to determine the effect of a nitrogen deficiency and the subsequent corrective
treatments on vegetative growth, generative development and yield.
3.2.6.1 Vegetative growth (plant height)
Plant height was measured on a weekly basis using a measuring tape. The
distance from the origin of the stem (gravel level) to the utmost point of the apical
bud was taken as parameter for plant height. Measurements were discontinued
when the plants reached the roof of the greenhouse (± 2 m) which prevented
further accurate measurements.
3.2.6.2 Generative development (bud, flower and fruit formation)
To measure generative development of the plants, the time span between
transplantation and the formation of the first buds, open flowers, fruits appearing
and first fruits harvested were recorded. Buds were recorded when it was 5 mm
in length. Flowers were recorded when the centre of the flower was visible or fully
open. Appearing fruit were recorded when a size of 5 mm was reached.

63
The time span between transplantation and when the first fruits were harvested
was finally recorded.
3.2.6.3 Yield (number of fruit, mass and size)
The number of fully developed red fruits, consumer ready, were harvested and
recorded on a weekly basis for the duration of the harvest period. Each fruit was
accurately weighed on a Shimadzu AUW 320 analytical balance. The individual
fruit harvested for a treatment were combined to give the total yield for the week,
and finally for the harvest period.
Fruit size (diameter) was accurately measured to the nearest millimeter using a
caliper (micrometer). The average of three consecutive diameter readings was
taken to represent average fruit size.
3.2.7 Quality Parameters
Like physical parameters, quality parameters are also influenced by available
nitrogen. Leaf protein content gives a direct indication of nitrogen content in the
plant (Maynard & Loosli, 1969). Further, quality parameters are also of crucial
importance in determining overall fruit quality and taste. Fruit quality is
determined by fruit acidity (pH; Verkerke & Kersten, 2000), electrical conductivity,
soluble solid content (Ya Ling & Stanghellini, 2001), sugar content (% Brix)
(Monforte et al., 2000) and moisture content. Moreover, as an anti-oxidant,
lycopene content adds to overall fruit quality (Blum et al., 2005). These quality
parameters were used to determine the effect of a nitrogen deficiency and the
subsequent corrective treatments on leaf protein content and fruit quality.

64
3.2.7.1 Extraction and determination of protein content of leaves
Leaf material was sampled from both the bottom, older leaves, and the top,
younger leaves, of each plant. Two grams of leaf material was homogenized in
10 ml of ice cold (4ºC) extraction buffer (m:v ; 1 g : 5 ml) for 30 seconds using a
Polytron electric homogenizer. The extraction buffer consisted of 12.5 mM Tris-
HCl (pH 6.8), containing 2 mM EDTA, 14 mM ß-2-Mercapto-ethanol and 2 mM
PMSF. The latter two were added before each protein extraction procedure. An
aliquot of the homogenate was then centrifuged in a cooled bench centrifuge at
12 000 r.p.m for 10 minutes. The clear supernatant was used for protein assays.
The protein concentration of the extracts was determined using the method of
Bradford (1976). A clean micro-plate was prepared as follows:
Table 3.4 Preparation of a micro-plate for protein assays. Gamma globulin
(0.5 mg.ml-1) was used as standard.
Blank (µl) STD (µl) Sample (µl)
H2O 160 150 150
Standard - 10 -
Sample - - 10
Bio-Rad 40 40 40
Total volume 200 200 200
After addition of the Bio-Rad dye, the plate was mixed on a rotational shaker and
left for 10 minutes before absorbance values was recorded at 595 nm with a Bio-
Rad (Model 3550) micro plate reader.

65
3.2.7.2 Leaf and fruit moisture content
The fresh mass of 15 discs, cut from leaves with a 1 cm diameter stainless steel
borer, was recorded. These discs were then dried to a constant mass at 72 ºC for
72 hours in a Labotec oven, where after the final dry mass of the leaf discs were
recorded.
Fresh tissue slices of approximately 10 g, representative of the fruits overall
condition, were obtained. These slices were then dried to a constant mass at
72 ºC for at least 72 hours in a Labotec oven. The final dry mass of the slices
were then recorded.
The moisture content of the leaf and fruit tissue were calculated using the
following equation:
{(Fresh mass – Dry mass) ÷ Fresh mass} X 100
= % Moisture content
Leaf dry mass content was used to express leaf protein content. Fruit dry mass
content was used to express lycopene content.
3.2.7.3 Fruit pH, EC, % Brix
Some parameters were used to determine fruit quality. These parameters were
measured on a two weekly basis from the onset of harvest for a period of 16
weeks. These parameters were pH, EC and Brix index (% total sugars or TSS).
Fruit were chosen randomly from each plant and all quality parameters were
obtained from the same fruit.

66
Fresh fruit were sliced in half and were homogenized for 30 seconds, using a
Polytron electric homogenizer to obtain a liquid puree, which was kept on ice.
The pH of the resultant puree was measured with a Radiometer Copenhagen
PHM85 Precision pH Meter. The puree was mixed on a magnetic stirrer until a
constant pH was recorded.
The EC of the puree was recorded using a Philips PW 9526 Digital Conductivity
meter with a cell constant of 1.52 cm-1. The puree was mixed on a magnetic
stirrer until a constant EC (mS.cm-1) was obtained.
The % Brix of 60 µl puree samples was determined using an ATAGO
refractometer by following the instructions of the manufacturer. The refractometer
was calibrated using distilled water. Each % Brix is taken as the equivalent of
1 g sugar and other solids per 100 g of juice. A high Brix % will indicate a high
sugar and other solid content of the puree (Baxter et al., 2005).
3.2.7.4 Lycopene
Lycopene content was an additional biochemical parameter used to measure fruit
quality. Lycopene content was also determined on a two weekly basis from the
same fruit used to determine pH, EC, % Brix (see 3.2.7.3).
The lycopene content of the fruits was determined according to the reduced
volume method of Davies et al. (2002). Ten g of fruit tissue was added to a test
tube containing 10 ml of distilled water (1:1; m/v). The content was homogenized
for 30 seconds, using a Polytron electric homogenizer. An aliquot containing 0.5
g of the puree was then added to a test tube containing a mixture of 5 ml 95 %
ethanol, 10 ml hexane and 5 ml acetone, containing 0.05 % (w/v) butylated
hydroxytoluene (BHT). The tubes were sealed with para-film, thoroughly mixed
on a bench vortex and extracted on an orbital shaker at 180 rpm for 15 minutes.

67
After rotation, 3 ml de-ionized water was added to the tubes and replaced on the
orbital shaker for 5 minutes. After extraction, the tubes were left at room
temperature (22ºC) for 15 minutes in the dark for phase separation to occur
before the clear yellowish supernatant (hexane layer) was collected. The tubes
were kept in the dark on ice until all samples were extracted. This was done to
avoid the possible cis-trans isomerization induced by light (Nguyen & Schwartz,
1999; Xianquan et al., 2005).
The supernatant (hexane upper layer) was used to determine the absorbance at
503 nm using a Phillips Pye Unicam SP8 – 400 UV/VIS Spectrophotometer.
Taking all variables of this specific extraction procedure into account, the
lycopene concentration of the tissue was calculated using the following equation
(Davies et al., 2002):
Lycopene = A503 x 536.9 g x 1 l _ x 103 ml x 10 ml_
17.2 x 104.M.cm mole 103 ml 1 g kg tissue
= A503 x 0.0312
kg tissue
= A503 x 31.2
g tissue
= mg lycopene.g-1 tissue
Where A503 is the absorbance at 503 nm and 17.2 x 104.M.cm-1 the molar
absorbance coefficient for lycopene. The molecular weight (mw) of lycopene is
536.9 g.mole-1 (Davies et al., 2002)

68
CHAPTER 4
RESULTS
Eight week old tomato seedlings were transplanted into an ebb- and flow
hydroponic setup consisting of nitrogen adequate (210 ppm) and nitrogen limiting
conditions (70 ppm). The trial was conducted in a greenhouse in hydroponic
setup to accurately control nitrogen levels. The effect of nitrogen limiting
conditions on vegetative- , generative growth and yield were recorded. Moreover,
plants were sprayed with 0.5% and 1% urea solutions, singly or mixed with
Pheroids, as corrective treatments to alleviate the effect of nitrogen limiting
conditions (see 3.2.4). Furthermore, the changes in greenhouse conditions were
deemed important and were measured and recorded over the entire trial period.
4.1 GREENHOUSE CONDITIONS
Plants grown in a greenhouse are still subjected to external factors affecting
overall plant growth. These factors include temperature, light intensity and
relative humidity. By controlling these environmental factors within limits, allow
that the effect of the different treatments could be monitored accurately.
The study was conducted in a greenhouse under controlled conditions, optimum
for tomato production. Different parameters, namely light intensity, temperature
and relative humidity (% RH), were measured to follow variations in these
parameters during the experimental period.

69
Tem
pera
ture
(o C
)
0
10
20
30
40
Ligh
t Int
ensi
ty (
µE
.m-2
.s-1
)
0
1000
2000
3000
4000
5000
0 50 100 150 200 250 30020
40
60
80
100
Rea
ltive
Hum
idity
(%
RH
)
B: Temperature
A: Light Intesity
C: Relative Humidity
DAT
Figure 4.1 Changes in light Intensity (A), Temperature (B) and Relative Humidity
(C) in the greenhouse during the duration of the trial period.
DAT = Days after transplantation.

70
Light intensity was measured every two days at 12:00 at three different localities
to obtain an average light intensity within the greenhouse during the trial. The
light intensity remained relatively constant at approximately 3000 µE.m-2.s-1 for
the first half of the trial (summer) and decreased as winter approached. It is
expected that solar radiation is less during winter due to the trajectory of the sun
in relation to the earth. The start of spring from day 200 is obvious (Fig. 4.1 A).
All the plants were subjected to these fluctuations in light during the trial period.
The temperature and relative humidity was also measured every two days at
12:00 at three different localities within the greenhouse. The temperature proved
to be relatively constant throughout the trial period as it was regulated between
17ºC (night) and 27ºC (day). The average temperature at 12:00 was
approximately 22ºC for the duration of the experimental period (Fig. 4.1 B).
Temperature fluctuations were small and varied within margins.
The relative air humidity (%RH) at 12:00 inside the greenhouse varied between
55% and 96%. The average relative humidity at 12:00 was approximately 86%
for the duration of the experimental period (Fig. 4.1 C). A clear relationship
between % RH and air temperature recorded at 12:00 is apparent as the periods
with above average % RH correlates with the periods of above average
temperatures and vice versa. All the plants were subjected to these fluctuations
in temperature and humidity during the experimental period. Relative humidity
fluctuations were small and varied within margins.
4.2 HYDROPONIC SETUP
4.2.1 Electrical Conductivity (EC) of nutrient medi a
Variation in electrical conductivity (EC) is an important parameter used to
determine the availability of dissolved salts in the nutrient media, which inevitably
affects overall plant growth, metabolism, fruit yield and quality (Dorai et al.,

71
EC
(m
S.c
m-1
)
0.5
1.0
1.5
2.0
2.5
3.0
WAT
0 10 20 30 400.5
1.0
1.5
2.0
2.5
EC After ReplacementAverage EC
WAT
0 10 20 30 400.5
1.0
1.5
2.0
2.5
EC
(m
S.c
m-1
)
0.5
1.0
1.5
2.0
2.5
3.0A: Control B: N Deficient (Bin 1)
C: N Deficient (Bin 2) D: N Deficient (Bin 3)
2001). The EC for all the reservoirs were measured after both replenishment and
replacement of nutrient media (see 3.2.3.2).
Figure 4.2 Fluctuations in electrical conductivity (EC) over the trial period. A =
Control; B – D = Nitrogen limiting media in three different reservoirs.
Arrows ( ) indicate time of complete nutrient replacement.
WAT = Weeks after transplantation.
The EC of the nutrient media varied between 1.4 and 2.5 milliSiemens.cm-1, with
an acceptable average EC of approximately 1.7 milliSiemens.cm-1 for both
nitrogen deficient- and control media. The initial EC values were low due to half
strength used for the first two weeks after transplantation.

72
EC
(m
S.c
m-1
)
0.0
0.5
1.0
1.5
2.0
2.5
3.0
Week of media replacement
0.0
0.5
1.0
1.5
2.0
2.5
3.0
3.5
EC beforeEC after
A: Control
B: Nitrogen Deficient
7 13 22 27 36 41
Figure 4.3 Average EC of the control- (A) and nitrogen limiting media (B) before
and after complete replacement at weeks 7, 13, 22, 27, 36 and 41
after transplantation.

73
pH6.2
6.4
6.6
6.8
7.0
7.2
7.4
7.6
7.8
8.0
WAT
0 10 20 30 406.0
6.26.46.6
6.87.07.2
7.47.6
7.8pH
6.2
6.4
6.6
6.8
7.0
7.2
7.4
7.6
7.8
8.0
WAT
0 10 20 30 406.2
6.4
6.6
6.8
7.0
7.2
7.4
7.6
7.8
pH after replacementAverage pH
B: N Deficient (Bin 1)
C: N Deficient (Bin 2) D: N Deficient (Bin 3)
A: Control
The nutrient media were not only replenished, but also completely replaced at
weeks 7, 13, 22, 27, 36 and 41 to dispose of any possible harmful wastes. After
complete replacement of the nutrient media the EC of the nutrient media was
lower than before replacement. This possibly indicated an accumulation of
dissolved charged nutrients and other molecules over time before replacement,
due to a high transpiration rate or a possible buildup of charged contaminants
(Fig. 4.3).
4.2.2 pH of nutrient media
Changes in pH is another parameter used to determine the quality of the nutrient
media, as pH affects the solubility of nutrients in solution. The pH was measured
after both replenishment and complete replacement of the nutrient media.
Figure 4.4 Variation in the pH of the nutrient media after replenishment and
complete replacement. (A = Control; B – D = Nitrogen limiting media.
Arrows ( ) indicate the time of complete nutrient replacement).
WAT = Weeks after transplantation.

74
The pH varied between pH 6.2 and pH 7.3. The average pH of the control
nutrient medium was approximately 6.7 and for the nitrogen limiting media
approximately 6.8 for the greater part of the trial period. In addition, the pH of all
the media used tends to decline slightly during the trial.
2D Graph 1
Week of media replacement
pH
0
2
4
6
8
pH before pH after
0
2
4
6
8
A: Control medium
B: Nitrogen Deficient media
7 13 22 27 36 41
Figure 4.5 Average pH of the control- (A) and nitrogen limiting media (B) directly
before and after replacement at weeks 7, 13, 22, 27, 36 and 41 after
transplantation.

75
Moreover, it was found that the pH directly after replacement of the nutrient
media was not lower than before replacement at the specified time intervals
during the trial (Fig. 4.5), as was observed for EC (Fig. 4.3). No definite pattern in
the variation in pH before and after replacement was evident (Fig. 4.5).
4.2.3 Nutrient media consumed
The exact volume of nutrient media replenished and replaced, were recorded
over the experimental period of 44 weeks. The volume of nutrient media
consumed during the trial by the control plants and plants grown under nitrogen
limiting conditions was subsequently calculated (Fig. 4.6).
During the initial stages of the experimental period, up to five weeks after
transplantation, no difference in the volume of nutrient media consumed was
observed between the control- and nitrogen deficient plants. Thereafter, the
control plants consumed substantially more nutrient media during the remainder
of the experimental period than the nitrogen deficient plants. Control plants
consumed approximately 315 liter media.plant-1, compared to the 236 liter
media.plant-1 for the plants grown under nitrogen limiting conditions. This was
approximately 79 liter media.plant-1 more for a control plant over the period of 44
weeks.

76
W A T
0 1 0 2 0 3 0 4 0 5 0
Nut
rient
vol
ume
cons
umed
(L.
plan
t-1)
0
5 0
1 0 0
1 5 0
2 0 0
2 5 0
3 0 0
3 5 0
N itro g e n L im itin gN itro g e n A d e q u a te (C o n tro l)
3 1 5 L .p la n t -1
2 3 6 L .p la n t -1
Figure 4.6 Nutrient consumption by control – and nitrogen deficient plants
during the trial. WAT = Weeks after transplantation.
4.3 VEGETATIVE DEVELOPMENT OF PLANTS GROWN UNDER C ONTROL-
AND NITROGEN LIMITING CONDITIONS.
To determine the effect of nitrogen limiting conditions, using a controlled
hydroponic setup, the initial vegetative development of the plants, prior to harvest
was compared. Control plants were grown under optimum nitrogen levels of 210
ppm, while nitrogen deficient plants were grown under nitrogen limiting levels of
70 ppm.
The aim of the study was to alleviate the effect nitrogen limiting conditions may
have on growth, development and yield by treating nitrogen deficient plants with
additional nitrogen using 0.5% and 1% urea foliar sprays. Another aim was to
possibly enhance the absorption of urea by mixing it with Pheroids before
application. Plant height and leaf protein content was used as parameters to
monitor vegetative development.

77
4.3.1 Plant height
To determine the effect of nitrogen limiting conditions and the subsequent
corrective treatments on vegetative development, the height of the plants was
recorded for 20 weeks from transplantation, until the structure (roof height) of the
greenhouse limits growth, and therefore accurate measurements.
Both the control- and nitrogen deficient plants increased in height linearly
throughout the trial period of 20 weeks (Fig. 4.7). During the initial stages of
establishment, no differences between the control- and nitrogen deficient plants
could be observed. However, during the phase of active fruit development, from
week 8 onwards, the control plants outperformed the nitrogen deficient plants
(Fig. 4.7 A & Fig. 4.8 B) in terms of vegetative growth.
Spraying nitrogen deficient plants with 0.5% and 1% urea solutions, either singly
or mixed with Pheroids, have no obvious stimulatory effect on vegetative growth
(plant height) of the plants during the initial phases, as well as during the period
of active fruit development (Fig. 4.7 B & Fig. 4.8 A & B).
In addition, spraying nitrogen deficient plants with Pheroids only appear to impair
vegetative growth during the later stage, when active fruit development occurred.
Spraying control plants with a 0.5% urea solution, singly or mixed with Pheroids,
had no stimulatory effect on vegetative growth of these plants under conditions of
optimum nitrogen supply (Fig. 4.7 B & Fig. 4.8 B).

78
Pla
nt H
eigh
t (cm
)
0
50
100
150
200
250
WAT
0 5 10 15 20
Pla
nt H
eigh
t (cm
)
0
50
100
150
200
ControlN DeficientN Deft + 0.5% UN Def + 0.5% U P N Def + 1% UN Def + 1% U P N Def + PheroidsControl + 0.5% UControl + 0.5% U P
A
B
__Generative development__________________
___ Harvest____
Figure 4.7 Changes in plant height over the experimental period. The arrows
indicate when generative development and subsequent harvest
period occur, as shown in Table 4.2.
WAT = Weeks after transplantation.

79
0
50
100
150
Con
trol
N D
efic
ient
N D
ef +
0.5
% U
N D
ef +
0.5
% U
P
N D
ef +
1 %
U
N D
ef +
1 %
U P
N D
ef +
Phe
roid
s
Con
trol
+ 0
.5 %
U
Con
trol
+ 0
.5 %
U P
B: Week 15
Pla
nt H
eigt
h (c
m)
0
20
40
60
80A: Week 5
B: Week 15
Figure 4.8 Average height of plants during early development (A: week 5) and
the start of the harvest period (B: week 15).

80
4.3.2 Initial protein content of leaves
The protein content of both the top and bottom leaves was recorded for the first 8
weeks after transplantation. Protein content can be a measure of the nitrogen
content (Maynard & Loosli, 1969), because nitrogen makes out a large part of
proteins (Salisbury & Ross, 1991). When nitrogen is limited in supply, the
nitrogen already present in the plant is translocated from the older to the younger
active growing tissues in the form of amino acids (Salisbury & Ross, 1991;
Ireland, 1990). As a result of this, nitrogen deficiency symptoms are first
observed in older tissues (Gilbert & Hadfield, 1987, Sutherland & Sutherland,
1987).
Thus, by determining the protein content in the bottom and top leaves will give a
good indication of the re-allocation of nitrogen within the plant, as well as the
nitrogen content present in different parts of the plant. By monitoring these
protein levels in leaves, the adverse effects of nitrogen on plant metabolism
(vegetative and generative growth) can be determined.

81
0
100
200
300
400
500
WAT
0 2 4 6 8
Pro
tein
con
tent
(m
g. g
Dm
-1)
0
100
200
300
400
0
100
200
300
400
500A: Top
C: Top
B: Bottom
D: Bottom
WAT
0 2 4 6 8
Pro
tein
con
tent
(m
g. g
Dm
-1)
0
100
200
300
400
ControlNitrogen DeficientNitrogen Def + 0.5% UNitrogen Def + 0.5% U PNitrogen Def + 1% UNitrogen Def + 1% U PNitrogen Def + PheoridsControl + 0.5% UControl + 0.5% U P
D: Bottom
Figure 4.9 Protein content of top and bottom leaves early in vegetative
development. WAT = Weeks after transplantation.
The protein content of both top and bottom leaves of control– and nitrogen
deficient plants increased during this trial of 8 weeks, more so in the control
plants than in the nitrogen deficient plants (Fig. 4.9 A & B). Moreover, the protein
content of the top leaves from control plants is also visibly higher than that of the
nitrogen deficient plants (Fig. 4.9 A). This difference in protein content was less
pronounced for the bottom leaves of these plants (Fig 4.9 B). In addition, the top
leaves had a considerably higher protein content than the bottom leaves (Fig. 4.9
A & B).

82
Spraying nitrogen deficient plants with 0.5% and 1% urea solutions, to supply
these plants with additional nitrogen, resulted in an increase in the protein
content for all the leaves, but these solutions failed to fully alleviate the effect a
nitrogen deficiency had on the protein content of top (Fig. 4.9 C) and bottom
leaves (Fig 4.9 D). Mixing these 0.5% and 1% urea solutions with the novel
compound, Pheroids, resulted in a slightly higher leaf protein content, opposed to
the plants treated with urea only. This stimulation is, however, very marginal.
Treating nitrogen deficient plants with Pheroids only, gave similar results than
when it was mixed with the urea solutions. Thus, it appeared that Pheroids is
ineffective in enhancing the transport and absorption of urea, and the subsequent
stimulation of vegetative growth.
Spraying control plants, which was grown under 210 ppm nitrogen levels, with a
0.5% urea solution, singly or mixed with Pheroids, resulted in a small increase in
the protein content of the top leaves (Fig 4.9 C), but had no visible effect on the
protein content of the bottom leaves (Fig 4.9 D). This is indicative that even
under conditions of optimum nitrogen supply, control plants reacted to the
additional source of nitrogen, supplied by means of the 0.5% urea and 0.5%
urea / Pheroids foliar sprays.

83
Table 4.1 A comparison in leaf protein content for top- and bottom leaves for the different treatments from
transplantation (week 0) to week 8.
Treatments Protein content
mg.g Dm -1(a) % Increase in protein
content (b) Ratio Bottom : Top(c) Control : Treated Plants (d)
Botto m Top Bottom Top Week 8 Bottom Top Week 0 (a) 48 55 - -
Week 8 Control 165 349 344 634 1 : 2.11 1 1
N Deficient 130 249 271 453 1 : 1.92 0.79 0.71
N Def + 0.5 % Urea 102 234 212 425 1 : 2.29 0.62 0.67
N Def + 0.5 % U / P 150 258 312 469 1 : 1.72 0.91 0.74
N Def + 1 % Urea 144 276 300 502 1 : 1.92 0.87 0.79
N Def + 1 % U / P 140 318 292 578 1 : 2.27 0.85 0.91
N Def + Pheroids 138 274 287 498 1 : 1.98 0.84 0.79
Control + 0.5 % Urea 176 389 367 707 1 : 2.21 1.07 1.11
Control + 0.5 % U / P 169 337 352 612 1 : 1.99 1.02 0.97
a) Initial protein content of leaves at week 0 before any treatments
b) Increase (%) in leaf protein content from week 0 to week 8
c )Ratio in protein content between bottom- and top leaves after 8 weeks. Ratio in week one: 1 : 1.14.
d) Ratio in protein content between bottom- and top leaves of treated plants compared to control pants.
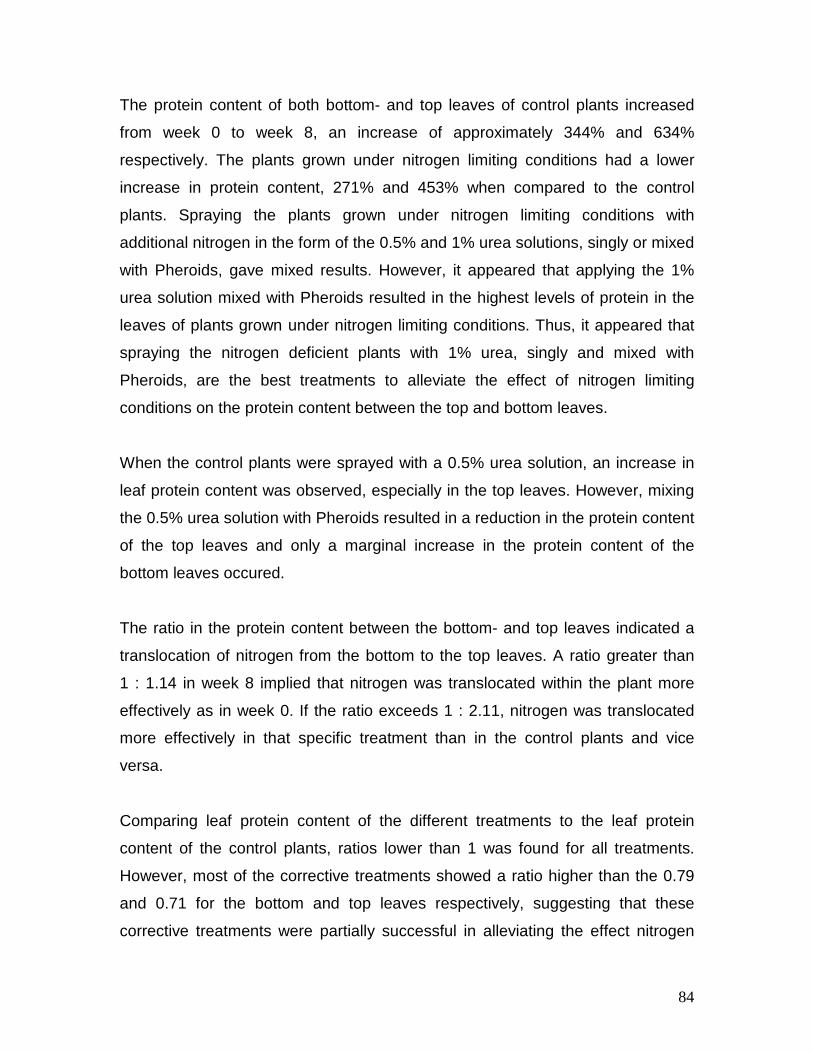
84
The protein content of both bottom- and top leaves of control plants increased
from week 0 to week 8, an increase of approximately 344% and 634%
respectively. The plants grown under nitrogen limiting conditions had a lower
increase in protein content, 271% and 453% when compared to the control
plants. Spraying the plants grown under nitrogen limiting conditions with
additional nitrogen in the form of the 0.5% and 1% urea solutions, singly or mixed
with Pheroids, gave mixed results. However, it appeared that applying the 1%
urea solution mixed with Pheroids resulted in the highest levels of protein in the
leaves of plants grown under nitrogen limiting conditions. Thus, it appeared that
spraying the nitrogen deficient plants with 1% urea, singly and mixed with
Pheroids, are the best treatments to alleviate the effect of nitrogen limiting
conditions on the protein content between the top and bottom leaves.
When the control plants were sprayed with a 0.5% urea solution, an increase in
leaf protein content was observed, especially in the top leaves. However, mixing
the 0.5% urea solution with Pheroids resulted in a reduction in the protein content
of the top leaves and only a marginal increase in the protein content of the
bottom leaves occured.
The ratio in the protein content between the bottom- and top leaves indicated a
translocation of nitrogen from the bottom to the top leaves. A ratio greater than
1 : 1.14 in week 8 implied that nitrogen was translocated within the plant more
effectively as in week 0. If the ratio exceeds 1 : 2.11, nitrogen was translocated
more effectively in that specific treatment than in the control plants and vice
versa.
Comparing leaf protein content of the different treatments to the leaf protein
content of the control plants, ratios lower than 1 was found for all treatments.
However, most of the corrective treatments showed a ratio higher than the 0.79
and 0.71 for the bottom and top leaves respectively, suggesting that these
corrective treatments were partially successful in alleviating the effect nitrogen

85
limiting conditions had on the protein content of the leaves. The control plants
which were sprayed with the 0.5% urea solution, singly or mixed with Pheroids,
showed similar but slightly higher leaf protein content than the control plants.
4.4 GENERATIVE DEVELOPMENT
The generative development of the plants was recorded for a period until the first
fruits were harvested. This was done to determine the effect of a nitrogen
deficiency and the subsequent corrective treatments on generative development
of the plants. A delay in generative development, caused by sub-optimal supply
of nitrogen, may ultimately affect yield and net income.
Table 4.2 Generative development as influenced by a nitrogen deficiency and
the addition of extra nitrogen through urea and Pheroids foliar
applications.
Treatments
Time lapse from transplantation to the phase of the first:
buds open flowers fruits (5mm) fruits harvested
DAT DAT DFPD * DAT DFPD * DAT DFPD *
Control 27 ± 0 35 ± 2 8 47 ± 5 12 112 ± 9 65 Nitrogen Deficient 30 ± 3 39 ± 4 9 55 ± 4 16 118 ± 0 63
N Def + 0.5% Urea 28 ± 1 35 ± 2 7 48 ± 4 13 114 ± 8 66 N Def + 0.5% U / P 28 ± 0 37 ± 2 9 52 ± 4 15 109 ± 8 57 N Def + 1% Urea 28 ± 0 37 ± 3 9 52 ± 8 15 109 ± 8 57 N Def + 1% U / P 28 ± 0 35 ± 3 7 48 ± 8 13 114 ± 8 66 N Def + Pheroids 28 ± 1 35 ± 2 7 48 ± 4 13 109 ± 8 61 Control + 0.5% Urea 28 ± 0 36 ± 0 8 50 ± 0 14 105 ± 0 55 Control + 0.5% U / P 28 ± 0 36 ± 0 8 50 ± 0 14 112 ± 0 62
* DFPD = Time lapse from previous phase of development
DAT = Day(s) after transplantation

86
The first buds appeared 27 days after transplantation on control plants (Table
4.2). It appeared that a nitrogen deficiency affected generative development as
the first buds on the plants grown under nitrogen limiting conditions appeared
only 30 days after transplantation. Compared to control plants, a nitrogen
deficiency thus delayed the formation of the first buds by three days. Spraying
these nitrogen deficient plants with 0.5% and 1% urea solutions, singly or mixed
with Pheroids, all stimulated bud formation, as the first buds appeared one day
earlier, at day 28, for these treated plants (Table 4.2).
The time for the first buds to develop into open flowers took 8 days for the control
plants, while this process took one day longer in the nitrogen deficient plants.
Spraying these nitrogen deficient plants with 0.5% urea, 1% urea mixed with
Pheroids and Pheroids alone all stimulated the process and resulted in open
flowers after seven days, outperforming the control plants by one day. Spraying
nitrogen deficient plants with 0.5% urea mixed with Pheroids and 1% urea had no
effect on this process. Similar results were found by applying additional 0.5%
urea, singly or mixed with Pheroids, to control plants. Thus, applications of urea
singly, or mixed with Pheroids had no obvious effect on the time lapse from bud
formation to opening of the flowers.
It took 12 days from open flowers for the first fruits of 5 mm in diameter to form in
control plants. This developmental process was retarded by four days in plants
grown under nitrogen limiting conditions. Spraying these nitrogen deficient plants
with the additional nitrogen corrective sprays all stimulated the formation of fruit.
All these treatments took at least two days less than the nitrogen deficient plants
to develop fruit. Foliar application of 0.5% urea, singly or mixed with Pheroids, to
control plants grown under optimal nitrogen conditions failed to further stimulate
fruit formation.

87
A time lapse of 65 days occurred before the fruits developed to a stage when it
was harvested in control plants. In contrast, it took only 63 days before the fruits
were harvested from nitrogen deficient plants. Treating nitrogen deficient plants
with a 0.5% urea solution or a 1% urea solution mixed with Pheroids delayed fruit
maturation by three days in nitrogen deficient plants. However, applying 0.5%
urea solution mixed with Pheroids and 1% urea solution to the nitrogen deficient
plants shortened the period of fruit maturation from 63 days to 57 days. When
control plants were treated with additional nitrogen, a similar shortening of fruit
maturation period was seen. Treating control plants with 0.5% urea mixed with
Pheroids shortened fruit maturation period from 65 days to 62 days. Applying
0.5% urea singly to control plants shortened this period by 10 days.
Taking the total time lapse from transplantation to fruit harvest into account,
control plants took 112 ± 9 days before the first fruits were harvested. In contrast,
it took 118 days before any fruits could be harvested from the nitrogen deficient
plants. All the corrective treatments used shortened the time lapse from
transplantation to harvest by at least four days. Applying 0.5% urea mixed with
Pheroids, 1% urea and Pheroids singly shortened this period with nine days,
which is three days less than in the control plants. In addition, an improvement of
seven days was observed when control plants were sprayed with 0.5% urea.
In Table 4.3, the time gain or loss by the different treatments are summarized. All
treatments which supplied additional nitrogen to nitrogen deficient plants reduced
the time from transplantation to harvest, indicating that these corrective
treatments markedly alleviated the negative effect nitrogen limiting conditions
had on generative development.

88
Table 4.3 Time gain and loss when control- and nitrogen deficient plants were
sprayed with 0.5% and 1% urea solutions, singly or mixed with Pheroids.
Treatments Time from
transplantation to harvest (Days)
Time gain / loss i.t.o
Control plants *
Control 112 ± 9 0
Nitrogen Deficient 118 ± 0 + 6
N Def + 0.5% Urea 114 ± 8 + 2
N Def + 0.5% Urea / P 109 ± 8 - 3
N Def + 1% Urea 109 ± 8 - 3
N Def + 1% Urea / P 114 ± 8 + 2
N Def + Pheroids 109 ± 8 - 3
Control + 0.5% Urea 105 ± 0 - 7
Control + 0.5% Urea / P 112 ± 0 0
* Positive values indicate a delay in time lapse from transplantation to fruit harvest.
Negative values indicate a gain in time from transplantation to harvest when
compared to control plants.
4.5 YIELD
The number, mass and size of fruits harvested were the parameters used to
determine the effect of a nitrogen deficiency on yield. The principle aim of the
study was to determine whether the application of additional nitrogen in the form
of foliar sprays of urea solutions, singly or mixed with the novel compound,
Pheroids, was successful in alleviating the possible negative effect a nitrogen
deficiency might have on yield. Furthermore, by applying these urea solutions,
singly or mixed with Pheroids, to control plants may result in an even higher
yield.

89
4.5.1 Number, mass and size of fruits harvested
Fruit number, mass and size was recorded over the harvest period of 25 weeks.
WOH
0 5 10 15 20 25
Avg
mm
.Fru
it-1
10
20
30
40
50
60
WOH
0 5 10 15 20 25 30
Avg
mm
.Fru
it-1
10
20
30
40
50
60
Avg
g.F
ruit-1
0
20
40
60
80
100
120
Avg
g.F
ruit-1
0
20
40
60
80
100
120
ControlNitrogen DeficientN Def + 0.5% UreaN Def + 0.5% Urea PheoridsN Def + 1% UreaN Def + 1% Urea PheoridsN Def + PheoridsControl + 0.5% UreaControl + 0.5% Urea Pheroids
Avg
n F
ruit.
plan
t-1
0
10
20
30
Avg
n F
ruit.
plan
t-1
0
10
20
30A: Number B: Number
C: Mass D: Mass
E: Size E: Size
Figure 4.10 Average weekly number of fruit harvested (A & B), fruit mass (C &
D) and fruit size (E & F) over a trial period of 25 weeks.

90
The average number of fruit harvested from control plants steadily increased up
to week 11 after transplantation, followed by a decline in the number of fruit
harvested for the remainder of the harvest period. Fruit from nitrogen deficient
plants were initially harvested a week later and produced the highest number of
fruit harvested in week 13, two weeks later than the control plants. In addition,
the number of fruit produced during these periods is less in the plants grown
under nitrogen limiting conditions than in the control plants. Thus, the control
plants produced the highest number of fruit earlier in the harvest period than the
nitrogen deficient plants (Fig. 4.10 A).
By applying urea solutions, singly or mixed with Pheroids, to nitrogen deficient
plants, the highest number of fruit was harvested at the same time as the control
plants. This implies that the foliar application of urea solutions, singly or mixed
with Pheroids, improved and shortened the time lapse from transplantation to the
time when the highest number of fruit were harvested (Fig. 4.10 B).
An overall decline in fruit mass harvested was observed for fruit from control
plants as the harvest period progressed (Fig. 4.10 C). This appeared to be a
natural occurrence in tomato plants where bigger fruit are harvested at the start
of the harvest period with a subsequent decline in mass towards the end of the
harvest period. This also corresponds to a reduction in fruit size (Fig. 4.10 E). In
contrast, the fresh mass of the fruits harvested from the plants grown under
nitrogen limiting conditions remained fairly constant during the harvest period.
Moreover, on average the control plants produced heavier fruit (Fig. 4.10 C), but
not necessarily bigger fruits (Fig. 4.10 E), than the plants grown under nitrogen
limiting conditions (Fig 4.10 C). Spraying these nitrogen deficient plants with the
0.5% and 1% urea solutions, singly or mixed with Pheroids, marginally enhanced
the mass of the fruit harvested (Fig. 4.10 D), but failed to completely alleviate the
effect of nitrogen limiting conditions.

91
The control plants had slightly bigger fruit than the nitrogen deficient plants (Fig.
4.10 E). Spraying these nitrogen deficient plants with urea, singly or mixed with
Pheroids, slightly improved fruit size (Fig. 4.10 F). However, spraying control
plants with additional 0.5% urea, singly or mixed with Pheroids, had no clear
effect on fruit size.
The total yield (accumulated number and mass) are all the fruits harvested from
a plant during the harvest period. The total accumulated yield of the plant gives a
true representative effect the nitrogen limiting levels and the subsequent
corrective treatments had on yield. Control plants showed a much higher yield in
both the number of fruit harvested and its mass than the plants grown under
nitrogen limiting conditions after a harvest period of 25 weeks (Fig. 4.11 A & B).
Spraying these nitrogen deficient plants with 0.5% and 1% urea solutions
improved yield in terms of mass (Fig. 4.11 C), but had little to no effect on the
number of fruit produced (Fig. 4.11 D). However, mixing these 0.5% and 1% urea
solutions with Pheroids resulted in a further enhancement on fruit mass, but still
had little effect on the number of fruit produced (Fig. 4.11 D). Spraying nitrogen
deficient plants with Pheroids only, also increased yield (mass), similar to when it
was mixed with a 1% urea solution (Fig. 4.11 C). Spraying nitrogen deficient
plants with the 0.5% urea / Pheroids mixture was the most successful treatment
in preventing the effect a nitrogen deficiency had on yield in terms of mass.
However, none of the corrective foliar sprays used could completely alleviate the
effect of nitrogen limiting conditions on the mass and number of fruits harvested
over a harvesting period of 25 weeks.

92
Acc
umila
ted
Yie
ld (
n F
ruit.
Pla
nt-1
)
0
20
40
60
80
100
120
140A
ccum
ilate
d Y
ield
(kg
.Pla
nt-1
)
0.0
1.0
2.0
3.0
4.0
5.0
W OH
0 5 10 15 20 250.0
1.0
2.0
3.0
4.0
WOH
0 5 10 15 20 250
20
40
60
80
100
ControlNitrogen DeficientN Def + 0.5% UreaN Def + 0.5% Urea PN Def + 1% UreaN Def + 1% Urea PN Def + PheroidsControl + 0.5% UreaControl + 0.5% Urea P
A: Mass
C: Mass
B: Num ber
D: Number
Figure 4.11 Accumulated yield for mass (A & C) and number (B & D) of fruit harvested over a period of 25 weeks.
WOH = Weeks of harvest.

93
Spraying control plants with a 0.5% urea solution, singly and mixed with
Pheroids, markedly improved the yield (mass) under conditions of optimal
nitrogen supply (Fig. 4.11 C). However, the effect of these treatments was not as
marked on the number of fruits harvested. When the 0.5% urea solution was
mixed with Pheroids and sprayed onto the control plants, the number of fruits
harvested from control plants was reduced (Fig. 4.11 D).
Summarizing yield after a harvest period of 25 weeks, the average total
accumulated yield, in terms of number and mass, can be compared between the
different treatments (Table 4.4). The nitrogen deficient plants produced much
less fruit, approximately 30%, than the control plants. Spraying the plants grown
under nitrogen limiting conditions with 0.5% and 1% urea solutions, singly or
mixed with Pheroids, had no apparent effect on the number of fruit harvested.
The same effect was observed when control plants were sprayed with 0.5% urea,
singly and mixed with Pheroids.
The plants grown under nitrogen limiting conditions produced approximately half
the yield (mass) compared to control plants. However, spraying these plants with
0.5% and 1% urea solutions, all improved yield. When these urea solutions was
mixed with Pheroids, an even higher improvement in yield was observed,
specifically in the plants sprayed with the 0.5% urea/Pheroids mixture, where a
yield approximately equal to control plans was achieved. Increasing the urea
solution to 1% and spraying these plants, singly or mixed with Pheroids, also
improved yield, but not as distinctly as the 0.5% urea/Pheroids treatment. It
appeared that the yield in terms of mass of the control plants could further be
improved by spraying these plants with 0.5% urea, singly and mixed with
Pheroids.

94
Table 4.4 Average fruit number, mass, size and yield after 25 weeks of harvest.
Average:
Control
Plants
Nitrogen deficient Plants + Control Plants +
No foliar
treatment
0.5%
Urea
0.5%
Urea P
1%
Urea
1%
Urea / P
Pheroids
0.5%
Urea
0.5%
Urea / P
n Fruit.plant -1 108 ± 44 78 ± 21 81 ± 14 76 ± 4 81 ± 11 82 ± 11 81 ± 5 115 ± 8 108 ± 3
g.Fruit -1 31 ± 7 26 ± 11 35 ± 12 42 ± 11 39 ± 11 38 ± 12 38 ± 12 39 ± 10 40 ± 7
mm.fruit -1 39 ± 4 33 ± 5 39 ± 4 42 ± 4 39 ± 4 39 ± 4 38 ± 4 39 ± 4 41 ± 4
kg.plant -1 3.35 ± 0.53 2.08 ± 0.05 2.83 ± 0.44 3.19 ± 0.24 3.16 ± 0.22 3.12 ± 0.92 3.08 ± 0.93 4.48 ± 0.52 4.32 ± 0.17

95
The control plants also produced considerably more fruit than the nitrogen
deficient plants for the harvest period (Table 4.4). Spraying these nitrogen
deficient plants with 0.5% and 1% urea solutions, singly or mixed with Pheroids,
as corrective treatments, had no apparent effect on the number of fruits
harvested. Approximately the same number of fruits were harvested from the
nitrogen deficient treated with different corrective treatments. In contrast, it
appeared that by spraying control plants with a 0.5% urea solution increased the
number of fruit harvested from 108 to 115 fruits. This was not apparent when the
0.5% urea solution was mixed with Pheroids.
The average fruit mass and size varied considerably over the harvest period for
all the treatments (Fig. 4.10). A marked difference between fruit size and mass of
the control plants and nitrogen deficient plants were observed. However, all the
different corrective treatments could fully alleviate the effects nitrogen limiting
conditions had on average fruit size and mass. In fact, all the corrective
treatments resulted in bigger and heavier fruit than the control plants. Thus, foliar
applications of urea, singly and mixed with Pheroids, all fully alleviated the effect
nitrogen limiting levels had on fruit size and mass. The best results were
obtained when nitrogen deficient plants were sprayed with the 0.5%
urea/Pheroids mixture. Moreover, spraying the control plants with both the 0.5%
urea and 0.5% urea/Pheroids solutions also increased fruit size, but had no clear
effect on mass (Table 4.4).
The individual mass of the fruits harvested were combined to give a total
accumulated yield for each treatment (Fig. 4.11). The control plants produced a
higher total accumulated yield than the plants grown under nitrogen limiting
conditions. It appeared that all the corrective treatments was fairly successful in
alleviating the effects a nitrogen deficiency had on total yield. Total yields of
these treated plants were only slightly lower than the yield for the control plants.
Spraying control plants, which was already growing under optimal conditions,

96
with a 0.5% urea solution, singly and mixed with Pheroids, further improve the
total yield of these plants?
4.5.2 Market implication
The total yield of a crop directly influences income. Thus, a reduction in yield will
inevitably result in a lower income due to the market price obtained. A nitrogen
deficiency may result in a low yield, which inevitably will reduce net income. The
effect of nitrogen limiting conditions and the subsequent corrective treatments on
market value were subsequently calculated (Table 4.5). The experimental setup
used in this study (Fig. 3.1) of 3.5 plants.m-2 represent approximately 35 000
plants.ha-1. Using total yield after 25 weeks of harvest (Table 4.4), the potential
yield per hectare was calculated. In addition, using the current prices, gross
income per hectare can be calculated. These estimates are summarized in Table
4.5.
Nitrogen limiting conditions ultimately reduced gross income (Table 4.5).
Treating these plants with additional nitrogen alleviated the reducing effect of a
nitrogen deficiency on yield and potential loss in income to a certain extent.
Cultivating plants under control conditions resulted in an income of approximately
R 526 452.ha-1. This is substantially higher than the R 326 872.ha-1 obtained for
the plants grown under nitrogen limiting conditions. This corresponds to a
37.91% reduction in gross income over a period of 25 weeks.
Spraying 0.5% and 1% urea solutions onto nitrogen deficient plants resulted in a
marked improvement by reducing the loss in income from approximately 38% to
15% and 5% respectively. Moreover, mixing these 0.5% and 1% urea solutions
with Pheroids further improved the income and reduced losses to only 4% and
6% respectively less than the income from the control plants. The latter
treatments thus resulted in nearly equal incomes to that of the control plants. In

97
addition, spraying the nitrogen deficient plants with Pheroids only also markedly
increased the gross income from R 326 872.ha-1 to R 484 020.ha-1, limiting
losses to a level which is only 8% less than the income from the control plants.
Thus, Pheroids itself, without mixing it with urea, are successful in limiting losses
in income in plants grown under nitrogen limiting conditions.
Control plants sprayed with a 0.5% urea solution, singly or mixed with Pheroids,
responded positively to the additional nitrogen. It was found that when control
plants were sprayed with a 0.5% urea solution the income increased from
R 526 452.ha-1 to R 704 032.ha-1, an increase of nearly 34% in income.
However, mixing this 0.5% urea solution with Pheroids as a treatment proved to
be less effective. The income increased from R 526 452.ha-1 to only R 678
888.ha-1, an increase of approximately 29% (Table 4.5).

98
Table 4.5 The effect of a nitrogen deficiency and the subsequent corrective
treatments on yield and gross income over a harvest period of 25
weeks.
Treatments Yield
(kg.plant -1)
Yield Ton.ha -1 (est.) (a)
Income R.ha-1 (b)
% loss / gain (c)
Control 3.35 ± 0.53 117.25 R 526 452 0
Nitrogen deficient 2.08 ± 0.05 72.80 R 326 872 - 37.91
N def + 0.5 % U 2.83 ± 0.44 99.05 R 444 734 - 15.52
N def + 0.5 % U / P 3.19 ± 0.24 111.65 R 501 308 - 4.77
N def + 1 % U 3.16 ± 0.22 110.60 R 496 594 - 5.67
N def + 1 % U / P 3.12 ± 0.92 109.20 R 490 308 - 6.68
N def + Pheroids 3.08 ± 0.93 107.80 R 484 020 - 8.06
Control + 0.5 % U 4.48 ± 0.52 156.80 R 704 032 + 33.73
Control + 0.5 % U / P 4.32 ± 0.17 151.20 R 678 888 + 28.95
(a) 35 000 plants.ha-1 x yield (kg.Plant-1) ÷ 1000 = Ton.ha-1
(for 35 000 plants.ha-1 – see 3.2.1.1).
(b) Ton.ha-1 x R 4.49 / kg-1 (Trade in Feb 2009) = R.ha-1
(c) % loss/gain when compared to control plants.

99
4.6 FRUIT QUALITY
Nitrogen limiting conditions may not only impair yield, but may also cause a
reduction in fruit quality. Various quality parameters were used to determine fruit
quality and were recorded for the first 16 weeks of the 25 week harvest period.
These parameters include fruit pH, electrical conductivity (EC), % Brix index,
moisture content, as well as lycopene content. Each of these parameters may
individually be influenced by low nitrogen conditions and the subsequent
corrective treatments used. Each parameter has its unique characteristic to
describe fruit taste, integrity and overall appearance (quality).
4.6.1 pH, Electrical conductivity, % Brix and moist ure content of the fruit
pH is a very important parameter in determining fruit taste (Dorai et al., 2001)
and may vary depending on cultivar type, etc. Tomato fruit are naturally acidic
fruit and therefore have a relatively low pH (pH 4; Atherton & Rudich, 1986). The
pH was recorded for the first 16 weeks of the harvest period (Fig. 4.13 A & B).
Fruits from the control plants had a pH which varied between 4.0 and 4.2 for
most of the harvest period (Fig. 4.12 A & B). The pH of fruit from the nitrogen
deficient plants remained fairly constant at a pH of 4.0, lower than that recorded
for control fruits (Fig. 4.12 A). The slight differences in pH of fruit harvested from
control plants and those harvested from nitrogen deficient plants will have no
noticeable influence on fruit taste. As a result of the small differences in pH of the
control- and nitrogen deficient plants, applications of the 0.5% and 1% urea
solutions, singly or mixed with Pheroids, had no obvious effect of the pH of the
fruit.

100
pH
3.6
3.8
4.0
4.2
4.4
4.6
4.8
5.0E
C (
mS
.cm
-1)
1.5
2.0
2.5
3.0
3.5
4.0
4.5
pH
3.6
3.8
4.0
4.2
4.4
4.6
4.8
5.0
W O H
0 2 4 6 8 10 12 14 16
Brix
(%
)
4
6
8
10
W O H
0 2 4 6 8 10 12 14 16 18
Brix
(%
)
2
4
6
8
10
ControlN DeficientN Def + 0.5% UN Def + 0.5% U PN Def + 1% UN Def + 1% U PN Def + PheroidsControl + 0.5% UControl + 0.5% U P
EC
(m
S.c
m-1)
1.5
2.0
2.5
3.0
3.5
4.0
4.5
A: pH B: pH
C: EC D: EC
E: Brix F: Brix
Figure 4.12 Changes in fruit pH (A & B), EC (C & D) and % Brix (E & F) between
the different treatments for the duration of the harvest period.

101
Fruit electrical conductivity is another important parameter used to determine fruit
taste and overall fruit quality (Dorai et al., 2001). By measuring electrical
conductivity, the number of dissolved salts, which affects overall fruit taste, was
determined.
No marked differences in fruit EC between fruits from control- and nitrogen
deficient plants could be observed (Fig. 4.12 C & D). Moreover, an increase in
fruit EC for all fruits was observed as the harvest period progressed, with a
slightly higher EC for fruit from control plants than that from the nitrogen deficient
plants (Fig. 4.12 C). As a result of the small differences in EC between the
control- and nitrogen deficient plants, applications of 0.5% and 1% urea
solutions, singly or mixed with Pheroids, had no clear effect on the EC of the fruit.
The % Brix index gives an indication on total dissolved soluble solids (TSS)
within the fruit. The Brix index may be the single most important parameter in
determining fruit quality and taste. The fruit Brix index, like fruit EC, also
increased for fruits as the harvest period progressed (Fig. 4.12 E & F). No clear
differences in Brix index between the fruits from control- and nitrogen deficient
plants, as well as all nitrogen deficient plants treated with the corrective
treatments could be observed (Fig. 4.12 E & F). Thus, foliar application of the
urea solutions, singly or mixed with Pheroids, had no clear effect on the fruit Brix
index.
Using the averages obtained for pH, EC and % Brix of the fruit over the entire
harvest period, a comparison can be made on which treatments resulted in the
overall best quality fruit.

102
Avg
% B
rix
0
2
4
6
Avg
EC
(m
S.c
m-1
)
0
1
2
3
4
Avg
pH
0
1
2
3
4
5
Con
trol
N D
efic
ient
N D
ef +
0.5
% U
N D
ef +
0.5
% U
P
N D
ef +
1%
U
N D
ef +
1%
U P
N D
ef +
Phe
roid
s
Con
trol
+ 0
.5%
U
Con
trol
+ 0
.5%
U P
A: pH
B: EC
C: Brix
Figure 4.13 Average pH (A), EC (B) and % Brix (C) for fruits harvested over the
harvest period of 16 weeks.

103
On average, the pH of the fruits from control plants was 4.2 for the experimental
period. This is slightly higher than the pH 4.0 obtained for the fruits from nitrogen
deficient plants. Spraying the nitrogen deficient plants with additional nitrogen in
the form of the 0.5% and 1% urea solutions, singly or mixed with Pheroids, have
little to no effect on the average pH of the fruit. Similar results were found by
spraying control plants with 0.5% urea, singly or mixed with Pheroids (Fig. 4.13
A).
Nitrogen limiting conditions reduced the average fruit EC marginally, when
compared to control conditions (Fig. 4.13 B). Spraying these nitrogen deficient
plants with a 0.5% urea solution improved the fruit EC levels slightly. This could
further be improved by mixing the 0.5% urea solution with Pheroids, resulting in
fruit EC levels similar to those found for control plants (Fig. 4.13 B). In contrast,
spraying the plants with a 1% urea solution, singly or mixed with Pheroids, as
well as with Pheroids alone, had no effect on the EC levels. Moreover, spraying
control plants with a 0.5% urea solution, singly and mixed with Pheroids, have an
inhibitory effect by decreasing the fruit EC of the control plants. However, the
effect of a nitrogen deficiency and the corrective treatments on fruit EC is so
marginal that no clear conclusion could made from these results.
Fruits from nitrogen deficient plants had a higher average % Brix index than the
fruit from the control plants (Fig 4.13 C). Spraying nitrogen deficient plants with a
0.5% urea solution, singly or mixed with Pheroids, reduced the % Brix index to a
level lower than that of the control plants. In contrast, using a urea solution of
1%, singly or mixed with Pheroids, had no effect on the % Brix index of nitrogen
deficient plants. Applying Pheroids only also, like in the 0.5% urea and 0.5%
urea/Pheroids treatments, reduced the % Brix index to a level lower than that of
the control plants. Spraying control plants with the 0.5% urea solution, singly or
mixed with Pheroids, have no effect on the fruit % Brix index levels of these
plants.

104
Other parameters which may affect fruit quality and taste is the deposition of
organic molecules (dry mass accumulation) and the moisture content of the fruit
(Ertan, 1990).
Changes in the fresh- and dry mass of the fruit were recorded for the first 16
weeks of the 25 week harvest period from which the moisture content and the
Fm:Dm ratio were calculated (Fig. 4.14). As mentioned previously (Fig. 4.10 C &
D), a natural tendency occurred where the fresh mass of the control fruit
decreased as the harvest season progressed (Fig. 4.14 A & B) while the fresh
mass of the fruit from the nitrogen deficient plants remained fairly constant during
this period. The fresh mass of the fruit from control plants was consistently higher
than that of the nitrogen deficient plants (Fig. 4.14 A). None of the foliar
treatments used could alleviate the effect a nitrogen deficiency had on the fresh
mass of the fruit (Fig. 4.14 B).

105
g D
m.fr
uit-1
0
2
4
6
0
2
4
6
Moi
stur
e C
onte
nt (
%)
86
88
90
92
94
96
98
Moi
stur
e C
onte
nt (
%)
86
88
90
92
94
96
98
g F
m.fr
uit-1
0
20
40
60
80
100
120
g F
m.fr
uit-1
0
20
40
60
80
100
120
WOH
0 2 4 6 8 10 12 14 16 18
Fru
it D
M:F
M
Fm
:Dm
0.03
0.04
0.05
0.06
0.07
ControlNitrogen DeficientN Def + 0.5% UreaN Def + 0.5% Urea PheroidsN Def + 1% UreaN Def + 1% Urea PheroidsN Def + PheroidsControl + 0.5% UreaControl + 0.5% Urea Pheroids
WOH
0 2 4 6 8 10 12 14 16
Fm
:Dm
0.03
0.04
0.05
0.06
0.07
A: Fresh mass B: Fresh mass
C: Dry mass D: Dry mass
E: Moisture content F: Moisture content
G: Fm:Dm H: Fm:Dm
g D
m.fr
uit-1
Figure 4.14 Changes in the fresh mass (A & B), dry mass (C & D) and moisture
content (E & F) of the fruit and the fresh to dry mass ratio (Fm:Dm).
(G & H) over a harvest period of 16 weeks.

106
Similar results were obtained when the fruit dry mass for the different treatments
were recorded (Fig. 4.14 C & D). It also appeared that nitrogen limiting conditions
had little effect on the deposition of organic molecules (dry mass), as no clear
differences between fruits from control- and nitrogen deficient plants were
observed (Fig. 4.14 C). Moreover, no marked changes were observed with the
different corrective foliar treatments used in this study (Fig. 4.14 D).
As a result of this, the moisture content of both the control fruits and fruits from
nitrogen deficient plants decreased from approximately 95% at the start of the
harvest period to approximately 93% at the end of week 16 (Fig. 4.14 E). No
clear differences in moisture content between control- and nitrogen deficient
fruits could be observed (Fig. 4.14 E). For this reason the different corrective
treatments used was ineffective in affecting the moisture content of the fruits (Fig.
4.14 F).
The Fm:Dm increased for both control fruit and the fruits from nitrogen deficient
plants as the harvest period progressed. No clear distinction could be made
between the different treatments during the first 16 weeks of harvest due to
varying fruit mass (Fig. 4.14 A & B) and moisture content (Fig. 4.14 E & F).
Although the Fm:Dm increased over the first 16 weeks of harvest, no marked
differences between control- and nitrogen deficient fruits (Fig. 4.14 G) were
observed. No clear effect on this Fm:Dm was observed when nitrogen deficient
plant were sprayed with the different corrective treatments (Fig. 4.14 H).
The average fresh mass, dry mass and moisture content, as well as the average
Fm:Dm were recorded over the experimental period of 16 weeks.

107
Avg
g F
m.fr
uit-1
0
20
40
60A
vg m
oist
ure
cont
ent %
90
92
94
96
Fm
:Dm
0.00
0.02
0.04
0.06
Avg
g D
m.fr
uit-1
0.0
0.5
1.0
1.5
2.0
2.5
3.0
Con
trol
N D
efic
ient
N D
ef +
0.5
% U
N D
ef +
0.5
% U
P
N D
ef +
1%
U
N D
ef +
1%
U P
N D
ef +
Phe
roid
s
Con
trol
+ 0
.5%
U
Con
trol
+ 0
.5%
U P
Con
trol
N D
efic
ient
N D
ef +
0.5
% U
N D
ef +
0.5
% U
P
N D
ef +
1%
U
N D
ef +
1%
U P
N D
ef +
Phe
roid
s
Con
trol
+ 0
.5%
U
Con
trol
+ 0
.5%
U P
A: Fresh mass B: Dry mass
C: Moisture content (%) D: Fm:Dm
Figure 4.15 Differences in average fruit fresh mass (A), dry mass (B), moisture
content (C) and Fm:Dm (D) after the first 16 weeks of harvest.
The average fresh mass of the fruits from the control plants were noticeably
higher than that from the nitrogen deficient plants (Fig. 4.15 A). Treating these
nitrogen deficient plants with the 0.5% and 1% urea solutions, singly or mixed
with Pheroids, all improved the fresh mass of the fruit from nitrogen deficient
plants. In fact, it completely alleviated the effect of nitrogen limiting conditions on

108
the fresh mass (Fig. 4.15 A). Spraying control plants with 0.5% urea, singly and
mixed with Pheroids, also increased the fresh mass of the fruit.
The acquisition of dry mass in fruit is due to deposition of organic molecules. A
difference in dry mass was observed between fruit from control plants and those
of plants grown under nitrogen limiting conditions (Fig. 4.15 B). Spraying nitrogen
deficient plants with a 0.5% urea solution improved fruit dry mass from ± 1.5 g
Dm.fruit-1 to ± 2.0 g Dm.fruit-1. Mixing this 0.5% urea solution with Pheroids,
further improved fruit dry mass from ± 1.5 g Dm.fruit-1 to ± 2.7 g Dm.fruit-1.
Increasing the urea concentration to 1% also improved dry mass. However, no
further increase in dry mass could be achieved by mixing this 1% urea solution
with Pheroids. Spraying control plants with a 0.5% urea solution, singly and
mixed with Pheroids, had no visible effect on fruit dry mass (Fig. 4.15 B). Thus,
the different foliar treatments all alleviated the effect of nitrogen limiting
conditions on fruit dry mass.
No difference in fruit moisture content was observed between fruits from control-
and nitrogen deficient plants (Fig. 4.15 C). Applying 0.5% urea, singly or mixed
with Pheroids, increased the moisture content to levels above that of the control
fruits. In contrast, spraying plants with 1% urea, singly and mixed with Pheroids,
reduced the moisture content of the fruits. The best improvement in moisture
content under nitrogen deficient conditions was achieved when the plants were
sprayed with Pheroids only. Spraying control plants with the 0.5% urea solution,
as well as the 0.5% urea Pheroids solution, resulted in fruits with higher moisture
contents (Fig. 4.15 C).
By calculating the fruit Fm:Dm for the entire harvest period of 16 weeks, no
marked differences in Fm:Dm was observed between the fruits from the control
plants and those from the nitrogen deficient plants (Fig. 4.15 D). A slight
decrease in the Fm:Dm of the fruit was observed when the nitrogen deficient
plants were sprayed with a 0.5% urea solution, singly or mixed with Pheroids.

109
Increasing this 0.5% urea solution to 1%, resulted in a slight increase in the
Fm:Dm ratio. Spraying the plants grown under nitrogen limiting conditions with
Pheroids singly, resulted in a reduction in the Fm:Dm. Spraying control plants
with 0.5% urea, singly and mixed with Pheroids, caused a decline in the Fm:Dm.
4.6.2 Lycopene content of fruit
Lycopene content, which determines the colour intensity of the fruit and because
of its anti-oxidant properties (Bramley, 2000; Salunkhe et al., 1974), is another
important quality parameter used to measure fruit quality. Salunkhe et al. (1974)
found that the red colour of tomatoes is directly related to lycopene content. The
lycopene content of the fruits varied throughout the harvesting period. The
average lycopene content for all treatments was approximately 150 mg.g Dm-1.
No clear distinction could be made in the lycopene content between fruits from
control- and the nitrogen deficient plants (Fig. 4.16 A). Spraying nitrogen deficient
plants with 0.5% or 1% urea solutions, singly or mixed with Pheroids, did not
affect lycopene content markedly. Spraying control plants with 0.5% urea, singly
or mixed with Pheroids, showed similar results (Fig. 4.16 B).

110
Lyco
pene
con
tent
(m
g.g
Dm
-1)
100
150
200
250
300
WOH
0 2 4 6 8 10 12 14 16 18
100
150
200
250
Control Nitrogen deficientN def + 0.5% Urea N def + 0.5% Urea PN def + 1% Urea N def + 1% Urea PN def + PheoridsControl + 0.5% Urea Control + 0.5% Urea P
A:
B:
Figure 4.16 Changes in lycopene content of the fruit over a harvest period of 16
weeks.

111
Lyco
pene
con
tent
(m
g.g
Dm
-1)
0
50
100
150
200
250
Con
trol
N D
efic
ient
N D
ef +
0.5
% U
N D
ef +
0.5
% U
P
N D
ef +
1%
U
N D
ef +
1%
U P
N D
ef +
Phe
roid
s
Con
trol
+ 0
.5%
U
Con
trol
+ 0
.5%
U P
Figure 4.17 Average Lycopene content for fruits from the different treatments
over a harvest period of 16 weeks.
No difference in the average lycopene content between fruits from control- and
nitrogen deficient plants was observed (Fig. 4.17). Spraying nitrogen deficient
plants with a 0.5% urea solution, improved the lycopene content slightly. It can
be concluded that none of the other urea solutions used, singly or mixed with
Pheroids, had an effect on fruit quality, since none of the treatments used had an
effect on the average lycopene content of the fruit over a harvest period of 16
weeks.
Spraying control plants with 0.5% urea, singly or mixed with Pheroids, both
increased fruit quality slightly by increasing the average lycopene content of the
fruit harvested from these plants (Fig. 4.17).

112
CHAPTER 5
DISCUSSION
5.1 RATIONALE FOR THIS STUDY
Tomatoes are considered to be one of the most important fruit producing crops in
the world. Tomatoes can either be consumed fresh or processed in many
products. Yield and quality attributes of tomatoes vary considerably. Factors
affecting yield and fruit quality include cultivar type, cultivation method (field or
greenhouse), availability of nutrients, subjection to diseases and environmental
factors. Among these factors, availability of nutrients probably play the single
most important role in determining yield and quality.
For a crop to be healthy and have a high yield, it requires optimal growing
conditions. These conditions include light (amount and intensities), humidity,
temperature, water and nutrients. Therefore, the study was conducted in a
greenhouse where all of these factors were controlled as accurately as possible.
The plants were grown in a circulating ebb and flow hydroponic setup, not only to
supply the plants with optimal water, but to accurately control nutrient levels.
Plants utilize three major non-mineral elements, namely carbon (C), hydrogen
(H) and oxygen (O), which contributes up to 96% of the dry weight of the plant.
The remaining 4% of a plants dry weight is made up of different mineral
elements. Although only 4% of the plants dry mass consists of mineral elements,
these elements are of critical importance in plant metabolism. Mineral elements
can be divided into two groups depending on the concentrations required by the
plants, namely macro-nutrients and micro-nutrients or trace elements.

113
Of these nutrients, nitrogen (N) is considered to be the most important macro-
nutrient due to its critical role in metabolism and due to its requirement by plants
it may become deficient first (Salisbury & Ross, 1991; Atherton & Rudich, 1986).
Nitrogen is usually absorbed from the soil, or obtained from mutualistic plant-
microbial relationships, as nitrate (NO3-) and ammonium (NH4
+) ions. Once
absorbed, nitrogen is metabolized in various metabolic pathways to yield a vast
number of cellular constituents (Salisbury & Ross, 1991). Low levels of nitrogen
are most frequently responsible for a low yield.
Nitrogen deficiency is a common phenomenon, due to its role in plant
metabolism. Nitrogen in soils may be utilized by soil microbes or may be leached
out of the soils, which easily leads to a nitrogen deficiency which can persist. A
nitrogen deficiency is first observed in older leaves because of the mobility of
nitrogen in plants (Salisbury & Ross, 1991). It moves with the transpiration
stream (Kirkby & Mengel, 1967) to younger tissues where a higher input of
metabolites is required due to a higher metabolic rate in these tissues. Visually, a
nitrogen deficiency is observed as chlorosis in older leaves and retarded or
stunted growth in new shoots. In severe cases the leaves finally become necrotic
and fall off (Devlin, 1969).
In order to correct nitrogen deficiencies, nitrogen can be supplied additionally to
plants, either through the soil or as foliar treatments. One common practice is to
spray plants with urea, which contains 46% nitrogen per weight (Wittwer et al.,
1963; Yamanda et al., 1965; Knoche et al., 1994; Bondada et al., 2001).
However, urea may cause burning of leaves when applied at concentrations
exceeding 2%. Therefore, urea is more frequently applied with lower
concentrations at 0.5% or 1% (Atherton & Rudich, 1986). Applications of urea as
a foliar spray have given responses in yield approximately equal to that when
fertilizer was applied to the soil (Nicoulaud & Bloom, 1996; Maximum yield,
2003).

114
When urea is applied to the leaves, it may be absorbed rapidly (Wittwer et al.,
1963; Nicoulaud & Bloom, 1996). However, not all urea is absorbed (Lui et al.,
2003). The transport proteins may become saturated with urea, temperature may
play a role or the urea mixture may evaporate from the leaf surface. Thus, an
attempt has to be made to improve or enhance the absorption of urea by the
leaves (Lui et al., 2003).
Pheroids is marketed by Elementol (Pty) Ltd, which proposes that this lipid like
molecule apparently facilitates the transport of beneficial substances or
molecules over membranes. When Pheroids is mixed with a substance, it
apparently encapsulates the substance and “disguises” its chemical attributes.
Due to its lipid like structure, Pheroids is readily absorbed by the leaves, thereby
facilitating the transport of the encapsulated substance over the membranes.
Elementol (Pty) Ltd, requested the evaluation of Pheroids as a possible vehicle
for the transport of phytologically beneficial substances over membranes.
The rationale for this study therefore was i) to evaluate whether Pheroids, when
mixed with urea, can improve the known effects of urea in reducing the effect
nitrogen limiting conditions had on yield and fruit quality and to ii) determine
whether Pheroids on its own can be promoted as a bio-stimulant. It must be kept
in mind that a foliar application of urea is already a successful treatment in
alleviating the effects of a nitrogen deficiency (Nicoulaud & Bloom, 1996). The
principle aim was therefore to determine whether the positive effect of urea may
further be improved by “packing” it with Pheroids.
This was done by exposing tomato plants to optimum- (control) and nitrogen
limiting conditions using a controlled ebb and flow hydroponic set-up. Additional
nitrogen was then supplied to the plants in the form of the 0.5% and 1% urea
solutions sprayed every two weeks onto the vegetative parts. This was done,
firstly to measure the effect of nitrogen limiting conditions on vegetative growth,
yield and fruit quality under controlled hydroponic conditions.

115
Secondly, the capacity of urea, as an additional source of nitrogen, to reduce the
effect of nitrogen limiting conditions was subsequently determined.
To investigate the ability of Pheroids to further enhance the absorption and
transport of urea into leaves, the 0.5% and 1% urea solutions were “packed” or
encapsulated with Pheroids, before these mixtures were sprayed onto the plants.
In addition, to determine whether Pheroids itself has any bio-stimulatory ability,
Pheroids singly was sprayed onto plants grown under nitrogen limiting
conditions.
5.2 PHYSICAL ENVIRONMENT OF CULTIVATION
Light intensity, temperature and relative humidity all affect overall plant
metabolism (Salisbury & Ross, 1991), fruit formation and fruit quality (Atherton &
Rudich, 1986). The study was conducted inside a greenhouse to control light
intensity, temperature and relative humidity as accurately as possible (Fig. 4.1
A - C). The plants were placed randomly in the hydroponic setup to ensure that
all the plants were equally exposed to these environmental factors. Greenhouse
cultivated tomato plants are usually grown at a light intensity of approximately 2.0
µE.m-2.s-1 (Atherton & Rudich, 1986). Light intensity, which is considered to be
one of the most important factors in ensuring optimal growth (Atherton & Rudich,
1986), varied between acceptable norms of 3200 µE.m-2.s-1 and 800 µE.m-2.s-1
(Fig. 4.1 A) at midday during the experimental period.
The temperature varied between 17°C and 27°C in the temperature controlled
greenhouse (Fig.4.1 B). The relative humidity strongly correlated with changes in
temperature and varied between acceptable norms of 55% and 96% (Fig. 4.1 C).
The optimum relative humidity (RH) for tomato production in greenhouses ranges
between 60% and 70% (Buitelaar, 1983). It has also been shown that a high
humidity had no marked effect on yield (Welles, 1985). The above mentioned
environmental factors all varied between acceptable norms. All the plants were

116
subjected equally to these factors. Thus, any changes measured in vegetative
growth, generative development, yield and fruit quality were attributed to the
different treatments used.
By growing tomato plants in a hydroponic setup, nitrogen levels could be
accurately controlled. The plants were grown in nitrogen adequate (control) and
nitrogen limiting nutrient media. The control medium contained 210 ppm nitrogen,
while the nitrogen limiting medium contained 70 ppm nitrogen. Nitrogen accounts
for approximately 100 mg.kg-1 (100 ppm) and above of dry matter. Thus, any
supply of nitrogen less than 100 ppm is considered to be limiting (Atherton &
Rudich, 1986). The control medium also contained three times more (3 : 1)
nitrogen than the nitrogen limiting medium. The quality of both media was
constantly monitored throughout the study.
The EC of both the control- and nitrogen limiting media was approximately 1.7
mS.cm-1 (Fig. 4.2 A – D), within the acceptable values of 2.1 mS.cm-1 (Romer,
1997) to 2.6 mS.cm-1 (du Plessis, 2001) reported for tomatoes. The pH of the
nutrient media also ranged within acceptable norms for tomatoes (du Plessis,
2001), namely between 6.2 and 7.3 for both the control- and nitrogen limiting
media (Fig. 4.4 A – D).
5.3 PREVENTION OF THE REDUCING EFFECT OF NITROGEN LIMITING
CONDITIONS ON VEGETATIVE AND GENERATIVE DEVELOPMENT IN
TOMATOES
During the initial stages of establishment, from transplantation up to six weeks
thereafter, before any generative development commences, no differences in the
rate of vegetative growth (plant height) was observed between the control plants
and the plants grown under nitrogen limiting conditions (Fig. 4.7 A & B).
However, a clear reduction in growth was observed in the nitrogen deficient
plants as soon as flowering and fruit set commenced (Fig. 4.7 A). This may imply

117
that plants grown under nitrogen limiting conditions divert their available nitrogen
(metabolites) towards fruit formation and less nitrogen is used to sustain
vegetative growth, whereas control plants could sustain vigorous growth during
the different stages of generative development.
A high growth rate not only requires a high input of nutrients, but also a sufficient
supply of water. It was observed in this study that control plants consumed more
nutrient medium than the plants grown under nitrogen limiting conditions (Fig.
4.6). The control plants consumed approximately 315 liters of nutrient medium
per plant opposed to the 236 liters by a plant grown under nitrogen limiting
conditions (Fig. 4.6). Thus, 79 liters more nutrient medium was consumed by a
control plant. This could not have been due to a higher transpiration rate as all
plants were subjected to the same environmental factors. This higher nutrient
medium uptake indicates a higher metabolic activity as was evident in the
differences in plant height observed (Fig. 4.7).
Plants with a high protein content will have the ability to sustain a high metabolic
rate in general. Protein consists of approximately 16% nitrogen (Salisbury &
Ross, 1991; Rubner, 1885; Atwater & Bryant, 1899; Jones, 1931 and Browne,
1944). Jones (1931) proposed that by measuring protein content, the
concentration of nitrogen can be determined by dividing the concentration of
protein measured by 6.25. Thus, protein content indirectly indicates the
concentration of nitrogen inside the plants (Maynard & Loosli, 1969).
Protein content of the leaves was used in an attempt to indicate metabolic
capacity and possibly the translocation of nitrogen between the bottom and the
top leaves.

118
When nitrogen becomes limiting, plants apparently transport nitrogen, in the form
of NO3- , NH4
+ and/or amino acids, from older to the younger, more active
growing tissues (Salisbury & Ross, 1991; Ireland, 1990). If nitrogen is limited in a
plant, the bottom leaves will have a lower nitrogen content because of the
translocation of nitrogen to the top leaves.
It was found that the protein content of the top and the bottom leaves increased
for both the control- and the nitrogen deficient plants (Fig. 4.9 & Table 4.1) for the
first eight weeks after transplantation. The highest differences in protein
concentrations were observed in the top leaves between the control- and
nitrogen deficient plants. The control plants had the highest concentration and
the increase in leaf protein content suggested that these plants had a higher
growth rate than the plants grown under nitrogen limiting conditions, as was
clearly evident in the differences in plant height (Fig. 4.7) and the rate of nutrient
consumption (Fig. 4.6). Moreover, the protein content in the leaves from nitrogen
deficient plants was also less than in the control plants. This suggested that the
plants grown under nitrogen limiting conditions probably have a lower metabolic
rate which resulted in the retarded and slow growth as was observed.
Spraying the plants grown under nitrogen limiting conditions with 0.5% and 1%
urea solutions, singly and mixed with Pheroids, in an attempt to alleviate or
reduce the nitrogen deficiency, not only stimulated vegetative growth, but also
increased the protein content in both the bottom and the top leaves. It also
positively affects the ratio in protein content between the bottom and the top
leaves.
The ratio of protein concentrations between the bottom and top leaves can be
used to indicate whether any translocation of nitrogen between the leaves
occurred. The plants grown under nitrogen limiting conditions appear to have a
lower translocation of nitrogen from the bottom to the top leaves, than the control
plants. This possibly indicates a deliberate transport of nitrogen in the control

119
plants to supply the top leaves with nitrogen to maintain high vegetative growth.
This translocation of nitrogen from the bottom to the top leaves in control plants
is high, since the control plants have higher concentrations of nitrogen available
in the bottom leaves to transport, than found in the bottom leaves of the nitrogen
deficient plants.
It can be postulated that the control plants, which clearly has the highest rate of
vegetative development, would also have a higher rate in generative
development and subsequent yield, than the plants grown under limiting nitrogen
conditions. Generative development entails the development of reproductive
structures like buds, flowers and ultimately the fruit. During generative
development available nitrogen in the plant has to be divided between vegetative
and generative growth. Reduced nitrogen supply clearly affected generative
development (Table 4.3) in delaying the formation of buds, flowers and fruit,
subsequently delaying yield. Limited nitrogen supply also negatively affected the
time lapse between the developmental stages of these structures, as was clearly
demonstrated in this study. Low nitrogen levels caused a delay of at least six
days from transplantation to fruit harvest (Table 4.3). These plants were clearly
unable to sustain a high vegetative growth, as well as generative development.
Spraying nitrogen deficient plants with the 0.5% and 1% urea solutions, singly
and mixed with Pheroids, as corrective treatments, all shortened the time span
from transplantation to fruit harvest. In some cases fruit from these treated
nitrogen deficient plants could be harvested even before that from the control
plants.
When Pheroids alone was sprayed onto plants grown under nitrogen limiting
conditions, the time lapse from transplantation to harvest was also shortened,
indicating that Pheroids itself also contributes to generative development.
Although Pheroids doesn’t directly contribute to nitrogen levels, it stimulates the
plant in some way which reduces the effect of nitrogen limiting conditions on

120
generative development. Pheroids contains free fatty acids or free fatty acid
derivatives which can only be postulated to be metabolized via cellular
respiration to release extra energy. This, however, must be investigated in future
detailed studies.
When control plants were additionally sprayed with a 0.5% urea solution, the time
span was also shortened from transplantation to harvest by at least a week. This
clearly indicates that the plants grown under optimal nitrogen conditions actively
respond to the addition of additional nitrogen in the form of the foliar application
of urea.
It can be concluded that by spraying control- and nitrogen deficient plants with
these urea solutions, singly or mixed with Pheroids, not only stimulated
vegetative growth (Fig. 4.7), but also generative development in that the
development of buds, flowers and fruits are sooner completed which then
shortens the time span from transplantation to harvest.
5.4 PREVENTION OF THE REDUCING EFFECT OF NITROGEN LIMITING
CONDITIONS ON YIELD
Gul et al., (1967), as well as Atherton and Rudich (1986), showed that yield was
directly influenced by different concentrations of available nitrogen. This is
because nitrogen forms an integral part of all proteins, enzymes, co-enzymes
RNA, DNA and chlorophyll (Salisbury & Ross, 1991). Thus, any factor affecting
any of the above mentioned will affect yield.
Assimilates and water contribute to fruit size. Thus, the plants which have the
highest assimilate and water incorporation into the fruit will produce the largest
and heaviest fruits (Winsor, 1979). Shelp and Shattuck (1986) found that urea
applied foliarly to tomatoes was transported directly to the fruit where it
contributed in producing larger fruit. Plants subjected to adequate nitrogen levels

121
would have higher concentrations of proteins, chlorophyll etc. enabling it to
produce more assimilates, resulting in more and larger fruit. Metabolism may be
lower in plants grown under nitrogen limiting conditions due to a lower
concentration of proteins (Fig. 4.9). The incorporation of assimilates like sucrose
may also be low which will result in a smaller fruit (Wang et al., 1993). The
reduced movement of nitrogen within the plant from leaf tissue to fruits may also
contribute to less and smaller fruit forming under nitrogen limiting conditions.
Control plants also produced substantially more fruit than the plants grown under
nitrogen limiting conditions (Fig. 4.10 & Table 4.4). It was also observed that the
average number of fruits harvested per week for control plants increased till week
11 of harvest, where after it declined. This was also true for the plants grown
under nitrogen limiting conditions, but this phenomenon was delayed by at least
two weeks. Moreover, the highest average number of fruit harvested in the
nitrogen deficient plants was also less than in the case of the control plants (Fig.
4.10).
Spraying the nitrogen deficient plants with the 0.5% urea and 1% urea solutions,
singly and mixed with Pheroids, had a beneficial effect in that the time when the
highest number of fruit being produced were advanced by two weeks. This was
similar to the phenomenon observed in control plants. Although the fruits were
harvested sooner in these treated plants, the number of fruit harvested did not
necessarily increased (Table 4.4) which clearly are reflected in the final yield
obtained (Fig. 4.11).
Fruit mass and size are strongly correlated (Atherton & Rudich, 1986). It was
observed that fruit size and mass of both control- and nitrogen deficient plants
declined as the harvest period progressed. This is apparently a natural
phenomenon. Although there was a decline, the average mass and size of fruits
from the control plants was higher than that from nitrogen deficient plants. Thus,
not only the number of fruit harvested from nitrogen deficient plants was

122
retarded, the fruits were also smaller with less weight when compared to that
from the control plants.
Spraying these nitrogen deficient plants with the corrective treatments, all
appeared to increase both fruit mass and size of these plants (Fig. 4.10; Table
4.4). In fact, these corrective treatments were so successful that on average the
fruit mass and size exceed that from the control plants after a harvest period of
25 weeks. Moreover, control plants growing under optimum conditions also
reacted to the additional nitrogen when sprayed with the 0.5% urea solution,
singly and mixed with Pheroids, in that the average number of fruits harvested,
as well as their mass increased (Table 4.4). This was possibly due to an increase
in metabolic rate related to elevated nitrogen levels.
Although small differences were observed in the average fruit mass and number
of fruits harvested between control- and nitrogen deficient plants, marked
differences were obtained when the total accumulated yields were compared.
The control plants had a much higher final yield than the plants grown under
nitrogen limiting conditions (Fig 4.11; Table 4.4). This was also found by Shelp
and Shattuck (1986). Plants grown under nitrogen limiting conditions produced
about half the number of fruit and mass when compared to the control plants
(Fig. 4.11; Table 4.4) over a harvest period of 25 weeks. The urea applied to the
foliage to supply the nitrogen deficient plants with additional nitrogen, was
apparently not sufficiently absorbed to completely alleviate the negative effect of
nitrogen limiting conditions on fruit development. The relieving effect of urea
could be improved by mixing it with Pheroids. This combined mixture further
enhanced yield in the nitrogen deficient plants.
This indicated that Pheroids indeed facilitated the further uptake of urea by the
leaves. Although an improvement in yield was observed, all the corrective
treatments could still not completely alleviate the negative effect of nitrogen
limiting conditions on fruit development and subsequent yield. Moreover,

123
Pheroids itself also markedly improved yield in these plants suggesting that the
lipid like composition of Pheroids itself has an alleviating effect regarding nitrogen
limiting conditions.
Fruit number and especially mass determines yield, which eventually affects
income. A low yield would result in a low income and vice versa. Based on a
hypothetical case where yield is projected on a per hectare basis, it is clear that
plants grown under nitrogen limiting conditions resulted in a ± 38% reduction in
yield and income when compared to the control plants (Table 4.5). The
hypothetical income from control plants was R 526 452.ha-1, whereas the income
from plants grown under nitrogen limiting conditions was only R 326 872.ha-1.
This is clearly the result of less fruits harvested, which was lighter and smaller
than the fruit from the control plants (Fig. 4.11; Table 4.4).
This marked reduction in yield was partially prevented by spraying the nitrogen
deficient plants with the 0.5% and 1% urea solutions, singly and mixed with
Pheroids, as corrective treatments. Although the 0.5% and 1% urea solutions
was successful in reducing the loss in potential income to only 15.5% and 5.6%
less than that of the control plants respectively, the best result was obtained
when the 0.5% urea solution was mixed (“packed”) with Pheroids. This treatment
almost completely reduced the effect nitrogen limiting conditions had on yield
(mass). With this treatment a hypothetical income of R 501 308.ha-1 was
obtained, which was only 4.8% less than the R 526 452.ha-1 for control plants. In
fact, it represents an income of R 174 436.ha-1 more than the R 326 872.ha-1
obtained for the non-treated nitrogen deficient plants.
Moreover, application of Pheroids alone also substantially reduced the loss in
potential income. This treatment resulted in a hypothetical income of only 8%
less than in the control plants. This clearly demonstrates that Pheroids itself act
as a bio-stimulant and has the capacity to reduce the effect of nitrogen limiting
conditions on yield in hydroponically grown tomatoes. In addition, the income in

124
control plants was also enhanced when sprayed with the 0.5% urea solution,
singly and mixed with Pheroids. These treatments resulted in an increase in
yield and potential income of 33.7% and 28.95% respectively. Control plants,
which already grow under optimal conditions, clearly reacted to the additional
urea applied as an source of nitrogen in that the yields increased. Both the 0.5%
urea and the 0.5% urea / Pheroids solutions have great agricultural potential,
even under optimum growing conditions.
It is thus clear that nitrogen limiting conditions had a reducing effect on yield,
similar to the findings of Gul et al. (1967). It is not only a reduction in the number
of fruit harvested, but also a reduction in mass and size, which eventually
reduces total yield and the subsequent income. It was clearly demonstrated in
this study that spraying nitrogen deficient plants with 0.5% and 1% urea
solutions, singly and mixed with Pheroids, as corrective treatments prevented
losses in yield and income. Although these corrective treatments did not
completely alleviate the effect nitrogen limiting conditions had on growth and
subsequent yield, it markedly prevented the effect of nitrogen limiting conditions
in these plants.
5.5 PREVENTION OF THE REDUCING EFFECT OF NITROGEN LIMITING
CONDITIONS ON FRUIT QUALITY
Another factor, apart from yield, which will affect the market value is overall fruit
quality like appearance, aroma and the taste of the fruit (de Bruin et al., 1971;
Davies & Hobson, 1981). Different parameters were used in this study to
describe fruit quality and to determine the effect of limited nitrogen supply, as
well as the corrective treatments used, on this quality. These parameters include
pH, electrical conductivity, % Brix, moisture content, as well as the lycopene
content of the fruit. All these parameters were measured from the same fruit.
Fruit quality parameters were measured for the first 16 weeks of the 25 week
harvest period. The fruits were allowed to develop to maturity on the plants and

125
were harvested at the red, consumer ready stage. The fruits from the control
plants were considered to represent high quality fruit, since these plants were
cultivated under optimal hydroponic conditions.
Fruit pH in tomatoes varies considerably between cultivars (Dominigos, et al.,
1987). Gul et al. (1967) found that different nitrogen levels did not influence pH
considerably and varied in a range of 4.24 to 4.26, similar to the pH measured in
this study (Fig. 4.12 A & B; Fig. 4.13 A). Fruit pH remained fairly constant
throughout the trial (Fig. 4.12 A & B). The pH of the fruit from the control plants
had a slightly higher pH than that from the plants grown under nitrogen limiting
conditions (Fig. 4. 12 A). This difference in pH is however insignificant. None of
the corrective treatments used had a clear visible effect on the fruit pH either
(Fig. 4.12 B & Fig. 4.13 A). It can be concluded that neither nitrogen limiting
conditions, nor the different corrective treatments used, affected fruit pH and thus
fruit quality.
Although fruit pH remained fairly constant, fruit EC and % Brix increased as the
harvest period progressed (Fig. 4.12 C & D). Fruit EC may be affected by the EC
of the nutrient solution. Dorai et al. (2001) have found that higher EC values of
the nutrient solution resulted in better quality fruit, but it reduced yield. However,
the EC of both the control- and nitrogen limiting media used in this trial was
similar and remained fairly constant at 1.7 mS.cm-1 (Fig. 4.2). The fact that both
the EC and % Brix of the fruit increased as the harvest period progressed, can be
seen as a natural phenomenon. This inevitably will affect fruit quality. Control
plants had a slightly higher average fruit EC than the fruits from the plants grown
under limiting nitrogen conditions (Fig. 4.13 B), suggesting a slightly better quality
fruit.
Measuring the % Brix of the fruit, the concentration of total soluble solids in the
fruits can be estimated (Young et al., 1993). These total soluble solids include
sugars such as sucrose, fructose and glucose, as well as other substances like

126
vitamins, organic acids etc. which all affects fruit taste and aroma (Stevens et al.,
1977). The concentration of the total soluble solids (TSS) was found by Huett
and Dettman (1988) to increase as the concentration of nitrogen increases. It can
thus be postulated that plants grown under nitrogen limiting conditions will
produce fruit with less total soluble solids (TSS). However, the % Brix measured
in this study between the control- and nitrogen deficient plants, was similar. No
clear differences were observed (Fig. 4.12 & Fig. 4.13).
Changes in fruit pH, EC and % Brix are, however, dependent on the moisture
levels within the fruit. When the moisture content within the fruit is low, the fruit
will be more concentrated, resulting in increased EC and % Brix values and vice
versa. Thus, by measuring the fruit moisture content, the changes in the above
mentioned parameters can be further evaluated, as will be addressed later.
As mentioned previously, it was observed that fruit mass and size in both control-
and nitrogen deficient plants declined as the harvest period progressed (Fig. 4.10
C – F & Fig. 4.14 A & B). This phenomenon was also evident for the dry mass of
the fruits (Fig. 4.14 C & D). Most of the fruits dry matter is the result of leaf
assimilates accumulating in the fruits during development and maturation. More
than 65% of the total uptake of nitrogen is apparently accumulated in the fruit
(Tanake et al., 1974). Fruit growth is thus mainly determined by the import of leaf
assimilates. The fact that fruit size and mass (Fig. 4.10 C – E) and dry mass (Fig.
4.14 C) declined as the harvest period progressed, while the number of fruit
produced increased in the first half of this period (Fig. 4.10 A), could be ascribed
to the distribution of leaf assimilates to all the new fruits formed. This
phenomenon was more evident in the control plants than in the nitrogen deficient
plants, where changes in fresh- and dry mass remained fairly constant (Fig. 4.14
A - D), but on average was lower than that of the control plants (Fig. 4.15 A & B).
Nitrogen limiting conditions reduced vegetative development (Fig. 4.7) and thus
the subsequent synthesis of leaf assimilates through photosynthesis. Less
assimilates lead to the eventual reduced deposition of these assimilates in the

127
fruits, as suggested by the lower EC values (Fig. 4.13 B) measured for these
fruits. The decrease in fruit dry mass (solids) may also be due to a decrease in
metabolic rate as the plant matures (Atherton & Rudich, 1986).
It must also be kept in mind that fruit nearing maturity are mostly situated further
down on the plant while the developing fruit are higher up on a plant. When the
plants experience a nitrogen deficiency, the nitrogen in the bottom parts of the
plants may be translocated to the upper parts of the plant (Salisbury & Ross,
1991), resulting in lower concentrations of nitrogen to be available in the bottom
parts of the plants (Fig. 4.9 & Table 4.1). This may possibly contribute to fruits
having a high rate of assimilate deposition and a subsequent high dry mass at
the start of the harvest period when only a few fruit are to be found on a plant,
opposed to the fruit harvested later when many fruit were found on the plant.
Another factor which also may influence fruit dry matter content is the physical
position of the fruit on the truss. Photosynthetic assimilates originating in the
leaves are transported to the fruits. Fruit situated at the origin of the truss may
utilize assimilates, subsequently lowering the assimilate concentration available
to fruits situated at the tip of the truss. Thus, fruit nearer to the origin of the truss
may be larger and may also contain higher levels of assimilates than fruit at the
end of the truss. Detailed studies, however, are required to prove this.
Similar to fruit dry mass, the fruit moisture content also decreased, but only
marginally (Fig. 4.14 D & F). No clear differences were obtained for fruits from
the control- and nitrogen deficient plants. For both plants, the moisture content
decreased from approximately 95% to 93%. This is indicative that the fruits not
only became smaller and lighter, but also more concentrated as the harvest
period progressed. This correlates with the increase in EC and % Brix which was
observed (Fig. 4.12 C & E). Differences in the fruit moisture content of less than
2% were found not to affect fruit taste greatly (Ertan, 1990). Moreover, comparing
the ratio between fruit dry mass and fresh mass (Fm:Dm), showed a clear

128
increase throughout the harvest period (Fig. 4.14 G & F). This is indicative of the
import of leaf assimilates and its deposition during fruit development and
maturation. Thus, the fruits became more concentrated with carbon skeletons
and this is most probably the reason why the average moisture content
decreased during this period (Fig. 4.14 E). On average, no clear differences in
Fm:Dm ratio was observed between fruits from the control plants and the plants
grown under nitrogen limiting conditions.
Taking all the parameters used to measure fruit quality into account, it appeared
that nitrogen limiting conditions had little to no effect on fruit quality. Only minor
differences in these parameters between the fruits from control- and nitrogen
deficient plants were measured. Although the fruit became smaller, lighter and
more concentrated, it can be seen as a natural phenomenon occurring,
irrespective whether tomato plants are grown under control- or nitrogen limiting
conditions. Thus, fruit quality is not compromised when the plants experience a
sub-optimal supply of nitrogen.
Moreover, none of the 0.5% and 1% urea solutions used, singly or mixed with
Pheroids, to supply nitrogen deficient plants with additional nitrogen, had any
further effect on the changes in the above mentioned quality parameters. No
marked changes were observed for the pH, EC, % Brix (Fig. 4.12 & Fig. 4.13),
moisture content and Fm:Dm (Fig. 4.14 & Fig. 4.15) of the fruits.
However, all the corrective treatments used in this study could completely
alleviate the effect nitrogen limiting conditions had on the fresh- and dry masses
of the fruit. In fact, the average fresh- and dry masses obtained with these
corrective treatments exceeded the averages for the control fruit (Table 4.4 & Fig
4.15 A & B). The fresh- and dry mass of fruits can, however, also be seen as
parameters to quantify yield (Table 4.4). It was clearly demonstrated that nitrogen
limiting conditions had an enormous effect on yield in terms of mass as was also
observed by Gul et al. (1967).

129
In addition, treating control plants additionally with the 0.5% urea and 0.5% urea /
Pheroids treatments, also had no marked effect on fruit quality. None of the
parameters used to qualify fruit quality was visibly affected by these treatments.
The same results were obtained when nitrogen deficient pants were sprayed with
a Pheroids solution only. Pheroids as a bio-stimulant also had no effect on fruit
quality under nitrogen limiting conditions.
Another parameter used to describe fruit quality was the lycopene content of the
fruits. Lycopene does not contain nitrogen. However, the metabolic pathways
responsible for producing carotenoids like lycopene involves many enzymes,
which contains nitrogen. Nitrogen levels may affect the synthesis of lycopene.
During fruit maturation, a vast number of metabolites are produced and
converted from a partial photosynthetic to a heterotrophic metabolism in the
fruits, where lycopene finally becomes the dominant carotenoid (Carrari & Fernie,
2006).
Carotenoids, like lycopene, protect chlorophyll pigments against photo-oxidation
during photosynthesis (Salisbury & Ross, 1991). Lycopene dissipates excess
light energy absorbed by the antenna pigments, and thus protects chlorophyll
against photo-oxidation by quenching triplet chlorophyll, superoxide anion
radicals and singlet oxygen (Rao & Agarwal, 1999). Lycopene also plays a role in
the human diet in preventing diseases like chronic-, cancer- and cardiovascular
diseases (Agarwal & Rao, 1999), which are caused by oxidative stress induced
by reactive oxygen species (ROS) (Halliwell et al., 1995; Sies & Stahl, 1995; Frei,
1994; Block, 1992; Steinmentz & Potter, 1996). Lycopene as an anti-oxidant,
makes it an important molecule for human health.

130
It has been shown that high nitrogen levels may increase the lycopene content in
tomato fruit, but seasonal variations in climate and light intensities also
influenced its content (Bruulsema et al., 2004). Furthermore, lycopene levels
were also found to be affected by the availability and concentration of nitrogen
(Grusak et al., 1999; Brandt & Molgaard, 2001). Plants will produce primary and
secondary metabolites, like lycopene, relative to the abundance and availability
of nitrogen (Stamp, 2003). Thus, it can be assumed that the plants grown under
control conditions will have the higher lycopene concentration.
The lycopene content of the fruits from both the control- and nitrogen deficient
plants remained fairly constant throughout the trial (Fig. 4.16 A & B). This is in
contrast to the findings of Bruulsema et al. (2004) who found a direct correlation
between high lycopene content and a high nitrogen supply. Although no marked
differences in the lycopene content were seen, the average lycopene content of
the fruit for both the control- and nitrogen deficient fruits was approximately 150
mg.g dm-1. Bramley (2000), as well as Levy and Sharoni (2004), found the
average lycopene content for hydroponic greenhouse tomatoes varied between
84 mg.g dm-1 and 420 mg.g dm-1.
Like in the case of the other quality parameters used, spraying nitrogen deficient
plants with the 0.5% and 1% urea solutions, singly and mixed with Pheroids, also
had no clear effect on the lycopene content of the fruit. Thus, these plants did not
respond to the additional nitrogen in the synthesis of more lycopene. When the
control plants were treated with the 0.5% urea solution, singly and mixed with
Pheroids, a small improvement in the lycopene content of the fruit was observed
(Fig. 4.17). This indicated that the control plants, which are growing under
optimal nitrogen levels, could react to the additional nitrogen supply by
stimulating the synthesis of more lycopene. This may be due to enhanced
metabolic activities (DOXP and MVA pathways) in these plants, which is then
able to sustain a high rate of lycopene synthesis. This can have an effect on the

131
health attributes of tomato fruits. However, this increase in the lycopene content
is only marginal to be of any significance.
To summarize, it appears that neither nitrogen limiting conditions had any
apparent effect on fruit quality, nor did the foliar application of 0.5% and 1% urea,
singly and mixed with Pheroids as corrective treatments. The changes measured
are so marginal that it can be concluded that fruit quality is not compromised
under nitrogen limiting conditions, as well as when the different corrective
treatments were used to prevent the effect of the nitrogen limiting conditions.
5.6 CONCLUDING REMARKS
Crops may experience a limited supply of nitrogen from time to time. Urea, which
contains 46% in its structure, is commonly used to treat and prevent nitrogen
limiting conditions (Wittwer et al., 1963; Yamanda et al., 1965; Knoche et al.,
1994; Bondada et al., 2001). It was found that urea concentrations in excess of
2% may burn the leaves. Therefore, producers use concentrations lower than
2%, which is mostly applied as a foliar spray to crops. Moreover, due to a
number of reasons, not all of the urea applied is absorbed (Liu et al., 2003). Thus
an attempt has to be made to improve or enhance the absorption of urea by
plants.
The principle aim of the study was to evaluate Pheroids as a potential vehicle to
facilitate the transport of substances over membranes. To evaluate this, tomato
plants were cultivated in a circulating ebb and flow hydroponic setup to simulate
nitrogen deficient soil conditions. Plants grown under nitrogen limiting conditions
were then sprayed with 0.5% and 1% urea solutions, as an additional source of
nitrogen. In an attempt to possibly enhance the absorption of urea, these urea
solutions were mixed (“packed”) with Pheroids, before this mixture were sprayed
onto the plants.

132
Results confirmed that nitrogen is of critical importance for growth and
development. Low nitrogen levels reduced vegetative growth, delayed fruit
formation, reduced the number of fruit harvested, mass and size and finally yield.
Yield was reduced by approximately 38%, when compared to plants grown under
control conditions. Although nitrogen deficiencies caused a reduction in yield, it
had no apparent effect on the quality of the fruit.
Spraying nitrogen deficient plants with the 0.5% urea and 1% urea solutions, the
mass and size of the fruits harvested and subsequently overall yield, had little
effect on fruit quality. The foliar application of these urea solutions also improved
the hypothetical income, as these plants produced a substantially higher yield
than the non-treated nitrogen deficient plants. Although these foliar applications
improved yield, it could not fully alleviate the reducing effect of low nitrogen levels
on yield.
To address the main objective of the study the 0.5% and 1% urea solutions were
then mixed (“packed”) with Pheroids and sprayed onto the foliage of the plants. It
was postulated that this treatment would enhance the further uptake of urea into
the leaf cells, elevating the nitrogen levels and thereby reducing the effect of
nitrogen limiting conditions. Spraying nitrogen deficient plants with these
urea/Pheroids further alleviated the reducing effect of low nitrogen levels on
vegetative and generative growth, as well as on yield. Although the number of
fruit produced was not increased, the individual fruit size and mass was improved
which eventually further improved total yield. This indeed supports the
assumption made that Pheroids can facilitate and improve the absorption of urea,
thereby increasing cellular nitrogen levels. Moreover, mixing the 0.5% urea
solution with Pheroids, limited losses in yield and potential income to as little as
4% when compared to control plants, making it the most successful treatment in
preventing the effect of nitrogen limiting conditions on yield. Using this treatment
inevitably increased the profit margins of the producer.

133
Spraying nitrogen deficient plants with Pheroids only, also alleviated the effects
of low nitrogen levels on yield, but to a lesser extent than when it was mixed with
urea. Although Pheroids, consisting of free fatty acids or fatty acid derivatives,
did not directly contribute to cellular nitrogen levels, it still alleviated the effects of
nitrogen limiting conditions on yield. Therefore, Pheroids itself can be marketed
as a bio-stimulant in general.
The apparent encapsulating ability of Pheroids allows it to facilitate the transport
of phytological important substances, like urea, over membranes without making
use of concentration dependant diffusion or membrane protein co-transporters.
Due to the lipid like attributes of Pheroids, it can be postulated that the
urea/Pheroids complex easily associates with membranes and readily move into
the cells, where after it is metabolized. The urea is metabolized by urease to
yield NH4+ and CO2, which both can contribute to metabolism in improving growth
and eventually yield. After the urea has been metabolized, Pheroids is most
probably also metabolized giving it its ability to be a bio-stimulant. Pheroids
apparently consist of free fatty acids and/or fatty acid derivatives. For example, a
fatty acid of 16 carbons (Palmitic acid) can be metabolized via β-oxidation in the
peroxisomes to yield sucrose and eventually a minimum of 72 ATP molecules
(Salisbury & Ross, 1991). Assuming Pheroids consists of many such fatty acid
chains, it is postulated that its breakdown can contribute to cellular ATP levels,
which will stimulate metabolism, ultimately improving growth. This is most
probably the reason why Pheroids have bio-stimulating characteristics, as was
measured in the plants grown under nitrogen limiting conditions.
Thus, Pheroids show a lot of promise as a potential vehicle for the transport of
substances over membranes, as well as a bio-stimulant in general, but this
requires further detailed investigations. It is recommended that this study should
be performed on a larger scale, including field trials, to accurately assess the
input costs, and the different parameters used to measure yield and quality on a
higher population of plants. It can be considered to spray plants more frequently,

134
for example once a week, instead of every two weeks. A vast number of crops
may suffer from nitrogen deficiencies and it is recommended that more crops
should be included in a study to get a clearer indication of the potential of
Pheroids.
In conclusion, it appears that Pheroids has the ability to facilitate the transport of
substances, like urea, over membranes of tomato plant cells grown under
control- and nitrogen limiting conditions. Pheroids also exhibits good growth
promoting characteristics in general and can be promoted as a bio-stimulant.
Pheroids, singly or mixed with beneficial substances, show great promise for use
in the agricultural industry.

135
CHAPTER 6
REFERENCES
Adam, K.P., Thiel, R. & Zapp, J. 1999. Cloning and expression of cDNAs
encoding two enzymes of the MEP pathway. Biochimica et Biophysica
Acta (BBA) – Gene Structure and Expression 1517(1) : 159 – 163.
Adams, P. & Winsor, G.W. 1979. Nutrient uptake by cucumbers from
recirculating solutions. Acta Horticulturae 98 : 119 – 126.
Agarwal, S. & Rao, A.V. 1998. Tomato lycopene and low density lipoprotein
oxidation: a human dietary intervention study. Lipids 33(10) : 981 - 984.
Agarwal, S. & Roa, V.A. 1999. Tomato lycopene and its role in human health and
chronic diseases. Canadian Medical Association Journal 6 : 163.
Alexander, L. & Grierson, D. 2002. Ethylene biosynthesis and action in tomato: a
model for climacteric fruit ripening. Journal of Experimental Botany
53(377) : 2039 - 2055.
Ames, B.N., Gold, L.S. & Willett, W.C. 1995. Causes and prevention of cancer.
Proceedings of the National Academy of Sciences, U S A 92(7) : 5258 -
5265.
Arab, L., Steck, S. & Harper, A.E. 2000. Lycopene and cardiovascular disease,
American Journal of Clinical Nutrition 71 : 1691 – 1695.

136
Arigoni, D., Sagner, S., Latzel, C., Eisenreich, W., Bacher, A. & Zenk, M. H.
1997. Terpenoid biosynthesis from 1-deoxy-d-xylulose in higher plants by
intramolecular skeletal rearrangement. Proceedings of the National
Academy of Sciences, USA 94(20) : 10600 - 10605.
Astorg, P., Gradelet, S., Berges, R. & Suschetet M. 1997. Dietary lycopene
decreases the initiation of liver preneoplastic foci by diethylnitrosamine in
the rat. Nutrition and Cancer 29(1) : 60 - 68.
Atherton, J.G. & Rudich, J. 1986. The tomato crop. A scientific basis for
improvement. Chapman and Hall. London, New York.
Atwater, W.O. & Bryant, A.P. 1899. The availability and fuel value of food
materials. Annual Report of Storrs Agricultural Experimental Station
(12) : 79 – 110.
Aung, L.H. & Austin, M.E. 1971. Vegetative and reproductive responses of
Lycopersicon esculentum Mill. to photoperiods. Journal of Experimental
Botany. 22(4) : 906 – 914.
Bach, T.J., Boronat, A., Campos, N., Ferrer, A. & Vollack K.U. 1999. Mevalonate
biosynthesis in plants. Critical reviews in biochemistry and molecular
biology 34(2) : 107 – 122.
Baxter, C.J., Carrari, F., Bauke, A., Overy, S., Hill, S.A., Quick, P.W., Fernie,
A.R. & Sweetlove, L.J. 2005. Fruit carbohydrate metabolism in an
introgression line of tomato with increased fruit soluble solids. Plant Cell
Physiology 46(3) : 425 – 437.
Block G. 1992 .The data support a role for antioxidants in reducing cancer risk.
Annual Review of Nutrition. 50(7) : 207 - 213.

137
Blum, A., Monir, M., Wirsansky, I. & Ben-Arzi, S. 2005. The beneficial effects of
tomatoes. European Journal of Internal Medicine. 16(6) : 402-404.
Bondada, B.R., Syvertsen, J.P. & Albrigo, L.G. 2001. Urea nitrogen uptake by
citrus leaves. Horticultural Science 36(6) : 1061 – 1065.
Bradford, M.M. 1976. A rapid and sensitive method for the quantization of
microgram quantities of protein utilizing the principle of protein-dye
binding. Analytical Biochemistry 72 : 248 – 256.
Bramley, P.M. 2000. Is Lycopene beneficial to human health? Phytochemistry
54(3) : 233 – 236.
Brandt, K. & Molgaard, J.P. 2001. Organic agriculture: does it enhance or reduce
the nutritional value of plant foods? Journal of the Science of Food and
Agriculture. 81(9) : 924 – 931.
Brock, T.D. 2003. In: Biology of Microorganisms. Ed : Madigan, M.T., Martinko,
J.M. & Parker, J. Tenth edition. Pearson Education International. Prentice
Hall. pp. 66 – 73.
Brown, P.H., Welch, R.M. & Cary, E.E. 1987. Nickel: A micronutrient essential for
higher plants. Plant Physiology 85 : 801 – 803.
Browne, C.A. 1944. A Source Book of Agricultural Chemistry. In: Chronica
Botanica 8(1). Ed: F. Verdoorn. The Chronica Botanica Co. Waltham,
Massachusetts.
Brummell, D.A. 2006. Cell wall disassembly in ripening fruit. Functional Plant
Biology 33(2) : 103 – 119.

138
Brummell, D.A. & Harpster, M.H. 2001. Cell wall metabolism in fruit softening and
quality and its manipulation in transgenic plants. Plant Molecular Biology
47(1-2) : 311 – 340.
Bruulsema, T.W., Paliyath, G., Schofield, A. & Oke, M. 2004. Phosphorus and
phytochemicals. Better Crops 88(2) : 6 – 7.
Buitelaar, K. 1983. Tomato research in the energy greenhouse at Naaldwijk.
Groenten en fruit 38 : 31 – 33.
Canene-Adams, K., Campbell, J.K., Zaripheh, S., Jeffrey, E.H. & Erdman, J.W.
2005. The tomato as a functional food. American Society of Nutritional
Science 135 : 1226 – 1230.
Carrari, F. & Fernie, A.R. 2006. Metabolic regulation underlining tomato fruit
development. Journal of Experimental Botany 57(9) : 1883 – 1897.
Conn, P.F., Schalch, W. & Truscott, T.G. 1991. The singlet oxygen and
carotenoid interaction. Journal of Photochemistry and Photobiology
11(1) : 41 – 47.
Davies, A.R., Fish, W.W. & Perkins-Veazie, P. 2002. A Rapid spectrophotometic
method for analyzing lycopene content in tomato and tomato products.
Journal of Postharvest Biology and Technology. 28 : 425 – 430.
Davies, J.N. & Hobson, G.E. 1981. The constituents of tomato fruit — the
influence of environment, nutrition, and genotype. Critical Reviews in Food
Science and Nutrition 15(3) : 205 – 280.
De Bruin, J.W., Garrewtsen, F. & Kooistra, E. 1971. Variation in taste and
chemical composition of the tomato (Lycopersicon esculentum Mill.).
Euphytica 20 : 214 – 227.

139
Demnitz-King, A., Ho, L.C. & Baker, D.A. 1997. Activity of sucrose hydrolyzing
enzymes and sugar accumulation during tomato fruit development. Plant
Growth Regulation 22 : 193 – 201.
Devlin, R.M. 1969. Plant Physiology. Second Edition. Van Reinhold Company.
Chapter 16 : 273 – 300.
Di Mascio, P., Kaiser, S. & Sies, H. 1989. Lycopene as the most efficient
biological carotenoid singlet oxygen quencher. Archives of Biochemistry
and Biophysics 274(2) : 532 – 538.
Dilley, D.R. & Walker, D.R. 1961. Assimilation of 14C and 15N labeled urea by
excised apple and peach leaves. Plant Physiology 36 : 757 – 761.
Dinar, M. & Stevens, M.A. 1981. The relationship between starch accumulation
and soluble solids content of tomato fruits. Journal of American Society for
Horticultural Sciences 106 : 415 – 418.
Domingos, C. Gomez, M.D., Canas, L., Hernandez-Yago, J., Conejero, V. &
Vera, P. 1987. A Novel Extracellular Matrix Protein from Tomato
Associated with Lignified Secondary Cell Walls. The Plant Cell 16(8) :
1035 – 1047.
Dorai, M., Papadopoulos, A.P. & Gosselin, A. 2001. Influence of electric
conductivity management on greenhouse tomato yield and fruit quality.
Agronomie 21 : 376 – 383.
Dorgan, J.F., Sowell, A., Swanson, C.A., Potischman, N., Miller, R., Schussler,
N. & Stephenson, H.E. 1998. Relationship of serum carotenoids, retinol, α-
tocopherol and selenium with breast cancer risk: Results from a
prospective study in Columbia, Missouri. Cancer Causes and Control
9(1) : 89 – 97.

140
Du Plessis, H.F. 2001. Hydroponic vegetable production Ed: Niederwieser, J.G.
pp 53 – 74.
El-Naggar, S.M. & Awad, F. 1986. In: Foliar fertilization. Ed: Alexander, A. Effect
of foliar application of some micro-nutrients on plants grown in new
reclaimed areas. Martinus Nijhoff Publishers, Dordrecht. p 6.
Epstein, E. 1972. Mineral nutrition of plants: In: Principles and Perspectives.
Wiley, New York. p 412.
Ertan, E. 1990. Tomato tasting test. Acta Horticulturae 259 : 79 – 82.
Fernando, C. & Alisdair, R.F. 2006. Metabolic regulation underlying tomato fruit
development. Journal of Experimental Botany 57(9) : 1883 - 1897.
Frei, B. 1994. Natural antioxidants in human health and disease. San Diego,
Academic Press.
Fuhramn, B., Elis, A. & Aviram, M. 1997. Hypocholesterolemic effect of lycopene
and ß-carotene is related to suppression of cholesterol synthesis and
augmentation of LDL receptor activity in macrophage. Biochemical and
Biophysical Research Communications 233 : 658 - 662.
Functional Foods, 1998. In: Biochemical and Processing aspects, vol 2. Ed:
Mazza, G., Shi, J. & Le Maguer, M. CRC Press : p 137.
Galluci, E., Micelli, C. & Lippe C. 1971. Non-electrolyte permeability across thin
lipid membranes. Archives of Physiology and Biochemistry 79(5) :
881 – 887.
Gerendas, J., Polacco, J.C., Freyermuth, S.K. & Sattelmacher, B. 1999.
Significance of nickel for plant growth and metabolism. Journal of Plant
Nutrition and Soil Science 162(3) : 241 – 256.

141
Gilbert, Z. & Hadfield, J. 1987. Grondbeginsels vir die kweek van groente en
vrugte in Suid-Afrika. Diatype Setting, Cape Town. Reproduksie deur
Unifoto Pty. Ltd. CTP Boekdrukkers, Parrow. p 110.
Giovannoni, J.J. 2004. Genetic regulation of fruit development and ripening.
Plant Cell 16 : 170 – 180.
Giovannocci, E., Ascherio, A., Rimm, E.B., Stampher, M.J., Colditz, G.A. &
Willett, W.C. 1995. Intake of carotenoids and retinol in relation to risk of
prostate cancer. Journal of the National Cancer Institute 87(23) :
1767 – 1776.
Gooding, M.J. & Davies, W.P. 1992. Foliar urea fertilization of cereals: A review.
Nutrient Cycling in Agroecosystems 32(2) : 209 – 222.
Goodwin, T.W. 1980. In: The Biochemistry of the Carotenoids, 2nd edition, vol. 1.
London : Chapman and Hall.
Grusak, M.A., Penna, D. & Welch, M.N. 1999. Physiologic processes affecting
the content and distribution of phytonutrients in plants. Nutrition Reviews
57(9) : S27 – S33.
Gul, A., Tuzel, Y., Hakerlerler, H., Saatci, N. & Anac, D. 1967. Effect of different
nitrogen rates on some quality parameters of greenhouse tomatoes.
International society for horticultural sciences. Acta Horticulturae 434 :
103 – 112.
Gullino, M.L. & Garibaldi, A. 1994. Influence of soilless cultivation on soilborne
diseases. Acta Horticulturae 361 : 341 – 354.

142
Halliwell, B. 1994. Free radicals, antioxidants and human disease: Curiosity,
cause or consequence? The Lancet 344(8924) : 721 - 724.
Halliwell, B., Murcia, M.A., Chirico, S., & Aruoma, O.I. 1995. Free radicals and
antioxidants in food and in vivo: What they do and how they work. Critical
Reviews in Food Science and Nutrition 35(1-2) : 7 - 20.
Harborne, J. B. 1991. In: Ecological Chemistry and Biochemistry of Plant
Terpenoids, Ed: Harborne, J. B. & Tomas-Barberan, R. A. Clarendon,
Oxford, pp. 399 - 426.
Harker, F.R., Redgwell, R.J., Hallett, I.C., Murray, S.H. & Carter, G. 1997.
Texture of fresh fruit. Horticultural Reviews 20 : 121 – 124.
Harris, W.M. & Spurr, A.R. 1969. Chromoplasts of tomato fruits II : The red
tomato. American Journal of Botany 56(4) : 369 – 379.
Hayward, H.E. 1938. The structure of Economic plants. Soil Science 48(4) : 358
Hera, C. 1996. The role of inorganic fertilizers and their management practices.
Nutrient Cycling in Agroecosystems 43(1-3) : 63 - 81
Herrmann, K. 1976. Flavonols and flavones in food plants: A review. International
Journal of Food Science and Technology 11(5) : 443 – 448.
Hine, J.C. & Sprent, J.I. 1988. Growth of Phaseolus vulgaris on various nitrogen
sources. The importance of urease. Journal of Experimental Botany
39(11) : 1505 – 1512.

143
Hirai, N., Yoshida, R., Todoroki, Y. & Ohigashi, H. 2000. Biosynthesis of Abscisic
Acid by the Non-mevalonate Pathway in Plants, and by the Mevalonate
Pathway in Fungi. Bioscience, Biotechnology and Biochemistry
64(7) : 1448 - 1458.
Ho, L.C. & Hewitt, J.D. 1986. Fruit Development. In: The Tomato Crop, a
Scientific Basis for Improvement, Ed. by Atherton JG and Rudich J.
Chapman and Hall Ltd, London, pp. 201 – 202.
Holden, J.M., Eldridge, A.L. & Beecher, G.R. 1999. Carotenoid Content of U.S.
Foods: An Update of the Database. Journal of Food Composition and
Analysis 12(3) : 169 – 196.
HortResearch, 2002 Horticultural Research, 2002. New Zealand Horticulture
facts and figures.
Howard, M.R. 2002. In: Hydroponic Food Production: A definitive guidebook for
the advanced home gardner and the commercial hydroponic grower.
Lawrence Earlbaum Associates.
Huett, D.O. & Dettman, D.B. 1988. Effect of nitrogen on growth, fruit quality and
nutrient uptake of tomatoes grown in sand culture. Australian Journal of
Experimental Agriculture 28(3) : 391 – 399.
Ilahy, R. & Hinder, C. 2007. Effect of ripening stage on lycopene content of
different processing tomato cultivars grown in Tunisia. Acta Hortticulturae
758 : 185 – 190.
Ireland, R. 1990. Amino acid and ureide biosynthesis. In: Plant Physiology,
Biochemistry and Molecular Biology Ed: Dennis, D.T. & Turpin, D.H.
pp 407 – 421.

144
James, E., Rygiewicz, P., Watrud, L. & Donnelly, P. 2002. Influence of adverse
soil conditions on the formation and function of arbuscular mycorrhizas.
Advances in Environmental Research 7(1) : 123 – 138.
Jensen, M.H. 1999. Hydroponics Worldwide. International Symposium on
Growing Media and Hydroponics. Acta Horticulturae 481 : 719 – 730.
Johnson, R.S., Rosecrance, R., Weinbaum, S., Andris, H. & Wang, J. 2001.
Can we approach complete dependence on foliar applied urea nitrogen in
an early-maturing peach? Journal of American Society for Horticultural
Science 126 : 364 – 370.
Jones, D.B. 1931. Factors for converting percentages of nitrogen in foods and
feeds into percentages of protein. Newsletter of the United States
Department of Agriculture 183 : 1 – 21.
Kato, H., Hayase, F. & Chung, T.Y. 1984. Changes of volatile components of
tomato fruits during ripening. Food Chemistry 14(2) : 113 – 124.
Kirkby, E.A. & Mengel, K. 1967. Ionic balance in different tissues of the tomato
plant in relation to nitrate, urea, or ammonium nutrition. Plant Physiology
42 : 6 – 14.
Klann, E.M., Hall, B. & Bennett, A.B. 1996. Antisense acid invertase (TIV1) gene
alters soluble sugar composition and size in transgenic tomato fruit. Plant
Physiology 112(3) : 1321 – 1330.
Knee, M. 1982. Fruit softening. III. Requirement for oxygen and pH effects.
Journal of Experimental Botany 33(6) : 1263 – 1269.

145
Knoche, M., Petracek, P.D. & Bukovac, M.J. 1994. Urea penetration of isolated
tomato fruit cuticles. Journal of American Society for Horticultural Science
119(4) : 761 – 764.
Kobayashi, T., Lijima, K., Mitamura, T., Toriizuka, K., Cyong, J.C. & Nagasawa,
H. 1996. Effects of lycopene, a carotenoid, on intrathymic T-cell
differentiation and peripheral CD4/CD8 ratio in a high mammary tumor
strain of SHN retired mice. Anti-cancer Drugs 7(2) : 195 - 198.
Kohlmeier, L., Kark, J.D., Gomez-Garcia, E., Martin, B.C., Steck, S.E., Kardinaal,
A.F., Ringstad, J., Thamm, M. & Masaev, V. 1997. Lycopene and
myocardial infarction risk in the euramic study. American Journal of
Epidemiology 146(8) : 618 – 626.
Krogmeier, M.J., McCarty, G.W. & Bremner, J.M. 1989. Phytotoxicity of foliar
applied urea. Proceedings of the National Academy of Sciences, USA
86(21) : 8189 – 8191.
La Vecchia, C. 2002. Tomatoes, lycopene intake, and digestive tract and female
hormone-related neoplasms. Experimental Biology and Medicine
227(10) : 860–863.
Lange, B. M., Rujan, T., Martin, W. & Croteau, R. 2000. Isoprenoid biosynthesis:
The evolution of two ancient and distinct pathways across genomes.
Proceedings of the National Academy of Sciences, USA 97(24) : 13172 –
13177.
Laule, O., Fürholz, A., Chang, H., Zhu, T., Wang, X., Heifetz, P., Gruissem, W. &
Lange, M. 2003. Crosstalk between cytosolic and plastidial pathways of
isoprenoid biosynthesis in Arabidopsis thaliana. Proceedings of the
National Academy of Sciences 100(11) : 6866 – 6871.

146
Laval-Martin, D., Quennemet, J. & Moneger, R. 1975. Pigment evolution in
Lycopersicon esculentum fruits during growth and development.
Phytochemistry 14 : 2357 - 2362.
Layzell, D.B. 1990. N2 fixation, NO3- reduction and NH4
+ assimilation. In: Plant
Physiology, Biochemistry and Molecular Biology Ed: Dennis, D.T. &
Turpin, D.H. p 389.
Levy, J., Bosin, E., Feldmen, B., Giat, Y., Miinster, A. & Danilenko, M. 1995.
Lycopene is a more potent inhibitor of human cancer cell proliferation than
either α-carotene or ß-carotene. Nutrition and Cancer 24(3) : 257 - 266.
Levy, J. & Sharoni, Y. 2004. The functions of tomato lycopene and its role in
human health. Foods & Food Integrated Journal of Japan 210(1) : 49 – 58.
Lichtenthaler, H.K. 1999. The 1-deoxy-D-xylulose-5-phosphate pathway of
isoprenoid biosynthesis in plants. Annual Review of Plant Physiology and
Plant Molecular Biology 50 : 47 – 65.
Lichtenthaler, H. K., Schwender, J., Disch, A. & Rohmer, M. 1997. Biosynthesis
of isoprenoids in higher plant chloroplasts proceeds via a mevalonate-
independent pathway. Federation of European Biochemical Societies
Letters 400(3) : 271 - 274.
Lin, T.T. & Pitt, R.E. 1986. Rheology of apple and potato tissue as affected by
cell turgor pressure. Journal of Texture Studies 17(3) : 291 – 313.
Liu, L.H., Ludewig, U., Frommer, W.B. & von Wirén, N. 2003. AtDUR3 encodes a
new type of high-affinity urea/H+ symporter in Arabidopsis. Plant Cell
15 : 790 – 800.

147
Lopez-Andreu, F.J., Lamela, A., Esteban, R.M. & Collado, J.G. 1986. Evolution
of quality parameters in the maturation stage of tomato fruit. Acta
Horticulturae 191 : 387 – 394.
Luckwill, L.C. 1943. The genus Lycopersicon: an historical, biological, and
taxonomical survey of the wild and cultivated tomatoes. Aberdeen
University Studies Newsletter 120 : 1 – 44.
Matsushima, N.R., Shidoji, Y., Nishiwaki, S., Yamada, T., Moriwaki, H. & Muto,
Y. 1995. Suppression by carotenoids of microcystin-induced
morphological changes in mouse hepatocytes. Lipids 30(11) :
1029 - 1034.
Maximum yield, 2003. Maximum yield Volume 5, Number 6. Issue March/April.
Article by Morgan, L. (Ph. D).
Maynard, A.B. & Loosli, K.J. 1969. In: Animal nutrition. McrGraw-Hill. New York
p 613.
McCollum, J.P. 1954. Effects of light on the formation of carotenoids in tomato
fruits. Food Research 19 : 182 – 189.
McGlasson, W.B., Wade, N.L. & Adato, I. 1978. Phytohormones and ripening, In:
Phytohormones and related compounds – A comprehensive treatise, vol.
II. Ed: Letham, D.S., Goodwin, P.B. & Higgins, T.J.V. Elsrevier, North
Holland, Amsterdam. pp. 447 – 493.
Milborrow, B. & Lee, H. 1998. Endogenous biosynthetic precursors of (+)-
abscisic acid. VI - Carotenoids and ABA are formed by the 'non-
mevalonate' triose-pyruvate pathway in chloroplasts. Australian Journal of
Plant Physiology 25(5) : 507-512.

148
Monforte, A.J., Friedman, E., Zamar, D. & Tanksley, D. 2001. Comparison of a
set of allelic QTL-NILs for chromosome 4 of tomato: Deductions about
natural variation and implications for germplasm utilization. Theoretical
and applied Genetics. 102(4) : 572 – 590.
Moraru, C., Logendra, L., Lee, T. & James, H. 2003. Characteristics of 10
processing tomato cultivars grown hydroponically for the NASA Advanced
Life Support (ALS) Program. Journal of Food Composition and Analysis
17(2) : 141-154.
Nagasawa, H., Mitamura, T., Sakamoto, S. & Yamamoto, K. 1995. Effects of
lycopene on spontaneous mammary tumour development in SHN virgin
mice. Anticancer Research 15(4) : 1173 - 1178.
Nguyen, M.L. & Schwarts, S.J. 1999. Lycopene: Chemical and biological
properties. Food Technology 53(2) : 38 – 45.
Nicoulaud, B.A.L. & Bloom, A.J. 1996. Absorption and assimilation of foliarly
applied urea in tomato. Journal of American Society for Horticultural
Sciences 121 : 1117 – 1121.
Niederwieser, J.G. 2001. In: Guide to Hydroponic vegetable production. 2nd
Edition. Agricultural research council. Vegetable and ornamental plant
institute, Pretoria, South Africa. p. 109.
Oeller, P.W., Wong, L.M., Taylor L.P., Pike, D.A. & Theologis, A. 1991.
Reversible inhibition of tomato fruit senescence by antisense RNA.
Science 254(5030) : 437 – 439.

149
Okumoto, S., Koch, W., Tegeder, M., Fisher, W., Stierhof, Y.D. & Frommer, W.B.
2004. The localization and characterization of Arabidopsis amino acid
transporter AtAAP3. Journal of Experimental Botany 55(406) : 2155 –
2168.
Palta, J.A., Fillery, I.R., Mathews, E.L. & Turner, N.C. 1991. Leaf feeding of (15N)
urea for labeling nitrogen. Australian Journal of Plant Physiology 18(6) :
627 – 636.
Patrick, J.W. 1997. Phloem unloading: Sieve Element Unloading and Post-Sieve
Element Transport Annual Review of Plant Physiology and Plant
Molecular Biology 48 : 191 – 222.
Paulits, T.C. 1997. Biological control of root pathogens in soilless and hydroponic
systems. Horticultural Science 32(2) : 193 – 196.
Paulits, T.C. & Belanger, R.R. 2001. Biological control in greenhouse systems.
Annual Review of Phytopathology 39 : 103 – 133.
Polacco, J.C. & Holland, M.A. 1993. Roles of urease in plant cells. International
Review of Cytology 145 : 65 – 103.
Princemail, J. 1995. Free radicals and antioxidants in human disease. In:
Analysis of free radicals in biological systems. Ed: Favier, A.E., Cadet, J.,
Kalyanaraman, B., Fontecave, M. & Pierre, J.L. Birkhäuser Verlag.
p. 83 - 98.
Ramandeep, K.T. & Savage, G.P. 2004. Effect of semi-drying on the antioxidant
components of tomatoes. Food Chemistry 94(1) : 90 – 97.
Rao, A.V. 2002. Lycopene, tomatoes, and the prevention of coronary heart
disease. Experimental Biology and Medicine 227(10) : 908 – 913.

150
Rao, A.V., Sanjiv, A. & Agarwal, S. 1998. Bioavailability and in vivo antioxidant
properties of lycopene from tomato products and their possible role in the
prevention of cancer. Nutrition and Cancer 31(3) : 199 – 203.
Rao, A.V. & Agarwal, S. 1999. Role of lycopene as antioxidant carotenoids in the
prevention of chronic diseases: A Review. National Research 19(2) :
305 – 323.
Rao, A.V. & Agarwal, S. 2000. Role of antioxidant lycopene in cancer and heart
disease. Journal of American College of Nutrition 19(5) : 563 – 569.
Rice-Evans, C.A., Sampson, J., Bramley, P.M. & Holloway, D.E. 1997. Why do
we expect carotenoids to be antioxidants in vivo? Free Radical Research
26(4) : 381 – 398.
Romer, J. 1997. Hydroponic Crop Production. Kangaroo Press Pty Ltd.,
Australia. pp. 132 – 133.
Roorda van Eysinga, J.P.N.L. & Smilde, K.W. 1981. Nutritional disorders in
glasshouse tomatoes, cucumbers and lettuce. Centre for Agricultural
Publishing and Documentation, The Netherlands, Wageningen. p 45 – 77.
Rose, J.K.C., Catalá, C., Gonzalez-Carranza, C.Z.H. & Roberts, J.A. 2003. Plant
cell wall disassembly. In: The Plant Cell Wall. Ed: Rose, J.K.C. Blackwell
Publishing Ltd, Oxford. pp. 264 – 324.
Rubner, M. 1885. Calorimetrische Untersuchung. Zeitschrift der Biologie 21 :
337 – 410.

151
Rudich, J., Zamski, E. & Regev, Y. 1977. Genotypic variation for sensitivity to
high temperature in the tomato: Pollination and fruit set. Botanical Gazette
138(4) : 448 – 452.
Rylski, I. 1979. Fruit set and development of seeded and seedless tomato fruits
under diverse regimes of temperature and pollination. Plant Physiology
and Biochemistry 104(6) : 835 – 838.
Sahlin, E., Savage, G.P. & Lister, C.E. 2004. Investigation of the antioxidant
properties of tomatoes after processing. Journal of Food Composition and
Analysis 17(5) : 653 – 647.
Salisbury, F.B. & Ross, C.W. 1991. Plant physiology, 4th Edition, Wadsworth
publishing company, Belmont, Calafornia, A division of Wadsworth, Inc.
pp. 682.
Salo-Väänänen, P & Koivistoinen, P.E. 1996. Determination of protein in foods:
comparison of net protein and crude protein (N X 6.25) values. Food
Chemistry 57(1) : 27 – 31.
Salunkhe, D.K., Jadhav, S.J. & Yu, M.H. 1974. Quality and nutritional
composition of tomato fruit as influenced by certain biochemical and
physiological changes. Plant foods for human nutrition 24(1-2) : 85 – 113.
Schaffer, A. & Petreikov, M. 1997. Sucrose-to-starch metabolism in tomato fruit
undergoing transient starch accumulation. Plant Physiology 113 : 739 –
746.
Schuch, W. & Bird, C. 1994. Improving tomato fruit quality using bioscience.
Acta Horticulturae 376 : 75 – 80.

152
Schwender, J., Zeidler, J., Groner, R., Muller, C., Focke, M., Braun, S.,
Lichtenthaler, F. W. & Lichtenthaler, H. K. 1997. Incorporation of 1-deoxy-
xylulose into isoprene and phytol by higher plants and algae. Federation of
European Biochemical Societies Letters 414(1) : 129 - 134.
Shackel, K.A., Greve, C., Labavitch, J.M. & Ahmadi, H. 1991. Cell turgor
changes associated with ripening in tomato pericarp tissue. Plant
Physiology 97 : 814 – 816.
Shelp, B.J. & Shattuck, V.I. 1986. Accumilation of 14C from foliar applied [14C]
urea by developing tomato fruits. Horticultural Sciences 21 : 1178 – 1179.
Sies, H. & Stahl, W. 1995. Vitamins E and C, ß-carotene, and other carotenoids
as antioxidants. American Journal of Clinical Nutrition 62 : 1315 - 1321.
Singer, S. J. & Nicolson, G.L. 1972. The fluid mosaic model of the structure of
cell membranes. Science 175 : 720 – 731.
Smith, O. 1935. Pollination and life history studies of the tomato (Lycopersicon
esculentum Mill.) Memoirs of the Cornell University Agricultural
Experiment Station 184 : 1 – 16.
Sonneveld, C. 1995. Fertigation in the greenhouse industry. In: Dhalia Greindiger
International Symposium in Fertigation, Technicon, Haifa, Israel. pp.
212 – 227.
Stahl, W. & Sies, H. 1996. Lycopene: a biologically important carotenoid for
humans? Biochemistry and Biophysics 336(1) : 1 – 9
Stamp, N. 2003. Out of the quagmire of plant defense hypotheses. Quarterly
Review of Biology 78(1) : 23 – 55.

153
Steinmetz, K.A. & Potter, J.D. 1996. Vegetables, fruits, and cancer prevention: A
review. Journal of the American Diet Association 96 : 1027 – 1039.
Stern, K.R, Jansky, S. & Bidlack, J.E. 2003. Introductory plant biology, 9th
edition. McGraw-Hill publishers Inc. p. 477.
Stevens, M.A., Kader, A.A. & Albright-Houlton, M. 1977. Intercultivar variation in
composition of locular and pericarp portions of fresh market tomatoes.
Journal for the American Society for Horticultural Science 102 :
689 – 692.
Stewart, A.J., Bozonnet, S., Mullen, W., Jenkins, G.I., Lean, M.E.J. & Crozier, A.
2000. Occurrence of flavonols in tomatoes and tomato-based products,
Journal of Agricultural and Food Chemistry 48(7) : 2663 – 2669.
Sun, I., Loboda, T., Sung, S. & Black, C.C. 1992. Sucrose synthase in wild
tomato Lycopersicon chmielewskii and tomato fruit sink strength. Plant
Physiology 98 : 1163 – 1169.
Sussman, M.R. & Harper, J.F. 1989. Molecular biology of the plasma membrane
of higher plants. The Plant Cell 1 : 953 – 960.
Sutherland, S. & Sutherland, J. 1987. Hydroponics for everyone. A practical
guide to gardening in the 21st century, P. imprinta, Melbourne. p. 104.
Swietlik, D. & Faust, M. 1984. Foliar nutrition of fruit crops. In: Horticultural
Reviews, vol. 6. Ed: Janick, J. Avi Publishing Company, Inc., Westport.
pp. 287 - 355.

154
Tan, X.W., Ikeda, H. & Oda, M. 1999. Absorbtion, translocation and assimilation
of foliar applied urea compared with nitrate and ammonium in tomato
plants. Soil Science and Plant Nutrition 45(3) : 609 – 616.
Tanaka, A., Fujita, K. & Kikuchi, K. 1974. Nutrio-physiological studies on the
tomato plant. I. Outline of growth and nutrient absorption. Soil Science and
Plant Nutrition 20(1) : 57 – 68.
Tempest, D.W., Meers, J.L., & Brown, C.M. 1970. Synthesis of glutamate in
Aerobacter aerogenes by a hitherto unknown route. Biochemical Journal
117(2) : 405 – 407.
USDA (United States Department of Agriculture). 2000. Vegetables and
Specialties Situation and Outlook Yearbook. Economical Research
Service. Washington D.C. Report TVS-255. p.62
van Assche, C. & Vangheel, M. 1994. Special phytopathological problems in
soilless cultures and substrate cultures. Acta Horticulturae 361 :
355 – 360.
van Ravestijn, W. & Molhoek, W.M.L. 1978. Effects of pollination on fresh and
dry weight, size, number of seeds and harvest date of tomato fruit. Annual
Report: Glasshouse Crop Research Experimental Station Naaldwijk, p 41.
Vance, C.P. & Griffith, S.M. 1990. The molecular biology of nitrogen metabolism.
In: Plant physiology, Biochemistry and Molecular Biology. Ed: Dennis, D.T.
& Turpin, D.H. pp 373 – 374.
Vavrina, C.S. & Obreza, T.A. 1993. Response of Chinese cabbage to nitrogen
rate and source in sequential plantings Horticultural Science 28(12) :
1164 – 1165.

155
Verkerke, W. & Kersten, M. 2000. Validation of a preliminary model for tomato
fruit taste based on instrumental measurements. Acta Hortticulturae 519 :
121 – 124.
Verma, D.P.S., Fortin, M.G., Stanley, J., Mauro, V.P., Purohit, S. & Morrison,
N. 1986. Nodulins and nidulin genes of Glycine max. A perspective. Plant
Molecular Biology 7(1) : 51 – 61.
Waldron, K.W., Parker, M.L. & Smith, A.C. 2003. Plant cell walls and food quality.
Comprehensive Reviews in Food Science and Food Safety 2 : 101 – 119.
Walker, A.J. & Ho, L.C. 1977. Carbon translocation in the tomato: Effects of fruit
temperature on carbon metabolism and the rate of translocation. Annals of
Botany 41 : 825 – 832.
Walker, A.J., Ho, L.C. & Baker, D.A. 1978. Carbon translocation in the tomato:
Pathway to carbon metabolism in the fruit. Annals of Botany 42 :
901 – 909.
Wang, F., Sanz, A., Brenner, M.L. & Smith, A. 1993. Sucrose synthase, starch
accumulation and tomato fruit sink strength. Plant Physiology 101(1) :
321 – 327.
Welles, G.W.H. 1985. Ventilation: balance between production quality and
diseases. Tuinderij 65 : 30 – 31.
Wilson, M.R. & Walker, N.A. 1988. The transport and metabolism of urea in
Chara australis, I. Passive diffusion, specific transport and metabolism of
urea and methylurea. Journal of Experimental Botany 39(6) : 739 – 751.

156
Wilson, M.R., O’Donoghue, S.I. & Walker, N.A. 1988. The transport and
metabolism of urea in Chara australis, III. Two specific transport systems.
Journal of Experimental Botany 39 : 763 – 774.
Winsor, G.W. 1979. Some factors affecting the composition, flavour and firmness
of tomatoes. Acta Horticulturae 93 : 335 – 346.
Winsor, G. W., Davies, J.N. & MASSEY, D.M. 1962(a). Composition of tomato
fruit. III. Juices from whole fruit and locules at different stages of ripeness.
Journal of the Science of Food and Agriculture 13(2) : 108 - 115.
Winsor, G. W., Davies, J.N. & MASSEY, D.M. 1962(b). Composition of tomato
fruit. IV. Changes in some constituents of the fruit walls during ripening.
Journal of the Science of Food and Agriculture 13(2) : 141 - 145.
Winterborne, J. 2005. Hydroponicist Indoor Horticulture. Pukka Press Limited.
Published in 2005. p. 208.
Witte, C.P., Tiller, S.A., Taylor, M.A. & Davies, H.V. 2002. Leaf urea metabolism
in potato. Urease activity profile and patterns of recovery and distribution
of 15N after foliar urea application in wild-type and Urease-Antisense
transgenics. Plant Physiology 128 : 1129 – 1136.
Wittwer, S.H., Bukovac, M.J. & Tukey, H.B. 1963. Advances in foliar feeding of
plant nutrients. In: Fertilizer technology and usage Ed: McVickar M.H.,
Bridger, G.L. & Nelson, L.B. Science Society of America, Madison.
pp. 429 – 455.
Witztum, J.L. 1994. The oxidation hypothesis of atherosclerosis. The Lancet
344(8925) : 793 - 795.

157
Xianquan, S., Shi, J., Kakuda, Y. & Yueming, J. 2005. Stability of lycopene
during food processing and storing. Journal of Medicinal Food 8(4) :
413 – 422.
Ya Ling, L. & Stanghillini, C. 2001. Analasys of the effect of EC on vegetative
growth of tomato. Scienta Horticulturae 89(1) : 9 – 21.
Yamanda, Y., Jyung, W.H., Wittwer, S.H. & Bukovac, M.J. 1965. Effect of urea
on ion penetration through isolated membranes. Plant Physiology 39 :
978 – 982.
Yelle, S., Hewitt, J.D., Robinson, N.L., Damon, S. & Bennett A.B. 1988. Sink
metabolism in tomato fruit, lll. Analysis of carbohydrate assimilation in a
wild species. Plant Physiology 87 : 737 – 740.
Yelle, S., Chetelat, R.T., Dorais, M., Deverna, J.W. & Bennett, A.B. 1991. Sink
metabolism in tomato fruit, IV. Genetic and biochemical analysis of
sucrose accumulation. Plant Physiology 95 : 1026 – 1035.
Young, T.E., Juvik, J.A. & Sullivan, J.G. 1993. Accumulation of the components
of total solids in ripening fruits of tomato. Journal of the American Society
for Horticultural Science 118(2) : 286 - 292.

158
INTERNET REFERENCES
Internet 1: Tike, Information Centre of the Ministry of Agriculture and Forestry
(http://www.mmmtike.fi/en/index/press_releases/080128_
press_releases_2009/ horticultural_statistics_2008.html)
(Sited on 16 June 2009)
Internet 2: http://msucares.com/pubs/publications/p1828.htm#pollination.
Greenhouse Tomato Handbook. p 5 – 6. By Dr. Richard G. Snyder,
Extension Vegetable Specialist. Publication 1828. Extension Service
of Mississippi State University, cooperating with U.S. Department of
Agriculture. Published in furtherance of Acts of Congress, May 8 and
June 30, 1914. Ronald A. Brown, Director (Sited on 3 July 2008) as
well as :http://articlesofhealth.blogspot.com/2008/01/law-of-
similars.html (Sited on 2 April 2009)
Internet 3: www.lycopene.com &
http://www.lycocard.com/index.php/lyco_pub/health/ (sited on 16
June 2009)
Internet 4: www.profert.co.za/produkbu_e.html
Internet 5: http://www.pnas.org/content/100/11/6866/F1.large.jpg. Article: Laule,
O., Fürholz, A., Chang, H., Zhu, T., Wang, X., Heifetz, P.B.,
Gruissem, W. and Lange, M. 2003. Crosstalk between cytosolic and
plastidial pathways of isoprenoid biosynthesis in Arabidopsis
thaliana. (Sited on 4 July 2008).

159
Internet 6: http://www.etfrc.com/neuron.htm
Internet 7: http://en.wikipedia.org/wiki/Hydroponics
Internet 8 : www.istockphoto.com

160