the 5-methyl-deoxy-cytidine localization to reveal in situ ... · software running in conjunction...
TRANSCRIPT

1
The 5-methyl-deoxy-cytidine localization to reveal in situ the dynamics of DNA
methylation chromatin pattern in a variety of plant organ and tissue cells
during development
Pilar S. Testillano*, María-Teresa Solís, María C. Risueño
Plant Development and Nuclear Architecture, Biological Research Centre, CIB-CSIC
Ramiro de Maeztu 9, 28040 Madrid, Spain
*Corresponding author
E-mail: [email protected]
Phone: +3418373112
Fax: +3415360432
Running title: Approach for in situ DNA methylation pattern during plant development
Key words: Epigenetics, plant cell nucleus, proliferation, differentiation, quiescent cell,
cycling cell, chromosomes, confocal microscopy.

2
ABSTRACT
DNA methylation of cytosine residues constitutes a prominent epigenetic
modification of the chromatin fibre which is locked in a transcriptionally inactive
conformation leading to gene silencing. Plant developmental processes, as
differentiation and proliferation, are accompanied by chromatin remodeling and
epigenetic reprogramming. Despite the increasing knowledge gained on the epigenetic
mechanisms controlling plant developmental processes, the knowledge of the DNA
methylation regulation during relevant developmental programs in flowering plants,
such as gametogenesis or embryogenesis, is very limited. The analysis of global DNA
methylation levels has been frequently conducted by high performance capillary
electrophoresis, and more recently also by ELISA-based assays, which provided
quantitative data of whole organs and tissues. Nevertheless, to investigate the DNA
methylation dynamics during plant development in different cell types of the same
organ, the analysis of spatial and temporal pattern of nuclear distribution of 5-methyl-
deoxy-cytidine (5mdC) constitutes a potent approach. In the present work,
immunolocalization of 5mdC on sections and subsequent confocal laser microscopy
analysis have been applied for in situ cellular analysis of a variety of plant cells, tissues
and organs with different characteristics, e.g. hardness, heterogeneity, cell accessibility,
tissue compactness, etc. results demonstrated the versatility and feasibility of the
approach for different plant samples, and revealed defined DNA methylation nuclear
patterns associated with differentiation and proliferation events of various plant cell
types and developmental programs. Quantification of 5mdC immunofluorescence
intensity by image analysis software also permitted to estimate differences in global
DNA methylation levels among different cells types of the same organ during
development.

3
INTRODUCTION
DNA methylation of cytosine residues constitutes a prominent epigenetic
modification of the chromatin fibre which is locked in a transcriptionally inactive
conformation leading to gene silencing. Generally open chromatin increases the
accessibility of the genome to transcription machinery, while closed chromatin
represses gene expression by limiting the accessibility (Kouzarides, 2007; Pfluger and
Wagner, 2007; Reyes, 2006). Changes in this epigenetic mark, together with histone
modifications, result in changes in nucleosome conformation which finally alter DNA
accessibility of factors responsible for activation or repression of gene expression. Since
chromatin regulation plays a critical role in determining cell fate of totipotent cells, the
organization of chromatin domains provides an additional platform for a regulatory
level controlling genetic information (Sang et al., 2009).
There are increasing evidences that numerous processes of plant development
and differentiation are accompanied by chromatin remodeling and epigenetic
reprogramming (Kouzarides, 2007; Tessadori et al., 2007). Epigenetic control plays an
essential role in the process of cellular differentiation allowing cells to be
reprogrammed in order to generate new differentiation pathways (Costa and Shaw,
2007; Kouzarides, 2007). The architecture of the cell nucleus is highly dynamic and
organized in distinct functional domains which modify their organization in response to
changes in the nuclear function and gene expression during plant developmental
processes (Seguí-Simarro et al., 2006, 2011; Testillano et al., 2000, 2005). However, the
relationship between DNA methylation and large-scale organization of nuclear
architecture is poorly understood. New evidences showed that changes in DNA
methylation accompany the reorganization of the nuclear architecture during plant
developmental processes and particularly in cell differentiation, proliferation, and
reprogramming (Kumaran et al., 2008; Meijón et al., 2009; Solís et al., 2012).
Research in the past years has revealed exciting findings with regard to
epigenetic mechanisms controlling plant developmental processes (Twell, 2011;
Zluvova et al., 2001). However, the knowledge of the DNA methylation regulation
during relevant developmental programs in flowering plants, such as gametogenesis or
embryogenesis, is very limited (Solís et al., 2012; Twell, 2011). Several reports, using

4
biochemical analysis of whole organs, have described changes in the global methylation
levels of DNA with the differentiation of plant reproductive organs (Meijón et al., 2009;
Ribeiro et al., 2009; Zhao et al., 2008; Zluvova et al., 2001). Nevertheless, data on the
modifications in the nuclear distribution pattern of the methylated DNA in situ in
relation to the chromatin pattern dynamics is still very scarce. Difficultly in accessing
specific cell types inside organs and tissues, like for example the very young embryo or
endosperm inside the maternal tissues or the developing microspores inside the anthers,
has made biochemical and molecular analysis sometime problematic, as well as the
studies at cellular and subcellular levels have been especially difficult. Although
partially overcome by the use of in vitro systems, in situ localization approaches using
modern bioimaging technology have became essential tools (Testillano and Rodríguez
2012, Rodríguez-Serrano et al. 2012). The exploitation of fluorescent probes and
antibodies has significantly contributed to the analysis of cellular and subcellular
events; the challenge of these in situ methodologies has been to overcome the
limitations associated with the specific features of various plant cells compartments
such as cell wall, endocytic compartment, vacuoles, etc.
To investigate the global DNA methylation dynamics during plant development,
the analysis of spatial and temporal pattern of nuclear distribution of 5-methyl-deoxy-
cytidine (5mdC) constitutes a potent approach, which permitted to distinguish among
cell types and processes in the same organ, in comparison with the electrophoretic and
ELISA assays used to quantify the percentage of methylated cytidines in genomic DNA.
In the present work, immunolocalization of 5mdC and confocal analysis have been
applied to several plant cells types and organs with different characteristics for in situ
cellular analysis on section, e.g. hardness, heterogeneity, cell accessibility, tissue
compactness, etc; the results demonstrated the versatility and feasibility of the approach
for different plant samples, and revealed defined DNA methylation nuclear patterns
associated with differentiation and proliferation events of various plant cell types and
developmental programs. Quantification of 5mdC immunofluorescence intensity by
appropriate confocal image software also permitted to estimate differences in global
DNA methylation levels among different cells types of the same organ during
development and under different physiological conditions.

5
MATERIAL AND METHODS
Plant material
Nicotiana tabacum L. plants were grown in a growth chamber (MLR 350H,
SANYO) at 25ºC, 80 % humidity and a photoperiod of 16 hours of light. Flower buds
and anthers were excised and processed for further analysis. Bulbs of Allium cepa L.
were germinated in water under standard conditions, and after two days root segments
corresponding to the proliferating meristematic zones were selected. Some dried bulbs,
not subjected to germination conditions, were used to obtain quiescent root meristems
which were excised from the interior of bulbs.
Fixation and processing for immunofluorescence
Root samples were used as plant material which is homogeneous in hardness and
easy to section without embedding media. They were processed for cryostat and
vibratome sectioning. Anthers were selected as a more heterogeneous plant material in
which pollen grains inside the anther cannot be sectioned with cryostat or vibratome.
Anthers were processed for embedding in an appropriate acrylic resin. All samples were
fixed in 4% paraformaldehyde in phosphate buffered saline (PBS) at 4ºC overnight.
- Processing for vibratome and cryostat sectioning
After fixation, root samples were washed in PBS and either, directly sectioned in the
vibratome or cryoprotected in sucrose (gradual infiltration in sucrose solutions: 0.1 M
for 1 hour, 1 M for 1 hour and 2.3 M for 3 hours, at 4ºC), embedded in OCT compound
and frozen on dry ice for sectioning in the cryostat. Thirty-forty micrometers thick
vibratome sections were obtained and placed on a drop of water over 3-aminopropyl-
triethoxy-silane (APTES)-coated slides, air-dried and stored at -20ºC until use for
immunofluorescence (IF). Ten-twenty micrometers thick cryostat sections were
collected in glass slides, washed with water to eliminate the OCT and transferred to a
water drop over silanized slides; they were finally air-dried and stored at -20ºC until use
for IF.

6
- Processing for low-temperature resin embedding and semithin sectioning
Fixed anthers were washed in PBS and processed for embedding at low temperatures in
either Technovit 8100 resin (Kulzer, Germany) or K4M Lowicryl resin (Polysciences).
For Technovit 8100, anthers were dehydrated in an acetone series and embedded at 4ºC,
as previously described (Solís et al., 2008). For K4M Lowicryl, samples were
dehydrated in a methanol series by Progressive Lowering of Temperature (PLT) and
finally embedded at -30ºC under UV light in a Leica AFS device, as described
previously (Testillano et al., 2000). One-two micrometers semithin sections were
obtained from all resin-embedded samples, placed over a drop of water on APTES-
coated slides, air-dried and stored at 4ºC until use for immunofluorescence.
5-deoxy-methyl-cytidine immunofluorescence
For vibratome and cryostat sections, permeabilization was required prior to
immunofluorescence. The freezing of the sections and storage at -20ºC after their
collection, followed by thawing at room temperature constituted the first
permeabilization step. After bringing to room temperature, glass slides bearing the
sections were first dehydrated in a methanol series (30º, 50º, 70º, 90º, 100º; 5 min each)
and rehydrated in a methanol series (90º, 70º, 50º, 30º; 5 min each) and Phosphate
Buffered Saline (PBS). They were subsequently subjected to a mild enzymatic digestion
of cell walls for additional permeabilization by treatment with 2% (w/v) cellulase in
PBS for 1 h. Then, sections were washed three times for 5 min in PBS followed by the
immunodetection. Semithin resin sections did not required permeabilization and were
subjected directly to the immunodetection, after incubation in PBS for a few minutes.
At this step, all section types followed the same protocol of immunofluorescence.
Sections were denatured with 2N HCl for 45 min and then blocked with 5% (w/v)
Bovine Serum Albumine (BSA) in PBS for 10 min. Sections were then incubated for 1h
with the mouse monoclonal anti-5mdC antibody (Eurogentec, Cat. N. BI-MECY-0100,
Liege, Belgium) diluted 1:50 in 1% BSA in PBS. After three rinsing steps in PBS,
sections were incubated for 45 min in darkness with the secondary antibody, an anti-
mouse IgG conjugated to Alexa Fluor 488 (Molecular Probes; Leiden, The Netherlands)
diluted 1:25 in 1% BSA. After washing in PBS, nuclei were stained with DAPI (4.6-
diamidino-2-phenylindole), washed in sterile water, mounted in Mowiol and examined
in a confocal microscope (Leica TCS-SP2-AOBS; Vienna, Austria). Confocal optical

7
sections were collected either at 0.5 m or 0.1 m z-intervals for vibratome/cryostate or
resin sections respectively. Images of maximum projections were obtained with
software running in conjunction with the confocal microscope (Leica software LCS
version 2.5).
Control of immunofluorescence experiments
- Elimination of the DNA denaturation step.
A control was performed in all the section types and materials used by performing the
whole immunofluorescence protocol and eliminating the DNA denaturation step by
avoiding the HCl treatment before the antibody incubation.
- Immunodepletion of the antibody with 5mdC.
Pre-blocking of the anti-5mdC antibodies with its corresponding immunogen, the 5mdC
(Sigma-Aldrich) was performed by incubating the antibody with and a 5mdC solution
(5 g/l in water) in a proportion of 1:2, v/v, at 4ºC, overnight. The preblocked
antibody solution was used as primary antibodies for immunofluorescence on the
sections, following the same protocol and conditions as described above.
Quantification of fluorescence intensity in 5mdC immunolocalization confocal images
For each immunofluorescence microscopy preparation, confocal optical sections were
collected at 0.5m z-intervales, for vibratome and cryostate sections, and at 0.1m z-
intervales for resin sections, with a total of 15 sections. Images of maximum projections
were obtained and used for relative fluorescence intensity quantification with software
running in conjunction with the confocal microscope (Leica software LCS version 2.5).
Fluorescence intensity quantification was performed on random nuclei of each sample,
over 30 nuclei were measured per sample, repeating the experiment at least three times.
The minimum sample size was determined by the progressive mean technique. P-values
were calculated using t-Student test.

8
Quantification of global DNA methylation
High Performance Capillary Electrophoresis (HPCE)
To quantify global DNA methylation levels of the three plant cell types studied,
microspores, tapetal cells and root meristems, hydrolyzed DNA was prepared as
previously described (Solís et al., 2012). Genomic DNA was extracted using a plant
genomic DNA extraction kit (DNeasy Plant Mini, Qiagen) according to the
manufacturer's instructions. DNA was concentrated and resuspended to a concentration
of 1 μg/μl, denatured by heat and cooling rapidly in ice. DNA was hydrolized by
treatments with: a) 10 mM ZnSO4 and 0.5 μl of nuclease P1 (Sigma; 200 U/ml) for 16 h
at 37 °C, and b) 0.25 μl alkaline phosphatase (Sigma; 50 U/ml) for 2 h at 37°C.
Hydrolyzed solutions were centrifuged for 20 min at 15,000g and analyzed by HPCE
using capillary electrophoresis instruments CIA (Waters Chromatography) and PACE
2050 (Beckman), using the method and conditions previously described (Solís et al.,
2012). Quantification of the relative DNA methylation level of each sample was
calculated as the percentage of 5-methyl-deoxy-cytidines (5mdC) peak of total deoxy-
cytidines (dC+5mdC) peaks. Three biological and two analytical replicates per sample
were taken. P-values were calculated using t-Student test.
5mdC ELISA-based immunoassay
To compare relative levels of global DNA methylation between root meristems
in proliferating and quiescent conditions, a MethylFlash Methylated DNA
Quantification Kit (Colorimetric) (Epigentek, NY, USA) was used according to the
manufacturer’s instruction using 100 ng of genomic DNA for each sample (Li and Liu,
2011). Total DNA was extracted using a plant genomic DNA extraction kit (DNeasy
Plant Mini, Qiagen) according to the manufacturer's instructions. The purified DNA was
added to an ELISA plate where the methylated fraction of DNA was quantified using 5-
deoxy-methyl-cytosine specific antibodies. The amount of methylated DNA was
proportional to the OD (optical density) intensity measured in an ELISA plate reader at
450 nm. After subtracting negative control readings from the readings for the sample
and the standard, the value of 5-methyl-deoxy-cytosine for each sample was calculated
as a ratio of sample OD relative to the standard OD. Results were expressed as the

9
percentage of methylated deoxycytosines of total DNA. The assay was performed in
triplicate. P-values were calculated using t-Student test.

10
RESULTS AND DISCUSSION
Fluorescent in situ localization of 5mdC on sections, a reliable approach to analyze
DNA methylation pattern dynamics in different plant cell types
To evaluate the feasibility of the 5mdC immunofluorescence for plant materials, plant
samples with different characteristics for in situ cellular analysis on section were used:
root meristems and anthers. The root meristem was chosen as a sample with low/mild
hardness and relatively homogeneous structure; therefore, it could be sectioned without
embedding media by either the vibratome or the cryostate, providing thick sections with
good structural preservation. The anther was an organ more heterogeneous, composed
by very different cell types with different wall hardness and vacuoles; moreover, the
anthers contained microspores and pollen grains inside the pollen sac which would be
lost in non-embedded sections; therefore the anthers were processed and embedded in
acrylic resins at low temperature, to maintain their structural integrity and to preserve
their antigenic properties as much as possible. The resins of choice were Technovit
8100 and Lowicryl K4M.
The protocols have been designed to obtain reliable and successful results, taken
into account the particular properties of each cell type and tissue studied. They were
described in details in the Material and Methods section and involved several
permeabilization steps for vibratome and cryostate sections, including freezing-thawing,
dehydration-rehydration and mild cell wall enzymatic digestion. After permeabilization,
vibratome and cryostate sections were treated with the same protocol than resin
sections. Denaturation of the DNA in sections with HCl was essential to expose the
5mdC antigen to the antibodies. Further steps included the blocking and the incubations
with the first (anti-5mdC) and secondary (fluorochrome-Alexa-conjugated) antibodies.
The microscopical analysis of the immunofluorescence preparations was
performed in a confocal laser scanning microscope (CLSM) which permitted to obtain
optical sections and avoided the out-of-focus fluorescence of the thick (30-50 m)
vibratome-cryostat sections. 1-2 m semithin resin sections could be analyzed by both
CLSM and epifluorescence microscopes, even though the CLSM provided fluorescent
images of higher resolution and quality. The results obtained were similar in both
11
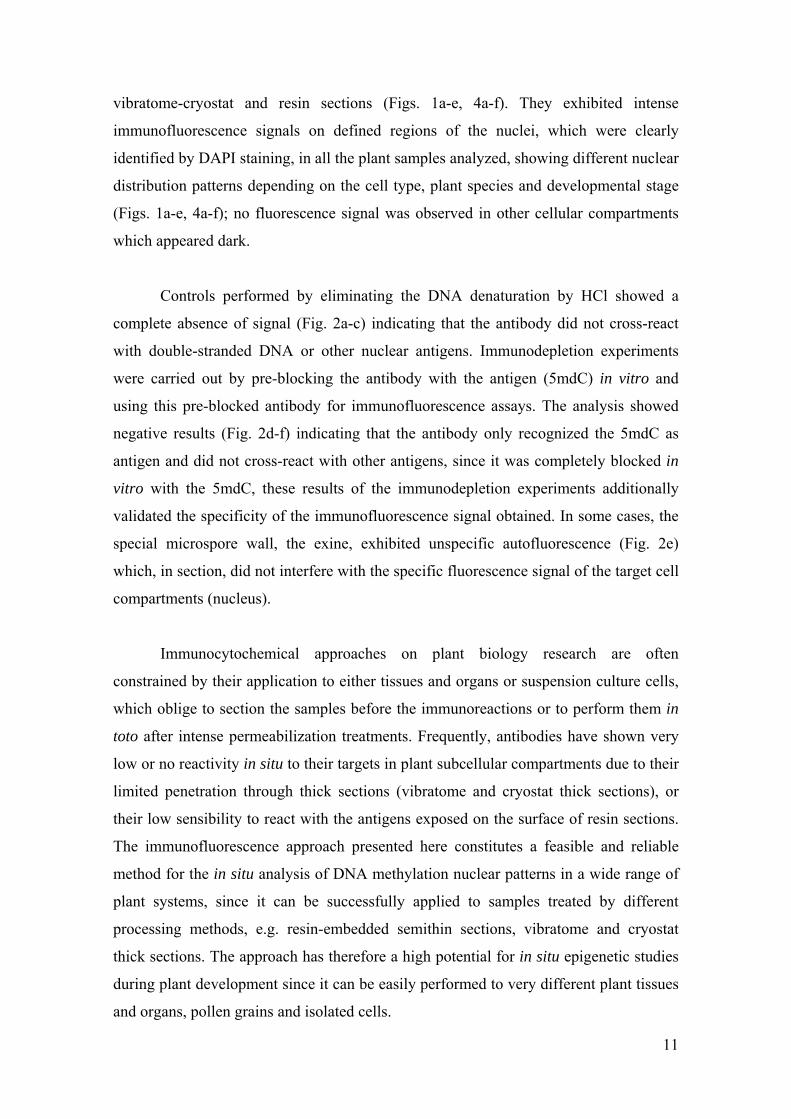
vibratome-cryostat and resin sections (Figs. 1a-e, 4a-f). They exhibited intense
immunofluorescence signals on defined regions of the nuclei, which were clearly
identified by DAPI staining, in all the plant samples analyzed, showing different nuclear
distribution patterns depending on the cell type, plant species and developmental stage
(Figs. 1a-e, 4a-f); no fluorescence signal was observed in other cellular compartments
which appeared dark.
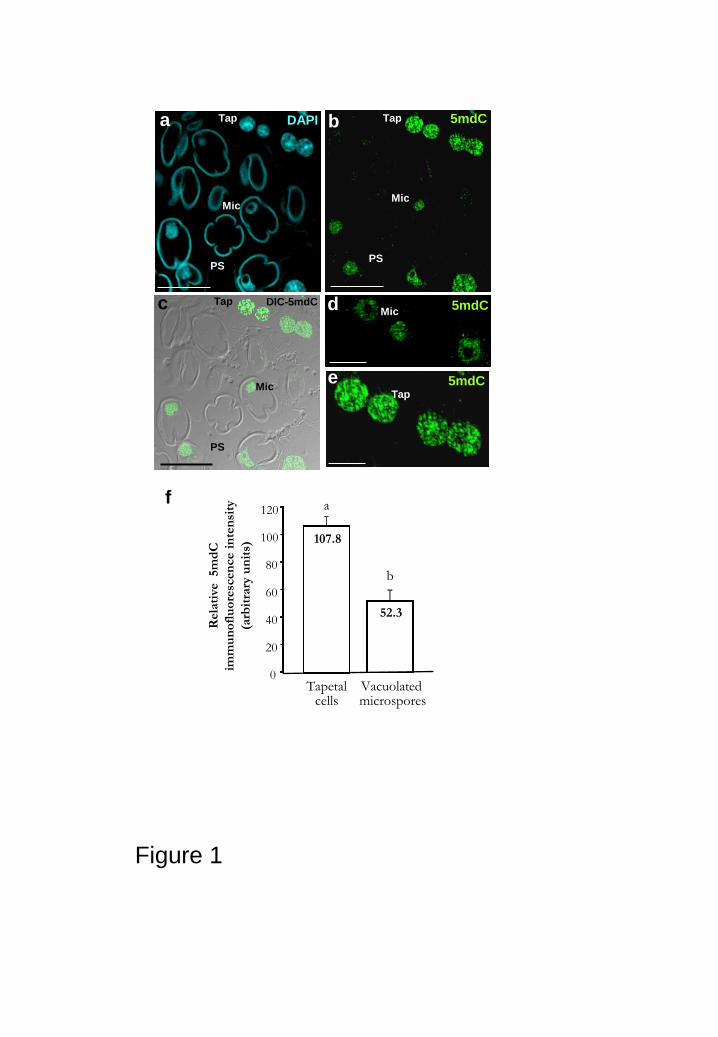
Controls performed by eliminating the DNA denaturation by HCl showed a
complete absence of signal (Fig. 2a-c) indicating that the antibody did not cross-react
with double-stranded DNA or other nuclear antigens. Immunodepletion experiments
were carried out by pre-blocking the antibody with the antigen (5mdC) in vitro and
using this pre-blocked antibody for immunofluorescence assays. The analysis showed
negative results (Fig. 2d-f) indicating that the antibody only recognized the 5mdC as
antigen and did not cross-react with other antigens, since it was completely blocked in
vitro with the 5mdC, these results of the immunodepletion experiments additionally
validated the specificity of the immunofluorescence signal obtained. In some cases, the
special microspore wall, the exine, exhibited unspecific autofluorescence (Fig. 2e)
which, in section, did not interfere with the specific fluorescence signal of the target cell
compartments (nucleus).
Immunocytochemical approaches on plant biology research are often
constrained by their application to either tissues and organs or suspension culture cells,
which oblige to section the samples before the immunoreactions or to perform them in
toto after intense permeabilization treatments. Frequently, antibodies have shown very
low or no reactivity in situ to their targets in plant subcellular compartments due to their
limited penetration through thick sections (vibratome and cryostat thick sections), or
their low sensibility to react with the antigens exposed on the surface of resin sections.
The immunofluorescence approach presented here constitutes a feasible and reliable
method for the in situ analysis of DNA methylation nuclear patterns in a wide range of
plant systems, since it can be successfully applied to samples treated by different
processing methods, e.g. resin-embedded semithin sections, vibratome and cryostat
thick sections. The approach has therefore a high potential for in situ epigenetic studies
during plant development since it can be easily performed to very different plant tissues
and organs, pollen grains and isolated cells.

12
Investigations of chromosome organization and arrangement in the nucleus have
been conducted since the beginning of cell biology research. There are increasing
evidences that numerous processes of development and differentiation in both plants
and animals are accompanied by chromatin remodelling (Kouzarides, 2007). Epigenetic
modifications, like DNA methylation and histone modifications have been revealed as
hallmarks that define the functional status of chromatin domains and confer the
flexibility of transcriptional regulation necessary for plant development and adaptative
responses to the environment (Grant-Downton and Dickinson, 2005; Solís et al., 2012;
Vaillant and Paszkowski, 2007). Histone modification and DNA methylation patterns
are expected to affect chromosome organization, although data on this subject are still
scarce, especially in plant systems. The DNA methylation nuclear patterns of different
plant cell types and their dynamics in relation to chromatin organization during
proliferation and differentiation processes can be easily characterized by the approach
presented here, based on the versatility of the immunolocalization protocol used and the
good resolution and quality provided by the CLSM analysis; the information raised will
give new insights into the mechanisms regulating epigenetic patterns and chromatin
remodelling during plant development and adaptation.
Different nuclear patterns of DNA methylation are revealed by 5mdC
immunofluorescence in microspores and tapetal somatic cells of the anther
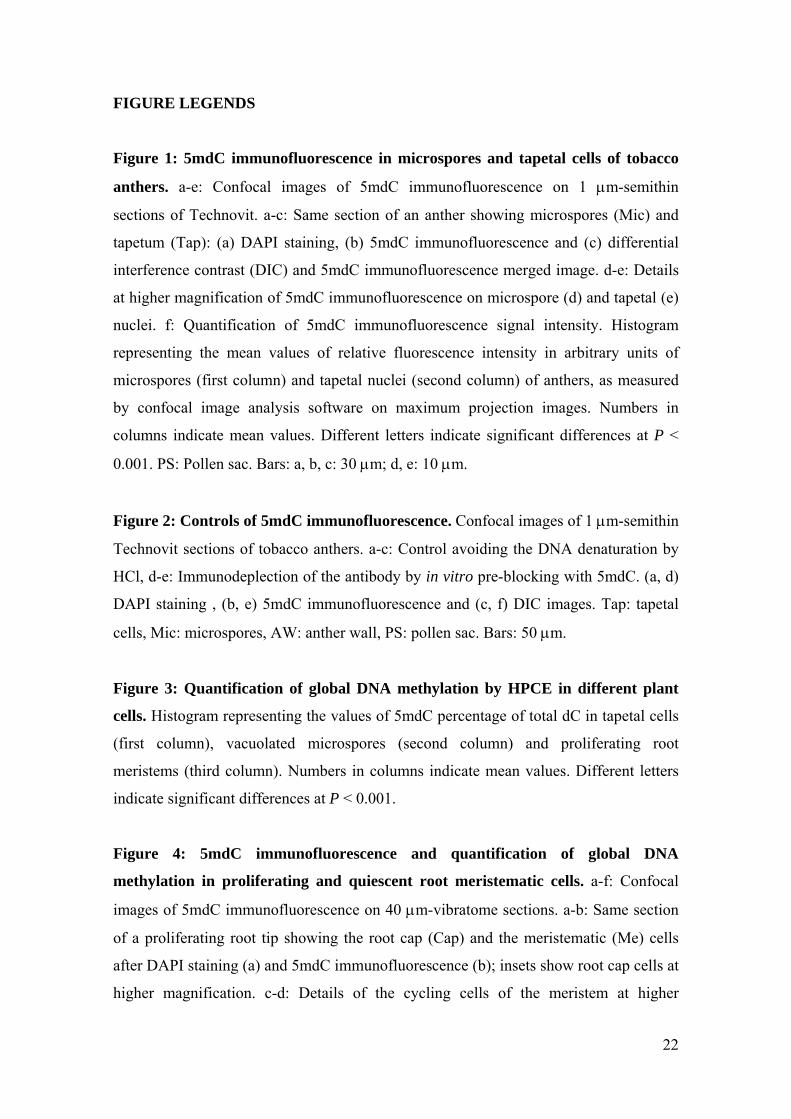
The 5mdC immunofluorescence signal showed different nuclear distribution patterns
depending on the cell type, plant species and developmental stage. In tobacco anthers,
the developing microspores at the stage of vacuolated microspores, showed rounded
nuclei and a large cytoplasmic vacuole which pushed the nucleus out of the middle (Fig.
1c). At this particular developmental stage the microspores have been reported highly
active in transcription (Testillano et al., 2000, 2005). The nuclei of the vacuolated
microspores exhibited faint 5mdC fluorescence throughout the whole nucleus, while
the nucleolus appeared dark; the distribution pattern followed a thin network with a few
spots (Figs. 1b, c) which corresponded to the low condensed chromatin state of the
microspores at this stage of development (Testillano et al., 2005).
13
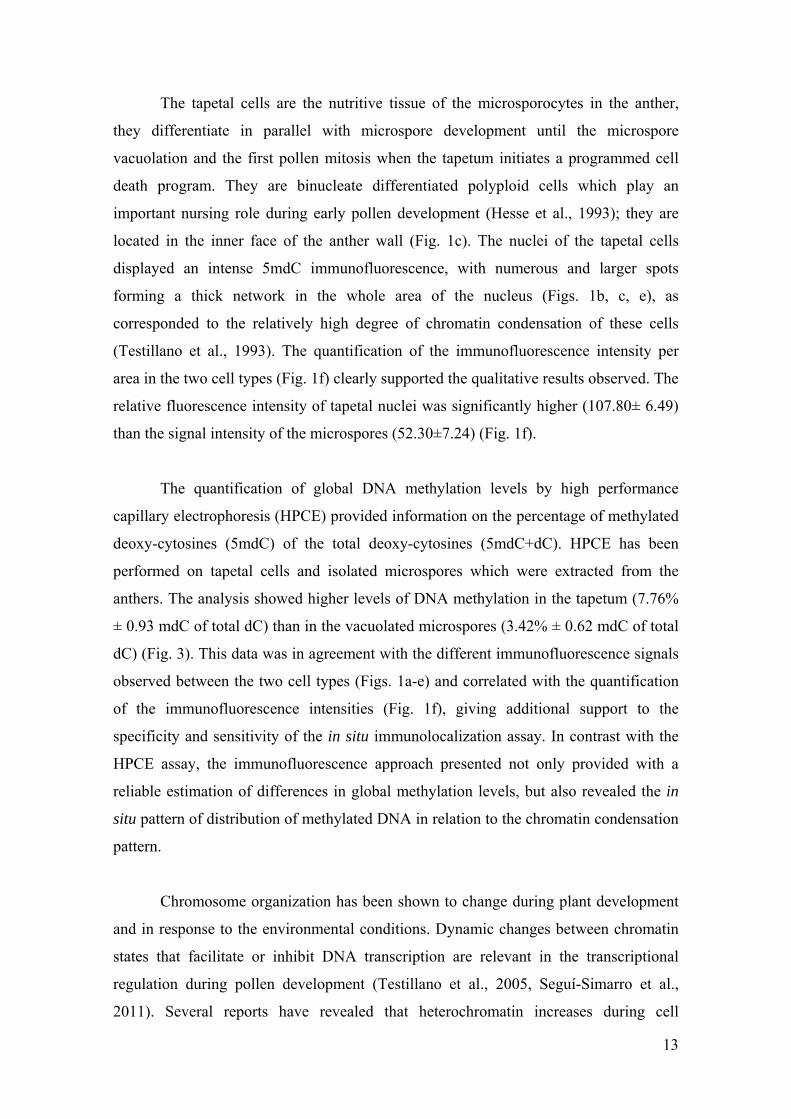
The tapetal cells are the nutritive tissue of the microsporocytes in the anther,
they differentiate in parallel with microspore development until the microspore
vacuolation and the first pollen mitosis when the tapetum initiates a programmed cell
death program. They are binucleate differentiated polyploid cells which play an
important nursing role during early pollen development (Hesse et al., 1993); they are
located in the inner face of the anther wall (Fig. 1c). The nuclei of the tapetal cells
displayed an intense 5mdC immunofluorescence, with numerous and larger spots
forming a thick network in the whole area of the nucleus (Figs. 1b, c, e), as
corresponded to the relatively high degree of chromatin condensation of these cells
(Testillano et al., 1993). The quantification of the immunofluorescence intensity per
area in the two cell types (Fig. 1f) clearly supported the qualitative results observed. The
relative fluorescence intensity of tapetal nuclei was significantly higher (107.80± 6.49)
than the signal intensity of the microspores (52.30±7.24) (Fig. 1f).
The quantification of global DNA methylation levels by high performance
capillary electrophoresis (HPCE) provided information on the percentage of methylated
deoxy-cytosines (5mdC) of the total deoxy-cytosines (5mdC+dC). HPCE has been
performed on tapetal cells and isolated microspores which were extracted from the
anthers. The analysis showed higher levels of DNA methylation in the tapetum (7.76%
± 0.93 mdC of total dC) than in the vacuolated microspores (3.42% ± 0.62 mdC of total
dC) (Fig. 3). This data was in agreement with the different immunofluorescence signals
observed between the two cell types (Figs. 1a-e) and correlated with the quantification
of the immunofluorescence intensities (Fig. 1f), giving additional support to the
specificity and sensitivity of the in situ immunolocalization assay. In contrast with the
HPCE assay, the immunofluorescence approach presented not only provided with a
reliable estimation of differences in global methylation levels, but also revealed the in
situ pattern of distribution of methylated DNA in relation to the chromatin condensation
pattern.
Chromosome organization has been shown to change during plant development
and in response to the environmental conditions. Dynamic changes between chromatin
states that facilitate or inhibit DNA transcription are relevant in the transcriptional
regulation during pollen development (Testillano et al., 2005, Seguí-Simarro et al.,
2011). Several reports have revealed that heterochromatin increases during cell

14
differentiation and organ maturation, while it decreases during cell proliferation and de-
differentiation (Solís et al., 2012; Tessadori et al., 2007; Testillano et al., 2000, 2005).
Chromocenters, the heterochromatin masses of the centromere regions of chromosomes,
become smaller in leaves prior to the transition to reproductive development and
recover to their former size after the elongation of the floral stem (Tessadori et al.,
2007; Tiang et al., 2012). Changes in the ploidy level generated by endoreduplication
have been shown to affect chromosome arrangement in Arabidopsis (Berr and Schubert,
2007). On the other hand, several studies have described an increase on the global
methylation levels of DNA with the differentiation of plant reproductive organs (Meijón
et al., 2009; Ribeiro et al., 2009; Zhao et al., 2008; Zluvova et al., 2001), but the nuclear
distribution pattern of the methylated DNA has not been analyzed in those systems.
The results presented here, showed differences in the distribution pattern of the
5mdC in two plant cell types of the anther, the microspore and the tapetal cell in relation
to their different chromatin condensation pattern. The microspore is transcriptionally
very active at the particular developmental stage of vacuolated microspore (Testillano et
al., 2005), showing a decondensed chromatin pattern with scarce and small
heterochromatin masses (Testillano et al., 2005), whereas the tapetal cells are in a
highly differentiated state with numerous heterochromatin masses (Testillano et al.,
1993). The differences in the 5mdC distribution pattern were associated with defined
heterochromatin organizations, which subsequently reflected differences in the
developmental program and the transcriptional activity of each cell type, microspores
and tapetal cells. High 5mdC immunofluorescence signal was associated with high
heterochromatization (chromatin condensation) during late differentiation in the tapetal
nuclei, while lower signal accompanied the vacuolated microspore which exhibited a
more decondensed chromatin organization and has been reported with a high
transcriptional activity at this stage of development (Testillano et al., 2005).
Cycling and quiescent root meristematic cells showed different nuclear patterns of
DNA methylation revealed by 5mdC immunofluorescence
The root meristem constitutes a good model of proliferating cells for the analysis of
DNA methylation dynamics. In germinating conditions, the root meristem was formed
by lines of cycling cells showing typical interphase nuclei and mitotic chromosomes

15
(Figs. 4a-f). Proliferating root meristems were also analyzed by HPCE to quantify the
percentage of DNA methylation; the results showed a low global methylation level
(1.97% ± 0.35 mdC of total dC) of the proliferating root cells in comparison with the
differentiating microspores and tapetal cells (Fig. 3). This result suggested a relationship
between low DNA methylation degree and plant cells in active proliferation. On the
contrary, higher methylation levels were associated with plant cells in differentiation,
like microspores and tapetal cells (Fig. 3).
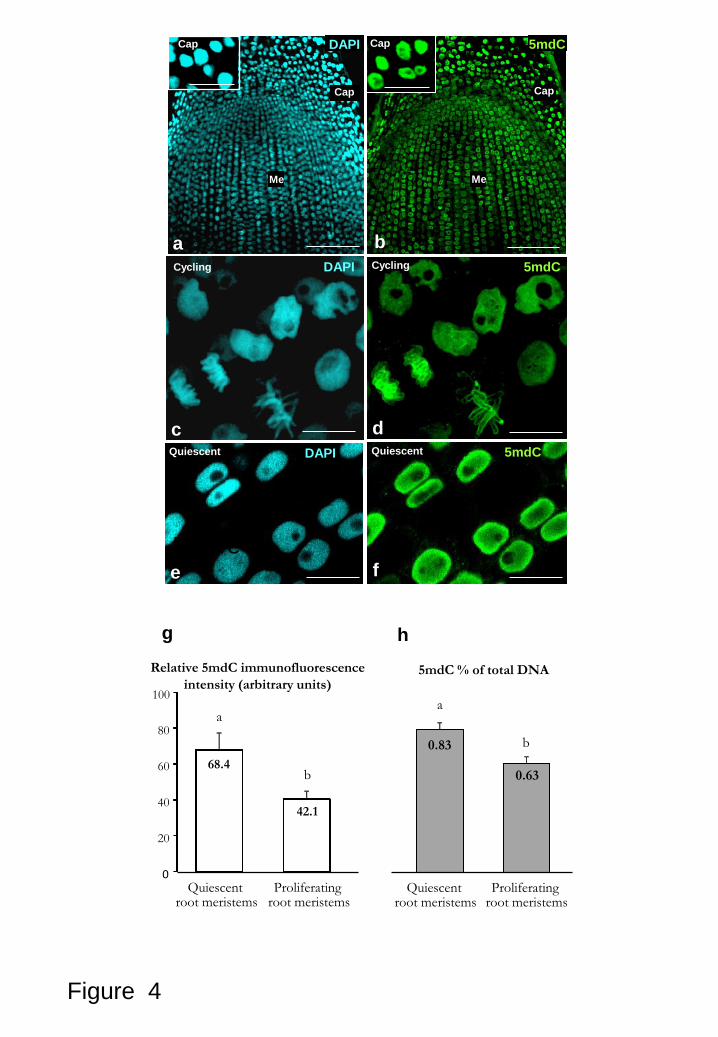
Confocal microscopy analysis of proliferating root tips showed 5mdC
immunofluorescence signals of medium intensity that appeared decorating the nuclei of
meristematic cells with different distribution patterns, whereas the nuclei of the root cap
cells exhibited more intense fluorescence signals (Figs. 4a, b, and insets) corresponding
with their higher degree of chromatin condensation. In cycling interphasic nuclei, the
5mdC fluorescence exhibited different intensities and distribution patterns (Figs. 4c, d);
probably corresponding to nuclei at different interphase periods of the cell cycle
presenting different chromatin condensation states. Nuclei of cycling meristematic cells
showed the 5mdC signal as a thin reticulum covering the whole nucleus area, with
different intensities and thickness threads on individual nuclei (Figs. 4c, d), the nucleoli
did not show fluorescence in any case, appearing as dark rounded regions in both DAPI
and 5mdC micrographs. Mitotic chromosomes exhibited an intense 5mdC
immunofluorescence along the chromosome arms (Figs. 4c, d), as corresponds to their
high condensation. In some cases more intense signals were found at the chromosomal
periphery, close to the region where nucleolar RNPs are relocated during metaphase and
anaphase, as described in plant cells by silver impregnation methods (Medina et al.,
1986; Risueño and Medina, 1986), and in animal cells (Hernández-Verdún and Gautier,
1994). Recently, regions of highly methylated DNA have been identified along
chromosomes of Brachypodium distachyon in squash preparations, relating them to the
condensation degree and structure of the chromosomes (Borowska et al., 2011). The
method presented here could help to analyze the methylation patterns of chromosomes
during different mitotic phases which can be clearly identified on sections of
proliferating meristems, rather than on squash preparations.
The quiescent root meristems were obtained from onion bulbs in non-
germinating conditions; therefore, they contained meristematic cells that were not active

16
in proliferation. The pattern of 5mdC immunofluorescence obtained in quiescent root
meristematic cells was different than that of cycling cells. The signal appeared very
intense in the nucleus (Figs. 4e, f), however the nucleolus did not show any labelling.
This homogeneous and high 5mdC signal revealed a pattern of DNA methylation in
quiescent nuclei consistent with the inactive state of the cells and the condensed
chromatin organization reported for quiescent root cells (Risueño and Moreno-Díaz de
la Espina et al., 1979). The immunofluorescence intensity was quantified in the
interphasic nuclei of proliferating and quiescent roots. The results showed that quiescent
root nuclei exhibited relative fluorescence intensity significantly higher (68.40±9.15)
than the nuclei of proliferating roots (42.10±3.73) (Fig. 4g), the quantification of the
immunofluorescence intensity supporting clearly the differences observed in the
confocal images (Fig. 4g).
To compare the relative amounts of methylated DNA between proliferating and
quiescent root meristems, an ELISA-based assay (Eurogentek, NY, USA) was
performed (Li and Liu 2011). The results showed significant differences among roots
under the two different physiological conditions (Fig. 4h), the quiescent roots showing
higher levels of DNA methylation (0.83% ± 0.03 mdC of total DNA) than the
proliferating ones (0.63% ± 0.04 mdC of total DNA). This data was in agreement with
the different immunofluorescence signals obtained in the two types of root meristems
with very different activity states (Figs. 4c-f), as well as with the quantification of their
fluorescence intensities (Fig. 4g); the higher transcriptional activity of proliferating
roots being associated with the lower DNA methylation level obtained, while the lower
activity of quiescent roots was accompanied by a higher percentage of methylated DNA
(Fig. 4h). Taken together, these results indicated that the 5mdC in situ localization
presented here constitutes a convenient approach to characterize changes in DNA
methylation nuclear patterns and to estimate differences in global methylation levels,
not only among different cells types of the same organ during development, but also in
a particular cell type under different physiological conditions.
During interphase, chromosomes assume a largely decondensed state. However,
chromatin is still non-randomly arranged within the nuclear space. Each chromosome
occupies a limited, exclusive nuclear subdomain, known as a chromosome territory

17
(reviewed in Tiang et al., 2012). Even though there has been a growing interest in
understanding how chromosome and chromatin arrangement in interphase nuclei affect
gene activity, effects of chromatin organization on gene expression are still poorly
understood in plants. The analysis the DNA methylation pattern dynamics as epigenetic
mark of the chromatin functional state in relation to the nuclear architecture will help to
understand how interphase chromosome arrangement affects gene expression during
plant growth and development in plants, and in response to specific environmental
conditions. The results of the present work revealed a change in the DNA methylation
nuclear pattern of meristematic root cells caused by different external conditions: non-
germinating conditions which keep the meristem in a quiescent state, and germinating
agents inducing meristem proliferation and root growth. The data suggested that DNA
methylation nuclear pattern dynamics accompany the modifications of chromatin
condensation associated with the activation of proliferation, which can be driven by
external conditions and inner signals inducing specific growth processes.

18
ACKNOWLEDGEMENTS
Thanks are due to Prof. María-Jesús Cañal (BOS Department, Oviedo University,
Spain) and Prof. Alejandro Cifuentes (CIAL, CSIC, Madrid, Spain) for their help with
the HPCE analysis, and to Ms. Alicia Rodríguez-Huete for her skillful technical work.
Work supported by projects granted by the Spanish Ministry of Science and Innovation
(MICINN), BFU2011-23752, BFU2008-00203 and AGL2008-04255, and CSIC, PIE
201020E038.
19
REFERENCES
Berr A and Schubert I (2007) Interphase chromosome arrangement in Arabidopsis thaliana is similar in differentiated and meristematic tissues and shows a transient mirror symmetry after nuclear division. Genetics 176:853-863.
Borowska N, Idziak D and Hasterok R (2011) DNA methylation patterns of
Brachypodium distachyon chromosomes and their alteration by 5-azacytidine treatment. Chromosome Research 19:955-967.
Costa S and Shaw P (2007) 'Open minded' cells: how cells can change fate. Trends in
Cell Biology 17:101-106. Grant-Downton RT and Dickinson HG (2005) Epigenetics and its implications for plant
biology. 1. The epigenetic network in plants. Annals of Botany 96:1143-1164. Hernández-Verdún D and Gautier T (1994) The chromosome periphery during mitosis.
Bioessays 16:179-185. Hesse M, Pacini E and Willemse M (1993) The tapetum. Cytology, Function,
Biochemistry and Evolution. Springer-Verlag Wien New York. Kouzarides T (2007) Chromatin modifications and their function. Cell 128:693-705. Kumaran RI, Thakar R and Spector DL (2008) Chromatin dynamics and gene
positioning. Cell 132:929-934 Li W and Liu M (2011) Distribution of 5-hydroxymethylcytosine in different human
tissues. Journal of Nucleic Acids, Volume 2011, Article ID 870726, doi:10.4061/2011/870726
Medina FJ, Solanilla EL, Sanchez-Pina MA, Fernández-Gómez ME and Risueño MC
(1986) Cytological approach to the nucleolar functions detected by silver staining. Chromosoma 94:259-266.
Meijón M, Valledor L, Santamaría E, Testillano PS, Risueño MC, Rodríguez R, Feito I
and Cañal MJ (2009) Epigenetic characterization of the vegetative and floral stages of azalea buds: Dynamics of DNA methylation and histone H4 acetylation. Journal of Plant Physiology 166:1624-1636.
Pfluger J and Wagner D (2007) Histone modifications and dynamic regulation of
genome accessibility in plants. Current Opinion in Plant Biology 10:645-652. Reyes JC (2006) Chromatin modifiers that control plant development. Current Opinion
in Plant Biology 9:21-27. Ribeiro T, Viegas W and Morais-Cecilio L (2009) Epigenetic marks in the mature
pollen of Quercus suber L. (Fagaceae). Sexual Plant Reproduction 22:1-7.

20
Risueño MC and Medina FJ (1986) The nucleolar structure in plant cells. Cell Biology Reviews 7:1-213.
Risueño MC and Moreno-Díaz-de-la-Espina S (1979) Ultratructural and cytochemical
study of the nucleus of the dormant root meristematic cells. Journal of Submicroscopical Cytology 11:85-98.
Rodríguez-Serrano M, Barany I, Prem D, Coronado MJ, Risueño MC, Testillano PS.
(2012) NO, ROS and cell death associated with caspase-like activity increase in stress-induced microspore embryogenesis of barley. Journal of Experimental Botany, 63, 2007-2024.
Sang Y, Wu MF and Wagner D (2009) The stem cell--chromatin connection. Seminars
in Cell and Developmental Biology 20:1143-1148. Seguí-Simarro JM, Bárány I, Suárez R, Fadón B, Testillano PS and Risueño MC (2006)
Nuclear bodies domain changes with microspore reprogramming to embryogenesis. European Journal of Histochemistry 50:35-44.
Seguí-Simarro JM, Corral-Martínez P, Corredor E, Raska I, Testillano PS and Risueño
MC (2011) A change of developmental program induces the remodelling of the interchromatin domain during microspore embryogenesis in Brassica napus L. Journal of Plant Physiology 168:746-757.
Solís MT, Pintos B, Prado MJ, Bueno MA, Raska I, Risueño MC and Testillano PS
(2008) Early markers of in vitro microspore reprogramming to embryogenesis in olive (Olea europaea L.). Plant Science 174:597-605.
Solís MT, Rodríguez-Serrano M, Meijón M, Cañal MJ, Cifuentes A, Risueño MC and
Testillano PS (2012) DNA methylation dynamics and MET1a-like gene expression changes during stress-induced pollen reprogramming to embryogenesis. Journal of Experimental Botany, DOI: 10.1093/jxb/ers298.
Tessadori F, Schulkes RK, van Driel R and Fransz P (2007) Light-regulated large-scale reorganization of chromatin during the floral transition in Arabidopsis. Plant Journal 50:848-857.
Testillano PS, González-Melendi P, Fadón B, Sánchez-Pina MA, Olmedilla A, Risueño
MC (1993) Immunolocalization of nuclear antigens and ultrastructural cytochemistry on tapetal cells. Plant Systematic and Evolution [Suppl. 7]:49-58.
Testillano PS, Coronado MJ, Seguí-Simarro JM, Domenech J, González-Melendi P,
Raska I and Risueño MC (2000) Defined nuclear changes accompany the reprogramming of the microspore to embryogenesis. Journal of Structural Biology 129:223-232.
Testillano PS, González-Melendi P, Coronado MJ, Seguí-Simarro JM, Moreno-Risueño
MA and Risueño MC (2005) Differentiating plant cells switched to proliferation remodel the functional organization of nuclear domains. Cytogenetics and Genome Research 109:166-174.
21
Testillano PS and Rodríguez MD (2012) Cell biology of plant development and
adaptation, in Hot topics in Cell Biology, Becerra J, Santos-Ruíz L (eds). Biohealthcare Publishing Limited, Oxford, UK. pp 61-62.
Tiang CL, He Y and Pawlowski WP (2012) Chromosome organization and dynamics
during interphase, mitosis, and meiosis in plants. Plant Physiology 158:26-34. Twell D (2011) Male gametogenesis and germline specification in flowering plants.
Sexual Plant Reproduction 24:149-160. Vaillant I and Paszkowski J (2007) Role of histone and DNA methylation in gene
regulation. Current Opinion in Plant Biology 10:528-533. Zhao XY, Su YH, Cheng ZJ and Zhang XS (2008) Cell fate switch during in vitro plant
organogenesis. Journal of Integrative Plant Biology 50:816-824. Zluvova J, Janousek B and Vyskot B (2001) Immunohistochemical study of DNA
methylation dynamics during plant development. Journal of Experimental Botany 52:2265-2273.
22
FIGURE LEGENDS
Figure 1: 5mdC immunofluorescence in microspores and tapetal cells of tobacco
anthers. a-e: Confocal images of 5mdC immunofluorescence on 1 m-semithin
sections of Technovit. a-c: Same section of an anther showing microspores (Mic) and
tapetum (Tap): (a) DAPI staining, (b) 5mdC immunofluorescence and (c) differential
interference contrast (DIC) and 5mdC immunofluorescence merged image. d-e: Details
at higher magnification of 5mdC immunofluorescence on microspore (d) and tapetal (e)
nuclei. f: Quantification of 5mdC immunofluorescence signal intensity. Histogram
representing the mean values of relative fluorescence intensity in arbitrary units of
microspores (first column) and tapetal nuclei (second column) of anthers, as measured
by confocal image analysis software on maximum projection images. Numbers in
columns indicate mean values. Different letters indicate significant differences at P <
0.001. PS: Pollen sac. Bars: a, b, c: 30 m; d, e: 10 m.
Figure 2: Controls of 5mdC immunofluorescence. Confocal images of 1 m-semithin
Technovit sections of tobacco anthers. a-c: Control avoiding the DNA denaturation by
HCl, d-e: Immunodeplection of the antibody by in vitro pre-blocking with 5mdC. (a, d)
DAPI staining , (b, e) 5mdC immunofluorescence and (c, f) DIC images. Tap: tapetal
cells, Mic: microspores, AW: anther wall, PS: pollen sac. Bars: 50 m.
Figure 3: Quantification of global DNA methylation by HPCE in different plant
cells. Histogram representing the values of 5mdC percentage of total dC in tapetal cells
(first column), vacuolated microspores (second column) and proliferating root
meristems (third column). Numbers in columns indicate mean values. Different letters
indicate significant differences at P < 0.001.
Figure 4: 5mdC immunofluorescence and quantification of global DNA
methylation in proliferating and quiescent root meristematic cells. a-f: Confocal
images of 5mdC immunofluorescence on 40 m-vibratome sections. a-b: Same section
of a proliferating root tip showing the root cap (Cap) and the meristematic (Me) cells
after DAPI staining (a) and 5mdC immunofluorescence (b); insets show root cap cells at
higher magnification. c-d: Details of the cycling cells of the meristem at higher

23
magnification showing mitotic chromosomes and interphasic nuclei after DAPI staining
(c) and 5mdC immunofluorescence (d). e-f: Quiescent meristematic root cells after
DAPI staining (e) and 5mdC immunofluorescence (f). g: Quantification of 5mdC
immunofluorescence signal intensity. Histogram representing the mean values of
relative fluorescence intensity in arbitrary units of quiescent (first column) and
proliferating (second column) root meristematic nuclei, as measured by confocal image
analysis software on maximum projection images. h: Quantification of global DNA
methylation by ELISA-based immunoassay. Histogram representing the values of
5mdC percentage of total DNA in quiescent (first column) and proliferating (second
column) onion root meristems. Numbers in columns indicate mean values. Different
letters indicate significant differences at P < 0.001. Bars: a, b: 150 m; insets: 45 m; c-
f: 20 m.
5mdC
5mdC
d
e
Mic
Tap
DAPI 5mdC
DIC-5mdC
a
b
c
Tap Tap
Tap
Mic Mic
Mic
PS
PS PS
a
Figure 1
f
0
20
40
60
80
100
120
b
a
Tapetal cells
Vacuolated microspores
Rela
tive
5m
dC
imm
un
ofl
uo
resc
en
ce i
nte
nsi
ty
(arb
itra
ry u
nit
s) 107.8
52.3
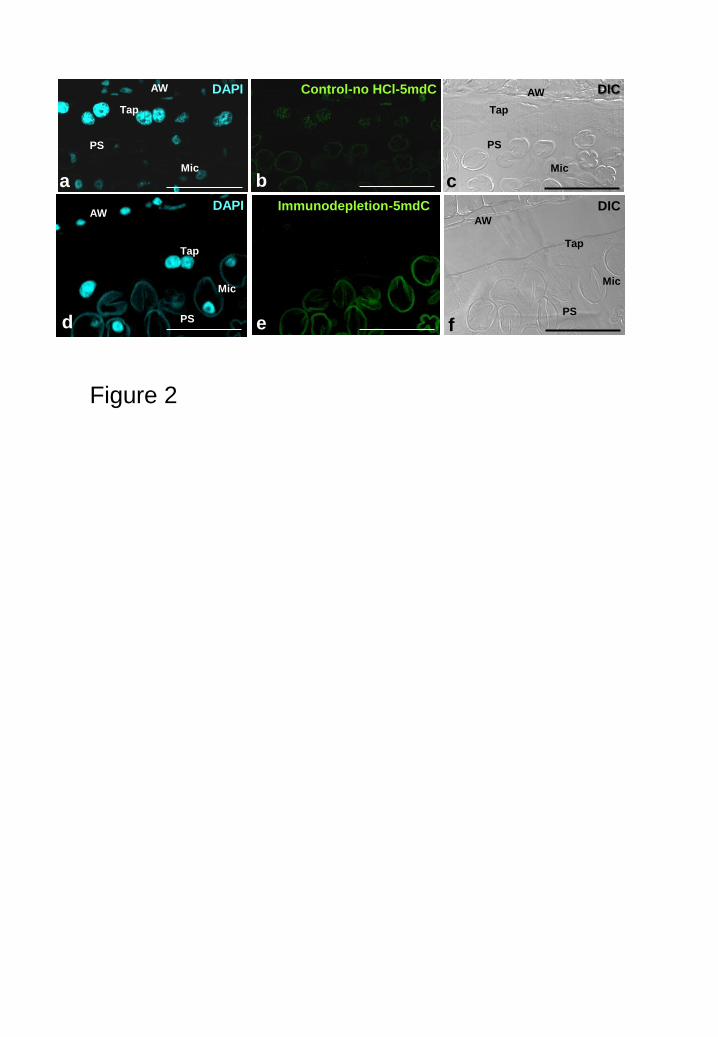
Figure 2
DAPI Control-no HCl-5mdC DIC
DAPI DIC Immunodepletion-5mdC
a b c
d e f
Tap
Mic
Tap
Mic
Tap
Mic
Tap
Mic
AW
PS
AW
PS
AW
PS
AW
PS

Proliferating root meristems
Vacuolated microspores
Tapetal cells
5mdC % of total dC
3.42
7.76
1.97
c
b
a
Figure 3
a b
DAPI
DAPI
5mdC
5mdC
c d
e f
Cycling Cycling
Quiescent Quiescent
DAPI 5mdC
Me
Cap
Me
Cap
Figure 5
Cap Cap
Figure 4
0
20
40
60
80
100
a
Proliferating root meristems
b
42.1
68.4
Quiescent root meristems
Relative 5mdC immunofluorescence
intensity (arbitrary units)
g
Proliferating root meristems
Quiescent root meristems
a
b 0.83
0.63
5mdC % of total DNA
h