the 30 iaph world ports conference - … 30th iaph world ports conference 7 ... memunggungi...
TRANSCRIPT

THE 30th IAPHWORLD PORTS CONFERENCE7 - 12 May 2017Bali Nusa Dua Convention Center, Bali - Indonesia
Enabling Trade. Energizing The World
Connecting Indonesia and the World:Accelerating and Balancingthe DevelopmentRidwan Djamaluddin• Deputy for Infrastructure, Coordinating Ministry for Maritime Affairs
ridwan @maritim.go.id

Indonesia at a Glance
<20 people/km2 130
260 millionpopulation
PopulationDensityArchipelagic State 81.000 km coast lines
GDP Distribution Industrial Growth
82%“Java Centric”
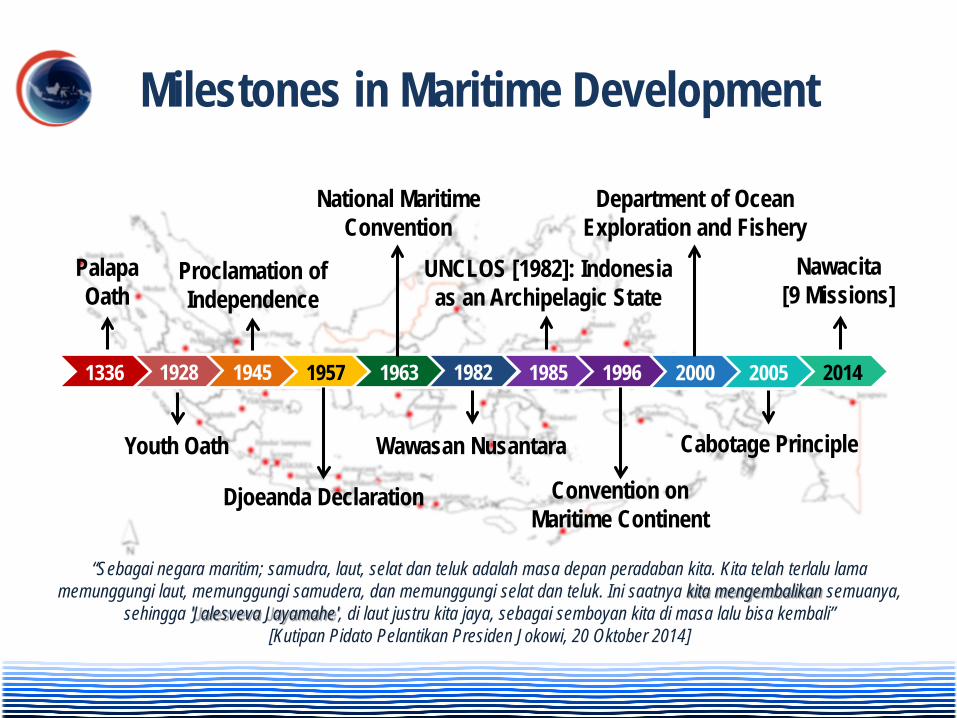
Milestones in Maritime Development
1928 1945 1957 1963 1982 1985 1996 2000 2005 2014
Youth Oath
Djoeanda Declaration
Wawasan Nusantara
Proclamation of Independence
National Maritime Convention
“Sebagai negara maritim; samudra, laut, selat dan teluk adalah masa depan peradaban kita. Kita telah terlalu lama memunggungi laut, memunggungi samudera, dan memunggungi selat dan teluk. Ini saatnya kita mengembalikan semuanya,
sehingga 'Jalesveva Jayamahe', di laut justru kita jaya, sebagai semboyan kita di masa lalu bisa kembali”[Kutipan Pidato Pelantikan Presiden Jokowi, 20 Oktober 2014]
UNCLOS [1982]: Indonesia as an Archipelagic State
Convention on Maritime Continent
Department of Ocean Exploration and Fishery
Cabotage Principle
Nawacita[9 Missions]
1336
PalapaOath

Indonesia GDP Growth
7.55 7.02 7.048.10 7.63
4.98
6.89
8.766.77 7.32
9.887.93
2.25
4.19
6.98
2.46
5.884.93
5.78
7.46 7.24 6.91 6.50 6.507.54
8.22 7.82
4.70
-13.13
0.79
4.92
3.64
4.50 4.78 5.035.69 5.50
6.35 6.01
4.63
6.22 6.17 6.03 5.56 5.01 4.88 5.02
19801989 1995
20072016
2001
1998
20091982
1975
19702016
GDP Growth [%] 1970 – 2016
PDB Distribution and Economic Growth 2016
58,49%
22,03%
7,85%6,04%
2,46%
5,59%5,89%3,13%
4,29%
2,01% 7,42%
7,45%Distribution: 82%Growth: 5,25%
Distribution: 18%Growth: 4,75%
Jawa, Sumatra, Bali
Kalimantan, Sulawesi,Nusatenggara, Maluku, Papua

Economic Growth by Province 2016 Sulteng: 9,98%
Papua9,21%
Sulsel7,41%
Gorontalo6,52%
Sultra6,51%
Kalteng6,36%
Bali6,24%
Sulut6,17%
Sulbar6,03%
DKI5,85%
NTB5,82%
Malut5,77%
Maluku5,76%
Jabar5,67%
Jatim5,55%
Bengkulu5,30%
Jateng5,28%
Sumbar5,26%
Banten5,26%
Kalbar5,22%
Sumut5,18%
NTT5,18%
Lampung5,15%
DIY5,05%
Sumsel5,03%
Kepri5,03%
Papua Barat4,52%
Kalsel4,38%
Jambi4,37%
Babel4,11%
Kaltara3,75%Aceh
3,31%Riau
2,23%
Kaltim-0,38%
National: 5,02%1. Sulawesi Tengah: 9,98%34. Kalimantan Timur: - 0,38%

Indonesia Current Development Strategy
Development Strategy
Increase Competitiveness
Added Value [vs. commodity
based]
Indonesia Centric [vs. Java Centric]
• Prohibit export of raw/unprocessed commodities
• Develop SME businesses• Provide incentives
• Improve the quality of Human Resources• Create conducive investment atmosphere• Develop national logistic connectivity
• Promote development and growth outside Java
• Build and develop infrastructures outside Java

Infrastructure as the Primadona of Indonesia Development Program
3 Pillar of Acceleration
PercepatanInfrastruktur
2016
2017
2018
Infrastructure Human Resources Deregulation
Accelerate infrastructure development to strengthen quality development foundation
Accelerate infrastructure development and economy to provide job opportunities, poverty alleviation, and reduce regional development gap
Accelerate investment and infrastructure for growth and equality
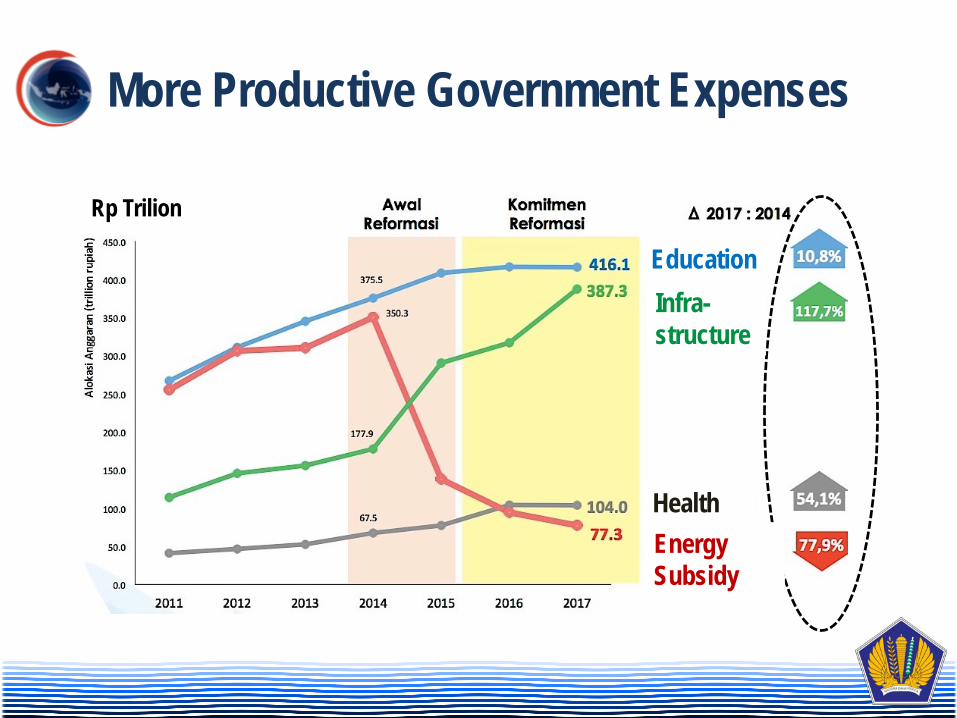
More Productive Government Expenses
Rp Trilion
EducationInfra-structure
HealthEnergy Subsidy
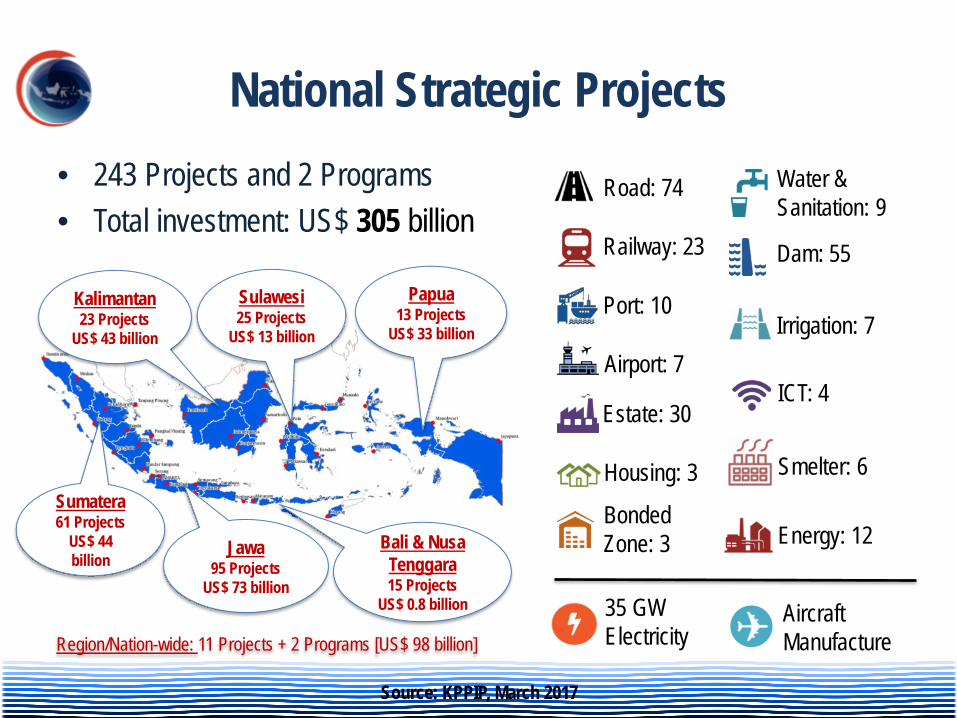
National Strategic Projects• 243 Projects and 2 Programs• Total investment: US$ 305 billion
Road: 74
Railway: 23
Port: 10
Airport: 7
Estate: 30
Housing: 3
BondedZone: 3
Water & Sanitation: 9
Dam: 55
Irrigation: 7
ICT: 4
Smelter: 6
Energy: 12
35 GW Electricity
Aircraft Manufacture
Sumatera61 Projects
US$ 44 billion
Jawa95 Projects
US$ 73 billion
Bali & Nusa Tenggara15 Projects
US$ 0.8 billion
Kalimantan23 Projects
US$ 43 billion
Sulawesi25 Projects
US$ 13 billion
Papua13 Projects
US$ 33 billion
Region/Nation-wide: 11 Projects + 2 Programs [US$ 98 billion]
Source: KPPIP, March 2017

Ship Traffic in the World and in Indonesia
• Singapore: 33 million TEUs [2013],139.000 ship calls• Tanjung Priok 6 million, Tanjung Perak 3 million TEUs• National ship armada: 14.300 [general cargo 2.730;
tanker 840; container 279; passenger 560]
www.marinetraffic.com[31 Juli 2016]
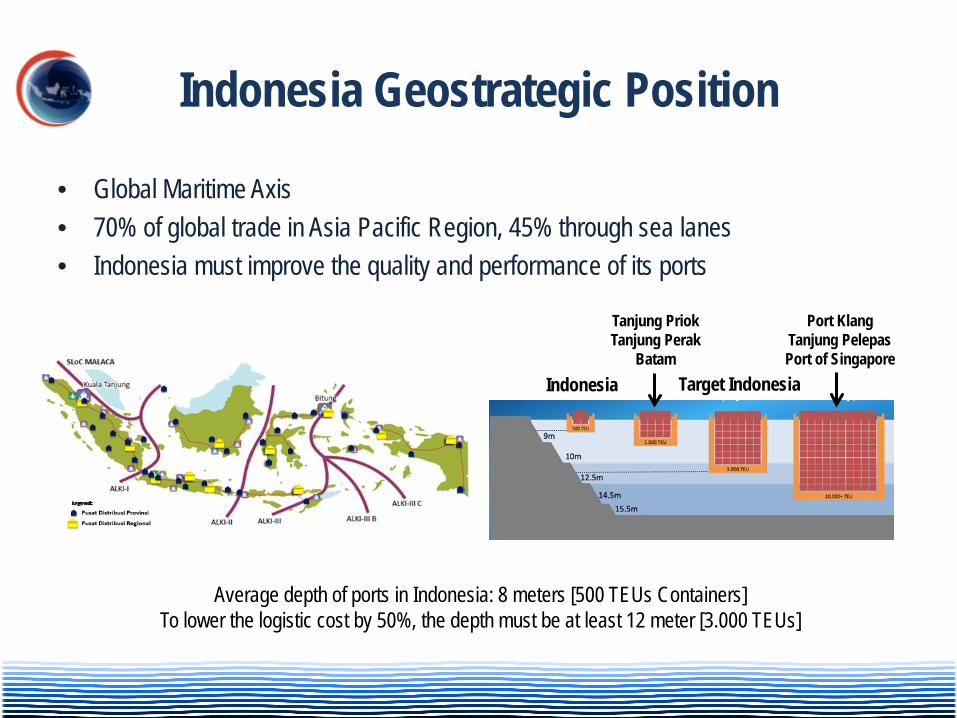
• Global Maritime Axis• 70% of global trade in Asia Pacific Region, 45% through sea lanes• Indonesia must improve the quality and performance of its ports
Indonesia Geostrategic Position
Average depth of ports in Indonesia: 8 meters [500 TEUs Containers]To lower the logistic cost by 50%, the depth must be at least 12 meter [3.000 TEUs]
Indonesia
Tanjung PriokTanjung Perak
BatamTarget Indonesia
Port KlangTanjung PelepasPort of Singapore
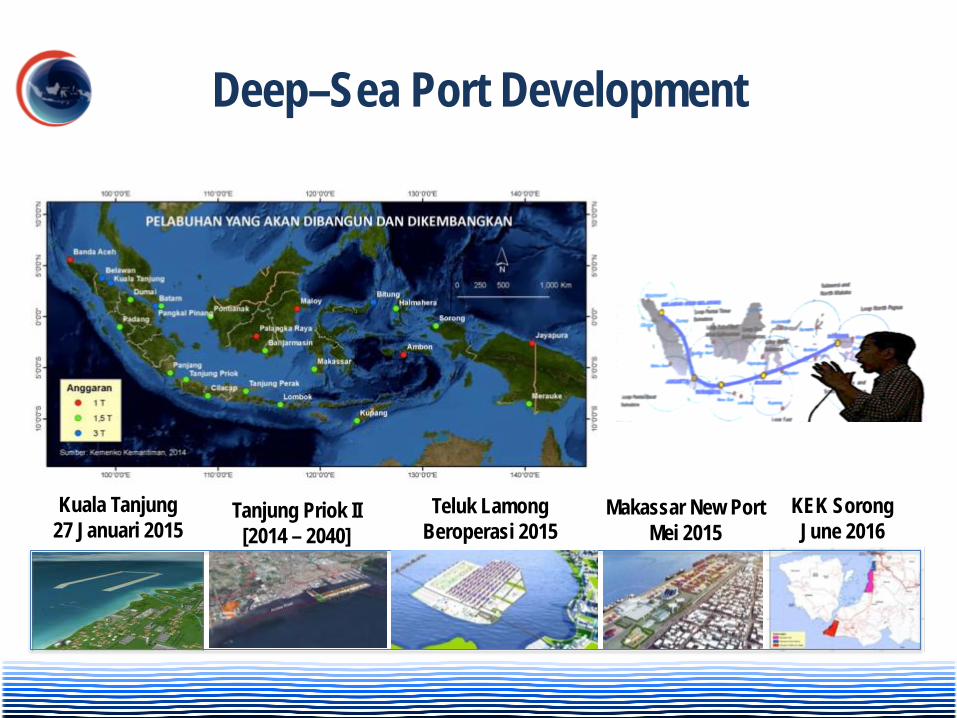
Deep–Sea Port Development
Kuala Tanjung27 Januari 2015
Teluk LamongBeroperasi 2015
Makassar New Port Mei 2015
Tanjung Priok II [2014 – 2040]
KEK SorongJune 2016

Map of New Port Development andPort Capacity Improvement Project
Kuala TanjungBitung
Maloy
CikarangBekasi Laut
Patimban
Sorong
KalibaruMakassar New Port
Kijing
Kupang

• 15 New Airports
• Upgrading 9 Cargo Airports
• Upgrading 25 Airports in outermost and
disaster-prone areas
Connecting Indonesian Archipelago
• 5 Deep-sea Ports: Kuala Tanjung, TanjungPriok, Tanjung Perakm, Makassar, Bitung
• 19 Feeder Ports• 100 sub-feeder ports
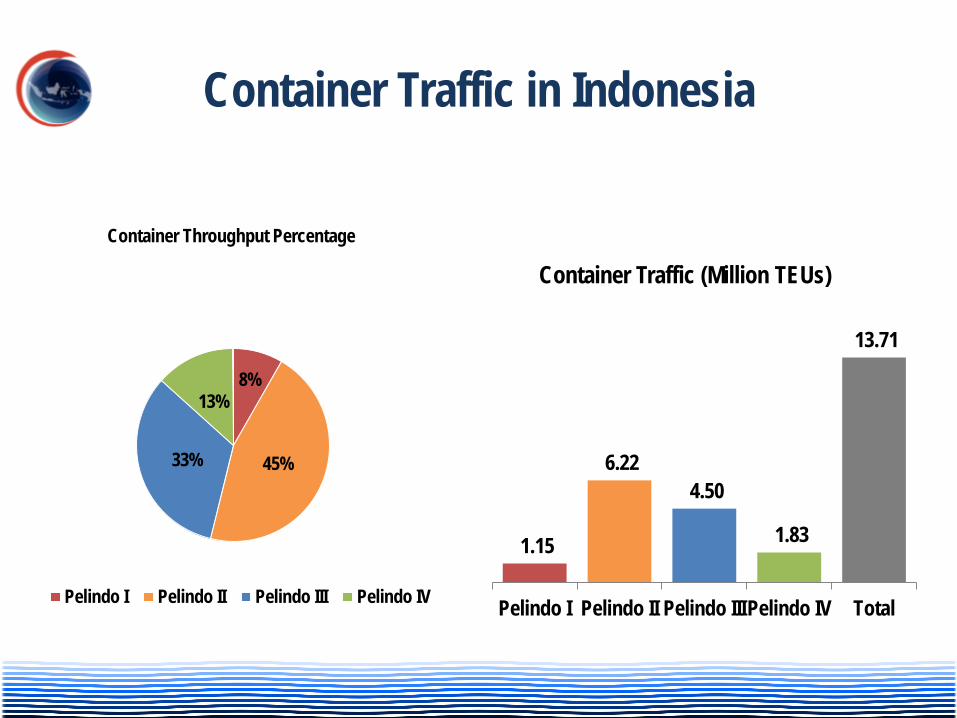
1.15
6.22 4.50
1.83
13.71
Pelindo I Pelindo II Pelindo IIIPelindo IV Total
Container Traffic (Million TEUs)
8%
45%33%
13%
Container Throughput Percentage
Pelindo I Pelindo II Pelindo III Pelindo IV
Container Traffic in Indonesia

Transportation Cost and Logistic Costin Indonesia
15.3
13.7
15.6
11.7
14.1
4.9
0
2
4
6
8
10
12
14
16
18
Jabotabek Surabaya Medan Makasar Rata-RataIndonesia
Jepang
Logistics Cost to GDP Transportation costsTo Total Cost [%]

6.5
4.94.2
3.56 3.773.2 3.04
3.63
2013 2014 2015 2016 17-Jan 17-Feb 17-Mar 17-Apr
Dwelling Time [days]

The distance from Jakarta seems to be "closer" to Singapore than to Padang or Jayapura
The High Cost of Domestic Shipping
TransportINDES LINESINDES LINESTrans Transport
SeaPort
SeaPort
Shipper ConsigneeTransfer Transfer
Port to Port
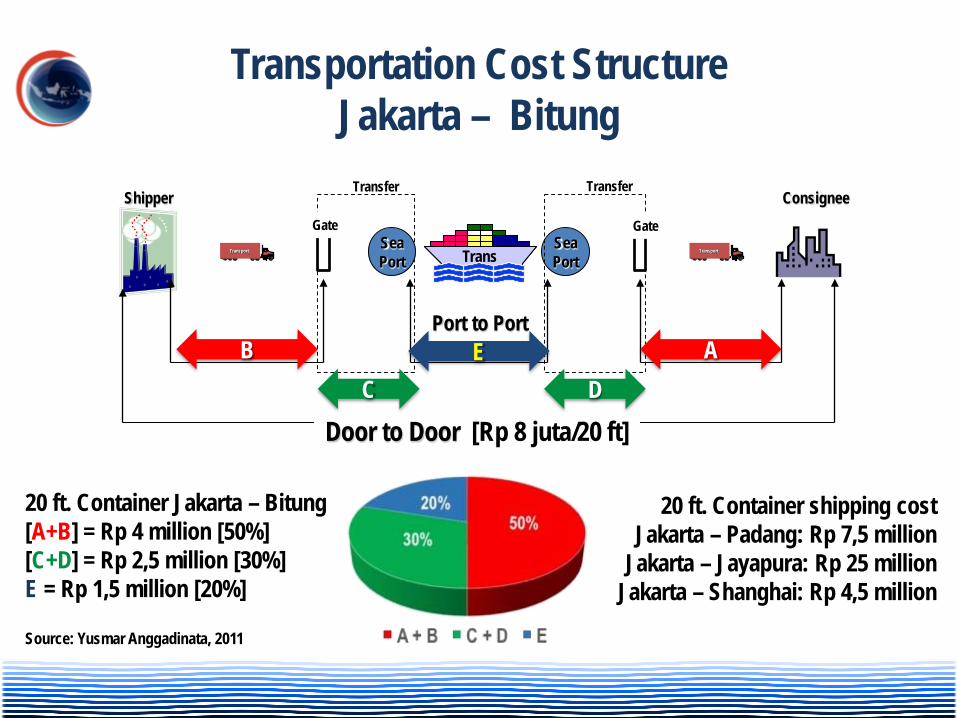
Door to Door [Rp 8 juta/20 ft]
20 ft. Container Jakarta – Bitung[A+B] = Rp 4 million [50%][C+D] = Rp 2,5 million [30%]E = Rp 1,5 million [20%]
B AED
GateGate
C
Transportation Cost Structure Jakarta – Bitung
20 ft. Container shipping costJakarta – Padang: Rp 7,5 million
Jakarta – Jayapura: Rp 25 millionJakarta – Shanghai: Rp 4,5 million
Source: Yusmar Anggadinata, 2011

Now Hub & SpokeDwelling Time 4 – 5 hari 2 – 3 hariThroughput 4 million TEUS per year 8 million TEUSLand transportation Heavy traffic ~ 30% less
Fuel consumption ~ Rp 190 billion/year lessRoad maintenance ~ 30% less
Hub and Spoke: Dry Port Development
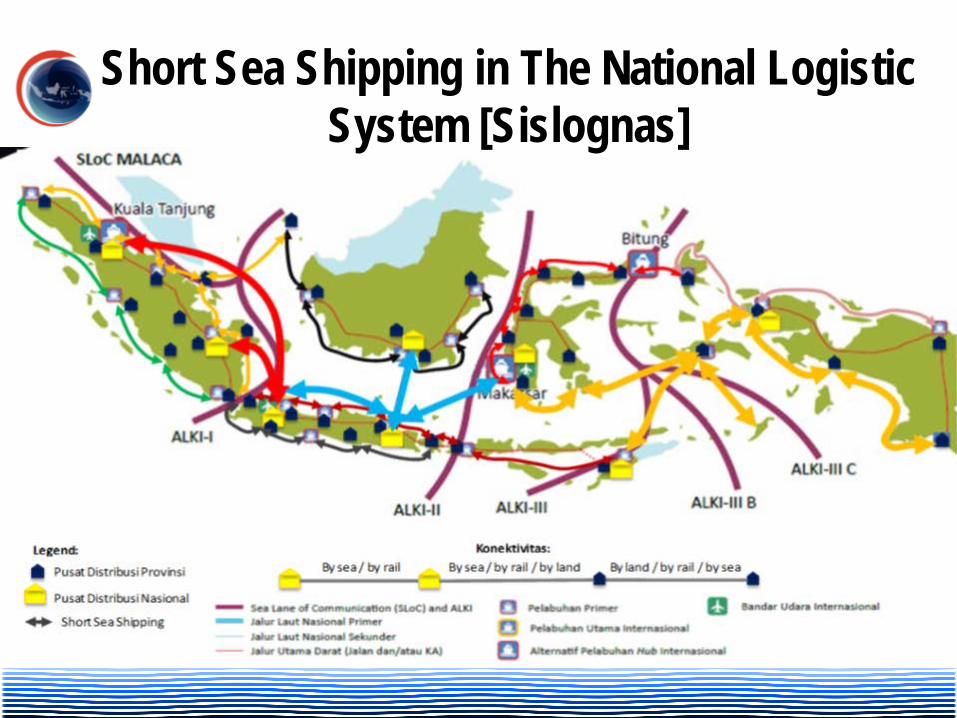
Short Sea Shipping in The National Logistic System [Sislognas]

Short Sea Shipping Moving at least 30% overland transport goods that have been overloaded to sea transportation through the following programs::
1. Short Sea Shipping or Coastal Shipping in Jawa and Sumatra islands as well as others by mapping the sea lanes that may be served by short sea shipping support vessels throughout Indonesia.
Sources: Ministry of Transportation RI
2. Setting a special rate for short sea shipping port in Indonesia. In the early stages, prepared ports in Marunda, Semarang, Surabaya, and Lampung.
2. Opening and maximizing railway tracks to and from ports and accelerating the completion of double track projects on the island of Java, both north and south.

“Sea Toll” Program
• Maintaining the availability, accessibility, and affordability of the basic needs in the outermost, remote, and least developed islands
• Government provides subsidies to transportation and logistic costs
• Multimodal transportation: sea, air, land, river
• Synergized efforts by State-Owned Enterprises in providing logistic centers in ~30 remote locations

Development from the Periphery
• Developing Integrated Marine and Fishery Centers in the border and small-outermost islands
• Natuna | Simeulue | Tahuna | Timika | Nunukan | Biak Numfor | Tual | Mentawai | Rote Ndao | Merauke | Sarmi | Moa | Talaud | Saumlaki | Morotai
Integrated Marine and Fishery Centers
Palau
Australia
Hawaii
Export Destination

14 Industrial Zones Outside Java
Kuala TanjungAlumina, CPO
Sei MangkeiCPO Processing
TanggamusMaritime, Logistics
Gulf of BintuniOil & Gas, Fertilizer
BuliFerronickel,
Stainless Steel Smelter
BitungAgroindustrc
, Logistics
PaluRattan, Rubber, Cacao, Smelter
MorowaliFerronickel,
[downstream] Stainless
Steel Smelter
KonaweFerronickel,
[downstream] Stainless
Steel Smelter
BantaengFerronickel,
[downstream] Stainless
Steel Smelter
BatulicinIron, Steel
JorongDownstream
Minerals [Bauxite], CPO
KetapangAlumina
LandakRubber,
CPO

Catch Fishery1% Aquaculture
16%
Fish Processing Industry
7%
Biotech Industry14%
Mining and Energy16%
Marine Tourism 4%
Sea Transportation 2%
Maritime Service Industry
15%
Small Islands9%
Mangrove1%
Non-Conventional Energy Resources
15%
US$ 210Billion/year
US$ 180
US$ 210US$ 200
US$ 200
US$ 120 US$ 100
US$ 60US$ 30
US$ 8US$ 12
Maritime Economic Potentials
BPS, 2015
Indonesia Maritime Economic Potentials US$ 1,33 triliun per Year

Presidential Regulation No. 16/20177 Pillars of National Ocean Policy
National Ocean Policy
Marine Resource Management and Human Resource Development
Defense, Security, Law Enforcement, and
Safety at Seas
Marine Organization and Management
Economy, Infrastructure, and Social Welfare
Maritime Diplomacy
Maritime Culture
Marine Zonation and Environmental Protection

THE 30th IAPH WORLD PORTS CONFERENCE7 - 12 May 2017, Bali Nusa Dua Convention Center, Bali - Indonesia
Thank You