the 3 steps to future-proofing business & brand
TRANSCRIPT

Transforming Your UN Sustainable Development Goals from Public Relations to Measurable Actions
June 2019
The 3 Steps to Future-Proofing Business & Brand
October 2019
www.figbytes.com

As humankind tries to navigate a decade of unprecedented change, the UN SDGs are
the closest thing we have to a forward-looking framework that can unite humankind
around a collective “purpose” and ambitious mission and goals. They are gradually
catching up with more traditional “rear-view mirror” reporting frameworks most
commonly used in the corporate sector, such as GRI and CDP.
A key reason the SDGs are gaining traction is the graphics that are used to simplify the
vast complexity of the totality of life on earth and how human activities fit into this
complexity.
The word “sustainable” often carries
with it a preconceived association with
“environmental”, as in “Environmental
According to the Harvard Business Review, the public relations angle has weighed
more heavily for companies than their intentions to create and execute solutions of
enduring effect. With no accountability for corporations, governments or non-profits, it
could be interpreted that the SDGs are a façade behind which organizations can
hide. Pasting open source SDG icons into communications has become common
practice in non-financial reports, websites, and other media where an organization’s
purpose is communicated, be it fleeting in social media, or with more permanency in
sustainability reports.
However, organizations trying to
implement the SDGs face many
challenges. While the Sustainable
Developments Goals are also known
as the Global Goals, the latter term is
much less frequently used.
Defining Impact
2
Sustainability”, so people who are more motivated by social initiatives may initially be
negatively disposed towards the SDGs as they perceive them to be about the
environment, and not people.

The Trending of Purpose
3
https://sustainablebrands.com/read/organizational-change/your-organization-s-purpose-must-evolve
https://www.amazon.com/dp/1626569665/ref=rdr_ext_sb_pi_hist_1
https://www.greenbiz.com/article/end-corporate-social-responsibility
https://www.greenbiz.com/article/era-stand-alone-sustainability-over
Numerous publications and
presentations are highlighting the
evolution of traditional definitions of
non-financial reporting terms such as
CSR, sustainability, citizenship and ESG,
towards integrated corporate
purpose.
Purpose needs to be connected to the greater journey of humankind, as best represented
by the SDGs. Companies that fail to align with this trends and innovate accordingly will be
left behind.

The Challenges
Corporations considering adopting the SDGs will usually
already have a “non-financial reporting” initiative
and/or business function that they refer to as:
These terms and acronyms do not resonate well with most stakeholders beyond investors
and frequently appear to be in conflict with each other, often even within one
organization. Whether an organization calls its “non-financial reporting” initiatives
sustainability, CSR, ESG or citizenship, (and many companies use more than one term,
adding further confusion), the initiative usually has its own “pillars” such as “the triple
bottom line”, “People, Planet, Profit”, (although isn’t profit a financial initiative?), “The 4
C’s”, etc.
There are 17 SDGs – far too large a number for people to remember. Behind these 17 goals lie 169 indicators, so the complexity of implementation can quickly overwhelm the simplicity of the icons
Sustainability
Corporate Citizenship
CSR (Corporate Social Responsibility)
Responsible Business
ESG
EHS
EHS&S
4
There is an “alphabet soup” of acronyms that accompany the overarching term

Integration
A key problem is that these pillars are rarely integrated
with the broader pillars of the “core” business strategy
leading to sustainability/CSR/ESG being seen as a
subsidiary strategy, rather than a key pillar of the
business strategy.
As leaders of these initiatives look to integrate the SDGs
into their business strategy, they are immediately faced
with a further dilemma:
In addition to not fully driving strategic change,
sustainability/CSR/ESG initiatives are not driving the type
of brand recognition that companies would like to gain
from the “good” they are doing. Non-financial reports
are only read by a fraction of stakeholders and have
very little impact on a company’s brand, which is how
customers experience strategy. All to often, the SDGs
become yet another set of slides, more spreadsheet
cells and added complexity, where the initial intent has
been to simplify complexity.
“How do I match up our sustainability/CSR/ESG
pillars with these 17 new goals?”
All too often, rather than using the SDGs to drive new
levels of achievement, corporations simple attach SDG
icons to areas of their non-financial report that reports
results on pre-existing initiatives.
5

Commitment
For an organization to genuinely and deeply adopt the SDGs, they will have to come to
terms with substantial strategic change to product and services, energy supply, supply
chain and other key business functions that cannot be managed within “traditional”
siloed, and often underfunded sustainability/CSR departments.
Such change can only happen with absolute conviction and commitment at the
boardroom level and will involve major risk analysis exercises, goals setting initiatives,
strategic planning and change management.
Companies that have already managed deep,
cultural transformation around sustainability such
as Interface Inc. and Unilever, are in a much
better position to adopt the SDGs, but all
companies will face new, challenging strategic
discussions as they truly get serious about meeting
society’s expectations for 2030 goals.
For instance, as a company looks at SDGs 7 and 13 on climate and renewables, they
are faced with multiple challenges and questions:
How will our customers’, communities’ and colleagues’ expectations be changed by Greta
Thunburg’s activism or Extinction Rebellion (XR) or by a major flood, fire or similar climate change-
related impact?
How much renewable energy is “enough” at any point in our trajectory?
Do we adopt a stretch goal of 100% renewable energy by a certain date?
Do we use Science Based Targets (SBTs)?
Should we wait for renewable energy to get cheaper or will our competitors and/or other
companies buy up the best contracts for renewable power supply coming onto the grid?
Should we partner with other industry players to help to stimulate the renewable energy market
and to get the best deals based on bulk purchasing?
What proportion of our power requirements can come from on-site generation and what are the
economic, social and environmental pros and cons that we should factor into our calculations?
6

Connecting Purpose to Data
These modern challenges cannot be met using the collection of disconnected
“traditional” software products within which organizations typically attempt to
manage this change. Such “whole-systems thinking” requires an integrated platform
that goes beyond EHS software. These products are aimed at traditional compliance
and reporting approaches that are not compatible with this new era of deep purpose
driven by raised societal expectations, science-based approaches to goal setting,
and the critical need for real-time, “beyond reporting”, brand-enhancing
transparency using data-driven storytelling.
EHS
How To Tell The Story
Today’s generation expects information on demand, anywhere. Strategy mapping and
infographics that incorporate multimedia engage stakeholders, show progress towards
stated goals measured in close to real-time.
7

The FigBytes Solution
FigBytes is a cloud-based platform with the unique capability of being able to map out a
sustainability strategy, to integrate that strategy within the broader business strategy, to
map the SDGs to this integrated strategy and to connect the strategy to social,
environmental and economic data in close to real-time.
FigBytes Integrates:
Strategic planning and mapping
Data collection, cleansing and calculations
Data-driven storytelling – performance and purpose in pictures
Integration of “traditional” reporting frameworks like GRI and the
forward-looking aspirational framework of the SDGs
Internal performance management
External website and social media
8

The Truly Integrated Strategy
Whether or not SDG integration is a current requirement, the first two
steps are essential foundations for creating a modern,
holistic strategy to future-proof the business and its brand.
The era of “dis-integrated” corporate strategies, segregated
non-financial initiatives and reporting and the use of disconnected 20th century
software to navigate the 21st century, is over.
The FigBytes platform enables three key steps that are essential for avoiding multiple
disconnected layers of communication and data collection tools.
Map out your sustainability
or CSR strategy1
2 Integrate your sustainability
or CSR strategy with your
core business strategy
3Chose the right SDGs
for your company
www.figbytes.com9
… and use them to drive new ambitious
corporate stretch goals and brand value
rather than merely using them to illustrate or
highlight activities in a non-financial report
that are already underway.
… and connect it to a broader range of data.
… and connect it to your data.

Data Management
In addition to industry-leading visualization of strategy, performance and brand, FigBytes
has a unique ability to capture, cleanse, and perform calculations on the social,
environmental and economic data that relate to a modern, integrated business strategy.
www.figbytes.com10
Any strategy can be tracked in FigBytes, however, client implementations generally fall
into one of the following categories:
▪ A stand-alone climate action/GHG mitigation plan
▪ A “non-financial” strategy or initiative such as Sustainability, CSR, ESG, Citizenship
▪ An integrated corporate strategy that will generally include “non-financial” elements
such as Sustainability, CSR, etc.
▪ A mission-based impact strategy such as that of a foundation
Depending on the nature of the strategy being tracked, FigBytes provides a range of
data entry including:
▪ Direct input to smart phone and tablets in “the field”
▪ Direct input into the system
▪ Direct input via individual data entry screens
▪ Input via integrated surveys
▪ Automatic ingestion from bulk spreadsheets
▪ Direct connection to meters for e.g. power, fuel and water use
▪ Integration with e.g. ERP systems such as SAP and Oracle
Larger scale implementations may involve one or more of the above data input methods.

Integration with ERP Systems
ERP systems such as SAP and Oracle are designed to interact with other systems and have
accessible APIs. FigBytes was also designed with flexible APIs to facilitate data ingestion
and the FigBytes integration team has extensive experience at creating these links.
www.figbytes.com11
▪ Identification of the data required to
be ingested into FigBytes for
sustainability impact calculations
▪ Identifying the availability of that
data through the third-party
application’s API
FigBytes connects to such third-party systems using an application programming interface
(API), which becomes the messenger that processes requests and ensures seamless data
exchange between FigBytes and the third-party enterprise system. To connect to the
third-party system, FigBytes leverages the API provided by that system. Such integrations
typically focus on pulling data from an existing enterprise system that are required for
further processing to generate sustainability, social and governance impacts or direct
metrics for an integrated corporate strategy.
Besides using APIs, FigBytes can also implement direct database to database connections
if API availability of quality is not good.
Once data are in FigBytes, they can be used as single variables or KPIs, combined with
other variables into metrics, and, where appropriate, routed into e.g. FigBytes GHG
“engine”, which is the most powerful GHG processing product in the market and which
has been used on some of the most demanding GHG projects undertaken, sometimes
where competitive products have failed.
▪ Identifying the frequency of ingestion of
the specific data points – e.g., hourly,
daily, weekly, monthly, etc.
▪ Identifying the category within FigBytes
that this data will reside in once ingested
FigBytes follows the below steps to finalize the connections through APIs:
Traditional EHS software systems generally process social metrics in terms of Health and Safety,
but fail to capture more advanced concepts such as well-being, community engagement,
social equity, etc. These are key elements of many of the metrics for the UN SDGs. Social
metrics are often more subjective than economic and environmental metrics. FigBytes has a
unique, flexible metrics builder that allows for any variable or combined-variable metric or KPI
to be created.
www.figbytes.com12
FigBytes provides advanced functionality for capturing raw environmental data and
converting it into GHG impacts.
For this purpose, FigBytes has an underlying conversion engine that not only provides results but
also provides a details page for each entry that end users can manipulate/modify based on
their own localized needs. Some of this functionality includes:
Social Metrics
Environmental and GHG Metrics
▪ Auto application of emission factor based on location/country and conversion of raw data into
GHG emissions
▪ Ability to change system applied emission factor by selecting from a list of factors from FigBytes’
emission factors data base (EFDB)
▪ Ability to upload custom emission factors based on local regulations or organization-specific
factors
▪ Retroactive calculations (if required) across data set when emission factors change – this unique
functionality avoids major challenges faced by other systems as emission factor changes take
place regularly
▪ Ability to capture notes, source and attach documents to each data entry
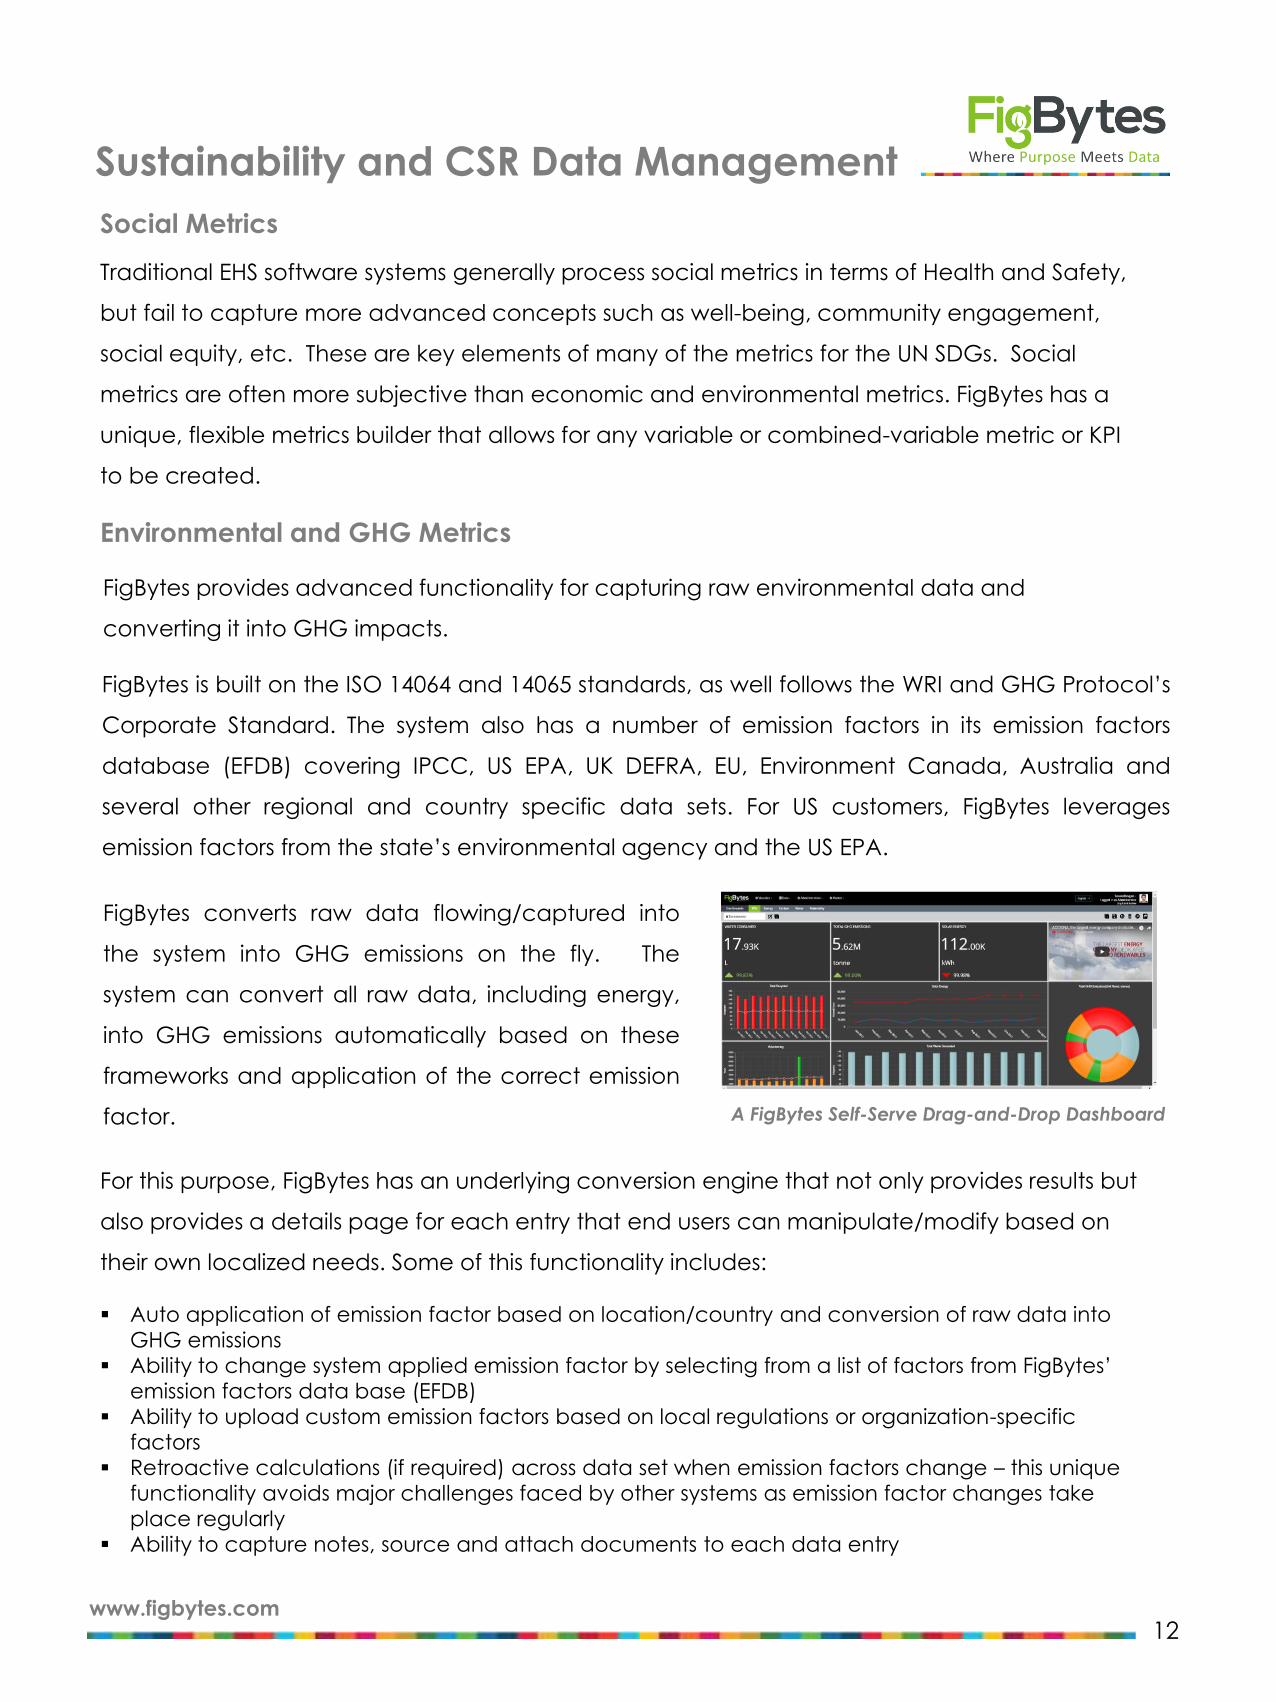
FigBytes converts raw data flowing/captured into
the system into GHG emissions on the fly. The
system can convert all raw data, including energy,
into GHG emissions automatically based on these
frameworks and application of the correct emission
factor.
FigBytes is built on the ISO 14064 and 14065 standards, as well follows the WRI and GHG Protocol’s
Corporate Standard. The system also has a number of emission factors in its emission factors
database (EFDB) covering IPCC, US EPA, UK DEFRA, EU, Environment Canada, Australia and
several other regional and country specific data sets. For US customers, FigBytes leverages
emission factors from the state’s environmental agency and the US EPA.
Sustainability and CSR Data Management
A FigBytes Self-Serve Drag-and-Drop Dashboard

www.figbytes.com13
The system tracks and manages data for the following environmental categories:
▪ Fuel – stationary and mobile combustion
▪ Energy – stationary combustion
▪ Electricity
▪ Renewable Energy
▪ Heat, Steam, Co-gen
▪ Waste
▪ Wastewater
FigBytes conducts updates of all GHG emission factors based on new releases. These factors
reside in the Emission Factors Database (EFDB), and are automatically applied to calculations
based on location/methodology required for the category of calculation that customers need.
Administrators have full access to these
emission factors. System administrators can
also add their own local emission factors
as well if required. Scope 2 market-based
emission factors are available in the EFDB.
These are updated as new information
becomes available and are also available
to system administrators.
▪ Agriculture
▪ Land Use Change
▪ Live Stock
▪ Mobile combustion – fleet, surface transport, rail, water borne, air
▪ Refrigerants and halocarbons
▪ VOCs
▪ Products & Services
A FigBytes GHG Emissions Dashboard
Sustainability and CSR Data Management
System administrators can add their own local emission factors as well if required.

www.figbytes.com14
FigBytes is tracking carbon data on a
monthly cadence for thousands of
data centres in over 130 countries
down to the server component.
Akamai Technologies
Headquartered in Cambridge, MA, publicly traded
Akamai Technologies (NASDAQ: AKAM), is one of the
world’s largest cloud content delivery networks and cloud
service providers. With one of the world's largest
distributed computing platforms responsible for serving
between 15% and 30% of all web traffic, its global
infrastructure spans over 130 countries, with over 250,000
servers in over 1,000 data centre locations.
Complex Client Implementations
Their customers span all verticals including global e-commerce, finance, media, and government.
Akamai delivers nearly 3 trillion Internet transactions per day and offers a full suite of cloud
technology products to its customers, including 55% of the Fortune Global 500. Akamai employs
over 7,500 people and 2018 revenue was $2.7 billion.
Akamai’s complex data challenge defeated an incumbent sustainability software’s capabilities
and FigBytes was selected in an RFP process as the only product capable of meeting this
challenge.
View full case study.

www.figbytes.com15
Sustainability Plan
Government
Departments
Cities
Schools &Hospitals
Complex Client Implementations
In October 2019, FigBytes launched The State of Minnesota’s, long-term sustainability plan on a
public-facing “micro site”, which can be viewed here: https://sustainability.mn.gov
As one of 25 US states belonging to the United States Climate Alliance, the State is utilizing the
FigBytes platform to create a “living report” to which 24 state departments report against six key
focus areas: Fleet, Energy, Water, Solid Waste, Procurement and Greenhouse Gas.
State of Minnesota
Agency scorecards aggregate each
department’s performance against future
goals, and they are scored by a traffic light
colour code system, for an “at a glance”
summation of overall performance.
Viewing only a few screens, it is very simple
to see long-term vision and granular data
tracked to that vision.
FigBytes “Exportable Widgets” are the primary
communication tool on the “micro site’s” interface
and the live data is powered by FigBytes strategic
sustainability technology.
To follow the initial engagement of 24
government departments, future
phases will include rolling the project
out to cities, schools, hospitals and other
government infrastructure.

www.figbytes.com16
FULLY INTEGRATED RANGE OF MODULES(INCLUDING BUT NOT LIMITED TO)
Strategy Mapping & Data-driven Infographics for
“Beyond Reporting” Engagement
Automated Framework Results
(SDGs, GRI, CDP, etc.)
Dashboards and Analytics KPIs Including Indicator Customization
Benchmarking Communication & Engagement
Features Summary
DATA MANAGEMENT
GHGs Energy
Water Waste/Recycling
Waste Water Fuels
Transportation VOCs
Refrigerants Packaging
Incident Management Corporate Social Responsibility (CSR)
Agriculture• Land Use Change• Livestock• Fertilizer
Surveys & Campaigns
Materiality Assessments Self-serve Business Analytics
Project Management

General Functionality Market Differentiation
www.figbytes.com17
Functionality FigBytes Competitors
Strategy Mapping and Visualization
Ability to connect sustainability data to the overall vision and journey of a company or government, and make sense of it from a strategic standpoint
Basic charts and graphs dashboards only
Engagement
Integrated infographics and microsites generator from underlying data that enable story-telling of an organization's sustainability journey
Basic charts and graphs dashboards only
UN SDGs
Visually select and map operations and data to UN SDG goals. Track these in customized dashboards and an SDG strategy view
No automation of SDGs
Materiality and Risk Assessment
Integrated materiality module that allows for collection of feedback from internal and external stakeholders to automatically generate materiality matrices for strategic input to planning
No materiality functionality
Tracking of environmental, social, governance data in a single platform.
FigBytes supports all these, as well as other data categories like product & services, etc. within the same platform
Most competitors are limited to tracking environmental and/or safety data from a compliance perspective
Significant GHG Differentiation(see GHG table below)
FigBytes has the most powerful GHG tracking and reporting system in the market, routinely replacing competitors’ implementations (see GHG table below)
Capture of Qualitative Information
• Integrated survey functionality captures qualitative information as well as quantitative data for compilation of a complete sustainability narrative
• Combined with the engagement modules of FigBytes, this is a major differentiator
No qualitative data tracking
Breadth of Metrics Creation
• Complete flexibility of metrics creation
• Can integrate with reporting frameworks but are not restricted to these
Force users into prescribed
frameworks
Project & Task Management
Integrated project and task management functionality linked to key sustainability KPIs, which introduces the element of accountability and responsibility in achieving sustainability goals.
• No integrated project management functionality
• Project tracking is done external to the system in Excel or third-part project management tools

www.figbytes.com18
GHG Market Differentiation
Granular asset-based set up & results
Science-based target (SBT) tracking
Ability to change scopes and categories so that entire data sets don't have to be deleted (major challenge for large scale implementations)
Pre-defined CRC, MCR, and CDP report templates
Ability to farm out raw data capture to multiple individuals across the organization
Track offsets/credits in the same system to generate "carbon" balance reports
Five levels of nested organizational hierarchy
Tagging functionality that allows results to be aggregated and reported in multiple ways beyond five org levels
Project and task management functionality for setting up and tracking carbon reduction projects
Automated threshold and variation checks, plus two levels of manual data verification - validators and verifiers, to ensure data quality and integrity
Automatic notifications and investigation of data that exceeds/does not meet quality thresholds
Audit trails for third party verifiers
Ability to combine multiple GHG data streams in formula builder to create custom KPIs - e.g., GHG per $ of revenue
Show GHG results in auto-generated infographics and "microsites", beyond the standard dashboards and charts
View GHG results and progress in context of sustainability or corporate strategy
Global Emissions factors (EF) data-base - contains both standard and market-based EFs
Revised historical GHG calculations due to retrospective emissions factor changes with simple "click to change" functionality
GHG Data Management Market Advantage

www.figbytes.com19
Testimonials
“FigBytes has several advantages over the legacy system and its competitors that helped address
our challenges. FigBytes automates emission factor management and has the ability to
recalculate GHG when emission factors were updated by the EPA and IEA.
We also like the system’s flexibility in tracking many different facility variables including the various
forms of renewable energy; and being able to attribute a facility’s electricity usage to various
Akamai services so we can analyze our GHG emissions by service. Our ability to easily expand our
scope of management from energy and GHG emissions to other areas such as water, electronic
waste, employee training hours was also important. Overall, very good value for our money.
“There are three main trends in sustainability today:
• First, companies around the world are bringing sustainability into the boardroom, getting
behind forward-looking initiatives such as the Sustainable Development Goals (SDGs) and
many others.
• Investors are also looking to sustainability to identify risk in their portfolios, with new standards
emerging throughout the world.
• At the same time, companies are reporting more than ever with a wide range of standards
and frameworks to create sustainability reports, with tens of thousands of companies
collecting this information every year.
But there are few ways to connect all of this, so sustainability and CSR data rarely become
strategic because of a lack of technology within the nexus that connects these three trends.
That’s what makes FigBytes’ approach unique. By connecting data to strategy and brand, FigBytes
is taking a refreshing and critical step in making sustainability a key part of every company’s
strategy.”
Michael MeehanFounder, TCR Innovations
Former CEO, Global Reporting Initiative
Nicola Peill-Moelter, Ph.D.Director of Sustainability Innovation, VMware
Former Director of Environmental Sustainability, Akamai Technologies