the 24 february 2007 north texas wind and dust...
TRANSCRIPT

Abstract
Impact weather can be defined as a weather event that causes a substantial departure from the normal routine. This paper discusses the atmospheric conditions and roles of synoptic and mesoscale processes during the 24 February 2007 north Texas wind and dust storm, which resulted in impacts to airports in the region, loss of electric power to over 90,000 residents, and the evacuation of thousands due to wildfires. The event was forecast several days in advance, giving decision makers sufficient time to prepare.
Corresponding Author: Jessica A. SchultzNational Weather Service
3401 Northern Cross Blvd, Fort Worth, TX 76137Email: [email protected]
THE 24 FEBRUARY 2007 NORTH TEXAS WIND AND DUST STORM:
AN IMPACT WEATHER EVENT
Jessica A. SchultzNOAA/National Weather Service
Weather Forecast OfficeFt. Worth, Texas
Bernard N. MeisnerNOAA/National Weather ServiceSouthern Region Headquarters
Ft. Worth, Texas

Schultz and Meisner
166 National Weather Digest
1. Introduction Impact weather can be defined as a weather event that causes a substantial departure from the normal routine. The event must be forecastable with sufficient lead time to allow decision makers to take appropriate action that results in a saving of lives and/or a reduction in property damage or other adverse economic impacts. On 24 February 2007, a wind and dust storm impacted the County Warning Area (CWA) of the National Weather Service (NWS) Weather Forecast Office (WFO) Fort Worth, Texas (Fig. 1). Impacts included the closure of the Dallas/Fort Worth and Dallas Love airports that resulted in the cancellation of over 500 flights (KTVT-TV), loss of electric power by more than 90,000 customers, and the rapid spread of wildfires across the area which required the evacuation of thousands of people (Dallas Morning News).
Operational Environmental Satellite (GOES) visible and water vapor imagery to monitor the movement of the low pressure circulation and dust plume. Atmospheric parameters for rising and sinking motions including Q-vector, frontogenesis, and potential vorticity analyses were derived using Rapid Update Cycle (RUC) model data on 40 km and 80 km grids and displayed on AWIPS. Several newspaper articles (available from Web sites) and personal communication with local officials were also used to assess the wind and dust storm impacts.
3. Synoptic and Surface Features
A mid-latitude cyclone moved into the Southern Plains on 24 February 2007. Accompanying this system were strong winds through a deep layer of the troposphere. Synoptic scale and mesoscale subsidence within an extensive layer of the atmosphere, including deep mixing in the lower levels, provided nearly ideal conditions for transporting higher wind speeds aloft to the surface. As a result, sustained westerly winds in excess of 40 mph and gusts between 50 and 60 mph were common across the WFO Fort Worth CWA (Table 1 and Fig. 2).
Fig.1. The National Weather Service Weather Forecast Office in Fort Worth, TX serves 46 counties in north and north central Texas. The 46 counties of the County Warning Area are shown.
This paper discusses the atmospheric conditions on 24 February 2007 which led to the wind and dust storm. The roles of synoptic and mesoscale processes that resulted in momentum transfer of higher winds aloft to the surface, as well as the quality of forecasts and warnings, are also explored.
2. Data and Methods
Meteorological data from 1200 UTC 24 February 2007 to 0000 UTC 25 February 2007 included analyzed surface and upper air data (constant pressure and sounding analyses) from the NWS data collection network, and were obtained from the NOAA Storm Prediction Center Web site (http://www.spc.noaa.gov/) and the Advanced Weather Interactive Processing System (AWIPS). This study also made extensive use of Geostationary
Fig.2. Maximum wind gusts (mph) across the WFO Fort Worth County Warning Area on 24 February 2007.
A large dust cloud developed near Lubbock, Texas and moved eastward, reducing visibilities to less than a mile in some locations across north Texas. Strong winds and dry conditions also led to many grass and wildfires across the region.
a. Features at 500 hPa
At 0000 UTC 23 February 2007, a mid-level trough moved over the Pacific Coast, while mid-level ridging developed across the central United States. By 0000 UTC 24 February 2007, a mid-level jet streak of 95 kt was moving
The 24 February 2007 North Texas Wind and Dust Storm
Volume 33 Number 2 ~ December 2009 167
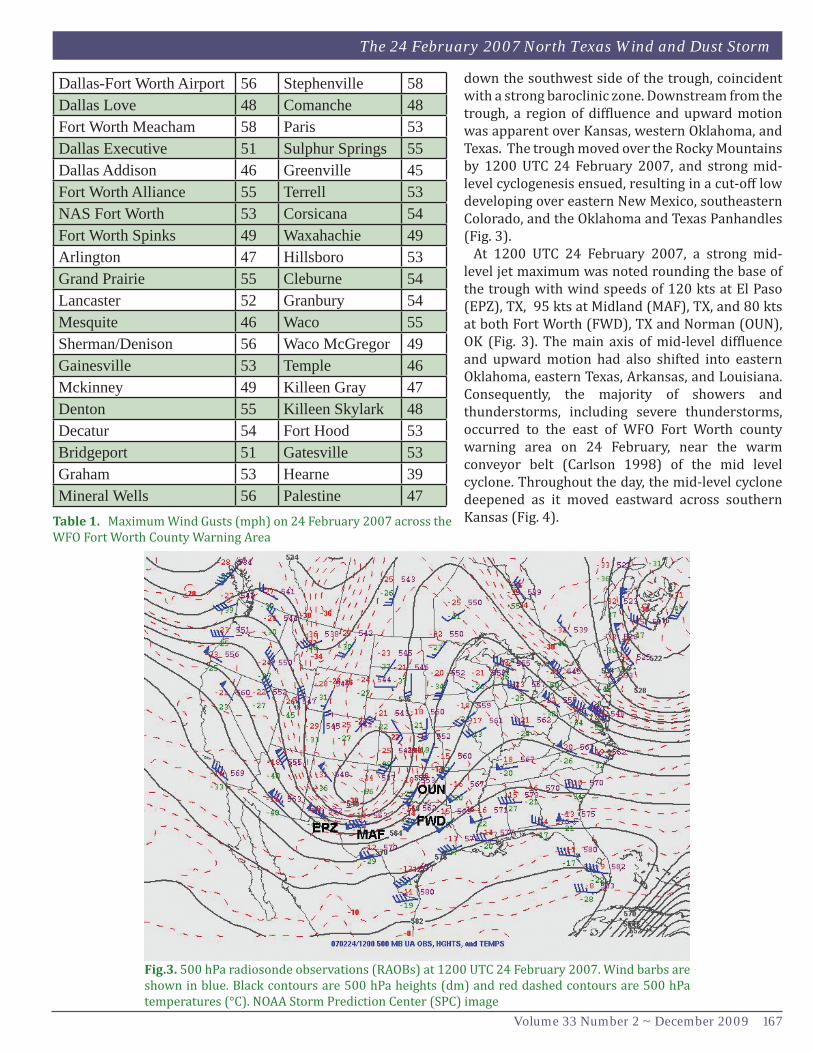
Dallas-Fort Worth Airport 56 Stephenville 58 Dallas Love 48 Comanche 48Fort Worth Meacham 58 Paris 53Dallas Executive 51 Sulphur Springs 55Dallas Addison 46 Greenville 45Fort Worth Alliance 55 Terrell 53NAS Fort Worth 53 Corsicana 54Fort Worth Spinks 49 Waxahachie 49Arlington 47 Hillsboro 53Grand Prairie 55 Cleburne 54Lancaster 52 Granbury 54Mesquite 46 Waco 55Sherman/Denison 56 Waco McGregor 49Gainesville 53 Temple 46Mckinney 49 Killeen Gray 47Denton 55 Killeen Skylark 48Decatur 54 Fort Hood 53Bridgeport 51 Gatesville 53Graham 53 Hearne 39Mineral Wells 56 Palestine 47
Table 1. Maximum Wind Gusts (mph) on 24 February 2007 across the WFO Fort Worth County Warning Area
Fig.3. 500 hPa radiosonde observations (RAOBs) at 1200 UTC 24 February 2007. Wind barbs are shown in blue. Black contours are 500 hPa heights (dm) and red dashed contours are 500 hPa temperatures (°C). NOAA Storm Prediction Center (SPC) image
down the southwest side of the trough, coincident with a strong baroclinic zone. Downstream from the trough, a region of diffluence and upward motion was apparent over Kansas, western Oklahoma, and Texas. The trough moved over the Rocky Mountains by 1200 UTC 24 February 2007, and strong mid-level cyclogenesis ensued, resulting in a cut-off low developing over eastern New Mexico, southeastern Colorado, and the Oklahoma and Texas Panhandles (Fig. 3). At 1200 UTC 24 February 2007, a strong mid-level jet maximum was noted rounding the base of the trough with wind speeds of 120 kts at El Paso (EPZ), TX, 95 kts at Midland (MAF), TX, and 80 kts at both Fort Worth (FWD), TX and Norman (OUN), OK (Fig. 3). The main axis of mid-level diffluence and upward motion had also shifted into eastern Oklahoma, eastern Texas, Arkansas, and Louisiana. Consequently, the majority of showers and thunderstorms, including severe thunderstorms, occurred to the east of WFO Fort Worth county warning area on 24 February, near the warm conveyor belt (Carlson 1998) of the mid level cyclone. Throughout the day, the mid-level cyclone deepened as it moved eastward across southern Kansas (Fig. 4).

Schultz and Meisner
168 National Weather Digest
Fig.4. 500 hPa RAOBs at 0000 UTC 25 February 2007. Contours and data plots shown are the same as in Fig. 3. NOAA/SPC image.
b. Winds in the mixed layer
Wind speeds at 700 hPa increased and wind directions veered from the southwest at 1200 UTC 24 February 2007 to westerly at 0000 UTC 25 February 2007 along the base of the trough, which moved over Oklahoma and northern Texas. As the cyclone deepened, winds increased from the 1200 UTC values of 70 kt at MAF, 45 kt at FWD, and 45 kt at OUN to the 0000 UTC measurements of 65 kt at FWD, 65 kt at Shreveport, LA (SHV), and 90 kt at Little Rock, AR (LZK). Several smaller circulations moving around the upper low were noted on GOES visible imagery throughout afternoon hours on 24 February 2007 (Figs. 5 and 6). The RUC (Benjamin et al. 2004) analysis at 1800 UTC of 700-hPa vorticity (not shown) depicted one particularly strong circulation across southwest Oklahoma, which was also evident on visible satellite imagery, and the developing dust plume appeared to wrap into the northern and eastern periphery of this circulation. By 2200 UTC, GOES visible imagery showed that the mid-level circulation had elongated and translated into eastern Oklahoma, swinging the dust plume from eastern Oklahoma into central Texas (Figs. 5-6). A strong low-level jet (LLJ) was present along and just to the east of the Interstate 35 corridor (Fig. 1) on
the morning of 24 February. The 1200 UTC analysis at 850 hPa indicated a 50-60 kt maximum of southerly winds extending from Brownsville, TX (BRO) to Fort Worth to Springfield, MO (SGF) (Fig. 7). Winds just to the west of the LLJ axis were strong as well as indicated by a west wind of 45 kt at MAF at 1200 UTC. Winds were also abnormally strong at 925 hPa (roughly 700 m above ground level) at Fort Worth with 40 kt measured at 1200 UTC.
c. Mid and upper-level vertical motions
An atmospheric cross-section of divergent Q and convergent Q from near Childress to College Station, Texas at 1800 UTC 24 February 2007 was examined to determine vertical circulations as a result of frontogenesis and jet circulations aloft (Fig. 8). The Q-vector is a horizontal vector from quasi-geostrophic theory that tends to point in the direction of rising air (Glickman 2000). Q-vectors are associated with the forcing of vertical motion. Convergent Q-vectors are related to rising motion in the atmosphere (Holton 1992). The RUC analysis of total divergent Q (Fig. 9) supported synoptic scale sinking motions across the region, possibly related to cold air advection. Total divergent Q increased in magnitude from northwest to southeast over the region between 1800 UTC and 2000 UTC (Figs. 8-9). Convergent

The 24 February 2007 North Texas Wind and Dust Storm
Volume 33 Number 2 ~ December 2009 169
Fig.5. GOES East visible imagery at 1932 UTC 24 February 2007. The X indicates a 700hPa relative vorticity maximum from the Rapid Update Cycle analysis at 2000 UTC.
Fig.6. GOES East visible satellite imagery at 2155 UTC 24 February 2007. The X indicates a 700hPa relative vorticity maximum from the Rapid Update Cycle analysis at 2200 UTC.
Fig.7. 850 hPa analysis at 1200 UTC 24 February 2007. Contour and data plots shown are the same as in Fig. 3 except for green contours, which are dewpoints greater than or equal to 8°C. NOAA/SPC image.

Schultz and Meisner
170 National Weather Digest
Fig.8. Cross-section of divergent Q (red shading) and convergent Q (blue shading) at 1800 UTC, 24 February 2007, from Childress (CDS) to College Station (CLL), Texas. Units shown are x 10-16 K m-2 s-1. Derived from RUC data on an 80 km AWIPS grid.
Fig.9. Same as Fig. 8 except at 2000 UTC 24 February 2007.
Fig.10. Cross-section of frontogenesis (red shading), frontolysis (blue shading) and vertical motion (black contours) at 2000 UTC 24 February 2007 from Childress (CDS) to College Station (CLL), Texas. Units shown are x 10-10 K m-1 s-1. Derived from RUC data on a 40 km AWIPS grid.
Q was present farther southeast, nearer to the southern extent of the warm conveyor belt. Cyclonically curved jet streaks at 300 hPa, 500 hPa, and 700 hPa placed north Texas within the right-exit region of the wind maxima at 1200 UTC 24 February 2007. RUC forecasts of divergent Q-vectors normal to the isentropes over western Oklahoma and the Texas Panhandle indicated strong subsidence, likely associated with the sinking branches of the transverse jet circulations. This subsidence spread eastward into north Texas through the afternoon hours. Strong frontogenesis was analyzed in the 700-300 hPa layer along the gradient of divergent and convergent Q from Wichita Falls to Dallas, Texas (red shading in Fig. 10). This frontogenesis was at mid levels near the 650-400 hPa layer, while near Waco the frontogenesis was lower in the atmosphere between 850 and 700 hPa. Ageostrophic wind streamlines (not shown) indicated broad-scale downward motions throughout the lower half of the troposphere as a result of the frontogenetical circulation (Fig. 10). Potential vorticity units (1 PVU = 10-6 m2 K s-1 kg-1) between one and two have been shown to trace the zone between the upper troposphere and lower stratosphere (Brennan et al. 2008; Morgan et al. 1998). A diagnosis of tropospheric folding derived from the RUC model, using the one- to two-PVU contours (Fig. 11), showed that stratospheric air was folded down to the 500 hPa and 600 hPa levels near Fort Worth. In the RUC cross-section (Fig. 11), the 1.5 PVU contour extended to about 600 hPa near Fort Worth. The color-shaded portion of Fig. 11 displays
wind speed (kt), with warmer colors representing higher values. The image indicates that wind speeds near 120 kt were present just southeast of the area of strongest tropospheric folding. The folding through a deep layer of the atmosphere implied that stronger winds within the upper troposphere and lower stratosphere were transported downward at least to mid levels. Earlier research has shown that strong winds can occur beneath dry stratospheric intrusions with mid-latitude cyclones (Iacopelli et al. 2001; Browning 1997). Once these higher

The 24 February 2007 North Texas Wind and Dust Storm
Volume 33 Number 2 ~ December 2009 171
Fig.11. Cross-section of potential vorticity (1 PVU = 10-6 m2 K s-1 kg-1) in white contours and wind speed (kt) in shaded colors at 2200 UTC from near Gage (GAG), Oklahoma to near Houston (IAH), Texas. Data derived from RUC data on a 40 km AWIPS grid.
winds were transported into mid levels, other processes such as frontogenetical circulations, daytime turbulent mixing, and dry adiabatic lapse rates assisted with mixing higher momentum into the boundary layer.
d. Sounding analysis A moist boundary layer was in place over north Texas during the early morning hours on 24 February 2007. At 1200 UTC, showers and thunderstorms were present across eastern portions of the forecast area. The 1200 UTC FWD sounding (Fig. 12) depicted some moisture in the lower levels, but this moisture quickly moved eastward, as evidenced by surface dewpoints, while a mixed layer developed within the lowest 100 hPa. Backing winds with height were apparent throughout the 700-200 hPa layer, implying cold air advection and associated subsidence within that layer. The 1200 UTC MAF sounding (not shown) was much drier than that from FWD, with a mixed layer extending from the surface to around 750 hPa. At 0000 UTC 25 February 2007, the FWD sounding wind profiles indicated that backing of winds with height
continued within the 700-200 hPa layer (Fig. 13). The adiabatic mixed layer extended from the surface through approximately 750 hPa.
e. Surface features The surface low deepened slightly during the day with minimum pressures falling from 988 hPa over central Kansas at 1400 UTC to 985 hPa at 2000 UTC. The RUC surface analysis (not shown) depicted the strongest pressure gradient along the west side of the surface cyclone over eastern Colorado and western Kansas. Surface dewpoint depressions between 40° and 50° F were observed at many sites in the Fort Worth CWA (Figs. 14-15) as a broad dry slot, indicative of a strong, deep layer of subsidence, rotated across Texas south of the mid-level cyclone during the day. Maximum wind gusts across the area were reached between 1800 and 2000 UTC (Figs. 14-15). At Waco Regional Airport (KACT), the maximum gust of 48 kt occurred at 1833 UTC, while DFW reached a maximum gust of 49 kt at 2003 UTC.

Schultz and Meisner
172 National Weather Digest
Fig.12. Fort Worth, Texas (FWD) sounding at 1200 UTC 24 February 2007.
Fig.13. FWD sounding at 0000 UTC 25 February 2007.

The 24 February 2007 North Texas Wind and Dust Storm
Volume 33 Number 2 ~ December 2009 173
Fig.14. Surface observations from 1800 UTC 24 February 2007. Solid blue lines are state outlines and solid orange lines are National Weather Service County Warning Areas. Observations are shown in black with station IDs in green. KDFW is Dallas/Fort Worth Airport and KACT is Waco.
Fig.15. Same as Fig. 14 except at 2000 UTC 24 February 2007.

Schultz and Meisner
174 National Weather Digest
4. Discussion
Transportation of higher momentum aloft to the surface was aided by both synoptic scale and mesoscale subsidence acting in unison over north Texas. Synoptically, in the upper and mid levels, cyclonically curved jet streaks at 300 hPa (Figs. 16-17), 500 hPa, and 700 hPa placed north Texas in the right-exit region of the jet maxima at 1200 UTC 24 February 2007. Q-vector analysis (Figs. 8-9) at 1800 UTC and 2000 UTC showed a broad area of enhanced subsidence in the 700-300 hPa layer from the Texas Panhandle eastward into much of north Texas. Q-vector convergence, which forces rising motion, was present farther southeast of the Fort Worth CWA, where the warm conveyor belt was more influential. The FWD soundings at 1200 UTC 24 February 2007 (Fig. 12) and 0000 UTC 25 February 2007(Fig. 13) indicated cold air advection within the mid levels, inferred from backing of the winds with height. RUC analysis of 500-hPa and 700-hPa temperatures and winds (not shown) indicated that the cold air advection increased through the day from the Texas Panhandle eastward to just south of the Red River as the upper low pivoted into eastern Kansas. Additional sinking motions were likely aided by anticyclonic vorticity advection, increasing with height in the atmosphere. In the mesoscale, strong frontogenesis existed along the gradient between Q-vector divergence and convergence across north Texas (Fig. 10), and the associated frontogenetical circulations likely assisted with momentum transport. Cross-sections (such as Fig. 11) also indicated tropospheric folding was present, providing some transport of winds in the 300-200 hPa layer to 500 hPa, or slightly below.
Fig.16. 300 hPa analysis at 1200 UTC 24 February 2007. 300 hPa wind observations (kt) are shown in blue barbs. Blue contours and shading are isotachs (kt), streamlines are in black, and yellow contours are divergence (10-5s-1). NOAA/SPC image.
Fig.17. 300 hPa analysis at 0000 UTC 25 February 2007. Contours and data plots shown are the same as in Fig. 16. NOAA/SPC image.

The 24 February 2007 North Texas Wind and Dust Storm
Volume 33 Number 2 ~ December 2009 175
Fig.18. GOES East water vapor imagery at 1702 UTC 24 February 2007. The L indicates the approximate center of circulation as determined by RUC analysis at 1700 UTC. Scale in upper left shows brightness temperature (K).
Fig.19. Same as Fig. 18 except for 1902 UTC 24 February 2007.
Fig.20. Same as Fig. 18 except for 2202 UTC 24 February 2007.
A broad dry slot, evident in the water vapor imagery (Figs. 18-20) and RUC 1000-500 hPa relative humidity fields (not shown), engulfed north Texas from 1700 UTC through the remainder of the day with average surface dewpoint depressions increasing from 40° F to 50° F during the time of highest observed winds at mid-afternoon. Time of day and wind direction also played a role in enhancing momentum transport. Daytime turbulent mixing created steep low-level lapse rates which were nearly dry adiabatic from the surface up to 700 hPa (Fig. 13). This unstable mixed layer was nearly ideal for allowing momentum transport from mid levels to low levels. The westerly wind direction resulted in downslope flow from west Texas into central Texas. Low-level warming, associated with downslope flow, assisted in maintaining a deepening boundary layer with a dry adiabatic lapse rate conducive to deep mixing. The combination of these factors resulted in higher winds aloft sufficiently mixing to the surface, causing an 11-hour period of gusts in excess of 30 kt. Although the magnitude of the pressure gradient was not abnormally strong across north Texas, deep mixing up to 700 hPa and subsidence through much of the atmospheric column allowed strong winds to reach ground level. The aforementioned factors observed during this event were similar to those associated with the San Joaquin Valley, California dust storm in 1991 (Pauley et al. 1996).
Schultz and Meisner
176 National Weather Digest
5. Weather Services before and during the Event
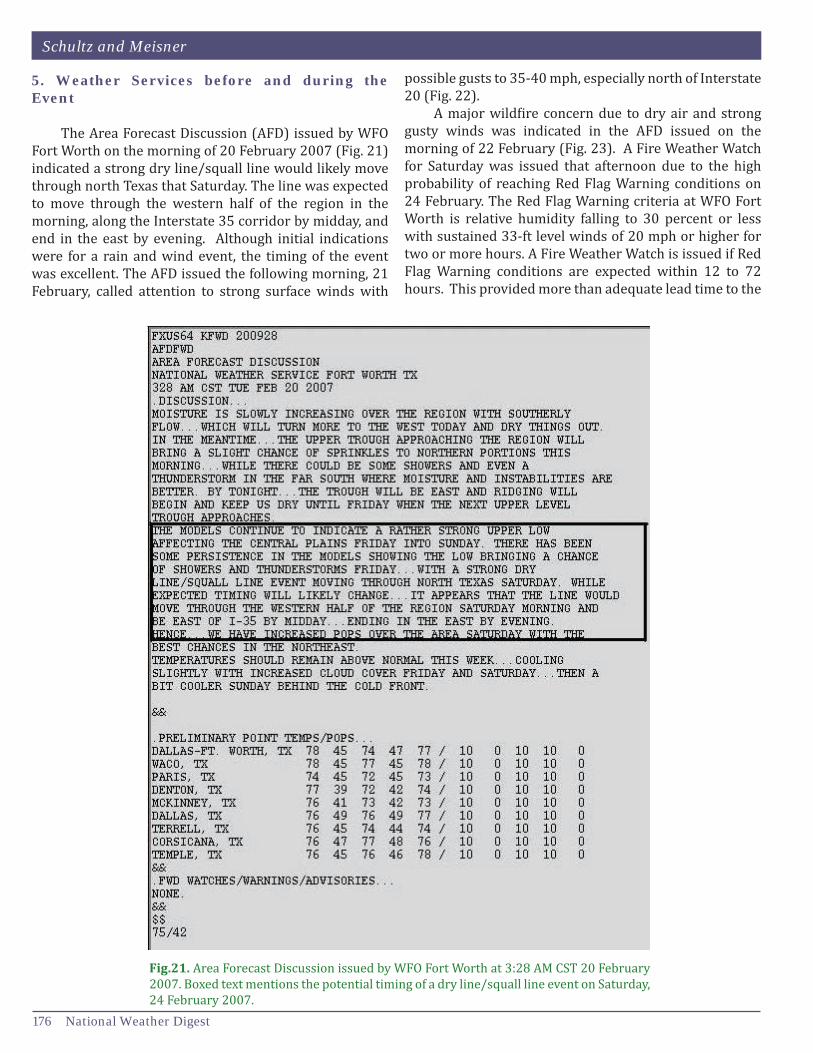
The Area Forecast Discussion (AFD) issued by WFO Fort Worth on the morning of 20 February 2007 (Fig. 21) indicated a strong dry line/squall line would likely move through north Texas that Saturday. The line was expected to move through the western half of the region in the morning, along the Interstate 35 corridor by midday, and end in the east by evening. Although initial indications were for a rain and wind event, the timing of the event was excellent. The AFD issued the following morning, 21 February, called attention to strong surface winds with
Fig.21. Area Forecast Discussion issued by WFO Fort Worth at 3:28 AM CST 20 February 2007. Boxed text mentions the potential timing of a dry line/squall line event on Saturday, 24 February 2007.
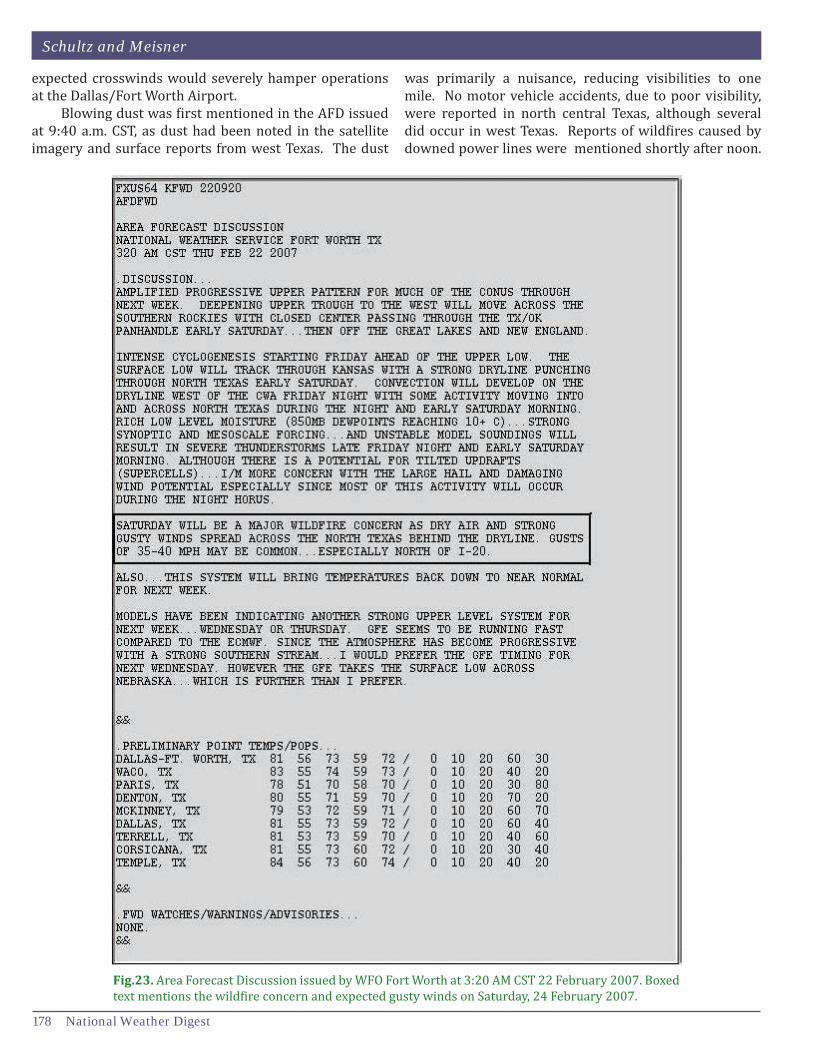
possible gusts to 35-40 mph, especially north of Interstate 20 (Fig. 22). A major wildfire concern due to dry air and strong gusty winds was indicated in the AFD issued on the morning of 22 February (Fig. 23). A Fire Weather Watch for Saturday was issued that afternoon due to the high probability of reaching Red Flag Warning conditions on 24 February. The Red Flag Warning criteria at WFO Fort Worth is relative humidity falling to 30 percent or less with sustained 33-ft level winds of 20 mph or higher for two or more hours. A Fire Weather Watch is issued if Red Flag Warning conditions are expected within 12 to 72 hours. This provided more than adequate lead time to the

The 24 February 2007 North Texas Wind and Dust Storm
Volume 33 Number 2 ~ December 2009 177
Fig.22. Area Forecast Discussion issued by WFO Fort Worth at 3:42 AM CST 21 February 2007. Boxed text mentions the expected gusty winds on Saturday, 24 February 2007.
impacted fire agencies. By that evening, the likelihood of a Wind Advisory was also mentioned for Saturday. A Wind Advisory is issued by WFO Fort Worth when sustained wind speeds of 25 mph or greater are expected for two hours or longer. Near midday on Friday, 23 February, the WFO Fort Worth (in collaboration with the Fort Worth Center Weather Service Unit) indicated that expected steep lapse rates would result in mixing of strong lower tropospheric
winds from the west-southwest, which is a crosswind for all major runways at both Dallas/Fort Worth and Dallas Love airports (Fig. 24). Major delays were expected. A Red Flag Warning and Wind Advisory were issued. On the morning of the event, the Red Flag Warning remained in effect and a High Wind Warning was issued with the likelihood of afternoon winds reaching 40 mph for an hour or two indicated. The aviation section of the AFD issued early Saturday morning (Fig. 25) noted that the
Schultz and Meisner
178 National Weather Digest
Fig.23. Area Forecast Discussion issued by WFO Fort Worth at 3:20 AM CST 22 February 2007. Boxed text mentions the wildfire concern and expected gusty winds on Saturday, 24 February 2007.
expected crosswinds would severely hamper operations at the Dallas/Fort Worth Airport. Blowing dust was first mentioned in the AFD issued at 9:40 a.m. CST, as dust had been noted in the satellite imagery and surface reports from west Texas. The dust
was primarily a nuisance, reducing visibilities to one mile. No motor vehicle accidents, due to poor visibility, were reported in north central Texas, although several did occur in west Texas. Reports of wildfires caused by downed power lines were mentioned shortly after noon.

The 24 February 2007 North Texas Wind and Dust Storm
Volume 33 Number 2 ~ December 2009 179
Fig.24. Area Forecast Discussion issued by WFO Fort Worth at 11:30 AM CST 23 February 2007. Boxed text mentions the steep lapse rates aiding the mixing of strong winds aloft to mix to the surface on 24 February 2007. The crosswind impact is also discussed.
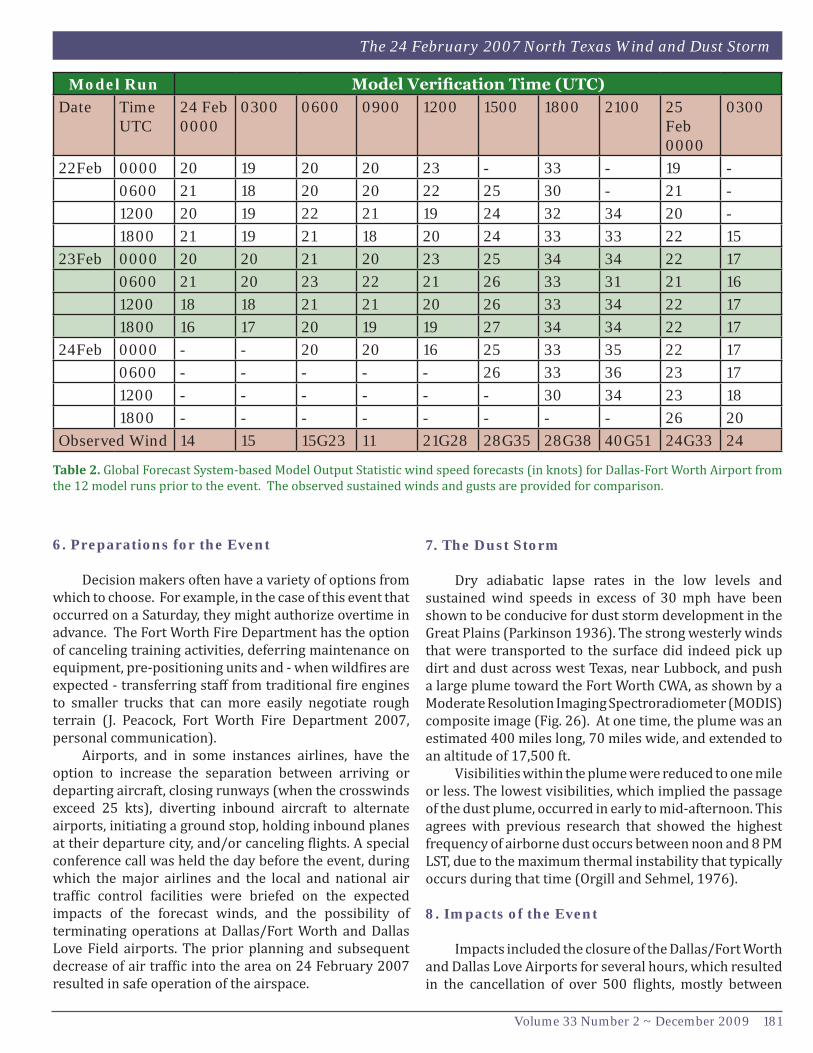
A Blowing Dust Advisory was issued for 1:00–6:00 p.m. CST as the extent of the dust plume became more apparent on satellite imagery. Numerical model guidance prior to the event captured the expected wind speeds relatively well. The
GFS-based model output statistics (Table 2) from all model runs leading up to the event indicated sustained winds in excess of 30 kt were likely, although the predicted timing of the event was consistently a bit slow.

Schultz and Meisner
180 National Weather Digest
Fig.25. Area Forecast Discussion issued by WFO Fort Worth at 4:36 AM CST 24 February 2007. Boxed text mentions the strong winds expected and crosswind impacts to Dallas/Fort Worth Airport.
The 24 February 2007 North Texas Wind and Dust Storm
Volume 33 Number 2 ~ December 2009 181
6. Preparations for the Event
Decision makers often have a variety of options from which to choose. For example, in the case of this event that occurred on a Saturday, they might authorize overtime in advance. The Fort Worth Fire Department has the option of canceling training activities, deferring maintenance on equipment, pre-positioning units and - when wildfires are expected - transferring staff from traditional fire engines to smaller trucks that can more easily negotiate rough terrain (J. Peacock, Fort Worth Fire Department 2007, personal communication). Airports, and in some instances airlines, have the option to increase the separation between arriving or departing aircraft, closing runways (when the crosswinds exceed 25 kts), diverting inbound aircraft to alternate airports, initiating a ground stop, holding inbound planes at their departure city, and/or canceling flights. A special conference call was held the day before the event, during which the major airlines and the local and national air traffic control facilities were briefed on the expected impacts of the forecast winds, and the possibility of terminating operations at Dallas/Fort Worth and Dallas Love Field airports. The prior planning and subsequent decrease of air traffic into the area on 24 February 2007 resulted in safe operation of the airspace.
7. The Dust Storm Dry adiabatic lapse rates in the low levels and sustained wind speeds in excess of 30 mph have been shown to be conducive for dust storm development in the Great Plains (Parkinson 1936). The strong westerly winds that were transported to the surface did indeed pick up dirt and dust across west Texas, near Lubbock, and push a large plume toward the Fort Worth CWA, as shown by a Moderate Resolution Imaging Spectroradiometer (MODIS) composite image (Fig. 26). At one time, the plume was an estimated 400 miles long, 70 miles wide, and extended to an altitude of 17,500 ft. Visibilities within the plume were reduced to one mile or less. The lowest visibilities, which implied the passage of the dust plume, occurred in early to mid-afternoon. This agrees with previous research that showed the highest frequency of airborne dust occurs between noon and 8 PM LST, due to the maximum thermal instability that typically occurs during that time (Orgill and Sehmel, 1976).
8. Impacts of the Event
Impacts included the closure of the Dallas/Fort Worth and Dallas Love Airports for several hours, which resulted in the cancellation of over 500 flights, mostly between
Model Run Model Verification Time (UTC)
Date Time UTC
24 Feb 0000
0300 0600 0900 1200 1500 1800 2100 25Feb 0000
0300
22Feb 0000 20 19 20 20 23 - 33 - 19 -
0600 21 18 20 20 22 25 30 - 21 -
1200 20 19 22 21 19 24 32 34 20 -
1800 21 19 21 18 20 24 33 33 22 15
23Feb 0000 20 20 21 20 23 25 34 34 22 17
0600 21 20 23 22 21 26 33 31 21 16
1200 18 18 21 21 20 26 33 34 22 17
1800 16 17 20 19 19 27 34 34 22 17
24Feb 0000 - - 20 20 16 25 33 35 22 17
0600 - - - - - 26 33 36 23 17
1200 - - - - - - 30 34 23 18
1800 - - - - - - - - 26 20
Observed Wind 14 15 15G23 11 21G28 28G35 28G38 40G51 24G33 24
Table 2. Global Forecast System-based Model Output Statistic wind speed forecasts (in knots) for Dallas-Fort Worth Airport from the 12 model runs prior to the event. The observed sustained winds and gusts are provided for comparison.

Schultz and Meisner
182 National Weather Digest
Fig.26. Moderate Resolution Imaging Spectroradiometer (MODIS) composite imagery valid at 1920 UTC 24 February 2007. Red pixels indicate large fires. Image courtesy of MODIS Rapid Response Project at NASA/GSFC (http://modis.gsfc.nasa.gov/).
2:00 and 5:00 p.m. CST (KTVT-TV). Consequently, over a thousand people were forced to spend the night at the airport. The flight cancellations also affected other terminals across the nation. Long lines were reported at Los Angeles International Airport as airlines had to rebook passengers whose flights had been canceled (Los Angeles Times). More than 90,000 customers in the Dallas/Fort Worth Metroplex lost electric power during the event. By 9:00 p.m. CST, power had been restored to about 56,000; and all power was restored by 6:00 PM CST Sunday (KTVT-TV). This rather quick restoration of power suggested that the electric utilities were prepared for the event. Downed power lines were one source of the many wildfires which spread rapidly due to the strong and gusty winds (Fig. 26). The Fort Worth Fire Department reported about half of the dispatches on the day of the event were directly related to the strong winds, including
reports of downed trees on homes and vehicles, downed and arcing power lines, and grass fires. About 95 homes were evacuated across Texas due to fires. One fire that began about 1:30 p.m. CST at Fort Hood in Texas resulted in the closure of the post exchange, the base commissary, and the evacuation of an estimated 6,500 people from military housing on the base (KTVT-TV). The Dallas Area Rapid Transit System was impacted by several failed signals and switches, and also stuck crossing-gate arms. In some instances, passengers had to change trains in order to continue to their destinations. Several windows in a Dallas office building blew out, scattering glass onto the street and sidewalk (Dallas Morning News). Additionally, two Fort Worth high school students were injured when they were struck by a wind-blown table as they were running in a track meet (Fort Worth Star Telegram).

The 24 February 2007 North Texas Wind and Dust Storm
Volume 33 Number 2 ~ December 2009 183
References
Benjamin, S.G., D. Dévényi, S.S. Weygandt, K.J. Brundage, J.M. Brown, G.A. Grell, D. Kim, B.E. Schwartz, T.G. Smirnova, T.L. Smith, and G.S. Manikin, 2004: An hourly assimilation–forecast cycle: The RUC. Mon. Wea. Rev., 132, 495–518.
Brennan, M.J., G.M. Lackmann, and K.M. Mahoney, 2008: Potential vorticity (PV) thinking in operations: The utility of nonconservation. Wea. Forecasting, 23, 168-182.
Browning, K.A., 1997: The dry intrusion perspective of extra-tropical cyclone development. Meteorol . Appl., 4, 317-324.
Carlson, T.N. 1998: Mid-Latitude Weather Systems. Amer. Meteor. Soc., 507 pp.
Dallas Morning News, cited February 25, 2007: Look what the wind blew in. [Available online at http://www.dallasnews.com/sharedcontent/dws/news/localnews/tv/stories/DN- South.Edition1.B1.ART.South.Edition1.20b9742.html.]
Fort Worth Star-Telegram, cited February 25, 2007: Dust in the Wind.
Glickman, T.S., 2000: American Meteorological Society Glossary of Meteorology. Amer. Meteor. Soc., 855 pp.
Holton, J.R. 1992: An Introduction to Dynamic Meteorology. Academic Press, Inc., 509 pp.
Iacopelli, A.J., and J.A. Knox, 2001: Mesoscale dynamics of the record-breaking 10 November 1998 mid-latitude cyclone: A satellite-based case study. Natl. Wea. Dig., 25 (1, 2), 33-41.
9. Summary
On 24 February 2007, a wind and dust storm impacted north Texas with sustained westerly winds in excess of 40 mph and gusts between 50 and 60 mph. As a mid-latitude cyclone moved into the Southern Plains, synoptic and mesoscale subsidence within a large layer of the atmosphere provided nearly ideal conditions for momentum transfer. Upper level jet circulations, frontogenesis, the time of day, and wind direction all played a role in allowing for the sufficient mixing of winds aloft to the surface. These strong winds impacted local airports, resulting in the cancellation of over 500 flights at Dallas/Fort Worth and Dallas Love Airports. Furthermore, the winds caused power outages that left more than 90,000 customers in the Dallas/Fort Worth Metroplex without electricity. Downed power lines also sparked numerous wildfires across Texas, resulting in the evacuation of 95 homes across the state and an estimated 6,500 people from military housing on the Fort Hood Base. The strong winds were forecast days in advance by WFO Fort Worth through products such as the Area Forecast Discussion, Fire Weather Watch, Red Flag Warning, Wind Advisory, and High Wind Warning. The conditions were also well forecast by the operational numerical weather prediction models as early as three days prior to the event. Local forecasters alerted decision makers days in advance of the storm, reducing the impacts of the event.
Authors
Jessica A. Schultz is a forecaster with the NWS in Fort Worth, TX. She obtained her B.S. in Meteorology from the University of Oklahoma. Jessica served as a student employee with the NWS Radar Operations Center in Norman, OK and a student volunteer with NWS Norman, OK. Before joining NWS Fort Worth, Jessica worked as a meteorologist intern at the NWS in Springfield, MO. Her professional interests include high impact weather, decision support, severe storm forecasting and research, warning operations, and outreach.
Bernard N. Meisner serves as Chief of the Science & Training Branch at NWS Southern Region Headquarters. He is a past vice president, as well as current and former councilor of the National Weather Association. He has served on the Association’s education committee, on the evaluation panel for the Association’s broadcast seal of approval, and he also supervised the NWA logo contest. Bernard was honored as the NWA’s Member of the Year in 2000.
Acknowledgments
Sincere thanks are extended to Greg Patrick, Science and Operations Officer at NWS Fort Worth, for his guidance, insightful discussions, assistance with gathering data and references, and review of this paper. The authors would also like to thank reviewers Sam Beckman, Chris Tomer, and William Winkler, as well as the National Weather Digest editors for their critique of this manuscript.

Schultz and Meisner
184 National Weather Digest
KTVT-TV, cited February 25, 2007: Effects of Saturday Winds Still Felt Sunday.
Los Angeles Times, cited February 26, 2007. Shutdown of Dallas Airport throws LAX into
Turmoil. [Available online at: http://articles.latimes.com/2007/feb/26/local/me-airport26.]
Morgan, M.C., and J.W. Nielsen-Gammon, 1998: Using tropopause maps to diagnose midlatitude weather systems. Mon. Wea. Rev., 126, 2555-2579.
Orgill, M.M., and G.A. Sehmel, 1976: Frequency and diurnal
variation of dust storms in the contiguous U.S.A. Atmos. Environ., 10, 813-825.
Parkinson, G.R., 1936: Dust storms over the Great Plains: Their causes and forecasting. Bull. Amer. Meteor. Soc., 17, 127-135.
Pauley, P.M., N.L. Baker, and E.H. Barker, 1996: An observational study of the “Interstate 5” Dust Storm Case. Bull. Amer. Meteor. Soc., 77, 693-720.