the 21st century city: urban opportunities and challenges in a global context public policy &...
Post on 22-Dec-2015
217 views
TRANSCRIPT

The 21st Century City: Urban Opportunities and
Challenges in a Global Context
Public Policy & Urban Affairs G6201
Seminar 1
“What Makes a City a City”
Professor Barry BluestoneProfessor Paul Grogan
Northeastern University

What Makes Cities Special?
• Density
• Diversity
• Positive Externalities
• Negative Externalities
• Love/Hate Relationship with Central Cities
• Love/Hate Relationship with Suburbs

Basic Social Functions of Urban Areas
• Large-scale production of goods and services
• Technical and social innovation
• Provide a desirable residential environment
• Provide a social support system for residents
• Source: Bradbury, Downs, and Small, Urban Decline and the Future of American Cities
(Brookings, 1982)

Large Scale Production of Goods and Services
• Maintain and generate export (economic base) activities
• Maintain and generate production for local use
• Provide employment and earnings to residents and others in
the region
• Maintain, improve, and replace stock of non-residential
structures (i.e. industrial, commercial, & public buildings)
• Maintain a labor pool of varying skills and specializations• Source: Bradbury, Downs, and Small, Urban Decline and the Future of American Cities
(Brookings, 1982)

Technical and Social Innovation
• Stimulate innovations leading to higher productivity
• Provide means for communications
• Provide higher educational programs
• Provide households with opportunities for upward mobility
• Provide centralized facilities for face-to-face contact
• Provide opportunities for employment, education, and exercise of
leadership for groups subjected to social or economic discrimination
• Source: Bradbury, Downs, and Small, Urban Decline and the Future of American Cities (Brookings, 1982)

Residential Environment
• Maintain, improve, and replace stock of residential structures
• Provide neighborhood amenities: attractive appearance,
safety, freedom from excessive noise, and social interactions
• Provide retailing facilities for residents
• Source: Bradbury, Downs, and Small, Urban Decline and the Future of American Cities (Brookings, 1982)

Social Support System
• Provide educational programs for children
• Provide cultural, recreational, religious, and entertainment
services and facilities
• Provide health care services and facilities
• Source: Bradbury, Downs, and Small, Urban Decline and the Future of American Cities (Brookings, 1982)

Urban Governance
• Provide an effective system of justice for settling conflicts and
disputes
• Maintain an efficient and equitable system of taxation to
support government functions
• Maintain government institutions for coping with changes in
local conditions
• Facilitate citizens’ participation in local government decisions
• Source: Bradbury, Downs, and Small, Urban Decline and the Future of American Cities (Brookings, 1982)

Supporting Functions
• Provide public order and personal security• Provide and maintain transportation systems• Provide a system for collecting capital to finance consumer,
business, government, and other activities• Provide and distribute energy resources required for other
activities• Maintain, improve, and replace physical infrastructure• Dispose of wastes and protect the environment
• Source: Bradbury, Downs, and Small, Urban Decline and the Future of American Cities (Brookings, 1982)

Key Urban Issues – Economic Prosperity
• Context of Urban Change - Macroeconomic, Technological, and Demographic
• Uneven Growth of Metro Areas
• Increased Income Inequality among Metro Areas
• Changing conditions of Inner City neighborhoods
• Source: Wyly, Glickman, and Lahr, “A Top 10 List of Things to Know about American Cities,” Cityscape, Vol. 3, No. 3, 1998

The Changing Fortunes ofMetro Areas

Metro Area Median Family Income 1970 (in $2005)$6
3,92
7
$63,
741
$62,
592
$62,
496
$59,
739
$59,
021
$58,
978
$58,
782
$55,
072
$54,
716
$54,
599
$52,
566
$51,
853
$51,
741
$50,
751
$47,
590
$45,
350
$44,
871
$44,
632
$41,
162
$40,000
$45,000
$50,000
$55,000
$60,000
$65,000
$70,000

Metro Area Median Family Income 2005 ($2005)
$79,
676
$76,
104
$76,
093
$67,
870
$67,
419
$67,
419
$66,
221
$66,
007
$65,
739
$63,
484
$63,
052
$61,
974
$60,
345
$59,
950
$58,
319
$56,
706
$56,
622
$56,
029
$55,
855
$49,
722
$40,000
$45,000
$50,000
$55,000
$60,000
$65,000
$70,000
$75,000
$80,000
$85,000

Median Family Income 2005 Central Cities
$20,000
$30,000
$40,000
$50,000
$60,000
$70,000
$80,000
$73,180
$46,888
$28,984
Source: U.S. Census Bureau, SOCDS Data Set

Median Family Income 2005Suburbs
$40,000
$45,000
$50,000
$55,000
$60,000
$65,000
$70,000
$75,000
$80,000
$85,000$81,230
$65,397
$59,235

Ratio of Suburban/Central City Median Family Income 2005
1.021.08 1.09 1.09 1.09
1.17 1.20 1.23 1.271.37 1.41 1.41
1.51 1.541.65 1.70 1.74
1.881.94
2.63
0.00
0.50
1.00
1.50
2.00
2.50
3.00
Raleigh
Austin
Jack
sonv
ille
San F
ranc
isco
Portla
nd
Phoen
ix
Tucso
n
Los A
ngele
s
Salt L
ake
City
New Y
ork
Chicag
o
Tacom
a
Atlant
a
Bosto
n
St. Lo
uis
Buffa
lo
Milw
auke
e
Detro
it
Newar
k
Hartfo
rd

Percent Change in Median Family Income ($2005 Dollars) Central Cities (1969-2005)
-50.0%
-40.0%
-30.0%
-20.0%
-10.0%
0.0%
10.0%
20.0%
30.0%
40.0%
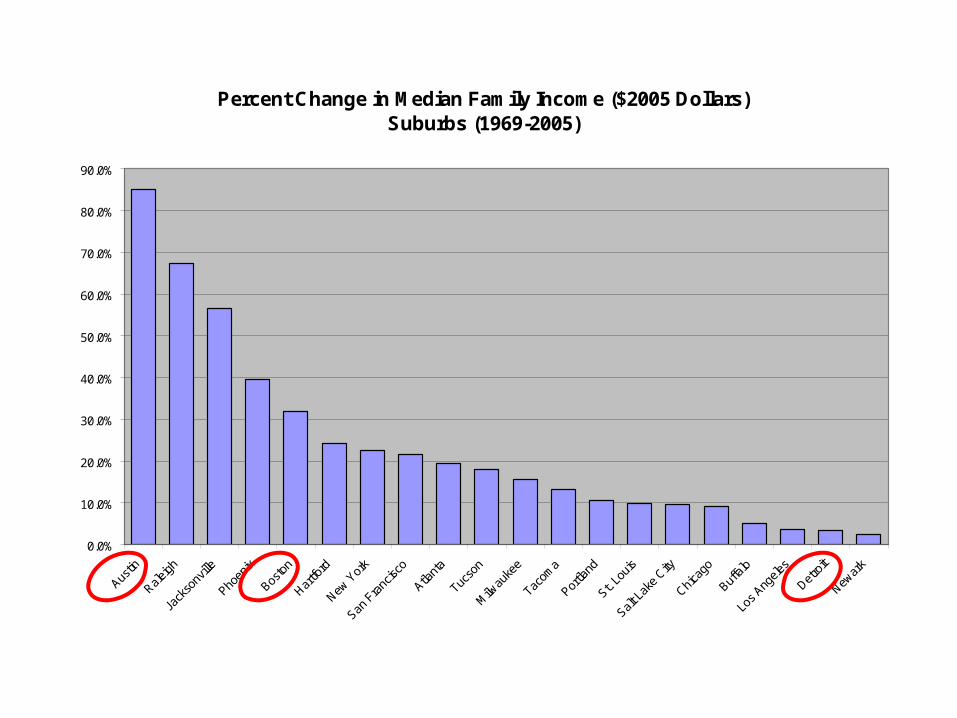
Percent Change in Median Family Income ($2005 Dollars) Suburbs (1969-2005)
0.0%
10.0%
20.0%
30.0%
40.0%
50.0%
60.0%
70.0%
80.0%
90.0%
Austin
Raleigh
Jack
sonv
ille
Phoen
ix
Bosto
n
Hartfo
rd
New Y
ork
San F
ranc
isco
Atlant
a
Tucso
n
Milw
auke
e
Tacom
a
Portla
nd
St. Lo
uis
Salt L
ake
City
Chicag
o
Buffa
lo
Los A
ngele
s
Detro
it
Newar
k

Median Family Income 1969 vs. 2005 ($2005 Dollars) Central Cities
$20,000
$30,000
$40,000
$50,000
$60,000
$70,000
$80,000
San F
ranc
isco
Raleigh
Austin
Portla
nd
Jack
sonv
ille
New Y
ork
Bosto
n
Tacom
a
Phoen
ix
Los A
ngele
s
Chicag
o
Salt L
ake
City
Atlant
a
Tucso
n
St. Lo
uis
Milw
auke
e
Newar
k
Detro
it
Buffa
lo
Hartfo
rd
1969
2005

Median Family Income 1969 vs. 2005 ($2005 Dollars) Suburbs
$30,000
$40,000
$50,000
$60,000
$70,000
$80,000
$90,000
New Y
ork
Hartfo
rd
San F
ranc
isco
Bosto
n
Milw
auke
e
Chicag
o
Austin
Detro
it
Tacom
a
Newar
k
Raleigh
Atlant
a
Jack
sonv
ille
St. Lo
uis
Buffa
lo
Los A
ngele
s
Portla
nd
Phoen
ix
Tucso
n
Salt L
ake
City
1969
2005

Metro Area Median Family Income vs. Cost of Living (4-Person Family) 2005
1.51 1.511.49
1.481.46 1.46 1.46 1.45
1.391.38
1.361.35 1.34 1.34
1.321.30
1.17
1.14 1.141.11
1.00
1.10
1.20
1.30
1.40
1.50
1.60
Hartfo
rd
Milw
auke
e
Tacom
a
Detro
it
Salt L
ake
City
Chicag
o
Austin
Raleigh
Jack
sonv
ille
Phoen
ix
St. Lo
uis
Atlant
a
Portla
nd
San F
ranc
isco
Tucso
n
Newar
k
Los A
ngele
s
Buffa
lo
Bosto
n
New Y
ork

Key Urban Issues
• Foreign Immigration
• Decentralization of Metro Areas
• Urban Flight/Interregional Migration
• Social Polarization within cities
• Land Use & Environmental Sustainability
• Transportation & Infrastructure
• Urban Education
• Crime and Neighborhood Security
• Housing Affordability
• Fiscal Condition
• Civic Engagement

Key Questions
• Who has Competitive Advantage (individuals, firms, areas)?
• Why are some cities/metro areas more successful than others in attracting industry and people?
• Saving Cities vs. Saving People
• Who has access to resources; who doesn’t; and why?
– Assets and income flows
– Political Power and Influence: Elites, Regimes, Pluralism
• Constant battle over competitive advantage: Use of market forces and political institutions to gain competitive advantage

Market Forces vs. Institutional Factors
• Market Forces vs. Institutional Factors
– Market Forces: technology, individual preferences,
– Institutional Factors: public policy (federal, state, local)
– Exit vs. voice
– Mobile vs. immobile capital
• Positive and Negative Externalities of market forces
• Intended and Unintended Consequences of Public Policy

Key Actors/Anchor Institutions
• Government Officials
• Business Leaders
• Union Leaders
• Community/Neighborhood Advocates
• University Officials
• Local Foundations