the 2018 m&a report: synergies take center stage · the boston consulting group (bcg) is a...
TRANSCRIPT

The 2018 M&A Report
Synergies Take Center Stage

The Boston Consulting Group (BCG) is a global management consulting firm and the world’s leading advisor on business strategy. We partner with clients from the private, public, and not-for-profit sectors in all regions to identify their highest-value opportunities, address their most critical challenges, and transform their enterprises. Our customized approach combines deep insight into the dynamics of companies and markets with close collaboration at all levels of the client organization. This ensures that our clients achieve sustainable competitive advantage, build more capable organizations, and secure lasting results. Founded in 1963, BCG is a private company with offices in more than 90 cities in 50 countries. For more information, please visit bcg.com.

September 2018 | The Boston Consulting Group
SYNERGIES TAKE CENTER STAGE
JENS KENGELBACH
GEORG KEIENBURG
TIMO SCHMID
DOMINIK DEGEN
SÖNKE SIEVERS
The 2018 M&A Report

2 | Synergies Take Center Stage
CONTENTS
3 EXECUTIVE SUMMARY
7 DEALMAKERS KEEP CALM AND CARRY ONAbove-Average Deal Value in Early 2018Four Major Trends
15 LOFTY VALUATIONS MOVE SYNERGIES TO CENTER STAGEBuyers Boost Synergy Estimates Synergy Potential Varies by Deal Type and SectorMarkets Reward Synergy AnnouncementsThe New Normal in Splitting Synergies: Buyers Get Less
20 ELEVATING SYNERGIES ON THE BOARD AGENDADo Estimates Pass the Plausibility Test?How Can We Achieve the Full Potential?What Should We Communicate to Investors?
25 APPENDIX I: METHODOLOGY
26 APPENDIX II: SELECTED TRANSACTIONS, 2018, 2017, AND 2016
28 FOR FURTHER READING
29 NOTE TO THE READER

The Boston Consulting Group | 3
EXECUTIVE SUMMARY
The years since 2016’s seismic political events on both sides of the Atlantic have been surprisingly ordinary for the M&A market. Despite
persistent uncertainty and a less favorable regulatory environment in the US, deal activity—in terms of both value and volume—remained fairly steady in 2017 compared with 2016. And the first half of 2018 brought abundant reasons for anxiety, as many feared that dizzying market plunges and escalating trade wars would suppress deal making. But a pullback did not materialize. Deal value in the first half of 2018 exceeded the first-half average for the period dating back to 2009. Somehow, dealmakers have not let themselves be diverted from their core pursuit.
The resilience of the M&A market is especially remarkable in the face of ever-increasing valuation multiples. Targets are, on average, more expen-sive today than they were in 1999, at the height of the dot-com bubble, or in 2008, shortly before the collapse of Lehman Brothers. Indeed, acquisi-tions are more expensive today than at any time observed in our sample of transactions dating back to 1990. Despite the frothiness, shareholders still support and motivate deal making. For five consecutive years, they have re-warded buyers with positive announcement returns—a major departure from the historical pattern. Along with steady investor support, deal mak-ing has been incentivized by a variety of other factors, including slow or-ganic growth, the need to add digital capabilities, and the availability of cheap funding. In this environment, dealmakers seeking to convince their board and shareholders that an acquisition creates value have a clear im-perative: prove that synergies justify a high valuation.
The 2018 M&A Report examines the trends that have moved synergies to center stage in deal making and how dealmakers and investors have re-sponded. Analyzing a unique data set of the 1,000 largest public-to-public deals over the past ten years, we find that the synergy estimates in deal an-nouncements have increased to a new high every year since 2013. Investors reward buyers that include synergy estimates in their announcements with higher returns around the announcement date. But their enthusiasm ap-pears to be waning. Buyers’ announcement returns in transactions with

4 | Synergies Take Center Stage
synergy estimates have decreased in recent years, an indication that inves-tors have become skeptical about companies’ ability to deliver on their in-creasingly bold promises.
Perhaps even more alarming, buyers are giving away a higher share of the total synergies in order to afford their deals. Historically, buyers have kept two-thirds of the value of expected synergies—their reward for bearing risk and shouldering responsibility for realizing the synergies after closing. In today’s seller’s market, buyers are keeping less than half of the synergy po-tential, with the remainder going to targets’ shareholders at closing.
Taken together, these trends have elevated synergies to the top of the board agenda at every company that is considering an acquisition. Board mem-bers and executives must have a clear understanding of whether the antici-pated synergies are realistic, the time frame and approach to realize them, and how to communicate them to the market.
Dealmakers have carried on through turbulent times.
• M&A activity was a bit of a mixed bag in 2017, especially com-pared with the record-setting year of 2015. Deal value was in line with 2016, but 27% below 2015’s record level. The number of megadeals (those valued at $10 billion or higher) dropped more than 50% from 2015. About 36,000 deals were announced in 2017, in line with 2016 and still above the long-term average.
• Average deal value in the first half of 2018 was higher than the first-half average for 2009 through 2017 and only slightly below the first-half figure in the record-setting year of 2015. Total deal value was $1.7 trillion, with more than 16,000 deals globally. Megadeals helped to drive the surge in first-half deal making. Corporate tax reform in the US is among the factors creating a favorable backdrop.
Various trends are shaping the M&A market.
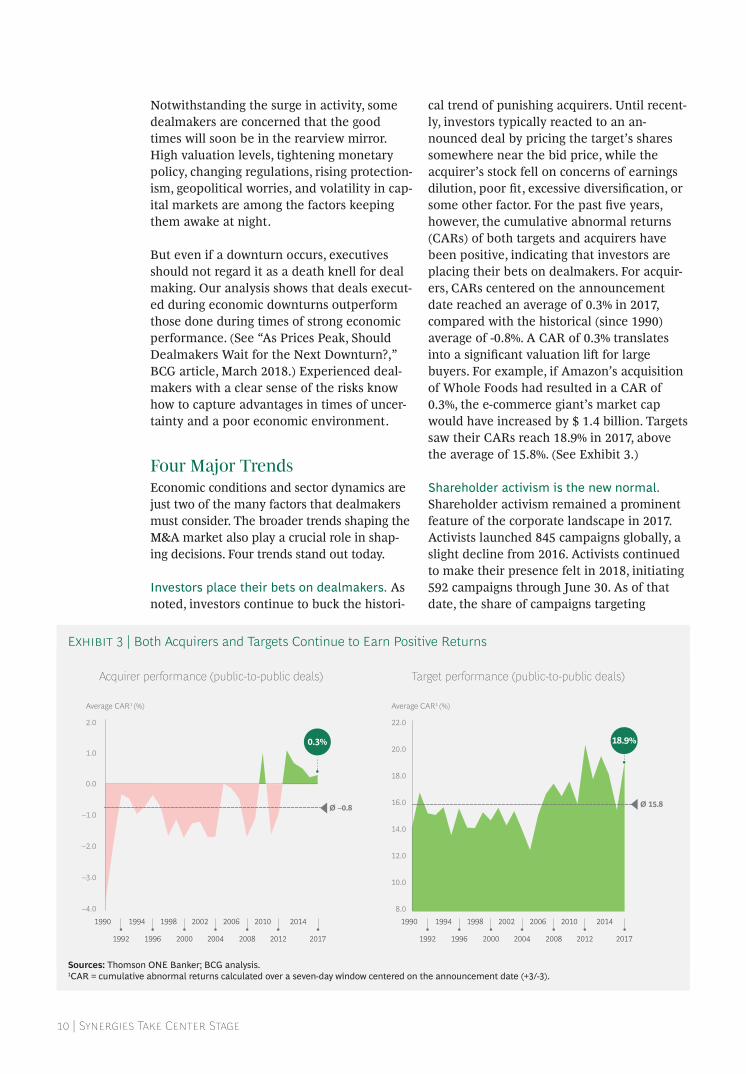
• For the past five years, the cumulative abnormal returns (CARs) of both targets and buyers have been positive, bucking the longer-term trend of investors punishing acquirers. For buyers, CARs centered on the announcement date reached 0.3% in 2017, which translates into a significant valuation lift for large companies. In contrast, the historical average since 1990 is −0.8%. Targets saw their CARs reach 18.9% in 2017, above the historical average of 15.8%.
• Shareholder activists launched 845 campaigns globally in 2017, a slight decline from 2016. Activists continued to make their pres-ence felt in 2018, initiating 592 campaigns through June 30. Moving beyond traditional topics, such as corporate governance, activist investors increasingly focus on M&A-related agendas.
• Private equity (PE) firms are struggling to find attractive targets. The value of deals made by these firms in 2017 dropped 13% from 2016’s level. Reserves of dry powder increased by 12%, continuing the streak of annual records. The number of deals involving a
The Boston Consulting Group | 5
financial sponsor increased year over year, as did their share of total deal volume. However, the average PE deal size declined by 16%.
• Acquisition multiples have risen to record highs. The median transaction multiple in 2017 was 14.2 times EBITDA. This rep-resents a 4.6% increase from 2016, which is in line with the 5% annual increase, on average, since 2009. Valuation multiples have reached unprecedented highs in most business sectors. Buyers reduced takeover premiums, on average, from 32.4% in 2016 to 24.8% in 2017. As a result, acquisition premiums are significantly below the long-term average.
Today’s record-high valuations have game-changing implications for synergies.
• Historically, synergies have augmented the case for an acquisition. In the current environment, they have moved to center stage, becoming the “make or break” element of the buy-side case.
• We analyzed a unique data set comprising the largest 100 public- to-public deals with corporate buyers from each of the past ten years. Among the full set of 1,000 transactions, roughly half included a synergy announcement.
• Synergy estimates have increased to a new high every year since 2013, exceeding the ten-year average of 1.6% of combined sales during each year. The most recent peak of 2.1% in 2017 is almost double the low of 1.1% in 2011.
• For the average deal in our sample, the 1-percentage-point in-crease in announced synergies translates into an increase in the targeted synergy run rate for pretax operating income of more than $200 million per year. Applying the ten–year average EBITDA multiple of 12, this constitutes an implied increase in the enter-prise value of more than $2.4 billion.
• Globally consolidated sectors, such as health care and high tech, have announced synergies that are above the 1.8% median for all sectors. For industries that have seen less consolidation, such as energy, announced synergies fall below the overall median. Global businesses find it easier than businesses in less consolidated industries to realize the benefits of scale by, for example, combin-ing sales or procurement activities.
• Mergers of equals or companies in industries with declining revenues typically focus on achieving cost synergies to improve profitability. In mergers of complementary businesses or compa-nies in growing markets, the focus tends to be revenue synergies.
Markets reward synergy announcements, but targets’ sharehold-ers capture much of the value.
• Buyers’ CARs are 0.1%, on average, for transactions in which synergies are announced, compared with −0.9% for those without

6 | Synergies Take Center Stage
announced synergies. However, buyers’ CARs in transactions with synergy announcements have decreased in recent years, reducing the difference between the CARs in deals with announced syner-gies and the CARs in deals without. The decline reflects investors’ increasing skepticism about companies’ ability to deliver on the higher synergies they announce.
• Buyers must cope with a new normal in synergy allocation. Over the long term, buyers have kept two-thirds of the value of expected synergies. But since 2007, they have captured, on average, only about half of the value.
Companies and their decision makers must follow a set of best practices for verifying and achieving synergies and communicat-ing with investors.
• When approving proposed acquisitions, boards and investment committees must rapidly determine if the synergy estimates are plausible. To ensure that a transaction does not destroy value, the present value of synergies (after one-off costs and taxes) must, at a minimum, be sufficient to justify the acquisition premium paid to the target’s shareholders. Decision makers should also compare expected margins (including synergies) with a benchmark, such as the margins of comparable companies.
• Companies must follow a rigorous approach to achieve the estimated synergies. To get a head start on value capture before the closing, leading companies establish a “clean team” to collect and analyze confidential information. To augment the postmerger integration process, they deploy a “full potential plan.” Leaving no stone unturned, the plan defines and quantifies the operational and top-line improvements required to achieve the estimated synergies, as well as the initiatives, costs, and timeline needed to make it happen.
• Companies should communicate synergy estimates in the deal announcement. The announcement should include details about the value and types of synergies, as well as the timing and costs. As integration proceeds, companies should give investors progress updates through a variety of channels, such as analyst calls, press releases, and quarterly or annual reports.

The Boston Consulting Group | 7
M&A activity remained healthy in 2017, despite being a bit of a mixed
bag. Deal value was in line with 2016, but fell 27% from 2015’s record level. Part of the reason was the decline in the number of megadeals (those valued at $10 billion or higher), which dropped more than 50% from 2015. Although the number of very large deals declined, the total number of deals held steady. About 36,000 deals were announced in 2017, in line with 2016 and
still above the long-term average. (See Exhibit 1.)
The mixed results may signal that uncertainty about the political environment diverted some executives’ attention from deal making. But the dampening was more like a steady drizzle than a heavy downpour. The modest pullback cannot be blamed on shareholders’ disinterest in deals. They rewarded acquirers with posi-tive returns for the fifth year in a row.
DEALMAKERS KEEP CALM AND CARRY ON
M&A activity remained strong in 2017 Deal value declined from 2015’srecord levels
2,500
10,000
7,500
5,000
1,500
1,000
500
0 0
Deal value ($billions)1 Deal value ($billions)1Number of deals
201520142013 2016 20172017201520131991 1993 1995 1997 1999 2001 2003 2005 2007 20112009
1,795
3,134
3,914
2,866 2,853
Deal volume Deal value
–27%
–0.5%
Sources: Thomson ONE Banker; BCG analysis.Note: The total of 686,709 M&A transactions comprises pending, partly completed, completed, unconditional, and withdrawn deals announced between 1990 and 2017, with no transaction-size threshold. Self-tenders, recapitalizations, exchange offers, repurchases, acquisitions of remaining interest, minority stake purchases, privatizations, and spinoffs were excluded.1Deal value includes assumed liabilities.
Exhibit 1 | Global M&A Volume and Value Held Steady in 2017

8 | Synergies Take Center Stage
Above-Average Deal Value in Early 2018Unflinching investor support, along with still-cheap funding and slow organic growth, helped push global deal making to a rapid pace in early 2018. Indeed, deal value in the first half of 2018 was higher than the first-half average for 2009 through 2017 and only slightly below the first-half figure in the record-setting year of 2015. Total deal value was $1.7 trillion, with more than 16,000 deals globally. (See Exhibit 2.)
Megadeals helped drive the surge in first-half deal making. Buyers announced 22 mega-deals, which is almost twice the historical av-erage and the highest semiannual volume since 2015. Two megadeals were announced in the US business services industry: Cigna said it would acquire Express Scripts in a transaction valued at $69.8 billion, and Black-stone, together with co-investors, revealed plans to acquire the Financial and Risk unit of Thomson Reuters for $17 billion. In the food and beverage industry, Keurig Green Mountain announced its planned takeover of Dr. Pepper Snapple in a reverse merger trans-action valued at $18.7 billion. In the telecom sector, T-Mobile US and Sprint announced their long-anticipated merger, with an im-plied deal value of $26.8 billion. In Europe’s
energy market, the German electricity com-pany E.ON said it would acquire a controlling stake in Innogy, a subsidiary of its competitor RWE. In the deal, valued at $19.3 billion, E.ON would transfer shares and parts of its renewable energy business to RWE.
Among 2018’s most notable deals was Walmart’s acquisition of the Indian e-com-merce leader Flipkart for $16 billion, beating a bid by Amazon. This deal was seen as a ma-jor win for Walmart; the retail giant en-hanced its e-commerce capabilities and achieved a greater presence in India’s emerg-ing market. The transaction exemplifies a deal rationale frequently seen in 2018: in or-der to remain competitive and ensure future growth, major players such as Walmart are pursuing acquisitions beyond their traditional core capabilities and markets.
Corporate tax reform in the US is among the factors creating a favorable backdrop for deal making. (See the sidebar “US Tax Reform Promotes Deal Making.”) Leading companies, including Apple and Microsoft, have already started to repatriate offshore cash to the US, as mandated by the new law. Because M&A activity is among the top uses for repatriated cash, deal making will likely receive a boost, at least to some degree.
8387081,097
839865
1,612 1,7491,341 1,305
1,721
20,000
15,000
10,000
5,000
0
2,500
2,000
1,500
Ø 1,208
1,000
500
0
Deal value ($billions)1 Number of deals
H12009
H12010
H12011
H12012
H12013
H12014
H12015
H12016
H12017
H12018
12,914
14,66615,671
14,126 13,693
14,866
16,37217,218
18,309
16,189
Sources: Thomson ONE Banker; BCG analysis. Note: The total of 154,024 M&A transactions comprises pending, partly completed, completed, unconditional, and withdrawn deals announced between 2009 and June 30, 2018, with no transaction-size threshold. Self-tenders, recapitalizations, exchange offers, repurchases, acquisitions of remaining interest, minority stake purchases, privatizations, and spinoffs were excluded.1Deal value includes assumed liabilities.
Exhibit 2 | Activity in the First Half of 2018 Was Above the Long-Term Average

The Boston Consulting Group | 9
US tax reform, enacted in December 2017 with the 2017 Tax Cuts and Jobs Act, incentivizes new investment patterns that have major implications for deal making globally. (See “The Impact of US Tax Reform on Corporate Strategy and M&A,” BCG article, February 2018.) The most significant provisions of the new law are a reduction in the corporate tax rate from 35% to 21%; mandatory repatriation of offshore cash, with a one-time tax of 15.5%; immediate expensing of investment in tangible business property; and new lim-its on interest deductibility of 30% of EBITDA.
There are five key strategic implications for business leaders:
• Higher earnings power will make year-end 2017 market valuations appear more in line with historical norms. For the S&P 500, the decline in effective tax rates (from approximately 27% to somewhere in the range of 15% to 18%) will bring an increase in earnings per share on the order of 12% to 16%.
• Lower taxes will increase the number of noncore asset sales—either direct sales or two-part transactions in which buyers acquire portfolios and then sell the assets they don’t want. At the old 35% rate, taxes forced companies to either live with their noncore assets or devise complex deal structures to avoid a big hit. Under the new 21% rate, after-tax proceeds from asset sales will increase by up to 22%, depending on the asset’s tax basis. With this change, deals can be assessed with greater emphasis on their business and financial merits and less concern for the tax bite.
• Increased corporate earnings power and quality, as well as liquidity, will help to stimulate investments and M&A. We expect that a significant increase in corporate liquidity—up to $4 trillion
cash—will be unlocked through repatri-ated offshore cash and higher corporate earnings.
• Immediate expensing will have a positive impact on M&A in asset-heavy industries. The new law allows compa-nies to expense the full purchase price of tangible assets in the year of pur-chase. For companies in asset-heavy industries, the value of immediate expensing could be up to 3% of the purchase price. This means buyers that are looking for a particular asset or business can much more efficiently acquire an entire company and sell off the pieces they don’t want.
• Because the tax cuts are not perma-nent, debate over the longevity of the new tax levels will inject new uncertain-ty into deal making. Asset values and capital allocation decisions are both affected by the prospective number of years that the law’s key provisions remain in effect. An assessment of the risk that the US will reinstate a less permissive tax regime should be a key component of corporate planning.
Taken together, the implications of tax reform point to the potential for a new wave of acquisitions and divestitures by US companies. Outbound M&A will increase as these companies put their repatriated cash to work, while lower taxes on the proceeds of asset sales make it more attractive to sell nonstrategic assets.
US TAX REFORM PROMOTES DEAL MAKING
10 | Synergies Take Center Stage
Notwithstanding the surge in activity, some dealmakers are concerned that the good times will soon be in the rearview mirror. High valuation levels, tightening monetary policy, changing regulations, rising protection-ism, geopolitical worries, and volatility in cap-ital markets are among the factors keeping them awake at night.
But even if a downturn occurs, executives should not regard it as a death knell for deal making. Our analysis shows that deals execut-ed during economic downturns outperform those done during times of strong economic performance. (See “As Prices Peak, Should Dealmakers Wait for the Next Downturn?,” BCG article, March 2018.) Experienced deal-makers with a clear sense of the risks know how to capture advantages in times of uncer-tainty and a poor economic environment.
Four Major TrendsEconomic conditions and sector dynamics are just two of the many factors that dealmakers must consider. The broader trends shaping the M&A market also play a crucial role in shap-ing decisions. Four trends stand out today.
Investors place their bets on dealmakers. As noted, investors continue to buck the histori-
cal trend of punishing acquirers. Until recent-ly, investors typically reacted to an an-nounced deal by pricing the target’s shares somewhere near the bid price, while the acquirer’s stock fell on concerns of earnings dilution, poor fit, excessive diversification, or some other factor. For the past five years, however, the cumulative abnormal returns (CARs) of both targets and acquirers have been positive, indicating that investors are placing their bets on dealmakers. For acquir-ers, CARs centered on the announcement date reached an average of 0.3% in 2017, compared with the historical (since 1990) average of -0.8%. A CAR of 0.3% translates into a significant valuation lift for large buyers. For example, if Amazon’s acquisition of Whole Foods had resulted in a CAR of 0.3%, the e-commerce giant’s market cap would have increased by $ 1.4 billion. Targets saw their CARs reach 18.9% in 2017, above the average of 15.8%. (See Exhibit 3.)
Shareholder activism is the new normal. Shareholder activism remained a prominent feature of the corporate landscape in 2017. Activists launched 845 campaigns globally, a slight decline from 2016. Activists continued to make their presence felt in 2018, initiating 592 campaigns through June 30. As of that date, the share of campaigns targeting
Acquirer performance (public-to-public deals) Target performance (public-to-public deals)
Average CAR1 (%) Average CAR1 (%)
2.0
1.0
0.0
–1.0
–2.0
–3.0
–4.0
22.0
20.0
18.0
16.0
14.0
12.0
8.0
10.0
1990 1994 1998 2002 2006 2010 2014
2017201220082004200019961992
1990 1994 1998 2002 2006 2010 2014
Ø 15.8Ø –0.8
2017201220082004200019961992
0.3% 18.9%
Sources: Thomson ONE Banker; BCG analysis.1CAR = cumulative abnormal returns calculated over a seven-day window centered on the announcement date (+3/-3).
Exhibit 3 | Both Acquirers and Targets Continue to Earn Positive Returns

The Boston Consulting Group | 11
large-cap companies (those with more than $10 billion in market cap) rose to 28%, a significant increase over the five-year average of approximately 20%. Even activist investors that take small stakes in large companies are making their voices heard.
Activist investments at European and Asian large-cap companies increased significantly in the first half of 2018. New activist investments in these regions accounted for 39% of the glob-al total, up from 22% in 2017. (See Exhibit 4.)
Along with the shift in regional focus, we also detect changes in the activist agenda. Moving beyond traditional topics, such as corporate governance, approximately one in six activist campaigns focuses on M&A-related agendas. The increased attention to M&A agendas is most evident in Europe, coinciding with the uptick in activist campaigns.
For example, Elliott Management, one of the busiest activist investors, successfully pushed for higher offers from acquirers during the takeovers of NXP Semiconductors and STADA Arzneimittel. In other instances, activists’ de-mands included divestments (such as Third Point Partners’ demand for significant divest-ments by Nestlé) or dividing a company into
smaller parts (such as RBR Capital’s cam-paign to break up Credit Suisse and Elliott’s similar efforts at Thyssenkrupp).
Private equity struggles to find attractive targets. The value of deals made by private equity (PE) firms in 2017 dropped 13% from 2016’s level. Reserves of dry powder in-creased by 12%, continuing the streak of annual records. (See Exhibit 5.)
Yet even as the value of PE deals declined in 2017, the number of deals (approximately 5,800) increased year over year, as did their share of total deal volume (16%). As a result, the average size of deals involving a PE firm fell by 16% compared with 2016. In the US, the share of the total PE volume represented by mid-cap deals (transaction value of $100 mil-lion to $1 billion) increased from 48% in 2016 to 62% 2017. In Europe, mid-cap deal volume as a share of total PE volume also grew signifi-cantly, continuing a strong upward trend. PE firms increasingly find themselves competing for attractive targets with other buyers, such as cash-rich corporate acquirers. In order to find attractive targets, PE firms seem to have lowered their target transaction size. They also increasingly engage in add-on acquisi-tions to their existing portfolio companies.
Activism is on the rise globally
Number of companies publicly subjectto activist demands
Activists increasingly target European andAsian companies
Share of total new activist investmentsin large-cap firms (%)1
1,000
800
600
400
200
2013 2014 2015 2016 2017 H12018
2013 2014 2015 2016 2017 H12018
0
25
20
15
10
5
0
598 628
768
877 845
592 15
2
11
4
1718 18
25
14
4
2
9
Europe Asia
+9.0%
Sources: Activist Insight; BCG analysis.1Large cap refers to companies with market cap above $10 billion.
Exhibit 4 | Shareholder Activism is a Global Phenomenon

12 | Synergies Take Center Stage
Transaction multiples keep rising. Steady investor support and PE firms’ high reserves of dry powder are factors that would normal-ly foster M&A deals. So why did deal values decline slightly in 2017? An imbalance between supply and demand appears to be the most likely reason. Appealing large-scale targets have become scarce, and acquisition multiples have risen to record highs. The median transaction multiple in 2017 was 14.2 times EBITDA. This represents a 4.6% in-crease from 2016, in line with the 5% annual increase, on average, since 2009. At the same time, acquirers reduced takeover premiums, on average, from 32.4% in 2016 to 24.8% in 2017. As a result, acquisition premiums are significantly below the long-term average of 32.7%. (See Exhibit 6.)
The trend of rising valuation multiples in M&A transactions was broad-based across in-dustries in 2017; historic highs were reached in many business sectors. (See Exhibit 7.) In the telecom sector, for example, the median EV/EBITDA multiple for acquisitions exceed-ed the historical median by 68%. Financial in-stitutions are bucking the trend. These com-panies face downward pressure on valuations
as they cope with ongoing fallout from the fi-nancial crisis, low interest rates, and competi-tive pressure from new players, such as fin-techs.
The high transaction multiples coincide with a strong bull market for equities. Even when considering the cyclically adjusted Shiller P/E ratio, valuation levels in the US and Europe increased above their respective averages. In US equity markets, the Shiller P/E ratio ex-ceeded the average from 2014 through 2017. European equity markets are catching up. In 2017, the Shiller P/E ratio outpaced the histor-ical average by a larger margin than in the preceding three years. (See Exhibit 8.)
With valuations rising to new heights, buyers must find ways to justify paying inflated pric-es for targets. Capturing more value from syn-ergies is chief among the ways to accomplish this. In the next chapter, we explore this im-perative.
4,000
2,000
0
6,000
Deal value decreased in 20171... ...and dry powder continued to rise2
Deal value ($billions) Dry powder ($billions)Number of deals
1,000
800
600
400
200
0
800
600
400
200
0
1997
1999
2001
2003
2005
2007
2009
2011
2013
2015
20172001 2003 2005 2007 2009 2011 2013 2015 2017
Number of deals Value of deals
–13%
+12%
Sources: Thomson ONE Banker; Preqin; BCG analysis.1The total of 70,689 private equity transactions comprises completed and unconditional deals announced between 1997 and 2017 involving private equity sponsors with at least 75% of shares acquired or divested. Self-tenders, recapitalizations, exchange offers, repurchases, acquisitions of remaining interest, minority stake purchases, privatizations, and spinoffs were excluded.2Buyout funds only.
Exhibit 5 | Lower Deal Value Drove Private Equity Dry Powder to a Record High

The Boston Consulting Group | 13
20172010200520001990 1995 20172010200520001990 1995
Ø 12.0Ø 32.7
Valuation levels increased in 2017… …while premiums plunged to a below-average level
Median EV/EBITDA acquisition multiple (x) Average one-week deal premium (%)1
15.0
12.5
10.0
7.5
5.0
50
40
30
20
10
0
Sources: Thomson ONE Banker; BCG analysis.Note: The total of 18,493 M&A transactions comprises completed, unconditional, and pending deals announced between 1990 and 2017 with transactions of at least $25 million and at least a 75% share transfer. Self-tenders, recapitalizations, exchange offers, repurchases, acquisitions of remaining interest, minority stake purchases, privatizations, and spinoffs were excluded. Only deals with a disclosed value were considered.1The acquisition premium is the amount by which the target’s offer price exceeds its closing stock price one week before the original announcement date; the top 2.5% of deals were excluded to reduce distortion by outliers.
Exhibit 6 | Valuation Levels Rose to an All-Time High
Median EV/EBITDA acquisition multiple (x)
20
15
10
5
0
Consumer goodsand services
Industrial andmaterials
Health care High tech Energy Media andentertainment
Telecom
+22%+37%
+26%+27%
+31%
+37%
+68%
Median EV/EBITDA acquisition multiple (last 20 years) Median EV/EBITDA acquisition multiple 2017
Sources: Thomson ONE Banker; BCG analysis.Note: The total of 15,586 M&A transactions comprises completed, unconditional, and pending deals announced between 1998 and 2017 with transactions of at least $25 million and at least a 75% share transfer. Self-tenders, recapitalizations, exchange offers, repurchases, acquisitions of remaining interest, minority stake purchases, privatizations, and spinoffs were excluded. Only deals with a disclosed value were considered.
Exhibit 7 | Valuation Levels Exceed the Historical Average Across Industries

14 | Synergies Take Center Stage
Shiller P/E ratio1
United States Europe
30
20
10
0
30
20
10
02008
2009
2010
2011
2012
2013
2014
2015
2016
2017
2008
2009
2010
2011
2012
2013
2014
2015
2016
2017
Average:22.3
Average:16.6
Sources: Robert Shiller/Barclays; BCG analysis.1P/E ratio = price-to-earnings ratio.
Exhibit 8 | Even Cyclically Adjusted Valuation Levels Increased Above the Average

The Boston Consulting Group | 15
Today’s record-high valuations have game-changing implications for the
importance of synergies. Synergies have always served to augment the case for an acquisition. In the current environment, they move to center stage, becoming the “make or break” element of the buy-side case. For every deal, it is essential to understand the different types of synergies, as well as the costs and the timeframe to achieve them. (See the sidebar “The Basics of Synergies.”)
Sellers are capturing a growing share of the value attributable to synergies.
However, as buyers seek to convince their board and shareholders of the potential to extract more value from synergies, they face a variety of challenges. Although specifying synergy estimates at the time a deal is an-nounced has a positive impact on share prices, the impact has diminished in recent years. Additionally, shareholders on the selling side are capturing a growing share of the value at-tributable to the synergies estimated near the announcement date. A review of these chal-lenges sheds light on the scope of the prob-lems that dealmakers face and points to a multifaceted solution.
Buyers Boost Synergy EstimatesTo determine if buyers are pursuing higher value from synergies, we collected a unique data set of the largest 100 public-to-public deals with corporate buyers for each of the past ten years. Within the full set of 1,000 transactions, roughly half of the deals includ-ed a synergy announcement. We found that the announced synergy estimates increased to a new high every year since 2013, exceed-ing the ten-year average of 1.6% of combined sales for each year. The most recent peak (2.1% in 2017) is almost twice the level an-nounced in 2011 (1.1%). For the average deal in our sample, the 1-percentage-point in-crease in announced synergies translates into an increase in the targeted synergy run rate for pretax operating income of more than $200 million per year. (See Exhibit 9.) Apply-ing the ten-year average EBITDA multiple of 12, this constitutes an implied increase in the enterprise value of more than $2.4 billion.
Synergy Potential Varies by Deal Type and SectorDuring the ten-year period studied, we ob-served significant differences among sectors. Globally consolidated sectors, such as finan-cial services, insurance, and real estate (FIRE), health care, high tech, and media and entertainment, have announced synergies above the 1.8% median for all sectors. For in-dustries that have seen less consolidation,
LOFTY VALUATIONS MOVE SYNERGIES
TO CENTER STAGE

16 | Synergies Take Center Stage
Synergies are the sources of improvement in earnings or cash flows (calculated as an annual run rate) that occurs when two businesses merge. By calculating the present value of the annual benefits and taking into account the expected time and cost to achieve them, companies can assess the potential for value creation above the simple sum of the parts.
Companies can achieve recurring revenue and cost synergies, as well as balance sheet synergies. (See the exhibit.)
Buyers can typically take concrete steps to capture cost and balance sheet synergies. But realizing revenue synergies is more complicated, and thus less certain, because a company must convince customers to continue doing business—or even expand their relationship—after the merger.
The timeframe for achieving synergies depends on many factors. Revenue synergies usually take longer to ramp up, while cost synergies can typically be
realized relatively quickly. For global businesses, the complexity of integrating operations in multiple regions increases the time required to achieve synergies. Delays in decisions and activities that other initiatives depend on, such as strategic decisions about the headquarters location or rebranding, can lengthen the timeline. Progress can also be impeded if companies have pre-existing commitments to work councils about headcount levels. For the mergers covered in our data set, 70% of buyers estimated that they needed two to three years to achieve the full run rate of synergies. The average was 2.8 years.
The costs to achieve the full run rate of synergies are referred to as one-off costs or integration costs. These include both operating expenses and capex. For the mergers in our data set, estimated integra-tion costs, on average, amounted to one full run rate of synergies. However, the integration costs for a specific merger depend strongly on the type of deal.
THE BASICS OF SYNERGIES
Description Recurring synergies from incremental increases in revenues compared with standalone companies
Importancein deal
decision
Usually regarded as add-on tocost synergies
Low High Low High Low High
Synergybreakdown
Ability to controlachievement
Fast Slow Fast Slow Fast SlowTime to achieve
Costs to achieve
• Cross-selling• Pricing• Additional distribution• Innovation• Other (for example, brand recognition benefits)
Central argument in manytransactions
Typically only a minor role; highimportance in specific sectors,such as financial institutions
Recurring synergies from realized cost savings across corporate functions
Primarily capex and working capital reductions Tax benefits are in addition to balance sheet synergies
• Low for rollout of products on existing platforms• Dissynergies possible (due to overlapping products or services)
• One full run rate of synergies, on average• Includes contract termination costs
• Renegotiation of financing terms can incur costs• Tax optimization might require cost for external advice
• General and administrative costs• Procurement and cost of goods sold• Sales and marketing costs• Research and development costs• Other operating costs
• Inventory reductions• Financing terms• Better capital allocation• Elimination of duplicate capex• Tax optimization
Revenue synergies
Cost synergies
Balance sheetsynergies
Source: BCG analysis.
Three Categories of Synergies

The Boston Consulting Group | 17
such as energy and consumer goods and ser-vices, announced synergies fall below the overall median. (See Exhibit 10.) This finding reflects the fact that globally consolidated businesses are able to realize benefits of scale through, for example, creating shared-service centers and combining sales or procurement activities. In contrast, less consolidated indus-tries often operate regional hubs that offer fewer opportunities to increase scale.
Meredith Corp.’s acquisition of Time Inc., an-nounced in 2017, exemplifies the synergy po-tential of deals in the media industry. The combined company has sales of approximate-ly $4.6 billion. It expects to realize $200 mil-lion to $250 million of pretax cost synergies within two years of deal closing. Most of the savings would come from cutting duplicative expenses related to overlapping corporate structures (such as sales organizations) and their obligations as listed companies (such as reporting and meeting requirements). Addi-tionally, the companies expected to generate new revenue opportunities by distributing Time’s content through Meredith’s publishing platforms and television network.
In contrast, Royal Dutch Shell’s acquisition of BG Group, announced in 2015, illustrates why energy deals struggle to create synergies. Although the combined company has more than $300 billion in annual revenues, the initial synergy expectations amounted to only
$2.5 billion. Because the companies’ exploration portfolios overlapped to only a small extent, the synergy potential was limited to modest reductions in overhead costs and exploration expenses. Such limited synergy potential often occurs in mergers involving companies with location-specific infrastructure and services. These companies have few opportunities to relocate or shut down operations after a merger. Opportunities for revenue synergy are also limited in such deals.
The dominant type of synergy in a particular deal also depends heavily on the type of ac-quisition and the deal rationale. At one end of the spectrum are mergers of equals that have significant overlaps in business lines, product assortment, and regions served. In such deals, companies typically focus on achieving cost synergies to improve profitabil-ity. The overlaps provide various opportuni-ties to capture high cost synergies. Similar benefits generally exist in transactions aimed at mitigating the impact of declining reve-nues. Cost reduction through merger is one of the most important ways to counteract reve-nue decline and promote future profitability and growth. For mergers of companies in a growing market, or for acquisitions involving complementary businesses, the focus shifts to revenue synergies. However, even in these deals, cost synergies still play a crucial role and are often the main rationale.
Buyers have increased their synergy estimates … ...resulting in significant upside
Announced synergies (% of combined sales) Run-rate equivalent for average transaction ($millions)
3
2
1
0
600
500
400
300
200
100
02008 2009 2010 2011 2012 2013 2014 2015 2016 2017 2008 2009 2010 2011 2012 2013 2014 2015 2016 2017
1.6
1.2 1.1 1.1 1.2
1.5
1.9 1.9 2.02.1
Ø 1.6%
+91% +226
Sources: Thomson ONE Banker; company press releases; BCG analysis.Note: Analysis based on 1,000 public-to-public M&A transactions from 2008 through 2017 with a majority stake acquired by a non-financial buyer.
Exhibit 9 | Rising Synergy Estimates Generate Value for Transactions

18 | Synergies Take Center Stage
Markets Reward Synergy AnnouncementsMarkets generally welcome the announce-ment of synergies. Buyers’ CARs are 0.1%, on average, for transactions in which synergies are announced, compared with −0.9% for those without announced synergies. (See Ex-hibit 11.) A clear communication of synergies appears to be critical in preserving value and reducing share price volatility when a trans-action is announced. This is in line with BCG’s previous findings on the importance of synergy announcements. (See “The Real Deal on M&A, Synergies, and Value,” BCG article, November 2016.)
A clear communication of synergies appears to be critical in preserving value.
However, buyers’ CARs in transactions with synergy announcements have decreased in re-cent years, reducing the difference between the CARs in deals with announced synergies and the CARs in deals without. The difference fell from 2.9% in 2013 to −0.3% in 2016 and then rebounded to 1.5% in 2017. The decline since 2014 appears to reflect investors’ increas-ing skepticism about companies’ ability to de-liver on the higher synergies they announce.
The New Normal in Splitting Synergies: Buyers Get LessOver the long term, buyers have kept two-thirds of the value of expected synergies (See “How Successful M&A Deals Split the Syner-gies,” BCG article, March 2013). Their higher share of synergies compensated them for their responsibility to deliver the synergies after closing and for the associated risk. How-ever, since 2007, the shareholders of target companies have captured, on average, 54% of the value of synergies, thanks to share price increases near the announcement date—be-fore efforts to achieve the synergies even be-gin. (See Exhibit 12.) From 2008 through 2010, during and immediately after the finan-cial crisis, the value captured by targets fell below the ten-year average. Since then, tar-gets have generally captured value above the ten-year average. In a market characterized by a scarcity of acquisition opportunities, tar-gets’ shareholders appear to be demanding a larger piece of the synergy pie.
Taken together, the findings discussed in this chapter make clear that it is more important than ever for buyers to extract maximum val-ue from synergies. In the next chapter, we dis-cuss best practices for ensuring the accuracy of synergy estimates and communicating and capturing the value.
Median announced synergies/combined sales, 2008-2017 (%)
4
3
2
1
0
Median 1.83.0
2.5 2.3 1.9 1.7 1.4 1.1 1.1
Consumer goodsand services
Industrial andmaterials
Health careHigh tech EnergyFIRE1 TelecomMedia andentertainment
Sources: Thomson ONE Banker; company press releases; BCG analysis.Note: Analysis based on 1,000 public-to-public M&A transactions from 2008 through 2017 with a majority stake acquired by a non-financial buyer.1FIRE = financial services, insurance, and real estate.
Exhibit 10 | Globally Consolidated Sectors Announce Higher Synergies

The Boston Consulting Group | 19
Announcing synergies generates higher CAR, on average
Announcedsynergies
Did not announcesynergies
But outperformance has declined
Acquirer CARs (%)1 Difference in CARs (%)1
0.5
0.0
–0.5
–1.0
3
2
1
0
–1
–2
0.1
–0.9
–1.3
−0.9
–1.1
0.5
1.91.8
2.9 2.8
1.0
–0.3
1.5
2008 2009 2010 2011 2012 2013 2014 2015 2016 2017
+1.0pp2 **
Sources: Thomson ONE Banker; company press releases; BCG analysis.Note: Analysis based on 1,000 public-to-public M&A transactions between 2008 and 2017 with a majority stake acquired by a non-financial buyer; return data was available for 892 transactions. Statistically significant CAR differences were expressed as: * significant at p<0.1, ** significant at p<0.05, and *** significant at p<0.01.1CARs = cumulative abnormal returns 2pp = percentage points.
Exhibit 11 | Investors Show Greater Skepticism About Announced Synergies
0
20
40
60
80
100
Median value of synergies captured by target shareholders and buyer (%)
Ø 54
2014 2015 2016 2017201320122011201020092008
66 64
34 3644
67 67 62 6454
65
44
56
33 35
57
34 38 3646
Captured by buyer Captured by target shareholders
Sources: Thomson ONE Banker; company press releases; BCG analysis.Note: Analysis based on 1,000 public-to-public M&A transactions between 2008 and 2017 with a majority stake acquired by a non-financial buyer.
Exhibit 12 | Buyers Are Losing Ground in the Battle for Synergies

20 | Synergies Take Center Stage
ELEVATING SYNERGIES ON THE BOARD AGENDA
Like investors, buyers’ internal decision makers—including the manage-
ment team, the board, and the investment committee—should be wary of high synergy estimates and scrutinize them. Moreover, because they are giving more synergy value to targets today, buyers must redouble their efforts to realize synergies and assure the market that the promised value is achievable.
Given the importance of synergies in support-ing the economics of an acquisition, decision makers must be able to quickly determine whether the proposed estimates are in fact realistic and achievable. At the same time, they must be prepared to communicate the synergies to capital markets effectively, so that investors understand the upside and re-ward the company for it.
Do Estimates Pass the Plausibility Test?Boards and investment committees bear the ultimate responsibility for assessing the plausibility of the synergy estimates made by their management or M&A teams. Because acquirers often face a competitive auction process, these teams usually lack the opportunity to discuss synergy estimates and the pathway to realizing them with the target’s management. As a result, they typically rely on their own outside-in due diligence analysis.
To test plausibility, the analysis must answer two key questions:
• Is the present value of synergies sufficient to justify the acquisition premium?
• Do estimated synergies and the future operating model support profit expectations?
Meeting the transaction hurdle. To ensure that the transaction does not destroy value, the present value of synergies (after one-off costs and taxes) must, at a minimum, be sufficient to justify the acquisition premium paid to the target’s shareholders. If the buyer’s value creation opportunity arising from synergies does not exceed the premium, the synergies fall short of meeting this transaction hurdle. In such cases, investment committees should be wary of arguments that support the acquisition. On the positive side, however, this plausibility test can confirm the existence of synergies that validate a significant acquisition premium.
Alaska Air Group’s 2016 acquisition of its competitor Virgin America illustrates how synergies can justify a high acquisition premi-um. In announcing the all-cash deal at $57 per share, Alaska Air implicitly offered Virgin America’s shareholders a premium of roughly 50% over the pre-announcement closing price. This premium was economically significant,

The Boston Consulting Group | 21
exceeding the historical average of 33% for all deals in our long-term sample, and translated into approximately $900 million of additional value for Virgin America’s shareholders.
To avoid destroying value for its own share-holders, Alaska Air needed synergies that would increase its annual operating income by $90 million (1.4% of combined sales). This estimate assumes that the company’s weight-ed average cost of capital is 9% (which trans-lates into a valuation multiple of 11 times op-erating income) and accounts for the typical one-off integration costs of one full run rate of synergies. Applying a multiple of 10x (the 11x valuation multiple minus 1x for one-off costs), $90 million in synergies would gener-ate the $900 million premium.
Planning for the achievement of synergies is an essential element of due diligence.
In its deal announcement, Alaska Air estimat-ed synergies of $225 million annually (3.1% of combined sales), with one-off integration costs of $300 million to $350 million. The to-tal value of synergies would equal $2.25 bil-lion, applying the multiple of 10x. As a result, the $900 million implicitly transferred to Vir-gin America’s shareholders through the pre-mium represents 40% of the total value of synergies, and Alaska Air’s shareholders would receive 60% of the value added. The companies would achieve the lion’s share of these synergies through the higher revenues that result from combining their flight net-works. Alaska Air’s internal analysis, present-ed to investors, found that its synergy esti-mate was in line with synergies announced in recent mergers of US airlines.
Assessing implied future profit expectations. To be valid, a synergy estimate must consider the future operating model of the target company. Inexperienced dealmakers often double count the upside arising from synergies and operational improvements at the standalone target and disregard the interaction between synergies and operational
improvements. To verify that double counting has not occurred, the buyer can validate synergy estimates by comparing the target’s expected margins (including the standalone profitability and synergies) or those of the combined company with a benchmark, such as margins of comparable companies. If the synergy estimates lead to margins that far exceed those of the peer group, it is a sign that the estimates might be unrealistic. The deal’s economics may still be rescued if the combined company can pursue a sustainable new business model, but this is rarely possible.
Alaska Air’s acquisition of Virgin America also illustrates this plausibility check. In the year preceding the deal, Virgin America had a 13% margin (pretax profit of $200 million on annual revenues of $1.5 billion). This was substantially below Alaska Air’s margin of 24% (profit of $1.3 billion and revenues of $5.6 billion), which was one of the best mar-gins among North American airlines. The es-timated full synergy run rate of $225 million implied that the combined company’s margin would match Alaska Air’s pre-deal profitabili-ty of 24%. Despite Virgin America’s lower pre-deal margin, the synergies would ensure that the combined company’s margin stayed at the best-in-class level previously achieved by Alaska Air. Given that Alaska Air would apply its best practices and efficiency mea-sures to Virgin America, the board apparently considered this implicit uplift in the target’s margins to be plausible.
How Can We Achieve the Full Potential?A buyer’s board and management must also ensure that mechanisms are in place to real-ize the value of synergies. Planning for the achievement of synergies is an essential ele-ment of due diligence, so that the buyer’s fi-nal bid accurately accounts for the value cre-ation potential and the integration process can start the day after closing.
Two approaches are essential in order to hit the ground running: Establishing a “clean team” enables companies to get a head start on exchanging and analyzing information. And developing a “full potential plan” allows

22 | Synergies Take Center Stage
companies to accelerate the postmerger integration.
Clean Teams. Merging companies are gener-ally prohibited from sharing internal informa-tion or collaborating before the close. The time period between signing and closing the deal can often be quite long, especially for large transactions or cross-border deals involving companies in the same industry. Regulators and antitrust agencies use this time to complete reviews and investigate the competitive implications of the transaction. For the transactions we studied, the closings occurred, on average, within one year of the deal announcements. However, for approxi-mately 10% of the transactions, the period between announcement and closing exceed-ed one year. The parties needed the extra time to complete required asset disposals or meet other conditions imposed by regulators.
The work of a “clean team” can accelerate planning and jump-start an integration.
Although the merging companies’ hands are tied to a great extent while they await the closing, they can create substantial value by setting up a “clean team” composed of third-party personnel. The clean team serves as an intermediary between the merging companies’ integration teams. It reports to a project management team comprising the project leaders from each company and to a steering committee comprising board mem-bers and legal teams from each company.
The clean team’s mandate is to accelerate planning and jump-start the integration, in-cluding the capture of synergies. To accom-plish this, it collects and analyzes sensitive data from both companies and shares sani-tized, aggregated interim results with the project management team and the steering committee. Even though clean teams must not share their full analyses with manage-ment until the deal closes, these efforts lay the groundwork for an early start on captur-ing synergies.
Full Potential Plan. After authorities give final approval and the deal closes, the buyer can formally begin the integration. In a previous report, BCG presented a set of essential practices that help achieve the estimated synergies after a transaction closes. (See “Six Essentials for Achieving Postmerger Synergies,” BCG Focus, March 2017.)
To augment these best practices, the savviest corporate acquirers deploy a full potential plan (often referred to as an FPP), an ap-proach also used by many PE firms to maxi-mize the value of their portfolio companies. Leaving no stone unturned, the plan defines and quantifies the operational and top-line improvements required to achieve the expect-ed synergies, as well as the initiatives, costs, and timeline for making it happen.
To develop the plan, a joint task force com-posed of members of the companies’ man-agement teams and their advisors identifies the full potential improvement for a set of KPIs—including revenues and operating prof-it, and the implementation costs—over the next three to five years. To lay the ground-work, the task force typically performs an ini-tial assessment, which usually takes three to four months and includes a standardized re-view of up to 35 specific value levers in three main categories: revenues, costs, and capital management and allocation.
Once the task force completes its assessment of the value potential of the levers, the man-agement team and board of each company jointly decide on the most promising levers and develop the roadmap for achieving the full potential. The roadmap should specify the required resources, set clear responsibilities, and establish an incentive scheme for man-agement that is linked to the plan’s targets.
What Should We Communicate to Investors?Merging companies should keep investors in-formed about their synergy estimates and their efforts to realize the value. On the basis of observations of corporate transactions and a review of case studies, we have identified the following best practices. Two recent mergers illustrate these best practices and

The Boston Consulting Group | 23
how they create value. (See the sidebar “Syn-ergy Communication in Action.”)
• Communicate the estimated synergies in the deal announcement. As noted in the previous chapter, discussing synergies in the announcement preserves market value by reducing uncertainty about the transaction. Failure to clarify potential synergies usually hurts the buyer’s share price around the time of the announce-ment. A negative appraisal of the transac-
tion by investors and equity analysts can only be reversed over time, if the syner-gies are eventually announced or become apparent.
• Give investors a comprehensive ac-counting of the synergies. Include a breakdown of the synergies by type, offer examples of each, and specify which business unit, function, or executive is responsible for achieving them. Estimate the integration costs and the timeframe to
DowDuPont and Alaska Air Group each stand out for applying best practices in communicating synergies.
DowDuPont. Dow Chemical and DuPont provided details about synergies in a press release accompanying their 2015 merger announcement and in a follow-up call with investors. They estimated run-rate syner-gies of approximately $3 billion for costs and approximately $1 billion for revenues. The realization of the full run rate was expected within 24 months after the closing date.
During the integration process, DowDuPont continued to communicate about syner-gies, following up through various channels. For example, during investor calls, it confirmed the targets and timing for synergies and gave details on how it expect-ed to realize them. The updates included a breakdown of how expected cost synergies were allocated across the new company’s three divisions. The company also explicitly described several of the initiatives taken to achieve synergies. In addition, it provided examples of the new products that would contribute to reaching the targets for revenue synergies.
The company’s 2017 annual report includ-ed information on both the size and the timing of the one-off costs of integration. It also gave examples of what the costs were attributable to, including implementation of restructuring plans, demolition of closed
facilities, and employee-related expenses.
Most important, DowDuPont delivered on the promised synergies. In February 2018, the company confirmed that it had achieved its first synergy target. Having already reached annual run-rate savings that exceeded the initial savings estimates for 2017, the company increased its cost synergy target by 10%.
Alaska Air Group. In communicating with investors about the synergies arising from its takeover of Virgin America, Alaska Air provided an overview of its “integration playbook.” This served to reassure investors that the integration process would proceed smoothly and that the synergy estimates were realistic. Public release of the play-book also served to bolster the commit-ment of the management and integration teams to follow the process and timelines set out in the document.
Additionally, the company released details on the plausibility tests it used to verify the synergy estimates. First, by outlining the implied margin impact of the anticipated synergies, the company showed investors that profitability would not suffer and that the anticipated synergies would not lead to unrealistically high margins. Second, by comparing its synergy estimates with historical transactions in the US airline industry, the company demonstrated that its assessment was in line with industry performance.
SYNERGY COMMUNICATION IN ACTION

24 | Synergies Take Center Stage
reach the full run rate. Describe any plausibility checks that have been per-formed. Simply announcing synergies does not give investors the clarity they seek.
• Use follow-up communications to provide updates. Update investors and equity analysts on the estimated synergy targets, describe the progress toward achieving targets, and showcase the actions taken to foster progress. Investors reward companies that provide follow-up communications with higher returns. (See “The Real Deal on M&A, Synergies, and Value,” BCG article, November 2016.) Communicate the updates through channels that are effective for reaching this audience, such as analyst calls, press releases, and quarterly or annual reports. Additionally, provide employees, custom-ers, and other stakeholders with updates on synergy-related issues that are relevant to them, such as those related to head-count reductions or changes in the product lines.
Companies’ seemingly insatiable appetite for M&A has driven valuations to record
levels and forced buyers to give targets’ shareholders a larger portion of the anticipated synergy value. To succeed in this environment, buyers must redouble their efforts to ensure that the combined companies generate value through synergies and are thus regarded as greater than the sum of their parts. Accurate estimation of synergies, rigorous execution, and copious communication are essential. Dealmakers that can make—and keep—bold but realistic synergy promises will reap the rewards of a value-creating integration.

The Boston Consulting Group | 25
The research that underpins this report was conducted by the BCG Transaction Center during the first half of 2018. In assessing gen-eral market trends, we analyzed all reported M&A transactions from 1990 through the first half of 2018. For the analysis of deal values and volumes, we excluded transactions marked as repurchases, exchange offers, re-capitalizations, or spinoffs.
Although distinct samples were required to analyze different issues, all valuation analy-ses employed the same econometric method-ology. For any given company i and day t, the abnormal (that is, unexpected) returns (ARi,t) were calculated as the deviation of the ob-served returns E(Ri,t). Abnormal returns are the difference between actual stock returns and those predicted by the market model. (See Equation 1.)
EQUATION 1
ARi,t = Ri,t E(Ri,t)–
Following the most commonly used approach, we employed a market model estimation to calculate expected returns.1 (See Equation 2.)
EQUATION 2
E(Ri,t ) = αi βiRm,t+ + εi,t
The derived alpha (αi) and beta (βi) factors were combined with the observed market re-turns (Rm,t). (See Equation 3.)
EQUATION 3
ARi,t = Ri,t (αi + βiRm,t )–
We derived the cumulative abnormal return, or CAR, by aggregating the abnormal returns day by day, starting three days before the an-nouncement date and ending three days after it. (See Equation 4.)
EQUATION 4
CARi = ∑+3
t = –3(Ri,t E(Ri,t ))–
Note1. See Eugene F. Fama, Lawrence Fisher, Michael C. Jensen, and Richard Roll, “The Adjustment of Stock Prices to New Information,” International Economic Review 10, February 1969; and Stephen J. Brown and Jerold B. Warner, “Using Daily Stock Returns: The Case of Event Studies,” Journal of Financial Economics 14, 1985.
APPENDIX IMETHODOLOGY

26 | Synergies Take Center Stage
APPENDIX IISELECTED CORPORATE AND PRIVATE EQUITY TRANSACTIONS, 2018, 2017, AND 2016
Strategic advisor to the seller
Strategic advisorto the buyer
€3.4 billion
Strategic advisor to the buyer
$2.8 billion Value not disclosed Value not disclosed
Strategic advisor to the buyer
combined their mobilityservices business
in an equally owned joint venture
2018 20182018 2018 2018
selling its consumer health (OTC) business to
Strategic advisor tothe buyer
Strategic advisor tothe seller
Strategic advisor tothe buyer
Strategic advisor tothe seller
2018 2018 20182018
Value not disclosed Value not disclosed Value not disclosed Value not disclosed Value not disclosed
Strategic advisor tothe seller
2018
Divesting its heat pump business (Thermia) to
Strategic advisor to the buyer; strategic advisor
on PMIStrategic advisor to
the sellerStrategic advisor
to the sellerStrategic advisor to
the seller$24 billion $7.5 billion $1.9 billion $370 million
2017 2017 2017 2017
Strategic advisorto the buyer
2017
$1.2 billion
divesting itsoil and gas business
buying US candy business of

The Boston Consulting Group | 27
Sub sea cabels
Strategic advisor tothe buyer$5.2 billion $160 million
Strategic advisor tothe buyer
Strategic advisor tothe buyer
Strategic advisor tothe seller
2017 2017 20172017
Strategic advisor tothe buyer
2017
Value not disclosed Value not disclosed $0.9 billion
Sale of restaurantsin the Nordics
Strategic advisor tothe seller
$710 million
Strategic advisor tothe buyer
Strategic advisor tothe buyer
Strategic advisor tothe buyer
2017 2017 20162017
€1.3 billion
Strategic advisor tothe buyer
2016
Value not disclosed Value not disclosed $173 million
selling its S&IP business to
Strategic advisorto the buyer$6.8 billion $80 million$124 million
Strategic advisorto the buyer
Strategic advisorto the buyer
Strategic advisorto the buyer
2016 2016 20162016
Value not disclosedValue not disclosed
Strategic advisorto the seller
2016
$664 million
Strategic advisor tothe seller
Strategic advisor tothe buyer
Strategic advisor tothe seller
Strategic advisor tothe seller
€1.85 billion
2016 20162016
Value not disclosed
2016
$310 million

28 | Synergies Take Center Stage
The Boston Consulting Group publishes many reports and articles on corporate development and finance, M&A, and PMI that may be of interest to senior executives. The following are some recent examples.
How the Best Corporate Venturers Keep Getting BetterA Focus by The Boston Consulting Group, August 2018
What Really Matters for a Premium IPO Valuation?An article by The Boston Consulting Group, July 2018
The 2018 Value Creators RankingsAn interactive guide by The Boston Consulting Group, July 2018
When Building International Joint Ventures, Set-up MattersAn article by The Boston Consulting Group, May 2018
As Prices Peak, Should Dealmakers Wait for the Next Downturn?An article by The Boston Consulting Group, March 2018
Anatomy of an Ideal IPO Candidate An article by The Boston Consulting Group, February 2018
The Impact of US Tax Reform on Corporate Strategy and M&AAn article by The Boston Consulting Group, February 2018
The 2017 M&A Report: The Technology TakeoverA report by The Boston Consulting Group, September 2017
Cracking the Code in Private Equity Software DealsA Focus by The Boston Consulting Group, May 2017
Six Essentials for Achieving Postmerger SynergiesA Focus by The Boston Consulting Group, March 2017
The Real Deal on M&A, Synergies, and ValueAn article by The Boston Consulting Group, November 2016
Will Brexit Hurt—or Help—Your M&A Plans?An article by The Boston Consulting Group, November 2016
The 2016 M&A Report: Masters of the Corporate PortfolioA report by The Boston Consulting Group, August 2016
In a Tough Market, Investors Seek New Ways to Create ValueAn article by The Boston Consulting Group, May 2016
FOR FURTHER READING

The Boston Consulting Group | 29
NOTE TO THE READER
About the AuthorsJens Kengelbach is a senior part-ner and managing director in the Munich office of The Boston Con-sulting Group. He is also the firm’s global head of M&A, the leader of the BCG Transaction Center, the head of the firm’s Corporate Devel-opment practice in Germany, Austria, and Switzerland, and a member of the Industrial Goods practice. Georg Keienburg is a principal in BCG’s Cologne office, a core member of the Corporate De-velopment practice and BCG’s Transaction Center, focusing on deals in the industrial goods and health care sectors. Timo Schmid, an expert on M&A, is an associate director in the firm’s Munich office. He is also a core member of the Corporate Development practice and the BCG Transaction Center. Dominik Degen is a knowledge ex-pert and team manager in BCG’s ValueScience Center in the firm’s Munich office. Sönke Sievers holds the chair of international account-ing at Paderborn University.
BCG Transaction CenterBCG’s Transaction Center is the hub of the firm’s global M&A exper-tise and provides businesses with end-to-end transaction support, in-cluding strategic decision making in mergers and acquisitions, preparing and executing divestitures, and sup-porting IPOs and spinoffs. The Transaction Center combines BCG’s deep sector expertise with our com-prehensive knowledge of, and expe-rience in, all aspects of M&A across all sectors and industries. These services complement the pro-cess-focused offerings of invest-ment banks. With more than 300 professionals worldwide, we concen-trate on the commercial drivers of the business plan and equity story.
We help both corporate and private equity clients execute deals effi-ciently and, more importantly, max-imize value. For more information, please visit connect.bcg.com/trans-actioncenter.
BCG ValueScience CenterBCG ValueScience® Center (VSC) is the firm’s global think tank and an-alytics center for corporate finance topics and initiatives. VSC houses a team of more than 35 seasoned ex-perts who develop our proprietary analytical methodologies, including the SmartMultiple® valuation tech-nique. VSC works closely with BCG clients to help them make purpose-ful strategic decisions that acceler-ate value creation. The team oper-ates from four global hubs: Bengaluru, Munich, San Francisco, and Singapore.
Paderborn UniversityThe authors are grateful for the sup-port provided by Paderborn Univer-sity, the University for the Informa-tion Society, which has a strong foundation in computer science and its applications. Paderborn’s Chair of International Accounting, Sönke Sievers, focuses on research relat-ing to information processing in fi-nancial markets and valuation. In addition to academic research, he intensively collaborates with busi-ness partners to advance knowl-edge in the fields of corporate fi-nance, accounting, and mergers and acquisitions. For more information, please visit www.upb.de/accounting.
AcknowledgmentsThe authors thank Daniel Kim, Maximillian Schuessler, and Rosalie El Awdan for their insights and sup-port in the research and content de-velopment of this report. They also
thank Tan Nguyen and Boryana Hintermair for coordinating the publication, David Klein for his as-sistance in writing the report, and Katherine Andrews, Gary Callahan, Kim Friedman, Abby Garland, and Ron Welter for their help with its editing, design, and production.
For Further ContactThis report is a product of BCG’s Corporate Development practice, which works with its clients to deliv-er solutions to the challenges iden-tified in this report. If you would like to discuss the insights drawn from this report or learn more about the firm’s capabilities in M&A, please contact one of the authors.
Jens KengelbachSenior Partner and Managing DirectorBCG Munich+49 89 231 [email protected]
Georg KeienburgPrincipalBCG Cologne+49 221 55 00 [email protected]
Timo SchmidAssociate DirectorBCG Munich+49 89 231 [email protected]
Dominik DegenKnowledge Expert and Team ManagerBCG Munich+49 89 231 [email protected]

© The Boston Consulting Group, Inc. 2018. All rights reserved.
For information or permission to reprint, please contact BCG at [email protected].
To find the latest BCG content and register to receive e-alerts on this topic or others, please visit bcg.com. Follow The Boston Consulting Group on Facebook and Twitter.9/18

Synergies Take Cen
ter Stage Th
e 2018 M&
A R
eport
bcg.com