the 2016 gallup-hope index quantifying the economic energy...
TRANSCRIPT

The 2016 Gallup-HOPE IndexQuantifying the Economic Energy of America’s Youth
PRODUCED BY GALLUP AND OPERATION HOPE
Copyright Standards
This document contains proprietary research, copyrighted materials, and literary property of Gallup, Inc. It is for the guidance of your organization only and is not to be copied, quoted, published, or divulged to others outside your organization. All of Gallup, Inc.’s content is protected by copyright. Neither the client nor the participants shall copy, modify, resell, reuse, or distribute the program materials beyond the scope of what is agreed upon in writing by Gallup, Inc. Any violation of this Agreement shall be considered a breach of contract and misuse of Gallup, Inc.’s intellectual property.
This document is of great value to Gallup, Inc. Accordingly, international and domestic laws and penalties guaranteeing patent, copyright, trademark, and trade secret protection safeguard the ideas, concepts, and recommendations related within this document.
No changes may be made to this document without the express written permission of Gallup, Inc.
Gallup® and Q12® are trademarks of Gallup, Inc. All other trademarks and copyrights are property of their respective owners.

Copyright © 2017 Gallup, Inc. All rights reserved.1
The 2016 Gallup-HOPE Index | Quantifying the Economic Energy of America’s Youth
Dear Friends,
Since 2011, the joint mission of Gallup and Operation HOPE has been to unleash the economic energy of America’s youth. Both organizations have tried to discover if the nearly 33 million American students in grades five through 12 possess a spirit of free enterprise. When we began, we looked everywhere and could not find any behavioral, economic or predictive measure on youth financial literacy, nor on youth engagement in business and banking.
So we created one: the Gallup-HOPE Index.
In your hands, you will find answers to the most important questions of our time: Is America’s youth financially literate enough to solve the country’s economic and jobs problems? Do young people possess the spirit of free enterprise? Are students getting the opportunity to match their aspirations with the experience they need to boom America’s economy?
These past five years have given us rich data so we can review and enhance our research as a part of our 100-year commitment to finding the answers to these important questions and providing them to American leaders.
You’ll see from the report there’s been no progress on the majority of these measures. Students remain optimistic but lack the financial literacy to compete globally with other students. This is bad news for America, as the country’s productivity growth has been close to zero for years.
There are some promising signs, however. About 40% of students want to start a business or invent something that will change the world. The problem is, only 5% of these students are in internships in companies or organizations. This is arguably the single biggest failure of our leadership. Not Washington’s, not the public schools’ — but yours and mine.
This report offers a strong foundation to understand the economic voice of America’s youth. As Gallup and Operation HOPE enter the next phase of our partnership, we will use these foundational metrics and strategize about what current students need to be successful and to become America’s future job creators.
Given the current state of the nation and outlook for the future, investing in our aspiring young entrepreneurs is essential to developing the next generation of business builders.
As you go through this report, we urge you to think about the implications and determine what your role will be. The goal of the Gallup-Hope Index is to identify and empower America’s youth. They represent the next generation of business leaders who can sustain our nation’s long-term economic energy as well as future growth and productivity.
Jim Clifton Gallup Chairman and CEO
John Hope Bryant Operation HOPE Founder, Chairman and CEO

Copyright © 2017 Gallup, Inc. All rights reserved. 2
The 2016 Gallup-HOPE Index | Quantifying the Economic Energy of America’s Youth
The goal of the Gallup-HOPE Index is to identify and empower America’s youth. They represent the next generation of business leaders who can sustain our nation’s long-term economic energy.
Introduction
Gallup and Operation HOPE joined forces in 2011 to create a measure of young people’s attitudes toward entrepreneurship and financial literacy. This measure, the Gallup-HOPE Index, quantifies the economic energy of America’s youth. For the past five years, the Gallup-HOPE Index has served as an annual benchmark of the economic vitality of the nation’s young people. To date, nearly 6,000 students have participated in the study.
Gallup describes entrepreneurial aspiration as having the talent and energy for building businesses that survive, thrive and employ others (Calderon 2016). Gallup’s research shows that approximately five in 1,000 people have exceptionally rare, genius-level entrepreneurial talent. Currently, there are nearly 33 million students enrolled in grades five through 12 in the U.S. (U.S. Census Bureau 2015). This means that about 165,000 students possess this exceptional talent and represent a crucial resource to help sustain economic growth across the country. Further, identifying and developing young entrepreneurs is vital to ensuring America’s long-term economic competitiveness. Entrepreneurial talent is not something that can be taught, but the determination and confidence of talented entrepreneurs are nurtured through and influenced by early childhood experiences (Cunha & Heckman 2007). Therefore, it is important to assess and invest in America’s youth to ensure that they are well-equipped to support America’s economic success.
The Gallup-HOPE Index suggests that we are failing to recognize and maximize the entrepreneurial talents and aspirations of America’s youth. Particularly concerning is the lack of educational resources devoted to financial education or entrepreneurship in a school’s curriculum. America lags behind other countries when it comes to preparing its students to enter the world with only basic financial knowledge. According to a recent Gallup study, only 57% of U.S. adults are financially literate (McCarthy & Pugliese 2015).
Copyright © 2017 Gallup, Inc. All rights reserved.3
The 2016 Gallup-HOPE Index | Quantifying the Economic Energy of America’s Youth
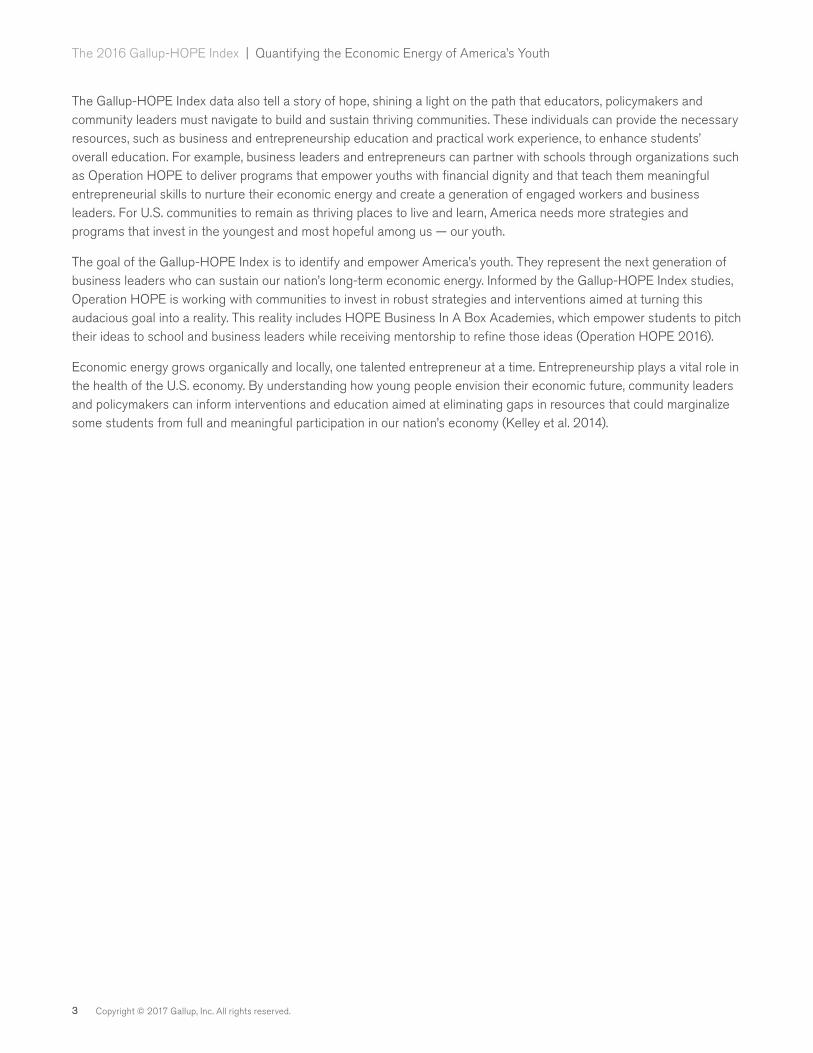
The Gallup-HOPE Index data also tell a story of hope, shining a light on the path that educators, policymakers and community leaders must navigate to build and sustain thriving communities. These individuals can provide the necessary resources, such as business and entrepreneurship education and practical work experience, to enhance students’ overall education. For example, business leaders and entrepreneurs can partner with schools through organizations such as Operation HOPE to deliver programs that empower youths with financial dignity and that teach them meaningful entrepreneurial skills to nurture their economic energy and create a generation of engaged workers and business leaders. For U.S. communities to remain as thriving places to live and learn, America needs more strategies and programs that invest in the youngest and most hopeful among us — our youth.
The goal of the Gallup-HOPE Index is to identify and empower America’s youth. They represent the next generation of business leaders who can sustain our nation’s long-term economic energy. Informed by the Gallup-HOPE Index studies, Operation HOPE is working with communities to invest in robust strategies and interventions aimed at turning this audacious goal into a reality. This reality includes HOPE Business In A Box Academies, which empower students to pitch their ideas to school and business leaders while receiving mentorship to refine those ideas (Operation HOPE 2016).
Economic energy grows organically and locally, one talented entrepreneur at a time. Entrepreneurship plays a vital role in the health of the U.S. economy. By understanding how young people envision their economic future, community leaders and policymakers can inform interventions and education aimed at eliminating gaps in resources that could marginalize some students from full and meaningful participation in our nation’s economy (Kelley et al. 2014).

Copyright © 2017 Gallup, Inc. All rights reserved. 4
The 2016 Gallup-HOPE Index | Quantifying the Economic Energy of America’s Youth
Summary of Findings
The 2016 Gallup-HOPE Index, based on a sample of 1,006 students in grades five through 12 in the U.S., marks the five-year milestone since the study began. The results pave the foundation for Gallup and Operation HOPE to continue its work in ensuring that America’s young people are well-equipped to help sustain the country’s economic growth. With five years of data, Gallup and Operation HOPE will review the next stages of their relationship to determine new and innovative methods to enhance the research.
Results of the Gallup-HOPE Index suggest that students’ attitudes and perception of their work and school lives are essentially unchanged since the inception of the study in 2011. Results from 2016 show that:
• Students in grades five through eight were 28 percentage points more likely than students in grades nine through 12 to agree that they plan to start their own business.
• Nonwhite students in 2016 are less likely than they were in 2011 to agree that they plan to start their own business. Based on the 2011 Gallup-HOPE Index, nonwhite students (54%) were 15 points more likely than white students (39%) to agree that they plan to start their own business. But in 2016, 42% of nonwhite students and 40% of white students agreed that they plan to start their own business.
• Less than half of all students agreed that their school offers classes in how to start and run a business. Additionally, students in higher grade levels were less likely than students in lower grade levels to say they plan to start their own business.
• Approximately half of the students surveyed in 2016 (53%) agreed that their school teaches them about money and banking. These results are consistent with results from 2011.
• Less than one in 20 students said that they intern with a local business (4%) or that they run their own business now (4%).
Regardless of students’ career goals, they should receive the resources and development to equip them for life outside of school. Every student would benefit from more programs related to financial literacy or work-based learning opportunities in schools. America’s future depends more than ever on the success of the country’s youth, and we need all students to realize their full potential.
Hope for the Future
Since 2012, Gallup and Operation HOPE has asked America’s students about the perceptions of their current and future lives. Overall, students feel their future lives will be better than their lives today. In 2016, students rated their current lives as an 8.0 out of 10, while they rated their future lives as an 8.7 out of 10. These ratings are similar to prior years’ scores, demonstrating that students are optimistic about their futures.

Copyright © 2017 Gallup, Inc. All rights reserved.5
The 2016 Gallup-HOPE Index | Quantifying the Economic Energy of America’s Youth
Figure 1.
2011 2012 2013 2015 2016
Please imagine a ladder with steps numbered from zero at the bottom to 10 at the top. The top of the ladder represents the best possible life for you and the bottom of the ladder represents the worst possible life for you. On which step of the ladder would you say you personally feel you stand at this time?
N/A 8.0 7.9 7.9 8.0
On which step do you think you will stand about five years from now?
N/A 8.7 8.6 8.7 8.7
Students in all demographic groups surveyed in 2016 expressed optimism about the future. Students in grades five through eight rated their current lives as an 8.3 out of 10; students in grades nine through 12 rated their current lives as a 7.7 out of 10. While younger students rated their current and future lives higher than older students did, there was a smaller difference in how both groups rated their future lives.
Figure 2.
2016 Overall Male Female Grades 5-8
Grades 9-12
Non-white White
Please imagine a ladder with steps numbered from zero at the bottom to 10 at the top. The top of the ladder represents the best possible life for you and the bottom of the ladder represents the worst possible life for you. On which step of the ladder would you say you personally feel you stand at this time?
8.0 8.1 7.9 8.3 7.7 7.9 8.0
On which step do you think you will stand about five years from now?
8.7 8.7 8.8 8.9 8.6 8.9 8.6
Gallup has found that when asked these same ladder questions, entrepreneurs in the U.S. express more optimism about their future than other employed adults in America do (Witter, Agrawal & Brown 2012). Whether young or old, optimism enables individuals to deal with challenges with “enthusiasm and persistence” (Carver & Scheier 2003). This trait is important not only for budding entrepreneurs but also for the success of America’s youth in general.
Optimists are persistent, especially when they encounter difficult tasks or obstacles (Gillham & Reivich 2004). Gallup research supports this conclusion, finding that successful entrepreneurs possess 10 innate talents that are instrumental

Copyright © 2017 Gallup, Inc. All rights reserved. 6
The 2016 Gallup-HOPE Index | Quantifying the Economic Energy of America’s Youth
in starting and growing a business. One such talent is determination. Individuals with determination persevere through difficult – even seemingly insurmountable – obstacles. Staying determined and persistent is especially important for young entrepreneurs because U.S. small businesses close more often than they open (Ryan 2014). And, typically, entrepreneurs begin their venture into the business world by starting a small business. Further, in their quest to start a business, it is important nurture students’ skills and give them the education they need to make their business successful. Now is the time to harness youths’ optimism and ignite their entrepreneurial spirit to sustain economic growth in America.
The Future of U.S. Small Businesses
Entrepreneurs power America’s economy through small businesses, which account for the majority of the nation’s new job creation and innovation and are often born from the ideas entrepreneurs have or inventions they want to create. According to the U.S. Small Business Administration (SBA) Small Business Profile, there are approximately 28.8 million small businesses that make up 99.7% of all U.S. businesses and 97.7% of all U.S. exports. Small businesses employ 56.8 million employees, or almost half of the private U.S. workforce (48%). The SBA (2015) also found that in the first three quarters of 2014, small businesses added 1.4 million net new jobs, or about 73% of the new jobs in the U.S. economy. If small businesses remain vital to economic growth, America’s youth will play an increasingly larger role as the next generation of economic producers.
The percentage of students who agree that they plan to start their own business has remained stable over the past five years. In 2011, almost half of students (45%) agreed that they plan to start their own business; in 2016, 41% agreed that they plan to start their own business. Similarly, 42% of students in 2011 agreed that they will invent something that changes the world. This is approximately the same as it was in 2016, when 45% of students agreed that they will invent something that changes the world.
Figure 3.
2011 2012 2013 2015 2016
I plan to start my own business. 45% 43% 42% 42% 41%
I will invent something that changes the world. 42% 42% 38% 42% 45%
While data from the National Women’s Business Council show that men are much more likely than women to own a small business (2015), results from the Gallup-HOPE Index tell a different story. In 2016, male students (43%) and female students (40%) were equally likely to agree that they plan to start their own business. Further, male students (47%) and female students (42%) were equally likely to agree that they will invent something that changes the world.
White and Nonwhite Students Equally Likely to Say They Plan to Start Their Own Business
According to the SBA (2016), 29% of small businesses in the U.S. are majority-owned by minorities, making up a significant part of the U.S. economy. In 2012, minority-owned businesses contributed $1.38 trillion in revenue and 7.2 million jobs to the $15.7 trillion U.S. economy (Bureau of Economic Analysis 2013). The five years encompassing the economic recession reflected the importance of these businesses; in this time, a net 2 million minority-owned businesses opened while a net 1 million non-minority-owned businesses closed (SBA 2016).
The Gallup-HOPE Index has historically assessed that, by a large margin, nonwhite students are more likely than white students to agree that they plan to start their own business. In 2011, over half of nonwhite students (54%) agreed with this statement, while only 39% of white students agreed — a 15-point difference. However, the gap almost disappeared

Copyright © 2017 Gallup, Inc. All rights reserved.7
The 2016 Gallup-HOPE Index | Quantifying the Economic Energy of America’s Youth
in 2016, with 42% of nonwhite students and 40% of white students agreeing that they plan to start their own business — a two-point difference. The gap has narrowed because nonwhite students are less likely now than in prior years to agree that they plan to start their own business, while white students are just as likely as they were in prior years to agree.
Figure 4.
2011
I PLAN TO START MY OWN BUSINESS.
% Agree
White
39% 39% 37% 38% 40%
54%
46%50% 49%
42%
2012 2013 2015 2016
Nonwhite
0%
10%
20%
30%
40%
50%
60%
Children of Business Owners More Likely to Say They Plan to Start Their Own Business
As their children’s initial role models, parents often have a formative influence on their children’s self-image. If parents are entrepreneurial, it is possible that their children will be more likely to form a similar identity. One study found that having a parent who is an entrepreneur increases the probability of the child becoming an entrepreneur by 60%. (Lindquist 2012)
Consistent with external research, results from the 2016 Gallup-HOPE study showed that children of business owners (52%) were more likely than children of non-business owners (35%) to agree that they plan to start their own business.
Figure 5.
I PLAN TO START MY OWN BUSINESS.
% Agree
39%
52%
35%
Children of business owners Children of non-business owners0%
10%
20%
30%
40%
50%
60%
Copyright © 2017 Gallup, Inc. All rights reserved. 8
The 2016 Gallup-HOPE Index | Quantifying the Economic Energy of America’s Youth
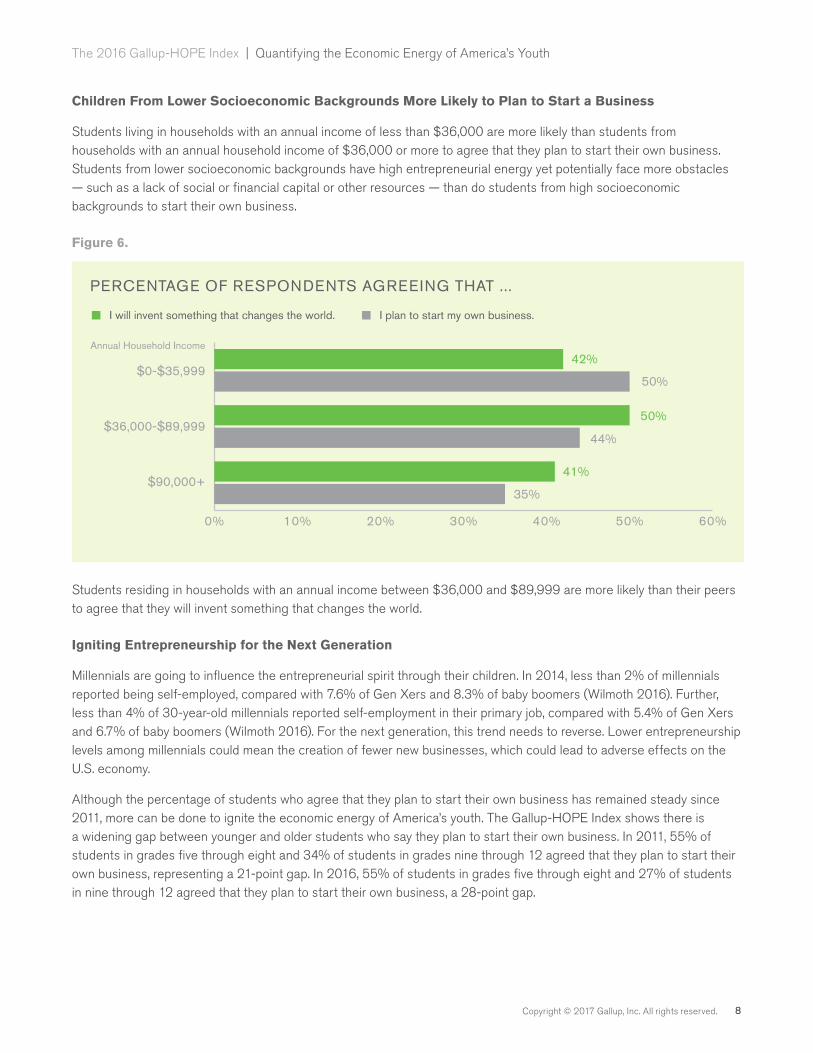
Children From Lower Socioeconomic Backgrounds More Likely to Plan to Start a Business
Students living in households with an annual income of less than $36,000 are more likely than students from households with an annual household income of $36,000 or more to agree that they plan to start their own business. Students from lower socioeconomic backgrounds have high entrepreneurial energy yet potentially face more obstacles — such as a lack of social or financial capital or other resources — than do students from high socioeconomic backgrounds to start their own business.
Figure 6.
I will invent something that changes the world.
Annual Household Income
I plan to start my own business.
PERCENTAGE OF RESPONDENTS AGREEING THAT ...
42%
50%
41%
50%
44%
35%
$0-$35,999
$36,000-$89,999
$90,000+
0% 10% 20% 30% 40% 50% 60%
Students residing in households with an annual income between $36,000 and $89,999 are more likely than their peers to agree that they will invent something that changes the world.
Igniting Entrepreneurship for the Next Generation
Millennials are going to influence the entrepreneurial spirit through their children. In 2014, less than 2% of millennials reported being self-employed, compared with 7.6% of Gen Xers and 8.3% of baby boomers (Wilmoth 2016). Further, less than 4% of 30-year-old millennials reported self-employment in their primary job, compared with 5.4% of Gen Xers and 6.7% of baby boomers (Wilmoth 2016). For the next generation, this trend needs to reverse. Lower entrepreneurship levels among millennials could mean the creation of fewer new businesses, which could lead to adverse effects on the U.S. economy.
Although the percentage of students who agree that they plan to start their own business has remained steady since 2011, more can be done to ignite the economic energy of America’s youth. The Gallup-HOPE Index shows there is a widening gap between younger and older students who say they plan to start their own business. In 2011, 55% of students in grades five through eight and 34% of students in grades nine through 12 agreed that they plan to start their own business, representing a 21-point gap. In 2016, 55% of students in grades five through eight and 27% of students in nine through 12 agreed that they plan to start their own business, a 28-point gap.

Copyright © 2017 Gallup, Inc. All rights reserved.9
The 2016 Gallup-HOPE Index | Quantifying the Economic Energy of America’s Youth
Figure 7.
I plan to start my own business. (% Agree) 2011 2012 2013 2015 2016
Grades 5-8 55% 50% 51% 51% 55%
Grades 9-12 34% 35% 33% 34% 27%
Gap -21% -15% -18% -17% -28%
Students Widely Understand the Benefits of Education
The idea that more education leads to better career outcomes is widely accepted. A report from Georgetown University’s Center on Education and the Workforce shows that there is a positive correlation between more education and lifetime earnings (Carnevale, Rose, & Cheah 2011). College Board attempts to quantify the relationship between education and earnings. They calculate that master’s degree holders and bachelor’s degree holders, on average, earn 1.97 times and 1.66 times more, respectively, than high school degree holders do (2014). Fortunately, the majority of U.S. students surveyed understand the implications of attaining more education.
Over the past five years, a similar proportion of respondents have agreed that the more education they have, the more money they will make. In both 2011 and 2016, 87% of students agreed with this statement.
Figure 8.
THE MORE EDUCATION, THE MORE MONEY I WILL MAKE.
% Agree
87%93%
88% 87%86%
50%
60%
70%
80%
90%
100%
2011 2012 2013 2015 2016
All Students
Copyright © 2017 Gallup, Inc. All rights reserved. 10
The 2016 Gallup-HOPE Index | Quantifying the Economic Energy of America’s Youth
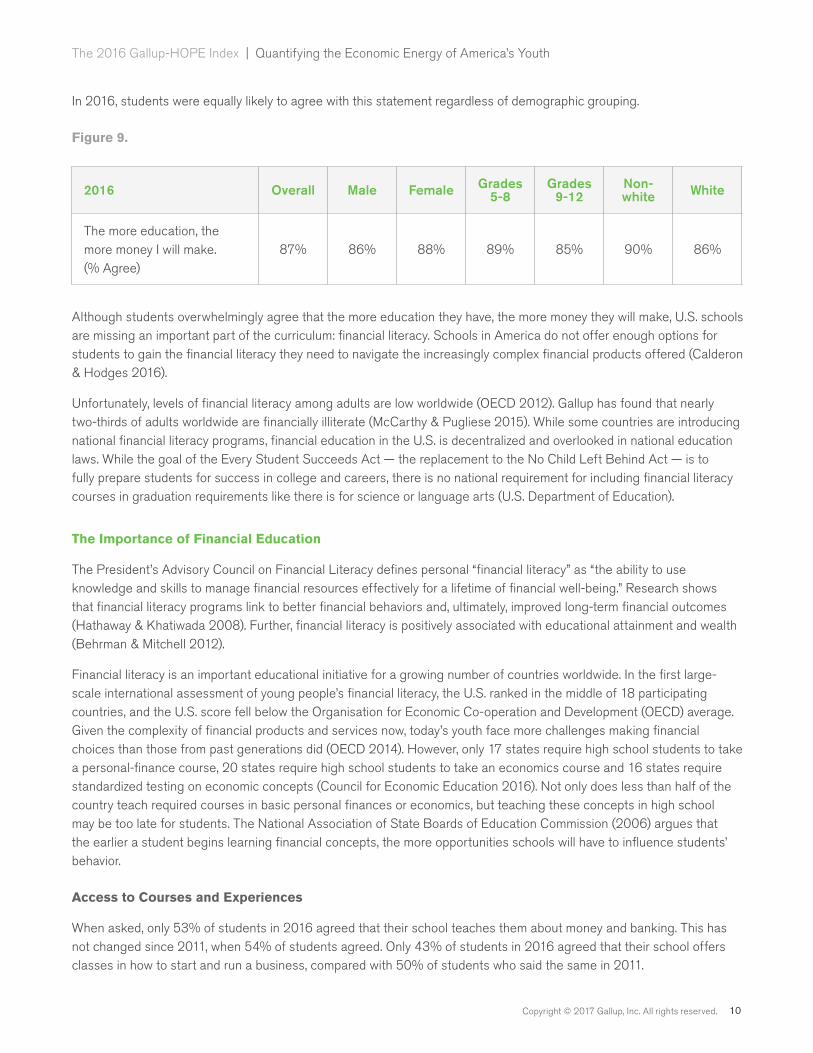
In 2016, students were equally likely to agree with this statement regardless of demographic grouping.
Figure 9.
2016 Overall Male Female Grades 5-8
Grades 9-12
Non-white White
The more education, the more money I will make. (% Agree)
87% 86% 88% 89% 85% 90% 86%
Although students overwhelmingly agree that the more education they have, the more money they will make, U.S. schools are missing an important part of the curriculum: financial literacy. Schools in America do not offer enough options for students to gain the financial literacy they need to navigate the increasingly complex financial products offered (Calderon & Hodges 2016).
Unfortunately, levels of financial literacy among adults are low worldwide (OECD 2012). Gallup has found that nearly two-thirds of adults worldwide are financially illiterate (McCarthy & Pugliese 2015). While some countries are introducing national financial literacy programs, financial education in the U.S. is decentralized and overlooked in national education laws. While the goal of the Every Student Succeeds Act — the replacement to the No Child Left Behind Act — is to fully prepare students for success in college and careers, there is no national requirement for including financial literacy courses in graduation requirements like there is for science or language arts (U.S. Department of Education).
The Importance of Financial Education
The President’s Advisory Council on Financial Literacy defines personal “financial literacy” as “the ability to use knowledge and skills to manage financial resources effectively for a lifetime of financial well-being.” Research shows that financial literacy programs link to better financial behaviors and, ultimately, improved long-term financial outcomes (Hathaway & Khatiwada 2008). Further, financial literacy is positively associated with educational attainment and wealth (Behrman & Mitchell 2012).
Financial literacy is an important educational initiative for a growing number of countries worldwide. In the first large-scale international assessment of young people’s financial literacy, the U.S. ranked in the middle of 18 participating countries, and the U.S. score fell below the Organisation for Economic Co-operation and Development (OECD) average. Given the complexity of financial products and services now, today’s youth face more challenges making financial choices than those from past generations did (OECD 2014). However, only 17 states require high school students to take a personal-finance course, 20 states require high school students to take an economics course and 16 states require standardized testing on economic concepts (Council for Economic Education 2016). Not only does less than half of the country teach required courses in basic personal finances or economics, but teaching these concepts in high school may be too late for students. The National Association of State Boards of Education Commission (2006) argues that the earlier a student begins learning financial concepts, the more opportunities schools will have to influence students’ behavior.
Access to Courses and Experiences
When asked, only 53% of students in 2016 agreed that their school teaches them about money and banking. This has not changed since 2011, when 54% of students agreed. Only 43% of students in 2016 agreed that their school offers classes in how to start and run a business, compared with 50% of students who said the same in 2011.

Copyright © 2017 Gallup, Inc. All rights reserved.11
The 2016 Gallup-HOPE Index | Quantifying the Economic Energy of America’s Youth
Schools must provide more opportunities for students to explore and develop their talents through business programs and courses. Research shows that high school students who completed a program designed to train and develop their entrepreneurial skills are more likely to start a business (Elert, Anderson & Wennberg 2014). Access to information, mentors and experiences at school can help maximize students’ entrepreneurial potential.
Figure 10.
FINANCIAL LITERACY COURSES
% Agree
54% 50%58%
47% 47%43%
66%
55% 53%52%
0%
10%
20%
30%
40%
50%
60%
70%
2011 2012 2013 2015 2016
My school teaches me about money and banking. My school offers classes in how to start and run a business.
Results from the 2016 Gallup-HOPE Index also showed that students in grades nine through 12 (60%) were significantly more likely than students in grades five through eight (27%) to say their school offers classes in how to start and run a business. If these types of classes were more readily available to middle school students, they would have the necessary knowledge to start their own business, helping to cultivate younger Americans’ entrepreneurial spirit.
Figure 11.
MY SCHOOL OFFERS CLASSES IN HOW TO START AND RUN A BUSINESS.
% Agree
27%
60%
Grades 5-8 Grades 9-120%
10%
20%
30%
40%
50%
60%

Copyright © 2017 Gallup, Inc. All rights reserved. 12
The 2016 Gallup-HOPE Index | Quantifying the Economic Energy of America’s Youth
Young people are the best hope for creating good jobs, and schools play a vital role in helping students discover and develop their entrepreneurial potential to build businesses that create these jobs. Schools can provide training for future business builders who need to practice taking risks, focusing on goals and building effective teams.
Economic Participation
Financial education is only the first step in ensuring that students are aware of today’s economic complexities. Teaching financial concepts to young children can increase their financial literacy, but having access to financial institutions to apply these concepts is also important (Johnson & Sherraden 2007). Children (and adults) learn more if they have experiences that allow them to apply their financial education and are relevant to their lives. Combining financial education with access to an account at a financial institution could provide students with the opportunity to practice skills learned in the classroom and, in doing so, could improve their overall understanding and retention of the subject (Corporation for Enterprise Development 2014).
Overall, the percentage of students reporting that they have a bank or credit union account with money in it has remained stable since 2011. Fifty-seven percent of students in 2011 and 2016 said they have a bank or credit union account with money in it.
Figure 12.
% Yes 2011 2012 2013 2015 2016
Do you have a bank or credit union account with money in it?
57% 53% 52% 52% 57%
Students living in households with an annual income of less than $36,000 were less likely in 2016 to report having a bank or credit union account with money in it compared with students from households with an annual household income of $36,000 or more. Elliott & Lewis’ research (2015) shows that having a savings account not only builds financial expertise, but it can also lead to other beneficial outcomes for students later in their lives – especially for students from lower-income households. They find that students from low- to moderate-income households with up to $500 in a savings account designated for college are three times more likely to enroll in and four times more likely to graduate from college than their peers with no savings for college are.

Copyright © 2017 Gallup, Inc. All rights reserved.13
The 2016 Gallup-HOPE Index | Quantifying the Economic Energy of America’s Youth
Figure 13.
Annual Household Income
% Agree
DO YOU HAVE A BANK OR CREDIT UNION ACCOUNT WITH MONEY IN IT?
31%
55%
67%
$0-$35,999
$36,000-$89,999
$90,000+
0% 10% 20% 30% 40% 50% 60% 70% 80%
However, people can be financially illiterate and still have access to various financial products that produce adverse results. For example, most college students borrow money to finance their education, yet they often do so without fully understanding how much debt is appropriate for their education or the connection between their area of study and the income level that they can expect upon graduation. This lack of financial knowledge has contributed to burgeoning student debt levels in the U.S. of over $1.2 trillion (The Economist), as defaults rates on these loans continue to rise (Yannelis 2015).
Fewer Than One in 20 Students Report Interning With a Local Business or Running Their Own Business
High school students can participate in various experiential learning opportunities, such as internships, to gain skills and supplement classroom learning. This type of learning can help students apply and enhance classroom learning, increase motivation and understanding, and develop better awareness of a work environment. In 2016, 4% of students reported that they are currently interning with a local business, while another 4% of students reported that they currently run their own business.
Figure 14.
% Yes 2011 2012 2013 2015 2016
Are you currently interning with a local business? 5% 7% 5% 5% 4%
Do you run your own business now? 4% N/A 3% 3% 4%

Copyright © 2017 Gallup, Inc. All rights reserved. 14
The 2016 Gallup-HOPE Index | Quantifying the Economic Energy of America’s Youth
In 2016, 84% of students reported working less than an hour, while 16% of students reported working more than an hour.
Figure 15.
1+ hours <1 hour
HOW MANY HOURS DID YOU WORK AT ANY PAYING JOB LAST WEEK?
16%
19%
17%
84%
81%
82%
22%77%
20%80%
2016
2015
2013
2012
2011
0% 10% 20% 30% 40% 50% 60% 70% 80% 90% 100%
Students who worked at least one hour a week (52%) in 2016 were more likely than students who worked less than one hour a week (41%) to agree that they plan to start their own business. By having an applied learning opportunity before college, students have the opportunity to explore different career paths that suit their interests or even to start their own business (Merritt 2008).
Figure 16.
I PLAN TO START MY OWN BUSINESS.
% Agree
41%
52%
Students who work <1 hour Students who work 1+ hours0%
10%
20%
30%
40%
50%
60%

Copyright © 2017 Gallup, Inc. All rights reserved.15
The 2016 Gallup-HOPE Index | Quantifying the Economic Energy of America’s Youth
Conclusion
The Gallup-HOPE Index has measured the entrepreneurial aspirations and experience of America’s students since 2011. Trends have remained similar year over year. Despite their entrepreneurial energy, students’ limited exposure to workforce experience and education results in an energy-opportunity deficit that must be resolved to maximize their potential. While it is arguably preferable to have a shortage of young Americans’ workforce experience than to have a shortage of economic energy — mainly because the latter is more difficult to fix — we must reverse the downward shift in students’ involvement in entrepreneurial education and experience.
The U.S. desperately needs business leaders and organizations to rally in closing the energy-opportunity gap by providing opportunities and mentorship to students as they hone their entrepreneurial talents through education and experience. These opportunities must come early and often because students’ entrepreneurial energy diminishes in high school.
To accomplish this, leaders from the public and private sectors must implement interventions and education aimed at eliminating resource gaps that could marginalize some students from full and meaningful participation in the U.S. economy. American cities must ignite young Americans’ economic energy earlier and more intentionally. The enthusiasm to start a business decreases as age increases, making it that much more important to nurture and engage students’ entrepreneurial spirit early so they are prepared to start a business or invent something that changes the world.
Moving forward, Gallup and Operation HOPE will use these results to enter the next phase of our partnership by leveraging these metrics. Through advisory board and individual programs, such as HOPE Business In A Box, leaders can develop efforts and initiatives to help students connect with mentors in their communities. Educators, community and business leaders, and policymakers all have a role to play in formulating a plan to encourage students’ entrepreneurial aspirations. Additionally, learning opportunities via workshops, internships and jobs can help students connect their entrepreneurial intentions with the experience they need to bring their ideas to life.

Copyright © 2017 Gallup, Inc. All rights reserved. 16
The 2016 Gallup-HOPE Index | Quantifying the Economic Energy of America’s Youth
Methodology
The 2016 Gallup-HOPE Index findings are based on results from a nationally representative telephone survey of 1,006 U.S. students in grades five through 12. Telephone interviews were conducted between Sept. 12, 2016, and Nov. 7, 2016. The sampling frame of this study came from the Gallup Daily tracking survey. The frame included respondents who had consented to be re-contacted and indicated that they had children younger than 18. These respondents were re-contacted and screened for school-aged children in grades five through 12 in the household. Permissions were then requested from qualified parents or guardians for their students in grades five through 12 to participate in the Operation HOPE survey. The frame was stratified by race/ethnicity, education and household income, and proportionate selection was used.
The Gallup Daily tracking survey is an unprecedented survey of 1,000 U.S. adults each day, 350 days per year, covering political, economic and well-being topics. Gallup Daily tracking methodology relies on live interviewers and dual-frame telephone sampling (which includes random-digit-dial [RDD] list-assisted landline phone as well as RDD cellphone sampling to reach those in cellphone-only households) and uses a multi-call design to reach respondents not contacted on the initial attempt. Gallup interviewers employ a “most recent birthday” selection method for choosing adult respondents within a landline phone household. Gallup Daily tracking includes Spanish-language interviews for Spanish-speaking respondents and interviews in Alaska and Hawaii.
Gallup Daily tracking data are weighted daily to account for unequal selection probability and nonresponse by sample frame. The weights are also adjusted for the number of adults in a landline phone household and unequal selection probability because of dual-telephone-user status. Post-stratification weights are then constructed to compensate for nonrandom nonresponse among demographic groups using targets from the Centers for Disease Control and Prevention’s National Health Interview Survey for telephone status and targets from the U.S. Census Bureau for age, sex, region, gender, education, ethnicity by race and population density. The resulting sample represents an estimated 95% of all U.S. households.
The weighting of the Operation HOPE data started with the Gallup Daily tracking weight as the initial weight. Selection weight and nonresponse weight from the sampling frame were then applied. The final step was the post-stratification on the adjustment of Census regional distribution, parent/guardian age and educational characteristics, and child grade level.
For results based on the total sample of students in grades five through 12 (N=1,006), one can say with 95% confidence that the margin of error is ±3.1 percentage points. In addition to sampling error, question wording and practical difficulties in conducting surveys can introduce error or bias into the findings of public opinion polls.
For more details on Gallup’s polling methodology, visit http://www.gallup.com/185468/gallup-daily-tracking-work.aspx.

Copyright © 2017 Gallup, Inc. All rights reserved.17
The 2016 Gallup-HOPE Index | Quantifying the Economic Energy of America’s Youth
References
Behrman, J., Mitchell, O., Soo, C., & Bravo, D. (2012). How Financial Literacy Affects Household Wealth Accumulation. The American Economic Review, 102(3), 300–304.
Bureau of Economic Analysis. (2013). Gross Domestic Product: Fourth Quarter and Annual 2012. Retrieved from https://www.bea.gov/newsreleases/national/gdp/2013/pdf/gdp4q12_adv.pdf
Calderon, V. (2016). U.S. Schools Can Help Win the “Entrepreneurship Championship.” Retrieved from http://www.gallup.com/opinion/gallup/191309/schools-help-win-entrepreneurship-championship.aspx
Calderon, V., & Hodges, T. (2016). Career, Financial Literacy Skills Key to Students’ Futures. Retrieved from http://www.gallup.com/opinion/gallup/190544/career-financial-literacy-skills-key-students-futures.aspx
Carnevale, A., Rose, S., & Cheah, B. (2011). The college payoff: Education, occupations, lifetime earnings.
Carver, C. S., & Scheier, M. 2003. Optimism. In S. J. Lopez & C. R. Snyder (Eds.), Positive psychological assessment: A handbook of models and measures. Washington DC: American Psychological Association.
College Board. (2016). Lifetime Earnings by Education Level - Trends in Higher Education. Retrieved from https://trends.collegeboard.org/education-pays/figures-tables/lifetime-earnings-education-level
Corporation for Enterprise Development. (2014). Financial Education and Account Access Among Elementary Students. Retrieved from https://www.treasury.gov/resource-center/financial-education/Documents/AFCO%20Youth%20Research%20Brief.pdf
Council for Economic Education. (2016). Economic and Personal Finance Education in Our Nation’s Schools. Retrieved from http://councilforeconed.org/wp/wp-content/uploads/2016/02/sos-16-final.pdf
Cunha, F., & Heckman, J. (2007). The technology of skill formation. National Bureau of Economic Research.
Elert, N., Andersson, F., & Wennberg, K. (2014). The Impact of Entrepreneurship Education in High School on Long-Term Entrepreneurial Performance. Rochester, NY: Social Science Research Network.
Elliott, W. and Lewis, M. (2013). Are student loans widening the wealth gap in America? It’s a question of equity. Lawrence, KS: Assets and Education Initiative (AEDI).
Fairlie, R., & Robb, A. (2004). Families, Human Capital, and Small Business: Evidence from the Characteristics of Business.
Gallup. (2016). Entrepreneurial Profile 10. Retrieved January 2, 2017, from http://www.gallup.com/products/170990/entrepreneurial-profile.aspx
Gillham, J. & Reivich, K. (2004). Cultivating Optimism in Childhood and Adolescence. The Annals of the American Academy of Political and Social Science,591, 146-163.
Hathaway, I., & Khatiwada, S. (2008). Do Financial Education Programs Work? (SSRN Scholarly Paper No. ID 1118485). Rochester, NY: Social Science Research Network.
Johnson, E., & Sherraden, M. S. (2007). From financial literacy to financial capability among youth. J. Soc. & Soc. Welfare, 34, 119.
Kelley et al. (2014). Global Entrepreneurship Monitor 2014 United States Report. Global Entrepreneurship Monitor.

Copyright © 2017 Gallup, Inc. All rights reserved. 18
The 2016 Gallup-HOPE Index | Quantifying the Economic Energy of America’s Youth
Lindquist, M., Sol, J., & Van Praag, M. (2012). Why Do Entrepreneurial Parents Have Entrepreneurial Children?
McCarthy, J., & Pugliese, A. (2015). Two in Three Adults Worldwide Are Financially Illiterate. Retrieved January 2, 2017, from http://www.gallup.com/poll/186680/two-three-adults-worldwide-financially-illiterate.aspx
Merritt, R. (2008). Student Internships. EBSCO Publishing Inc. Retrieved January 2, 2017, from https://www.ebscohost.com/uploads/imported/thisTopic-dbTopic-1072.pdf
National Association of State Boards of Education. (2006). Who will own our children?: The report of the NASBE Commission on Financial and Investor Literacy. Alexandria, VA: NASBE.
National Women’s Business Council. (2015). Fact Sheet. Retrieved from https://www.nwbc.gov/sites/default/files/NWBC_FS_Age_Final_lr.pdf
Nayar, N., Bracco, K. R., & Darche, S. (2009). Work-based learning in California: Opportunities and models for expansion.
OECD. (2012) Financial Education in Schools. Retrieved from https://www.oecd.org/finance/financial-education/FinEdSchool_web.pdf
OECD. (2014). PISA 2012 Results: Students and Money (Volume VI). OECD Publishing. Retrieved from http://www.oecd-ilibrary.org/education/pisa-2012-results-students-and-money-volume-vi_9789264208094-en
Operation HOPE. (2013). HOPE Business In A Box Academies. Retrieved January 2, 2017, from https://www.operationhope.org/business-in-a-box
President’s Advisory Council on Financial Literacy. (2009). 2008 Annual Report to the President Executive Summary. Retrieved from https://www.treasury.gov/about/organizational-structure/offices/Domestic-Finance/Documents/exec_sum.pdf
Ryan, B. (2014). Starved of Financing, New Businesses Are in Decline. Retrieved January 2, 2017, from http://www.gallup.com/businessjournal/175499/starved-financing-new-businesses-decline.aspx
The Economist. (2015). More Is Less. Retrieved from http://www.economist.com/news/united-states/21661008-more-less
U.S. Department of Education. (n.d.). Every Student Succeeds Act (ESSA). Retrieved from http://www.ed.gov/ESSA
U.S. Small Business Administration. (2015). Small Business Market Update, June 2015. Retrieved from https://www.sba.gov/sites/default/files/Small_business_bulletin_June_2015.pdf
U.S. Small Business Administration. (2016). Minority Business Ownership: Data from the 2012 Survey of Business Owners. Retrieved from https://www.sba.gov/sites/default/files/advocacy/Minority-Owned-Businesses-in-the-US.pdf
U.S. Small Business Administration. (2016). Small Business Profile. Retrieved from https://www.sba.gov/sites/default/files/advocacy/all_profiles_10_18_16.pdf
United States Census Bureau. (2015). School Enrollment. Retrieved from https://www.sba.gov/sites/default/files/advocacy/Millenial_IB.pdf
Wilmoth, D. (2016). The Missing Millennial Entrepreneurs. Retrieved from https://www.census.gov/hhes/school/data/cps/2015/tables.html
Witters, D., Agrawal, S., & Brown, A. (2012). Entrepreneurship Comes With Stress, But Also Optimism. Retrieved January 2, 2017, from http://www.gallup.com/poll/159131/entrepreneurship-comes-stress-optimism.aspx
Yannelis, C. (2015). A crisis in student loans? How changes in the characteristics of borrowers and in the institutions they attended contributed to rising loan defaults.

