the 2015 national retail security survey ...users.clas.ufl.edu/rhollin/nrf 2015 nrss_rev5.pdf4 the...
TRANSCRIPT
THE 2015 NATIONAL RETAILSECURITY SURVEY
SPONSORED BY
JUNE 2015
2
CONTENTS
Letter from NRF and the University of Florida__________________________________________
I. Introduction and Methodology_____________________________________________________
II. Summary of Key Findings_________________________________________________________
III. Inventory Shrinkage______________________________________________________________
IV. Staffing and Budget for the Loss Prevention Budget___________________________________
V. Employee Integrity Screening______________________________________________________
VI. Loss Prevention Awareness and Training Programs____________________________________
VII. Dishonest Employees____________________________________________________________
VIII. External Retail Crime_____________________________________________________________
3
4
6
7
9
13
14
17
19
PAGE
For additional study findings, please see the National Retail Security Survey Appendix on NRF.com.
Copyright 2015 by NRF and the University of Florida. All rights reserved. This publication may not be reproduced, stored in any information retrieval system or transmitted in whole or in part by any means – electronic, mechanical, photocopying, recording or otherwise – without the express written permission of NRF.

Dear Loss Prevention Executive,
For over 20 years the industry has recognized the National Retail Security Survey (NRSS) as a key benchmark for retail loss prevention. This retail security research project studies numerous elements of workplace-related criminality, along with identifying successful security countermeasures to protect people, assets and brands in the retail industry.
Now in its 24th year, the NRSS is a nationwide annual study comprising the most recent empirical data on retail Loss Prevention. The University of Florida and NRF have partnered for over a decade to conduct this industry standard research, which covers retail protection issues across inventory shrinkage, employee integrity screening, awareness programs, external retail crime and more.
The 2015 NRSS is the result of a new strategic alliance jointly conducted by Dr. Richard Hollinger of the University of Florida and the National Retail Federation. We have streamlined the study to produce a more user-friendly survey results report that includes updated charts and a summary of key findings.
A big thank you to all of the companies who participated in this research. As you know, your participation as a retailer is vital, and directly builds the value for both you and the retail industry to understand the current landscape of retail loss prevention. The NRSS study is an invaluable tool for the retail and solution provider communities and our law enforcement partners, as well as for legislative efforts that impact retail crime and media awareness campaigns. We look forward to working with you for years to come.
We are very grateful to Dr. Hollinger at the University of Florida for the many years that he has invested his time, insights and counsel for this study. We also wish to express our thanks to our study sponsor, The Retail Equation, for underwriting the 2015 NRSS.
Please feel free to contact Bob Moraca at [email protected] or Dr. Hollinger at [email protected] if you have any questions or feedback about this study.
Warmest regards,
Vicki Cantrell SVP, NRF Communities National Retail Federation
Dr. Richard Hollinger, Professor, Department of Sociology and Criminology & Law University of Florida
Bob Moraca VP Loss Prevention National Retail Federation
3

4
The 2015 National Retail Security Survey
I. Introduction and Methodology
The 2015 National Retail Security Survey (“NRSS”) is a study that is jointly conducted by Dr. Richard Hollinger of the University of Florida and the National Retail Federation. Building on many years of collaboration, this study develops and analyzes retail loss prevention benchmarks to examine, among other topics:
• Inventory shrinkage • Staffing and budget for the loss prevention department • Employee integrity screening • Loss prevention training and awareness programs • Dishonest employees • External retail crime
Our deep thanks to Dr. Hollinger at the University of Florida for his long-standing partnership on this study, as well to The Retail Equation for underwriting the 2015 NRSS study.
Methodology
The 2015 NRSS was conducted from March 24 to April 30, 2015, via SurveyMonkey. Retailers could participate anonymously. Retailer survey participants were sent an e-mail invitation with a link to the survey. We also encouraged retailers to participate via the NRF LP Council, advertising banner in D&D Daily and personal outreach from Dr. Richard Hollinger (University of Florida) and Robert Moraca (NRF).
A total of 100 retailers participated in the 2015 National Retail Security Survey; not all companies answered all questions. Additionally, in our analysis of the data for each question, we removed select instances of extreme outliers that distorted the overall results. The sample size for each individual question is noted in the respective chart or text.
We have segmented the data results where possible (see the separate Appendix for a summary). Four categories – department stores, grocery and supermarkets, men’s and women’s specialty apparel, and sporting goods and recreational products – had over nine respondents each, allowing us to segment data for these verticals. Please keep in mind small
sample sizes for some of the segmented data, as not all retailers in a given category answered every survey question.
Use of “average” and “median” To provide readers with more detailed insights and the ability to better compare their own metrics to the aggregated survey results, we usually cite both average and median results. According to Merriam-Webster:
Average is “a number that is calculated by adding quantities together and then dividing the total number by the number of quantities.” Depending on the extremes (large or small) in a given data set, the average may be at some distance from the data set midpoint (median).
Median is the “middle value in a series of values arranged from smallest to largest.” Whereas the average can be swayed by values at either end of the spectrum, the median gives a sense of the mid-point in a given data series.

5
2015 Survey Overview and Methodology: National Retail Security Survey Retailer Participant Profile
2015 Survey Overview and Methodology: National Retail Security Survey Retailer Participant Profile
Retail Market Categories Represented
Retailer Respondents
Source: National Retail Security Survey conducted by the National Retail Federation and the University of Florida. March 24 to April 30, 2015 (N = 100)
Source: National Retail Security Survey conducted by the National Retail Federation and the University of Florida. March 24 to April 30, 2015 (N = 100)
– Auto parts, tires and accessories – 1.0%– Books, magazines and music – 1.0%– Cards, gifts, floral and novelties – 1.0%– Consumer electronics, computers and appliances – 2.0%– Convenience store or truck stop – 1.0%– Crafts and hobbies – 2.0%– Department store – 11.0%– Discount, mass merchandise or supercenter – 7.0%– Drug store or pharmacy – 3.0%– Furniture – 3.0%– Grocery and supermarkets – 9.0%– Home improvement, building, hardware, lumber and garden supply – 4.0%– Household furnishings and housewares – 2.0%
Number of Stores Less than 50 stores – 10.4%50 to 200 stores – 28.1%201 to 500 stores – 20.8%501 to 1,000 stores – 12.5%1,001 to 2,000 stores – 17.7%More than 2,000 stores – 10.4%
Total Employees – Store Level (Managers & Sales Associates) 100,000 or more – 11.0%50,000 to 99,999 – 9.6%10,000 to 49,999 – 24.7%5,000 to 9,999 – 13.7%2,500 to 4,999 – 16.4%1,000 to 2,499 – 15.1%Up to 999 – 9.6%
– Jewelry and watches – 3.0%– Liquor, wine, beer or tobacco products – 2.0%– Optical goods and services – 1.0%– Pets and animal supplies – 1.0%– Shoes and footwear – 4.0%– Specialty children’s apparel – 3.0%– Specialty women’s apparel – 4.0%– Specialty men’s and women’s apparel – 13%– Sporting goods and recreational products – 9.0%– Toys – 2.0%– Warehouse club – 1.0%– Other (including music, restaurant, garden, theme park, etc.) – 10.0%
Total Employees – Company-Wide 100,000 or more – 12.5%50,000 to 99,999 – 12.5%10,000 to 49,999 – 32.5%5,000 to 9,999 – 13.8%
FY 2014 Sales Volume $99 million or less – 2.6%$100 million to $499 million – 13.0%$500 million to $999 million – 16.9%$1 billion to $2.49 billion – 23.4%
$2.5 billion to $4.9 billion – 16.9%$5 billion to $9.9 billion – 10.4%$10 billion to $24.9 billion – 7.8%$25 billion to $49 billion – 5.2%$50 billion or more – 3.9%
2,500 to 4,999 – 10.0%1,000 to 2,499 – 13.8%Up to 999 – 5.0%

6
II. Summary of Key Findings
Retailers surveyed reported an average shrinkage of 1.38% at retail in 2014. Out of total retail sales of $3.19 trillion in 2014, inventory shrink represented $44.02 billion in lost sales revenue to retailers last year.
Average shrinkage rates decreased or remained flat for almost two-thirds of retailers surveyed (62.7%).
Retailers surveyed estimate that internal and external theft each account for over one-third of inventory shrinkage in 2014. The balance is made up of administrative and paperwork error, vendor fraud or error and unknown loss.
Loss prevention budgets in 2014 averaged less than 1% of total 2014 sales. Over one-third (39.4%) of retailers we surveyed reported that their loss prevention budget in 2015 is increasing over 2014 levels.
Company-wide loss prevention programs in 2014 averaged 246 team members, with a median size of 22. Grocery stores and supermarkets surveyed averaged 162 team members, whereas department stores averaged 632 staff members.
Loss prevention management staff is diversifying. Across retailers surveyed, an average of 23.1% of LP manager-level or higher staff is filled by women. On average, almost one in 10 LP management level staff is Latino, 7.7% is African-American and 2.6% is Asian-Pacific.
Retailers use numerous means to develop employee awareness about loss prevention. Most prevalent across retailers surveyed are anonymous telephone “hotlines,” discussing the topic during new hire orientation, codes of conduct, posted notices and training videos, among other awareness programs.
Burglar alarms, digital video recorders and armored car deposit pickups are loss prevention systems used almost universally by retailers surveyed.
Dishonest employee incidents in 2014 were most likely to result in apprehensions, terminations, prosecutions and civil demands. Retailers surveyed reported that dishonest employee incidents each cost retailers on average $1,547.
In 2014, shoplifting incidents were most likely to result in apprehension and – to somewhat lesser degree – prosecution. Just one-third of retailers surveyed allow non-loss prevention staff to make shoplifting apprehensions, but several noted that only trained staff were authorized to do so. Across retailers surveyed, the average dollar loss per shoplifting incident in 2014 was $318.
The average dollar loss per robbery incident was $2,465.

7
Inventory shrinkage averaged 1.38% at retail; 3 out of 10 report higher levels
Q: For fiscal year 2014, what was your company’s inventory shrinkage percentage (%) calculated at retail? Be sure to report shrinkage based on retail sales. (For example 0.9%, 1.3%, 2.45%, etc.) (n = 76)
Inventory Shrinkage % at Retail Average = 1.38%Median = 1.18%
15.8%
15.8%
18.4%13.2%
10.5%
6.6%
19.7%
3% and higher
Between 2% and 2.99%
Between 1.5% and 1.99%
Between 1.25% and 1.49%
Between 1% and 1.24%
Between 0.50% and .99%
0.49% and below
III. Inventory Shrinkage
Figure 1. Average Inventory Shrinking at Retail in 2014
Retailers surveyed reported average shrinkage of 1.38% at retail in 2014, with a median of 1.18%. However, three out of 10 (30.3%) reported a higher average for their shrinkage. This average shrink rate represented $44.02 billion for U.S. retail in 2014.
Grocery stores and supermarkets surveyed reported the highest average shrinkage calculated at retail across the four categories for which we were able to segment results: 3.23% (median of 2.71%). By contrast, men’s and women’s specialty apparel retailers and department stores surveyed experienced shrinkage of 1.22%, while sporting goods and recreational products retailers reported somewhat lower shrinkage at 1.17%.
Retailers who operate between 1,001 and 2,000 stores reported an average 1.72% (median: 1.22%) shrinkage, whereas for retailers surveyed at the far end of the spectrum (2,000 stores or more) the average shrinkage was 1.23%.
Source: National Retail Security Survey conducted by the National Retail Federation and the University of Florida. March 24 to April 30, 2015 (N = 100)

8
Average shrinkage rates decreased or remained flat for more than six out of 10 retailers. Overall, almost two-thirds of retailers surveyed noted that their shrinkage rates in 2014 either decreased (42.2%) or remained flat (20.5%), reflecting success in implementing anti-theft measures, training and internal processes to reduce shrinkage and its impact to the bottom line. (See Appendix on nrf.com.)
Men’s and women’s specialty apparel retailers and department store results were largely in line with retailers overall. However, five out of the seven sporting goods retailers – as well as four out of six grocery stores and supermarkets – who reported on shrink trends noted more of an increase in shrinkage.
Among companies operating over 2,000 stores, six out of nine saw a decrease in their shrinkage rate in 2014.
Figure 2. Sources of Inventory Shrinkage in 2014
Shoplifting, employee theft, admin error are leading sources of inventory shrinkage
Q: Based upon your actual investigations, what is your best estimate of the proportion of inventory shrinkage (merchandise only) attributable to the following sources? (Remember that your responses across the following shrinkage sources must total 100%) (NB - Since these are averages, they do not total exactly 100%) (n = 67)
Sources of Inventory Shrinkage (Average)
% Vendor fraud or error
% Unknown loss
% Shoplifting/external (including ORC) % Employee
theft / internal
% Administrative and paperwork error
6.8%6.1%
38.0%34.5%
16.5%
Source: National Retail Security Survey conducted by the National Retail Federation and the University of Florida. March 24 to April 30, 2015 (N = 100)

9
Both internal and external theft are leading sources of inventory shrinkage, each accounting for approximately one-third of inventory shrinkage among retailers surveyed in 2014. 2014 also marks the first time in this study that retailers estimate that shoplifting accounts for more inventory shrink than employee theft. The averages vary somewhat between categories. For example:
Men’s and women’s specialty apparel retailers attribute less shrinkage than average to employee theft (average of 28.1%) and somewhat more than average to shoplifting, including organized retail crime (ORC) (average of 49.8%).
Grocery stores and supermarkets experienced somewhat lower average shrinkage due to shoplifting (29.67%, compared with industry average 38.0%) and due to employee theft (27.5%, compared with industry average 34.5%).
Shrinkage due to administrative or paperwork error varies. Grocery stores and supermarkets surveyed reported higher than average shrinkage due to administrative and paperwork error (18.67%, compared with 16.5% overall), whereas sporting goods retailers attribute just 13.0% of shrinkage to this source.
Vendor fraud or error is a smaller source of shrinkage overall (average of 6.8%), but appears lower among sporting goods (3.2%) and men’s and women’s specialty apparel retailers (3.4%) and higher for department stores (10%).
IV. Staffing and Budget for the Loss Prevention DepartmentSecurity and loss prevention budgets are either greater or flat this year compared to last for three-quarters of retailers surveyed. Almost two out of five (39.4%) of retailers we surveyed note that their loss prevention budget in 2015 is increasing, mostly somewhere between 1% and 19% over 2014 levels. Almost as many again (36.6%) noted that their budget will remain flat year over year. Nevertheless, 23.9% are contending with a lower budget this year than last. (See Appendix on nrf.com.)
Grocery stores and supermarkets surveyed are all working with either flat (three out of six) or somewhat increased (three out of six) LP budgets this year.
Men’s and women’s specialty apparel retailers are generally working with flat LP budgets (seven out of 11), while three out of 11 are working with less budget than in 2014.
Retailers operating between 1,001 and 2,000 stores are just as likely to see increased and decreased budgets this year (41.7% each), whereas those operating over 2,001 stores are more likely to see their LP budgets increase (44.4%) or stay flat (33.3%) compared to last year.
39.4%+ Almost two out of five retailers we surveyed note that their loss prevention budget in 2015 is increasing.

10
Figure 3. Security and Loss Prevention Budget as a Percentage of 2014 Sales
Individual components of retailer security and loss prevention budgets average under 0.5% of sales
Q: As a percentage of your 2014 sales, what is the size of your budget for security & loss prevention? (n = 53)
Security & Loss Prevention Budget – as % of 2014 SalesAverage Median Maximum
LP budgets in 2014 averaged less than 1% of overall 2014 sales. Average Security and Loss Prevention budgets in 2014 averaged well under 1% of FY14 sales for payroll expenses, other non-capital expenses and capital expenses. There was some variation in the size of average security and loss prevention budgets as a percentage of overall 2014 sales, including:
Men’s and women’s specialty apparel retailers – average of 0.63% of overall 2014 sales
Department stores – average of 0.53%
Grocery stores and supermarkets – average of 0.36%
Source: National Retail Security Survey conducted by the National Retail Federation and the University of Florida. March 24 to April 30, 2015 (N = 100)
Maximum 1.5% Maximum 1.0% Maximum 1.0%
Maximum 2.50%
Maximum
0.00%
0.50%Average
% Payroll expenses % Other non capital expenses
% Capital expenses % Overall
Median
AverageMedian
1.00%
1.50%
2.00%
0%
2.0%
4.0%
6.0%
0.11%0.22%
0.13% 0.07% 0.04%0.14%0.30%
0.42%AverageAverage
BudgetBudget
Median Median
11
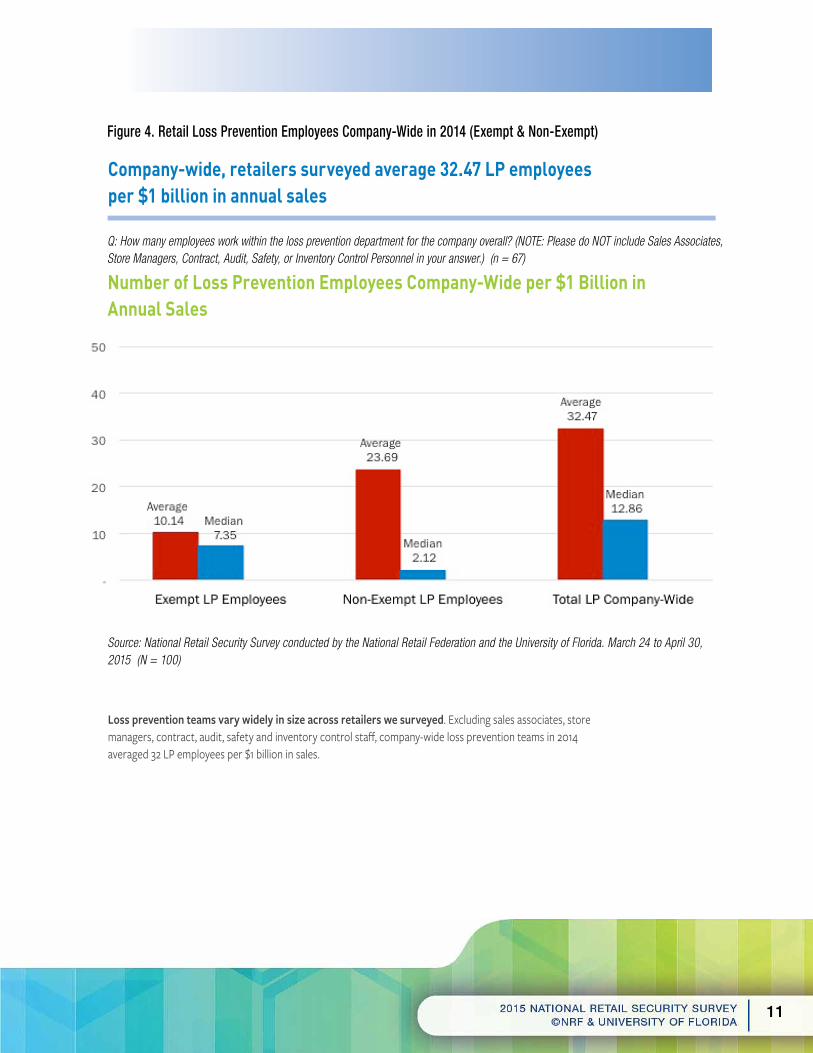
Company-wide, retailers surveyed average 32.47 LP employees per $1 billion in annual sales
Q: How many employees work within the loss prevention department for the company overall? (NOTE: Please do NOT include Sales Associates, Store Managers, Contract, Audit, Safety, or Inventory Control Personnel in your answer.) (n = 67)
Number of Loss Prevention Employees Company-Wide per $1 Billion in Annual Sales
Figure 4. Retail Loss Prevention Employees Company-Wide in 2014 (Exempt & Non-Exempt)
Loss prevention teams vary widely in size across retailers we surveyed. Excluding sales associates, store managers, contract, audit, safety and inventory control staff, company-wide loss prevention teams in 2014 averaged 32 LP employees per $1 billion in sales.
Source: National Retail Security Survey conducted by the National Retail Federation and the University of Florida. March 24 to April 30, 2015 (N = 100)

12
Loss prevention management staff is diversifying in terms of demographics.
Retailers surveyed reported an average of 23.1% of LP manager-level or higher staff positions are filled by women.
Men’s and women’s specialty retailers report an average of 38.39% of their LP management team is now staffed by women.
An average of 7.7% of African-Americans constitute LP manager-level or higher staff among retailers surveyed.
Latinos make up almost one in 10 (9.7%) manager-level or higher staff within retail LP teams.
Men’s and women’s specialty retailers note that an average of 20.2% of their LP management teams are Latino.
Fewer Asian-Pacific individuals currently staff manager-level or higher positions within LP among retailers surveyed (average of 2.6%).
Women make up an average of 1 in 4 LP management employees
Q: What is the percentage of the following groups in positions of LP manager and above? (n = 57)
Groups Represented in Positions of LP Manager or Higher
Figure 5. LP Management – Representation by Demographic Groups in 2014
Source: National Retail Security Survey conducted by the National Retail Federation and the University of Florida. March 24 to April 30, 2015 (N = 100)

13
Criminal conviction checks and multiple interviews are leading employee integrity screening options
Q: What are the employee screening options that your company currently utilizes? (Please check all that apply). (n = 73)
V. Employee Integrity Screening
Figure 6. Employee Integrity Screening Options Used by Retailers in 2014
In 2014, retailers used numerous employee integrity screening options. Options used by retailers surveyed include criminal conviction checks, multiple interviews, verifying past employment history, personal reference checks and drug screening via a laboratory, among others.
While criminal conviction checks were top of the list of options used, different categories rely on additional screening options more than others. For example:
Men’s and women’s specialty apparel retailers used criminal conviction checks (91.7%), personal reference checks (91.7%) and past employment history verification (83.3%) more heavily than the average.
Similarly, grocery stores and supermarkets all (six out of six surveyed) used criminal conviction checks, multiple interviews and employment history verification. Five out of six of these retailers surveyed also used drug screening and personal reference checks to screen applicants.
Five out of five sporting goods retailers conducted criminal conviction checks and also checked the applicant’s driving history, while four out of five used laboratory drug screening, multiple interviews and past employment history verification.
Department stores surveyed placed emphasis on multiple interviews and criminal conviction checks (six out of six), whereas credit checks and driving history were only cited by one out of six.
89.0%
86.3%
72.6%
61.6%
60.3%
49.3%
43.8%
4.1%
0.0%
1.4%
16.4%
12.3%
28.8%
28.8%Source: National Retail Security Survey conducted by the National Retail Federation and the University of Florida. March 24 to April 30, 2015 (N = 100)

14
VI. Loss Prevention Awareness and Training Programs
Figure 7. Loss Prevention Awareness Programs Used by Retailers in 2014
Communication, training, hotlines and incentives are key to retail employee awareness about loss prevention
Q: What are the loss prevention awareness programs that your company currently utilizes? (Please check only those in which loss prevention material is incorporated.) (n = 74)
Retailers use numerous means to develop employee awareness about loss prevention. Last year, approximately nine out of 10 retailers surveyed offered employees an anonymous telephone “hotline” (94.6%), reviewed the issue and procedures during new hire orientation (90.5%), codified loss prevention issues as part of a company code of conduct (90.5%) and posted information for employees on bulletin board notices and posters (87.8%).
Men’s and women’s specialty apparel retailers were more likely than average to use training videos about loss prevention for their employees (83.3%, versus 71.6% overall). Additionally, these retailers also used anonymous online /
0% 20% 40% 60% 80% 100%
email notification (75%, versus 55.4% overall) and online communications (75%, versus 55.4%) more than retailers in other categories.
In addition to the hotline, bulletin board notices, code of conduct, new hire orientation and other measures, all of the department stores surveyed (six out of six) also use Active Shooter training programs and honesty incentives. In-store employee loss prevention committees are also in place at four of the six.
Grocery stores and supermarkets were more likely than average to use Internet-based interactive or CD-ROM training (five out of six surveyed).
94.6%
90.5%
90.5%87.8%
71.6%
66.2%55.4%
55.4%
54.1%54.1%
51.4%
44.6%
37.8%
28.4%
27.0%8.1%
6.8%
Source: National Retail Security Survey conducted by the National Retail Federation and the University of Florida. March 24 to April 30, 2015 (N = 100)
Anonymous telephone “hotline”
Discussion during new hire orientation
Code of conduct
Bulletin board notices and posters
Training videos
Active shooter training program
Internet, web-based communications
Anonymous online/email notification system
Newsletters
Honesty incentives (e.g. cash & gifts)
Periodic programs and lectures
Internet interactive or CD-ROM training
In store, employee LP committees
Employees surveys about LP issues
Training audio/announcements
Paycheck stuffers
Other

15
57.5%
50.7%
50.7%
50.7%
49.3%
41.1%
41.1%
38.4%
35.6%
34.2%
100%
93.2%
90.4%
75.3%
69.9%
67.1%
65.8%
64.4%
60.3%
60.3%
Alarms, video, armored car, data mining, tags and guards among various LP systems usedQ: Which of the following loss prevention systems does your company currently utilize? (Please check all that apply.) (n = 73)
In 2014, retailers used a broad range of loss prevention systems, among those:
–Burglar alarms (100%)
–Digital video recorders (93.2%)
–Armored car deposit pick-ups (90.4%)
Three-quarters (75.3%) also used live customer-visible closed circuit TV (CCTV), and almost as many used point-of-sale (POS) data mining (69.9%).
Not surprisingly, retailers in different categories are more likely to use some systems than others, such as:
Acousto-magnetic, electronic security tags. All of the retailers surveyed in the men’s and women’s specialty apparel and sporting goods categories use this system, while just one-third (two out of six) of department stores surveyed have implemented them.
Figure 8a. Loss Prevention Systems that Retailers Used in 2014
Ink / dye benefit denial tags. All of the sporting goods retailers surveyed use these tags, while only half of men’s and women’s specialty apparel retailers and department stores surveyed do so.
POS data mining. All grocery stores and supermarkets surveyed use this tactic (six out of six), as do all sporting goods stores surveyed (five out of five). By contrast, just two-thirds (four out of six) of department stores surveyed and half of men’s and women’s specialty apparel retailers use POS data mining.
Shoplifting deterrence signage. Just one out of five sporting goods retailers surveyed and no grocery stores and supermarkets surveyed have posted signs warning about shoplifting and its consequences, compared with two-thirds of department stores surveyed (four out of six) and one-third of men’s and women’s specialty apparel retailers.
Source: National Retail Security Survey conducted by the National Retail Federation and the University of Florida. March 24 to April 30, 2015 (N = 100)
16
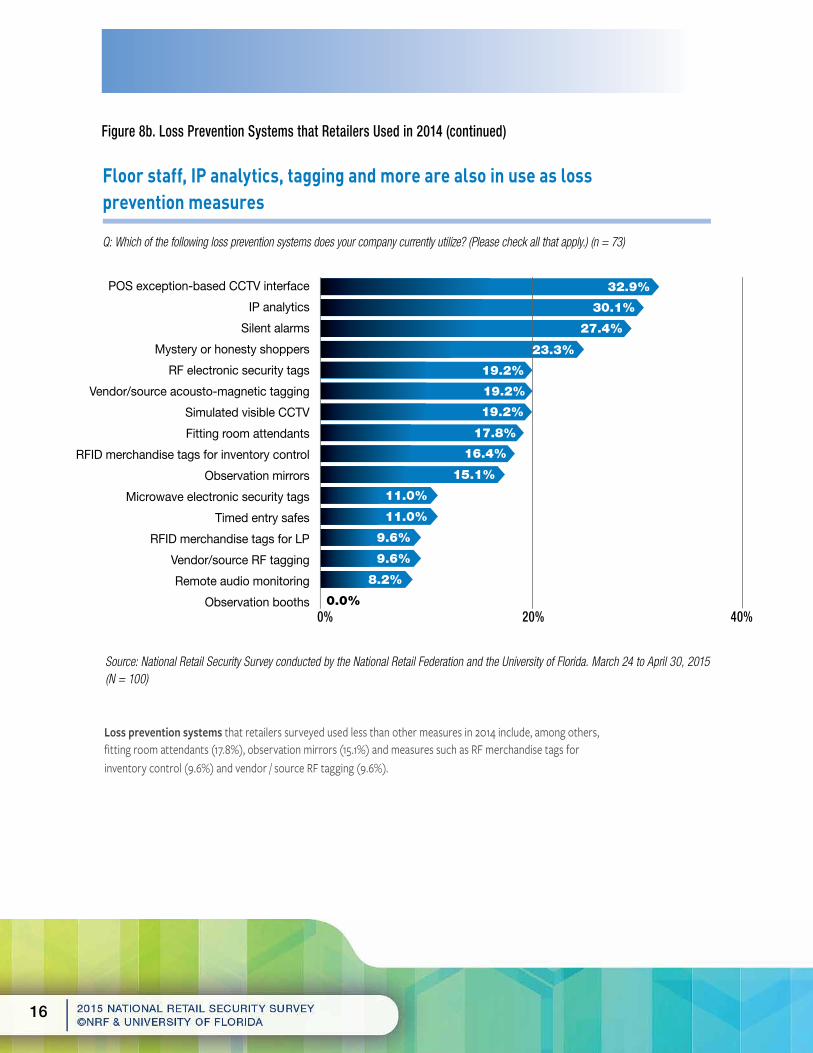
Loss prevention systems that retailers surveyed used less than other measures in 2014 include, among others, fitting room attendants (17.8%), observation mirrors (15.1%) and measures such as RF merchandise tags for inventory control (9.6%) and vendor / source RF tagging (9.6%).
Figure 8b. Loss Prevention Systems that Retailers Used in 2014 (continued)
Q: Which of the following loss prevention systems does your company currently utilize? (Please check all that apply.) (n = 73)
Floor staff, IP analytics, tagging and more are also in use as loss prevention measures
32.9%
30.1%
27.4%
23.3%
19.2%
19.2%
19.2%
15.1%
11.0%
11.0%
9.6%
9.6%
8.2%
0.0%
17.8%
16.4%
Source: National Retail Security Survey conducted by the National Retail Federation and the University of Florida. March 24 to April 30, 2015 (N = 100)
0% 20% 40%

17
Dishonest employee incidents in 2014 resulted in apprehensions and terminations, among other actions taken. Retailers surveyed reported an average of 834 apprehensions in 2014, though the median was much lower at 159. Not far behind, the median number of terminations last year was 141 per retailer surveyed.
Men’s and women’s specialty apparel retailers reported an average of 446 apprehensions in 2014, with a median of 63. The median number of terminations was 135 per company surveyed in this category. By contrast, these retailers were also less likely to have made prosecutions (median 15) or civil demands (median 5).
Department stores surveyed saw a median of 362 apprehensions per company, and almost the same median number of terminations (343.5). Department stores surveyed were also much more likely to have made prosecutions (median 175) and civil demands (median 174).
Grocery stores and supermarkets surveyed made a median 327.5 apprehensions last year, and somewhat fewer terminations (median 247). Much like department stores, grocery and supermarket retailers were also more likely than overall respondents to have made prosecutions (median 125).
VII. Dishonest Employees
Figure 9. Dishonest Employees – Number of Apprehensions, Terminations, Civil Demands Made in 2014
Dishonest employee incidents were most likely to result in apprehension and termination
Q: How many dishonest employee apprehensions, terminations, prosecutions and civil demands were made in 2014? (n = 63)
Dishonest Employees – Actions Taken in 2014
Source: National Retail Security Survey conducted by the National Retail Federation and the University of Florida. March 24 to April 30, 2015 (N = 100)

18
Dishonest employee cases cost retailers a median of $731 per case – or an average twice that amount ($1,547).
Men’s and women’s specialty apparel retailers surveyed experienced a median loss of $700 per dishonest employee case.
By contrast, the median loss per case for department stores surveyed was $1,728.50, more than double for men’s and women’s specialty apparel.
Given generally lower price points, grocery stores and supermarkets reported a lower average ($513.17) and median loss ($235) than other categories.
Figure 10. Dollar Loss per Dishonest Employee Incident in 2014
The median dollar loss per dishonest employee case in 2014 was around $730
Q: What is the average dollar loss per dishonest employee case? (n = 62)
Average $ Loss per Dishonest Employee Case Average = $1,546.83Median = $730.92
$5,000 and above
Up to $249
Between $250 & $399
Between $400 & $499
Between $750 & $999
Between $1,000 & $1,999
Between $2,000 & $4,999
Between $500 & $749
6.5%11.3%11.3%
9.7%
14.5%
16.1%14.5%
16.1%
Source: National Retail Security Survey conducted by the National Retail Federation and the University of Florida. March 24 to April 30, 2015 (N = 100) [Note: Data is not weighted by the number of cases per respondent.]
19
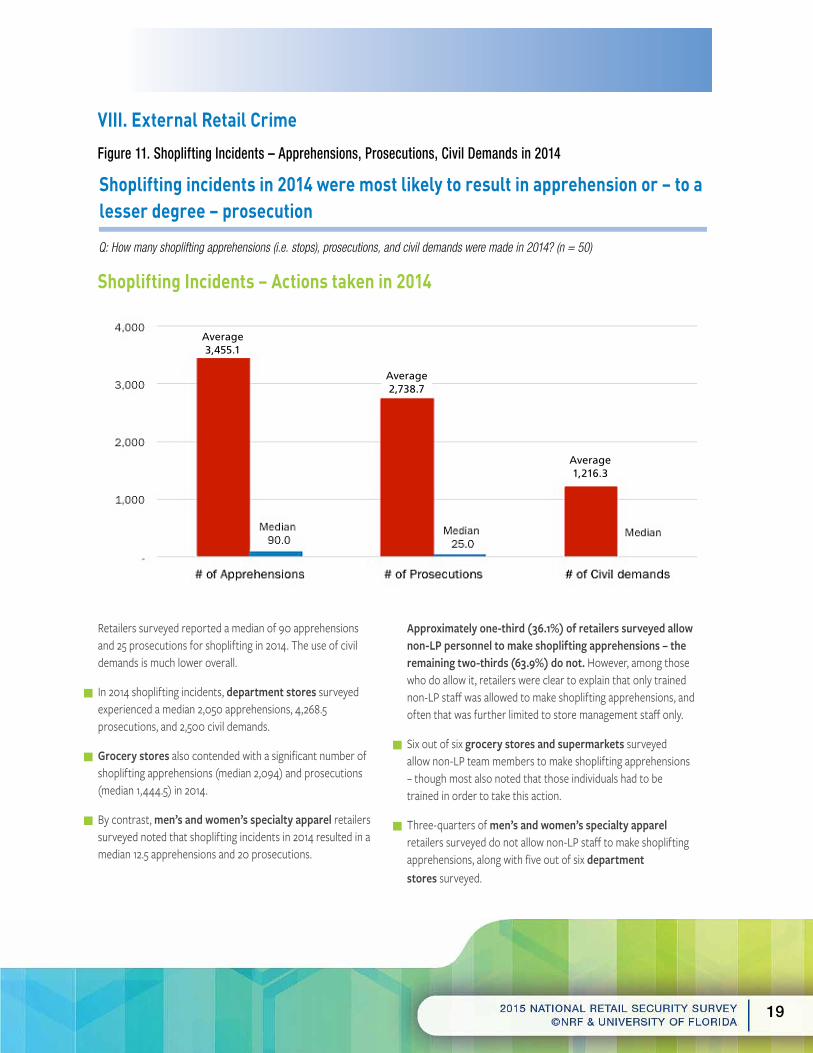
Shoplifting incidents in 2014 were most likely to result in apprehension or – to a lesser degree – prosecution
Q: How many shoplifting apprehensions (i.e. stops), prosecutions, and civil demands were made in 2014? (n = 50)
VIII. External Retail Crime
Figure 11. Shoplifting Incidents – Apprehensions, Prosecutions, Civil Demands in 2014
Retailers surveyed reported a median of 90 apprehensions and 25 prosecutions for shoplifting in 2014. The use of civil demands is much lower overall.
In 2014 shoplifting incidents, department stores surveyed experienced a median 2,050 apprehensions, 4,268.5 prosecutions, and 2,500 civil demands.
Grocery stores also contended with a significant number of shoplifting apprehensions (median 2,094) and prosecutions (median 1,444.5) in 2014.
By contrast, men’s and women’s specialty apparel retailers surveyed noted that shoplifting incidents in 2014 resulted in a median 12.5 apprehensions and 20 prosecutions.
Approximately one-third (36.1%) of retailers surveyed allow non-LP personnel to make shoplifting apprehensions – the remaining two-thirds (63.9%) do not. However, among those who do allow it, retailers were clear to explain that only trained non-LP staff was allowed to make shoplifting apprehensions, and often that was further limited to store management staff only.
Six out of six grocery stores and supermarkets surveyed allow non-LP team members to make shoplifting apprehensions – though most also noted that those individuals had to be trained in order to take this action.
Three-quarters of men’s and women’s specialty apparel retailers surveyed do not allow non-LP staff to make shoplifting apprehensions, along with five out of six department stores surveyed.
Shoplifting Incidents – Actions taken in 2014
Average2,738.7
Average1,216.3
Average3,455.1

20
Shoplifting incidents drive very real dollar losses for retailers at an average of $318 and a median of $165.
Department stores suffered an average per incident loss of $482.50, while men’s and women’s specialty apparel retailers lost an average of $397.23 per incident.
Grocery stores and supermarkets reported an average loss of $96.83 per shoplifting incident in 2014.
Figure 12. Dollar Loss per Shoplifting Incident in 2014.
The average dollar loss per shoplifting incident in 2014 was $318
Q: What is your company’s average dollar loss per shoplifting incident? (n = 49) [Note: Data is not weighted by the number of incidents per respondent.]
Average $ Loss per Shoplifting Incident Average = $317.84Median = $165
$1000 and over
$1 to $49
$50 to $99
$200 to $299
$300 to $499
$500 to $999
$100 to $124
$125 to $149 $150 to $199
8.2%
10.2%
4.1%
6.1%
20.4%
16.3%
12.2%
12.2%
10.2%
$Source: National Retail Security Survey conducted by the National Retail Federation and the University of Florida. March 24 to April 30, 2015 (N = 100)

21
Figure 13. Number of Robberies that Retailers Experienced in 2014
Retail robberies in 2014 resulted in an average loss of $2,465
Q: How many robberies did your company experience in 2014? (n = 58 and 32 respectively)
Robberies drive further losses for retailers. Across all retailers surveyed, companies reported an average loss of $2,465 per robbery in 2014. This figure was slightly higher among specialty men’s and women’s apparel retailers, who noted an average loss of $2,651 per robbery.
Number of Robberies per $1 Billion in Sales in FY 2014 Average $ Loss per Robbery
Source: National Retail Security Survey conducted by the National Retail Federation and the University of Florida. March 24 to April 30, 2015 (N = 100)
For additional data findings from the 2015 National Retail Security Survey, please see the Appendix, available on the NRF.com site.
Averagenumber of
robberies per $1 billion sales
3.2
Mediannumber of
robberies per $1 billion sales
0.92
$500 to $999
18.8%
NRF is the world’s largest retail trade association, representing discount and department stores, home goods and specialty stores, Main Street merchants, grocers, wholesalers, chain restaurants and Internet retailers from the United States and more than 45 countries. Retail is the nation’s largest private sector employer, supporting one in four U.S. jobs – 42 million working Americans. Contributing $2.6 trillion to annual GDP, retail is a daily barometer for the nation’s economy. NRF’s This is Retail campaign highlights the industry’s opportunities for life-long careers, how retailers strengthen communities, and the critical role that retail plays in driving innovation. nrf.com
National Retail Federation
1101 New York Avenue NW, Washington, DC 20005 Telephone (800) 673-4692 or (202) 783-7971
University of Florida
3219 Turlington Hall, P. O. Box 117330, Gainesville, FL 32611 Telephone (352) 392-0265
THE 2015 NATIONAL RETAILSECURITY SURVEY
SPONSORED BY
JUNE 2015