the 2015 general election - electoral reform … whilst the snp managed to translate support into...
TRANSCRIPT

THE 2015 GENERAL ELECTIONA voting system in crisisJESS GARL AND & CHRIS TERRY
FAIR FRANCHISE


CONTENTSIntroduction by Katie Ghose
1. A broken system: seats don’t match votes 7
2. Dividing the UK 13
3. Missing millions: the lost votes 21
4. The alternatives 25
Conclusion
Appendix
ELECTOR AL REFORM SOCIET Y 3

Phot
o: G
us
Palm
er
INTRODUCTIONMay 7th 2015 was, to say the least, an unpredictable result.
But we knew one thing well before polling day – it would also be an incredibly unrepresentative result.
Few parties saw their vote shares fairly reflected in terms of seats. The Greens and UKIP won nearly five million votes but re-ceived just two seats between them. Few can look at those figures and think that the voting system is working for our democracy.
This was the most disproportionate result in British election history1. Labour saw their vote share increase while their number of seats collapsed. The Conservatives won an overall majority on a minority of the vote, and the Liberal Democrats lost nearly all their seats – despite winning 8% of the vote. The SNP won 50% of the Scottish vote share, but 95% of Scottish seats.
Millions of voters are angry with a system that marginalises their views. Nearly half a million people signed petitions calling for electoral reform in the fortnight after the election – petitions which were handed in to 10 Downing Street by representatives from five political parties.
2015 must be the last General Election under our broken First Past the Post voting system, a system which is artificially dividing the UK by exaggerating political differences and leaving millions of voters without representation – the worst kind of postcode lottery.
This report – a comprehensive analysis of the election under a voting system in crisis, and the first study revealing what the results would have been under alternative voting systems – offers a great deal of insight and new research into May 7th and the way forward for the UK’s democracy. We hope you find it a useful resource throughout this Parliament.
Katie Ghose, CEO, Electoral Reform Society
1 For the methodology on how this was calculated, see the Appendix
ELECTOR AL REFORM SOCIET Y 5

A BROKEN SYSTEM: SEATS DON’T MATCH VOTES
The 2015 election was from the outset always going to be unusual. This was the first post-war election held after a period of coalition government; the first in which seven parties shared airtime with each other; and the first in which, thanks to the introduction of fixed-term Parliaments, the date of the election was known years in advance (making the Prime Minister’s visit to the Palace purely for show). Whilst this most unusual of elections did not deliver the result the pollsters predicted, what it did deliver was a damning verdict on First Past the Post.
With another hung parliament expected by all pollsters, the result shocked many as the Conservative party secured enough seats to form a government with a slim majority. The one feature of the result that was not a surprise was the continued dysfunctional-ity of the electoral system. In the most disproportional election to date in the UK, millions voted for smaller parties only to see their efforts result in single-digit representation, and a majority govern-ment returned to Parliament on less than 37% of the vote and with the support of just 24% of the electorate. The two-party system has long been dead, but if the 2015 election is known for one thing, it will be for the entrenchment of multi-party politics across the whole of the UK.
The First Past the Post system continues to fail the British elec-torate, not only by failing to accurately reflect their wishes but by creating divisions which do not really exist. The electoral system is effectively splitting the Union, exaggerating differences to create national and regional divides. The Union survived Scotland’s independence referendum, but now the electoral system – and the artificial cleavages it creates at Westminster – is exacerbating the divides between the nations and regions of the UK.
1
ELECTOR AL REFORM SOCIET Y 7
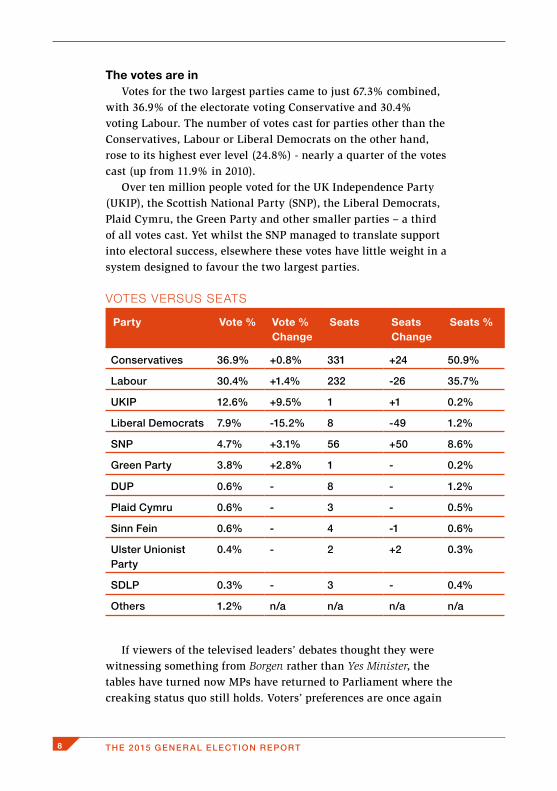
The votes are inVotes for the two largest parties came to just 67.3% combined,
with 36.9% of the electorate voting Conservative and 30.4% voting Labour. The number of votes cast for parties other than the Conservatives, Labour or Liberal Democrats on the other hand, rose to its highest ever level (24.8%) - nearly a quarter of the votes cast (up from 11.9% in 2010).
Over ten million people voted for the UK Independence Party (UKIP), the Scottish National Party (SNP), the Liberal Democrats, Plaid Cymru, the Green Party and other smaller parties – a third of all votes cast. Yet whilst the SNP managed to translate support into electoral success, elsewhere these votes have little weight in a system designed to favour the two largest parties.
VOTES VERSUS SEATS
Party Vote % Vote % Change
Seats Seats Change
Seats %
Conservatives 36.9% +0.8% 331 +24 50.9%
Labour 30.4% +1.4% 232 -26 35.7%
UKIP 12.6% +9.5% 1 +1 0.2%
Liberal Democrats 7.9% -15.2% 8 -49 1.2%
SNP 4.7% +3.1% 56 +50 8.6%
Green Party 3.8% +2.8% 1 - 0.2%
DUP 0.6% - 8 - 1.2%
Plaid Cymru 0.6% - 3 - 0.5%
Sinn Fein 0.6% - 4 -1 0.6%
Ulster Unionist Party
0.4% - 2 +2 0.3%
SDLP 0.3% - 3 - 0.4%
Others 1.2% n/a n/a n/a n/a
If viewers of the televised leaders’ debates thought they were witnessing something from Borgen rather than Yes Minister, the tables have turned now MPs have returned to Parliament where the creaking status quo still holds. Voters’ preferences are once again
THE 2015 GENER AL ELECTION REPORT8
not reflected in the make-up of the House of Commons. At both a UK wide level and also within the nations, votes bear little relation to seat share.
In 2010 the Conservative and Labour parties secured 65% of the vote and 87% of the seats. This year the system has delivered a similarly disproportional result for the two largest parties, with just over 67% of the vote resulting in nearly 87% of the seats for these two parties. The Conservatives and Labour have even greater disproportional sway in England and Wales, with 98% of the available seats between them on 72.6% of the vote.
Neither of the two largest parties has achieved anywhere close to 50% of the vote in the UK for over 40 years. That trend contin-ued in 2015, with the Conservative party now governing on less than 37% of the popular vote. It seems highly unlikely that either party will return to their previous levels of support. Multi-party politics looks firmly established in the UK and yet we continue to use an electoral system designed for a time when just two political parties shared nearly all the votes; a situation that has not existed in the UK for decades.
The lottery electionWestminster election results are becoming not only increasingly
disproportional but also more random, with results reflecting more of a lottery than a true representation of the vote. When several parties gain significant support, the First Past the Post (FPTP) elec-toral system behaves erratically and, as expected at this election, the combination of party fragmentation and FPTP has led to some strikingly irregular results.
Westminster election results are becoming not only increasingly disproportional but also more random
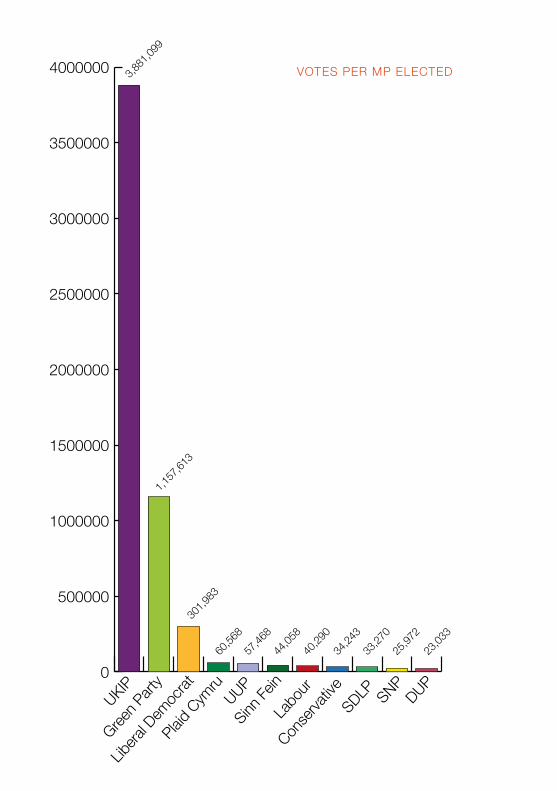
Support for UKIP surged at this election, making the party the third largest on vote share nationally (12.6%), overtaking the Liberal Democrats (who dropped from 23% to 7.9%). Yet this remarkable result delivered UKIP just one Member of Parliament. The Conservative party received three times as many votes but 331 times as many MPs.
ELECTOR AL REFORM SOCIET Y 9
0
500000
1000000
1500000
2000000
2500000
3000000
3500000
4000000
DUP
SNP
SDLP
Conse
rvative
Labo
ur
Sinn Fe
in
UUP
Plaid C
ymru
Libera
l Dem
ocrat
Green P
arty
UKIP
3,881
,099
1,157
,613
301,9
83
60,56
857
,468
44,05
840
,290
34,24
333
,270
25,97
223
,033
VOTES PER MP ELECTED

The SNP also had a great election in terms of vote share. They received 4.7% per cent of the national vote share (up from 1.7% in 2010) and 50% of the vote share in Scotland. This was indeed an impressive result, higher than Scottish Labour’s best figure of 49.9% in 1966 (which returned 46 out of 71 MPs). Yet this result was magnified and translated from a landslide into a tsuna-mi, resulting in 95% of Scottish seats. This leaves only three MPs (5% of the total) to reflect unionist support in Scotland – a body of opinion that received 55.3% of votes in the referendum in 2014. While the SNP have clearly gained support from ‘No’ voters as well as from the ‘Yes’ camp, that there is such a small unionist voice in Scotland is a further reflection of a broken electoral system.
The system exacerbates the regional polarisation of the electorate
The 2015 election has highlighted the randomness of FPTP when party votes fragment. There have been electoral injustices not just for smaller parties. Labour and the Conservatives, whilst the clear winners under the system in England, have been dealt an unfair hand in Scotland. Labour continues to be underrepresented in Southern England and the Conservatives likewise in the North. The system exacerbates the regional polarisation of the electorate.
The uneven results thrown up by the system can be illustrated by looking at how many votes were cast for the number of seats gained overall. The Green Party was able to work with the way FPTP rewards geographical concentrations of votes in order to hold Brighton Pavilion, but it still received only one seat for the 1.1 million votes cast for the party nationally. UKIP received over 3.8 million votes nationally and yet also returned just one MP to Parliament. By comparison the Conservative party required on average just 34,000 votes per MP.
Concentration of votes is a key factor under FPTP. Parties with substantial support spread across Britain do less well in making those votes count than parties who are concentrated in particular areas.
Another factor of our broken system is the ever-decreasing percentage of support for the governing party. Since 2001, no single-party government has commanded the support of more than 40% of voters. This trend continued this year with the
ELECTOR AL REFORM SOCIET Y 11

Conservative party securing a majority, albeit slim, on just under 37% of the votes. Whilst rightfully able to form a government on the basis of seat share, a government is weaker in terms of legitimacy if it is elected by little more than a third of voters; a figure that decreases when we consider the rate of turnout. Taking turnout into account, the current government commands the support of just a quarter (24.4%) of the registered electorate.
We may have returned to single party government for this Parliament but this does not mean a return to stability
FPTP is said to deliver strong and stable single-party govern-ments. We may have returned to single party government for this Parliament but this does not mean a return to stability. Although it is early days, the government may well struggle to pass all its legis-lation with such a small majority and the Fixed Term Parliaments Act could leave it in the strange position of being unable to pass its legislative programme and yet prevented from calling another election. Coalition government attracted scepticism, but against expectation delivered stable government in 2010-2015. In the coming years, the current administration may at times look back fondly on the 78-seat majority the coalition government of the last parliament commanded.
FPTP is out of date and unfit for purpose. The system cannot cope with the choices voters are making in this multi-party era. People are choosing to vote for a wider range of parties and our electoral system should be able to reflect that in the composition of Parliament. Parties should not be penalised for reaching out and trying to build support across the country rather than just in target areas. We are becoming a more electorally diverse and complex so-ciety. It is much more sensible to change the system to reflect this, than to hope that voters go back to supporting just two parties.
THE 2015 GENER AL ELECTION REPORT12

DIVIDING THE UKWhilst the UK remains united after the Scottish independence
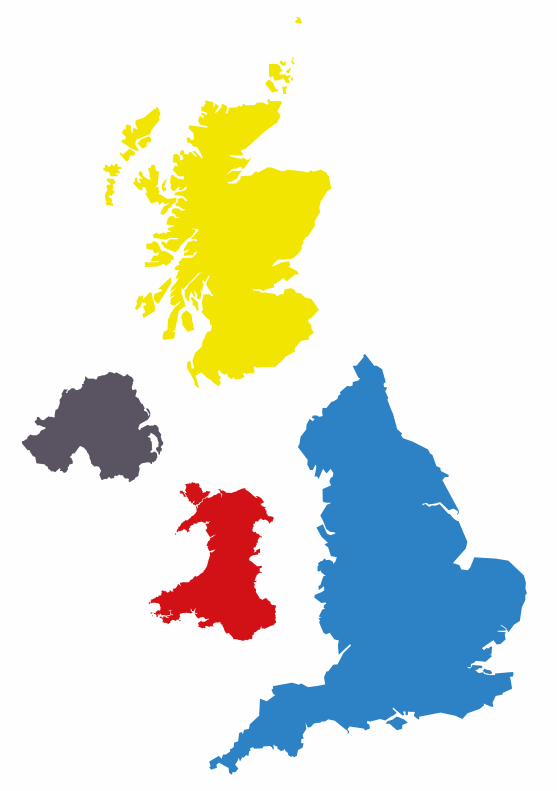
referendum, in terms of its electoral representation it is a divided nation. For the first time, the parties with the largest number of seats in each of the four nations are all different: Conservatives in England, Labour in Wales, Scottish National Party in Scotland and Democratic Unionist Party in Northern Ireland.
Within England there are also divides. In the South West of England, there is only one seat west of Bristol not held by the Conservatives1, while metropolitan areas throughout England remain dominated by Labour.
The electoral map of the UK suggests that we are a state of four separate and politically disparate nations, with each of our national parliamentary institutions now governed by different political parties. Yet the way UK citizens vote shows political pref-erences are far more diverse within nations and regions than the results suggest. FPTP is exaggerating the political differences of the different regions and nations of the UK, leaving many citizens unrepresented. Whatever the future of the Union, an electoral system that exacerbates divisions rather than reflects consensus and difference as it truly exists is unacceptable in a democracy; an electoral postcode lottery does not serve voters well.
England In England the Conservatives secured the most votes and seats. They did not, however, secure the majority of votes, achieving just 41% overall (Labour got 31.6%).
The rise in votes for smaller parties is stark in England. UKIP overtook the Liberal Democrats in vote share, gaining 14.1% of the vote. The Liberal Democrats’ vote share fell to just 8.2% (from 24.2% in England in 2010), and votes for the Green Party rose from
1 Exeter, held by Labour
2
ELECTOR AL REFORM SOCIET Y 13

1% to 4.2%. The combined total of votes for parties other than Labour, the Conservatives or Liberal Democrats in England hit an all-time high of 19.2%.
Whilst denting the two larger parties’ vote share, the support for other parties was predictably not translated into seats. Despite drawing a combined total of over 18% of votes across England, UKIP and the Green Party have now just one represen-tative each in Parliament. That’s nearly a fifth of all English votes represented by just two MPs.
TABLE OF ENGLISH RESULTS
Party Vote % Vote % Change
Seats Seats Change
Seats %
Con 41% +1.4% 319 +21 59.8%
Lab 31.6% +3.6% 206 +15 38.6%
UKIP 14.1% +10.7% 1 +1 0.2%
Lib Dem 8.2% -16% 6 -37 1.1%
Green 4.2% +2.8% 1 - 0.2%
Others 0.9% n/a n/a n/a n/a
ScotlandThe legacy of the recently held referendum on Scottish inde-
pendence played a major role in this election. With the Scotland Bill waiting in the wings for the next Parliament, English Votes for English Laws (the ‘West Lothian question’) coming back onto the political agenda and the surge in SNP support transforming the political landscape, the power of Scotland’s votes was the dominant narrative of the election campaign.
Voters in Scotland delivered a massive 30 percentage point increase in vote share to the SNP, returning 56 SNP Members of Parliament out of 59 – up nearly tenfold from their six in 2010. Yet these 56 seats were delivered on just 50% of the vote. Labour, the Conservatives and Liberal Democrats got just one representative each for the other 46.7%2. For 24.3% of the vote share, Labour returned just one Scottish MP – the same as the Liberal Democrats on 7.5%.
2 UKIP got 1.6% and the Green Party 1.3%
THE 2015 GENER AL ELECTION REPORT14


Although this appeared to be a momentous result, it is in fact quite close to the 2011 Scottish Parliament constituency vote share in which the SNP received 45.4%, Labour 31.7%, Conservatives 13.9% and 7.9% for the Liberal Democrats. Of course, because the Scottish Parliament uses a more proportional system (the Additional Member System), the share of the seats at Holyrood is more proportional than the distribution of seats at Westminster. And indeed the SNP are firmly committed to proportional repre-sentation for Westminster despite the system serving them well this time.
Scotland also delivered a much higher turnout at 71.1% (compared with 66.1% for the UK as a whole). This follows the huge upsurge in electoral registration (with a reported 97% reg-istration rate) and political engagement during the independence referendum.
TABLE OF SCOTTISH RESULTS
Party Vote % Vote % Change
Seats Seats Change
Seats %
SNP 50% +30% 56 +50 94.9%
Lab 24.3% -17.7% 1 -40 1.7%
Con 14.9% -1.8% 1 - 1.7%
Lib Dem 7.5% -11.3% 1 -10 1.7%
UKIP 1.6% +0.9% - - -
Green 1.3% +0.7% - - -
Other 0.9% n/a n/a n/a n/a
WalesGeographical concentration of votes also played out in Wales
where Labour returned 62.5% of seats on 36.9% of the vote3. The other parties shared out the remaining 37.5% of seats for their 63.1% of the vote. As in the last election, Labour received nearly two-thirds of the seats on a little over one third of the vote on May 7th.
3 This is similar to the situation in 2010 when Labour received 36.2% of the vote and 65% of seats.
ELECTOR AL REFORM SOCIET Y 17
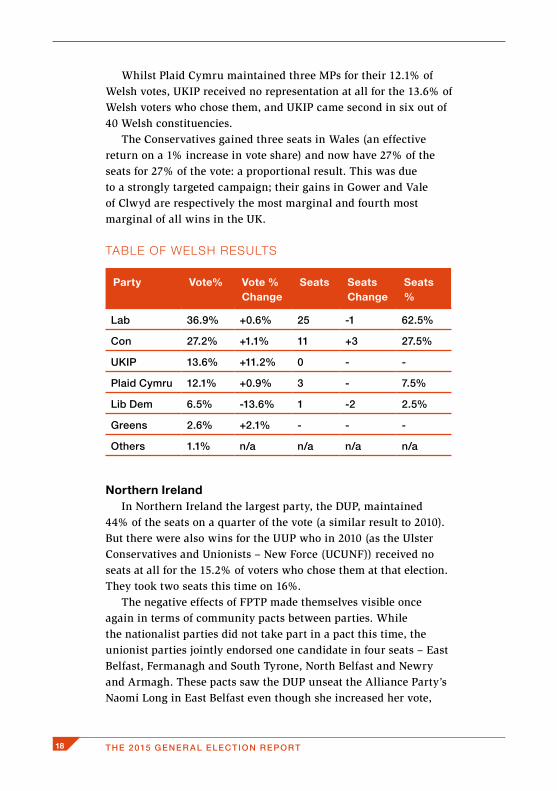
Whilst Plaid Cymru maintained three MPs for their 12.1% of Welsh votes, UKIP received no representation at all for the 13.6% of Welsh voters who chose them, and UKIP came second in six out of 40 Welsh constituencies.
The Conservatives gained three seats in Wales (an effective return on a 1% increase in vote share) and now have 27% of the seats for 27% of the vote: a proportional result. This was due to a strongly targeted campaign; their gains in Gower and Vale of Clwyd are respectively the most marginal and fourth most marginal of all wins in the UK.
TABLE OF WELSH RESULTS
Party Vote% Vote % Change
Seats Seats Change
Seats %
Lab 36.9% +0.6% 25 -1 62.5%
Con 27.2% +1.1% 11 +3 27.5%
UKIP 13.6% +11.2% 0 - -
Plaid Cymru 12.1% +0.9% 3 - 7.5%
Lib Dem 6.5% -13.6% 1 -2 2.5%
Greens 2.6% +2.1% - - -
Others 1.1% n/a n/a n/a n/a
Northern Ireland In Northern Ireland the largest party, the DUP, maintained
44% of the seats on a quarter of the vote (a similar result to 2010). But there were also wins for the UUP who in 2010 (as the Ulster Conservatives and Unionists – New Force (UCUNF)) received no seats at all for the 15.2% of voters who chose them at that election. They took two seats this time on 16%.
The negative effects of FPTP made themselves visible once again in terms of community pacts between parties. While the nationalist parties did not take part in a pact this time, the unionist parties jointly endorsed one candidate in four seats – East Belfast, Fermanagh and South Tyrone, North Belfast and Newry and Armagh. These pacts saw the DUP unseat the Alliance Party’s Naomi Long in East Belfast even though she increased her vote,
THE 2015 GENER AL ELECTION REPORT18
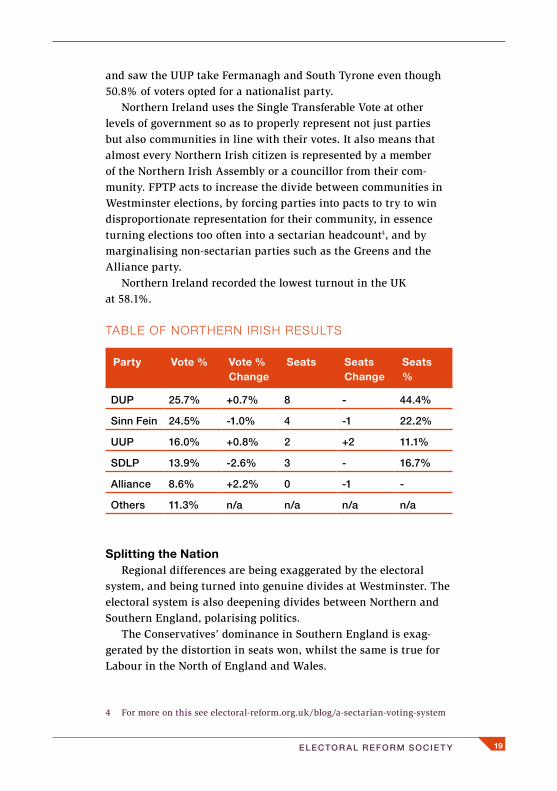
and saw the UUP take Fermanagh and South Tyrone even though 50.8% of voters opted for a nationalist party.
Northern Ireland uses the Single Transferable Vote at other levels of government so as to properly represent not just parties but also communities in line with their votes. It also means that almost every Northern Irish citizen is represented by a member of the Northern Irish Assembly or a councillor from their com-munity. FPTP acts to increase the divide between communities in Westminster elections, by forcing parties into pacts to try to win disproportionate representation for their community, in essence turning elections too often into a sectarian headcount4, and by marginalising non-sectarian parties such as the Greens and the Alliance party.
Northern Ireland recorded the lowest turnout in the UK at 58.1%.
TABLE OF NORTHERN IRISH RESULTS
Party Vote % Vote % Change
Seats Seats Change
Seats %
DUP 25.7% +0.7% 8 - 44.4%
Sinn Fein 24.5% -1.0% 4 -1 22.2%
UUP 16.0% +0.8% 2 +2 11.1%
SDLP 13.9% -2.6% 3 - 16.7%
Alliance 8.6% +2.2% 0 -1 -
Others 11.3% n/a n/a n/a n/a
Splitting the Nation Regional differences are being exaggerated by the electoral
system, and being turned into genuine divides at Westminster. The electoral system is also deepening divides between Northern and Southern England, polarising politics.
The Conservatives’ dominance in Southern England is exag-gerated by the distortion in seats won, whilst the same is true for Labour in the North of England and Wales.
4 For more on this see electoral-reform.org.uk/blog/a-sectarian-voting-system
ELECTOR AL REFORM SOCIET Y 19

Conservative support in Scotland is far weaker than in England and Wales but at 15% represents a significant level of support for centre-right politics. This has been represented by just one seat at the last two elections. By contrast, the Scottish Conservatives returned 15 MSPs in the 2011 Scottish Parliament elections (12% of the total) on 14% of the constituency and 12% of the regional vote.
Labour won just eight seats in this election (out of 139) across the South East and South West of England, despite nearly 1.3 million people casting a vote for the party in these regions. In the European elections in 2014, Labour secured a smaller percentage of the vote in these regions (15% and 14% respectively) yet won two out of the 16 available seats in the European Parliament (12%).
UKIP has made significant gains in votes across the whole of England and Wales, coming second in 120 contests. Yet realis-tically under FPTP the party only stood to gain seats, if any, on a section of the east coast of England; in the end they only won one seat.
The distortion of voter preferences under FPTP exaggerates differences and turns them into artificial divides. It is a system which works against consensus, co-operation and unity.
THE 2015 GENER AL ELECTION REPORT20
MISSING MILLIONS: THE LOST VOTES
Four weeks before Election Day, the Electoral Reform Society called the winner in 368 of the 650 Westminster seats5. Of these, all but five were predicted correctly; this in what was said to be the most unpredictable election of recent times. That so many of Westminster’s seats could be confidently known before a single voter had gone to the polls is a sad reflection of how many votes are devalued by the system. 25.7 million voters live in safe seats, unlikely to ever see their constituency change hands.
Whilst voters in marginal seats drown in a sea of party leaflets and ministerial visits, millions in safe seats are unlikely to be contacted at all by party campaigns.
Voters’ frustrations at a system which wastes their votes spilled out this year into a number of vote-swapping websites. These en-abled voters in constituencies where their preferred vote would be wasted to swap with someone in a constituency where it wouldn’t be, thus circumventing the system; a form of tactical voting for the internet age. Ingenious? Yes. Illegal? No (unless coercion or inducement is used). But should voters have to go to these lengths to have their vote count?
Nearly 3 million people planned to vote tactically in this election
ERS research suggests that over 9% of people planned to vote tactically at this election, for a second or even third-choice candidate6. On the final 66% turnout, this would represent some
5 electoral-reform.org.uk/blog/reading-tea-leaves
6 The representative poll of 1,013 adults was conducted by BMG Research
3
ELECTOR AL REFORM SOCIET Y 21

2.8 million voters. Yet the nature of this contest also made it harder to vote tactically. The more parties in contention, the harder it is to know how your tactical vote should be deployed. With party votes splintering and therefore many contests offering more than one ‘lesser evil’ choice, voting tactically at this election was a risky business.
Whether voting tactically on the ground or by vote swapping, trying to make your vote count under FPTP is difficult. Votes can be ‘wasted’ by voting for a losing candidate or in providing surplus votes to the winning candidate over and above what they need. Because FPTP is a ‘winner takes all’ system, votes for the losing candidates are not taken into account in any way – something which, when replicated nationally, leads to millions of unrepre-sented voters. FPTP also produces safe seats where large majorities mean even those voting for the winner have little effect on the actual outcome.
Nearly three-quarters of votes were wasted, representing 22 million people
At this election, nearly three-quarters of votes were wasted in this way (74.4%, compared to 71.1% in the last General Election); that’s 22 million people who voted yet had numerically no influ-ence on the outcome. Half of all votes (50% exactly) went to losing candidates, representing some 15 million people who did not see their choice reflected in the outcome. This is a similar figure to 2010, when 52.8% of votes went to losing candidates.
The fragmentation of party support has led to an increase in MPs elected on small minorities, but even in the context of a multi-party contest, seats are being won on low percentages of the vote.
The number of MPs elected on less than 40% of votes doubled between 2005 and 2010 (55 to 111). This election that trend went into reverse with only 50 candidates elected on less than 40% of the vote. Yet some 331 of 650 MPs were elected without an absolute majority. Eight MPs won on less than 35% of votes cast, and one
between the 25th and 27th of April 2015. For full crosstabs please see: bmgresearch.co.uk/wp-content/uploads/2015/04/electoral_reform_society_general_election_poll.pdf
THE 2015 GENER AL ELECTION REPORT22

broke the record for the lowest winning share of the vote in UK electoral history, with 24.5%7.
One MP broke the record for the lowest winning share of the vote in UK electoral history - 24.5%
For the previous three elections, no MP has achieved the support of 50% of the total electorate in their constituency. This changed this year, with three MPs getting the support of over 50% of the electorate (Knowsley, Liverpool Walton and Liverpool West Derby). 191 MPs however were elected with the support of less than 30% of their whole electorate.
The increase in support for other parties, and the proliferation of three-way marginals in recent elections means that under FPTP MPs will be elected on a smaller and smaller share of the vote. The majority of votes will be wasted. Clearly this is unacceptable in a democracy. We need a system where everyone’s vote can count, and which ensures MPs are returned to Parliament with the backing of their constituents.
7 Dr Alasdair McDonnell, South Belfast, SDLP
ELECTOR AL REFORM SOCIET Y 23
THE ALTERNATIVESThe Electoral Reform Society has projected the results of the
2015 election under the Single Transferable Vote (our preferred system), Party List Proportional Representation (List PR) and the Alternative Vote (AV)8.
The Single Transferable Vote (STV), is a form of proportional representation which uses preferential voting in multi-member constituencies of typically three to five seats. Each voter has one vote, which can transfer from their first preference to their second preference and so on. If a voter’s preferred candidate has no chance of being elected or has enough votes already, their vote is trans-ferred to another candidate in accordance with their instructions. STV ensures that very few votes are wasted, unlike other systems, especially First Past the Post, where only a small number of votes actually contribute to the result. STV is used in Ireland, Malta, for the Australian Senate, for Scottish local government and for all elections in Northern Ireland besides those for Westminster.
STV provides the voter with the highest degree of power, allow-ing them to rank their choices both within and between parties (a voter could, for instance, first-preference a candidate from Party A, second-preference a candidate from Party B, and third-prefer-ence a candidate from Party C). It also produces a broadly propor-tional result and tends to result in a strong constituency link with a significant increase in the proportion of people who supported a winning candidate.
List PR is the system used for European Parliament elections in the UK, and in countries such as Belgium, Brazil, and Spain and for the list portions of the votes in the Scottish Parliament, and the London and Welsh Assemblies.
Such a system relies on voting for party lists, with seats
8 Full details of the methodology for these projections and regional seat shares can be found in the Appendix
4
ELECTOR AL REFORM SOCIET Y 25
assigned broadly proportionally to parties on the basis of their vote. This system tends to produce highly proportional results, but although there are variants (e.g. ‘open-list’) which allow voters to opt for candidates over parties, this system is usually thought to damage the link between MPs and constituents.
The Alternative Vote (AV) system was put to a nationwide referendum in 2011. AV is not a proportional electoral system, but rather a majoritarian system like FPTP based upon ranked choices in single-member constituencies. Under AV voters rank their pre-ferred candidates 1, 2, 3 and so on. If a candidate wins more than 50% of first preferences they are elected, but if not then the worst performing candidate is eliminated and their votes redistributed to the second-choice candidates. This process carries on until a candidate receives more than 50% of the vote. Australia is the best known example of AV in current use.
The ERS supported the AV referendum in 2011 on the basis that the system is an improvement on FPTP. However, whilst this system helps reduce inequities in the system (by, for instance, making sure that MPs have more than 50% of their voters’ support and hence a much broader base in the constituency), AV is not a proportional system and can, in fact, produce even more dispropor-tionate outcomes than FPTP. Indeed, in this case our projections show the Conservative Party’s majority under AV would have doubled from 12 to 24.
Other electoral systems do, of course, exist. The Scottish, Welsh and London devolved institutions use the Additional Member System, where part of the legislature is elected using FPTP and part using lists to ‘top-up’ and achieve proportionality. Results under this system were not projected. AMS can produce different outcomes depending on the proportion of FPTP seats to PR seats; the more FPTP seats, the less proportional the outcome. Broadly speaking, a system with a 50/50 ratio of FPTP MPs to those elected from the list would be likely to produce similar results to our list-PR projections.
The AV+ system recommended by the Jenkins Commission9 in 2001 was also not projected on the basis that it is not used in any country and is no longer being advocated in any meaningful way.
9 http://researchbriefings.files.parliament.uk/documents/RP98-112/RP98-112.pdf
THE 2015 GENER AL ELECTION REPORT26

SEATS IN ALTERNATIVE PARLIAMENTS10
Party FPTP Seats
List PR Seats
AV Seats STV Seats
Con 331 242 337 276
Lab 232 208 227 236
Lib Dem 8 47 9 26
UKIP 1 80 1 54
Greens 1 20 1 3
SNP 56 30 54 34
Plaid Cymru 3 5 3 3
List PR produces the most proportional result, but as mentioned above, puts power in the hands of parties and distances MPs from voters. For example, in this projection, the South East of England is one large constituency electing 84 MPs. Smaller constituencies could be used, localising the result, but this would lead to a less proportional result. An Alternative Member System, incorporating aspects of this system and combining it with FPTP, could alleviate some of these problems, but equally it could also incorporate the negative aspects of both these systems.
% OF SEATS IN ALTERNATIVE PARLIAMENTS
Party Vote % FPTP Seat %
List PR Seats %
AV Seats %
STV Seats %
Con 36.9% 50.9% 37.2% 51.8% 42.5%
Lab 30.4% 35.7% 32% 34.9% 36.3%
UKIP 12.9% 0.2% 12.3% 0.2% 8.3%
Lib Dem 7.9% 1.2% 7.2% 1.3% 4%
SNP 4.7% 8.6% 4.6% 8.3% 5.2%
Greens 3.8% 0.2% 3.1% 0.2% 0.5%
Plaid Cymru
0.6% 0.5% 0.8% 0.5% 0.5%
10 Note: we do not have data for Northern Ireland
ELECTOR AL REFORM SOCIET Y 27
As previously mentioned, AV is not a proportional system. Our projection shows an even more disproportional result under AV than under FPTP. In the vast majority of constituencies the result of the election does not change. The ERS’s 2010 election report11 showed a much starker difference between FPTP and AV, however in this case preferences from smaller parties balance each other out, with preferences from UKIP primarily (but not overwhelming-ly) flowing towards the Conservatives, Green preferences flowing much more strongly towards Labour and Lib Dem votes more split.
In all, however, most results remain unchanged in our AV pro-jection, with only 10 seats changing hands. These were Cambridge (Liberal Democrat rather than Labour), Bath (Liberal Democrat rather than Conservative), East Renfrewshire (Labour rather than SNP), Berwickshire, Roxburgh and Selkirk (Conservative rather than SNP), Southport (Labour rather than Liberal Democrat), Ilford North, Coventry North East, Walsall North, Wolverhampton South West, and Dewsbury (all of which would have elected Conservative rather than Labour candidates under the Alternative Vote system).
However it is worth remembering that each individual MP has a far wider mandate under AV, and there are positive effects on campaigning that stem from candidates seeking the second or third preferences of voters. AV also removes the need to vote tactically as a vote cannot be ‘split’.
Our STV projection shows a result that is much more pro-portional than the majoritarian systems of AV and FPTP. As the projection is based on constituencies of typically three to five MPs there is also a high degree of local representation in the system. Larger constituencies would result in an even more proportional result.
It is also worth remembering the additional power that STV gives voters by allowing them to demonstrate preference within and across their preferred party or parties. STV would allow voters to register their political views in a way that truly reflects an increasingly sophisticated electorate; people demand ever more choice in who represents them, they like politics to be local and they are increasingly inattentive of party labels.
11 electoral-reform.org.uk/sites/default/files/publication/file/file4e3ff1393b87a.pdf
THE 2015 GENER AL ELECTION REPORT28

PARTY VOTES PER REGION
Region/Nation
Con Lab Lib Dem
UKIP Green SNP Plaid Cymru
East of England
49% 22% 8.2% 16.2% 3.9%
East Midlands 43.4% 31.6% 5.6% 15.8% 3%
London 34.9% 43.7% 7.7% 8.1% 4.9%
North East 25.3% 46.9% 6.5% 16.7% 0
North West 31.2% 44.6% 6.5% 13.6% 3.2%
Scotland 14.9% 24.3% 7.5% 1.6% 1.3% 50%
South East 50.8% 18.3% 9.4% 14.7% 5.2%
South West 46.5% 17.7% 15.1% 13.6% 5.9%
Wales 27.2% 36.9% 6.5% 13.6% 2.6% 12.1%
West Midlands 41.8% 32.9% 5.5% 15.7% 3.3%
Yorkshire and Humber
32.6% 39.1% 7.1% 16% 0
Whilst AV would have reduced the disproportionality in Scotland, by giving Labour and the Conservatives an additional seat each, in the West Midlands it would have made the result more disproportionate by giving more seats to the Conservatives. Overall, however, AV would have changed the regional results little, in keeping with its effect on the national picture12.
As shown by the spread of support above, proportional systems such as STV would have greatly reduced the artificial regional differences in the UK that are exaggerated by First Past the Post. From 8 seats in the South East and South West, Labour would have won 31 under STV whilst the Conservatives would have gone from 1 to 8 seats in Scotland.
Of these systems, only STV delivers a much more proportional and less divisive result, whilst retaining the strong link between the electorate and their representatives. Having proven its success in Scotland and Northern Ireland, it’s now time for STV to take its place in Westminster.
12 See appendix for full regional breakdowns of seats won under each system
ELECTOR AL REFORM SOCIET Y 29


CONCLUSIONIn 2015 voters went to the polls in the most unusual election in
post-war years not knowing which of the parties were likely to play a part in the next government. This was at the outset projected to be the most unpredictable election in British politics in living mem-ory; the resulting outcome also made it the most disproportional.
With millions of voters casting their ballot for a party that was not their first choice, over half of all MPs elected without a majority, millions of votes wasted and the outcome of over half of all contests effectively known before voters even went to the polls, this election result reflected an electoral system in crisis.
This was an election for multi-party politics, with seven party leaders going head to head in pre-election debates and a quarter of votes cast for parties other than the three formerly largest parties. But this fragmentation of support came up against a voting system that was made for a different era; one where just two parties fought over the votes. The result? A distribution of parliamentary seats that bears little relationship to the votes cast at the ballot box.
Yet in spite of a system designed for a bygone age which marginalises their choices, the majority of voters still went to the polls – even if many were holding their noses and some knew their vote would not count. The public might be increasingly disillu-sioned, disappointed and disgruntled with formal party politics, but they still believe in democracy and they deserve a system that represents them.
First Past the Post has once again delivered a result where seats fail to match votes. It is a system failing to cope with the choices citizens make. Voting should not be about holding your nose to vote tactically, nor should it be a foregone conclusion in over half of all constituencies.
As we’ve also seen, our voting system throws up artificial divides in the UK which make the different nations appear far
ELECTOR AL REFORM SOCIET Y 31
more politically opposed to each other than they really are. This is clearly an unsustainable situation.
The answer is clear: our voting system needs to change so that people can vote for what they believe in, knowing that their vote will count and that they will see their choices reflected in Parliament. We’ve laid out both the problems and the solutions in this report. Let’s now make sure that the next election doesn’t yet again break the record for the most disproportionate result in British electoral history.
THE 2015 GENER AL ELECTION REPORT32

APPENDIXThe Electoral Reform Society commissioned a post-election
survey from YouGov, which ran from the 8th to the 12th of May 2015. The question was:
“Please imagine that the voting system used for General Election in the United Kingdom asked you to rank the candidates in the order that you wanted to vote for them.
Please indicate how you would have voted in the General Election on Thursday 7th May, if you had been asked to rank the parties in your order of preference. Put 1 for your most preferred party, then 2 for your second party, 3 for your third choice etc. You may rank as many or as few choices as you wish. If you would not vote, or do not know how you would vote, tick the boxes below.”
The sample size returned was 40,000, allowing for high-quality and accurate analysis of regional data. As the data for our YouGov poll covered Great Britain only, our projections under alternative voting system only look at potential results in Great Britain, hence the lack of data on Northern Ireland. While we could have provid-ed breakdowns for Northern Ireland (under pure percentage of the vote terms or a D’Hondt system), we felt it was best to maintain consistency.
AV methodologyFor the Alternative Vote we used the same 650 constituencies
used in current FPTP elections.This YouGov data was combined with results in individual
constituencies to find the result under AV. In any seat where more than half the votes are won by one candidate, that candidate is deemed elected.
In other seats, parties were eliminated in reverse vote order and votes were reallocated from parties on the basis of preferences, so that, for instance, if Party A were eliminated and 58% of Party
ELECTOR AL REFORM SOCIET Y 33

A voters in our poll stated they second-preferenced Party B then a number of votes equivalent to 58% of Party A votes in that constituency would be added to the Party B total.
This process was repeated until one party reached 50% of the votes. That party would then be deemed the AV winner.
Third preferences were also taken into account, and analysis was done on a regional and national basis meaning that the SNP and Plaid Cymru were fully accounted for when reallocating votes in Scotland and Wales.
SEATS UNDER AV BY REGION
Region/Nation Con Lab Lib Dem
UKIP Green SNP Plaid Cymru
East of England 52 3 2 1 0
East Midlands 32 14 0 0 0
London 28 44 1 0 0
North East 3 26 0 0 0
North West 23 51 1 0 0
Scotland 2 2 1 0 0 54
South East 79 4 0 0 1
South West 50 4 1 0 0
Wales 11 25 1 0 0 3
West Midlands 37 22 0 0 0
Yorkshire and Humber
20 32 2 0 0
STV MethodologyThe STV methodology is broadly similar to that used for AV
above. Model STV constituencies were created from amalgamating constituencies into multi-member constituencies of between 2 and 5 seats (with exceptions for the Scottish island seats of Orkney and Shetland and Na h-Eileanan an Iar (the Western Isles), who remained as single seat constituencies). STV constituencies were drawn up to reflect local communities as much as possible. These seats were drawn up by Lewis Baston, political analyst and
THE 2015 GENER AL ELECTION REPORT34

former ERS Research Director in 2010, but as there have been no Westminster boundary changes since 2010 it was felt that these hypothetical STV constituencies remained current.
Results from the constituencies in question were also amalgam-ated so that if three seats were combined into an STV constituency, the votes for that party would be added together. For example, if Party A received 5,000 votes in FPTP Constituency 1, 10,000 in FPTP Constituency 2 and 7,000 in FPTP Constituency 3, hypotheti-cal STV Constituency A would therefore have 22,000 votes cast for Party A.
STV relies on a quota. As in most real life cases the quota used in our hypothetical example was the ‘droop quota’. This means that to win a seat a candidate must receive a vote equivalent to the number of votes divided by the number of seats plus one. So, for instance, in a three seat constituency, 25% of the votes would elect a candidate. In a four seat constituency this figure would, correspondingly, be 20%.
For the purposes of our projection we assumed that party prefer-ences would typically flow to one another and that in most cases, if they did not, they would balance out across the country.
For that reason seats were awarded on the basis of how many total quotas of support (e.g. combinations of 25%) a party won. So, a party winning 50% of the vote in a three member constituency would win two seats.
ELECTOR AL REFORM SOCIET Y 35

SEATS UNDER STV BY REGION
Region Con Lab Lib Dem
UKIP Green SNP Plaid Cymru
East of England 33 18 2 5 0
East Midlands 22 15 0 9 0
London 31 37 2 2 1
North East 9 16 0 3 0
North West 29 39 2 5 0
Scotland 8 14 3 0 0 34
South East 53 20 4 6 1
South West 32 11 8 3 1
Wales 13 17 2 5 0 3
West Midlands 30 22 1 6 0
Yorkshire and Humber
16 27 2 10 0
List PR MethodologyThis system is similar to the system used to elect Britain’s
members of the European Parliament. The regions and nations of the UK were treated as large multi-member constituencies with a number of seats equivalent to the number of FPTP constitu-encies they have. So London, with 73 seats, would be a large 73 seat constituency.
Votes were added up across these constituencies and seats assigned on the basis of the d’Hondt formula, the basis for most forms of list PR voting. The formula gives the party with the most votes a seat in rounds, with a party’s votes divided by the number of seats it has won plus one. These rounds continue until all seats in the constituency have been assigned.
This produces a broadly proportional result, though d’Hondt is known to slightly favour larger parties.
Results under AMS/MMP systems are likely to be highly similar, depending on the details of the system.
THE 2015 GENER AL ELECTION REPORT36

SEATS UNDER PARTY LIST BY REGION
Region Con Lab Lib Dem
UKIP Green SNP Plaid Cymru
East of England 29 13 5 9 2
East Midlands 21 15 2 7 1
London 26 33 5 6 3
North East 7 14 1 5 1
North West 24 34 5 10 2
Scotland 9 15 4 1 0 30
South East 45 15 8 12 4
South West 27 10 8 7 3
Wales 11 16 2 5 1 5
West Midlands 23 19 3 9 1
Yorkshire and Humber
20 24 4 9 2
SEATS UNDER FIRST PAST THE POST BY REGION
Region/Nation Con Lab Lib Dem
UKIP Green SNP Plaid Cymru
East of England 52 4 1 1 0
East Midlands 32 14 0 0 0
London 27 45 1 0 0
North East 3 26 0 0 0
North West 22 51 2 0 0
Scotland 1 1 1 0 0 56
South East 79 4 0 0 1
South West 51 4 0 0 0
Wales 11 25 1 0 0 3
West Midlands 34 25 0 0
Yorkshire and Humber
19 33 2 0 0
ELECTOR AL REFORM SOCIET Y 37
The most disproportionate resultA well-established political science measure of disproportion-
ality is DV (Deviation from Voting) score. This gives a percentage of seats in parliament which are ‘unearned’ in proportional terms. A typical proportional system will give a DV Score of 5-8. In the case of the 2015 general election the DV Score was 24.2. This beats the prior post-war record of 23.0 in 1983. The DV Score in 2010 was 21.8.
The methodology to calculate a DV Score is simply to add up the sum of the differences between vote share and seat share for each party, and then divide by two. Some historic DV Scores are available at democracy-uk-2012.democraticauditarchive.com/the-electoral-system
Acknowledgments Thanks to Will Brett, Doug Cowan, Josiah Mortimer, Juliet
Swann and Owain Llyr ap Gareth for their contributions to the report.
THE 2015 GENER AL ELECTION REPORT38


The Electoral Reform Society2-6 Boundary RowLondonSE1 8HPUnited Kingdom
Email: [email protected]: 020 3714 4070Facebook: electoralreformsocietyTwitter: @electoralreform
www.electoral-reform.org.uk